Evaluation of Environmental and Ecological Impacts of the Leading Large-Scale Reservoir on the Upper Reaches of the Yellow River


1
State Key Laboratory of Hydroscience & Engineering, Tsinghua University, Beijing 100084, China
2
College of Water Resources & Civil Engineering, China Agricultural University, Beijing 100083, China
*
Author to whom correspondence should be addressed.
Sustainability 2019, 11(14), 3818; https://doi.org/10.3390/su11143818
Submission received: 10 June 2019
/
Accepted: 8 July 2019
/
Published: 12 July 2019
(This article belongs to the Special Issue Large-scale Water Projects, Socio-economic Development, and Environmental Sustainability)
Abstract
:Large-scale reservoirs have played a significant role in meeting various water demands and socio-economic development, while they also lead to undeniable impacts on the environment and ecology. The Longyangxia reservoir located on the Yellow River is the first large-scale reservoir on the upper Yellow River with a control area of 18% of the entire Yellow River Basin. Since it was put into operation in 1987, it has made great contributions to the national economy for over 30 years. In this study, the socio-economic benefits of the Longyangxia reservoir in power generation, water supply, flood control, and ice prevention are investigated. More importantly, its impacts on the ecology and environment are also presented and analyzed, such as the impacts on river morphology, flow regimes, peak flow, fish, phytoplankton, and zooplankton. It can be concluded that the construction of the Longyangxia reservoir contributes greatly to socio-economic benefits, the water area nearby has formed a new ecological environment, and the trophic level of the aquatic environment has probably increased.
1. Introduction
Construction and operation of large-scale reservoirs capable of controlling certain areas of river basins can resolve contradictions in spatial and temporal distributions of water resources with the functions of flood control, power generation, irrigation, water supply, and navigation. However, altering the distribution of water resources results in changes to the hydrological characteristics of lower reaches [1,2,3] and, thus, directly or indirectly affects the ecological environment. Studies [4] have shown that dams have been the main cause of nearly 20% of extinctions, threats, or endangerment of 9000 identifiable freshwater fishes worldwide in the past century. Fish, including juvenile fish, are injured and killed by the impacts of high-pressure and high-speed water flow through spillways and turbines [5]. Semimigratory fish cannot reach spawning areas because of the dams [6,7]. Zhong et al. [8] reported that the cascading development of the Nujiang River in China would artificially impose fragmentation of the connected river ecosystem, leading to significant cumulative effects on water quality and sediment. Petts [9] classified the reservoir impacts on river ecosystems into different levels.
Many studies have been carried out on the ecological impacts of water conservancy and hydropower projects. Burris [10] and Cooper [11] sampled 30 environmental assessment activities from 1980 to 1992. In February 1999, the Cumulative Effects Assessment Working Group enacted the Cumulative Effects Assessment Practitioners Guide, which prescribes the procedures, evaluation methods, and some application examples of cumulative environmental impact assessments [12]. Tharme studied the ecological impact and feasibility of spring drainage on the Volga River and found that the spring flood of natural rivers had a significant impact on fish spawning and irrigation downstream [13]. Many scholars point out that the natural runoff pattern of rivers is the key factor to ensure the ecological integrity and diversity of rivers [14,15].
Generally, studies of reservoir impacts on ecological environments focus on evaluation methods [16,17] or specific aspects [18,19] of the impact of reservoirs on the ecological environment, while seldom publications discuss the overall ecological environmental impact of a specific reservoir project in detail, especially for large reservoirs that have impacts on a river basin scale.
The Yellow River is the fifth longest river in the world, originating from the northern foot of the Bayan Hara Mountains on the Qinghai–Tibet Plateau, with a length of about 5464 km and a watershed area of 795,000 km2 [20].
For a long time, the Yellow River has long been recognized as one of the rivers hardest to control in the world. Its peculiar topographic features, uncoordinated water–sediment relationship, and frequent flood disasters make river management more complex and dynamic than other rivers in the world.
The Longyangxia reservoir is located on the upper reaches of the main Yellow River, which is the first large-scale reservoir of the planned cascade on the upper Yellow River, with a control area of 131,400 km2, accounting for 18% of the whole Yellow River Basin. The first hydropower unit was put into operation in October 1987 and it has since made great contributions to the national economy on the upper reaches of the Yellow River, and even the whole Yellow River basin, with its good multiyear regulation performance. In this study, after an overview of the socio-economic benefit of the Longyangxia reservoir in power generation, water supply, flood control, and ice prevention, the impact of the past 30 years of operation on the ecological environment are investigated by taking river morphology, flow regimes, peak flow, fish, phytoplankton, and zooplankton as indicators.
2. Case Study Description
2.1. Overview
The Yellow River Basin is located in the arid and semiarid areas of northern China, with scarce precipitation and intense evaporation. However, its watershed is vast and important for the national economy. The Yellow River flows through nine provinces in China, and it is the largest water supply source in Northwest and North China. Comprising only 2% of the surface runoff of the country, it undertakes water supply tasks for 15% of the national cultivated land and 12% of the national population. The contradiction between supply and demand of water resources is prominent. In addition, spatial and temporal distributions of water resources in the Yellow River Basin are uneven, and the water demand is not completely consistent with the water supply capacity of the river. Therefore, key, large-scale reservoirs on the main stream of the Yellow River play an important regulatory role. In addition, the upper reaches of the Yellow River are rich in natural resources. Most of the upper reaches are located in mountain and ravine regions with large drops and abundant hydraulic resources. Solar radiation, wind, and other resources are also abundant. Clean energy has gradually become the main component of the power grid in the upper reaches of the Yellow River. Strategic transformation of the rich natural resources guarantees the supply of energy and food, and the ecology relies greatly on the water resources of the upper reaches of the Yellow River.
The cascading reservoirs on the upper reaches of the Yellow River are water conservancy projects that have the most comprehensive utilization tasks and the widest coverage area in China. They are responsible for the functions of power supply, irrigation, flood control, and ice prevention. Another important function is to ensure a continuous and sufficient ecological flow for the lower reaches of the Yellow River.
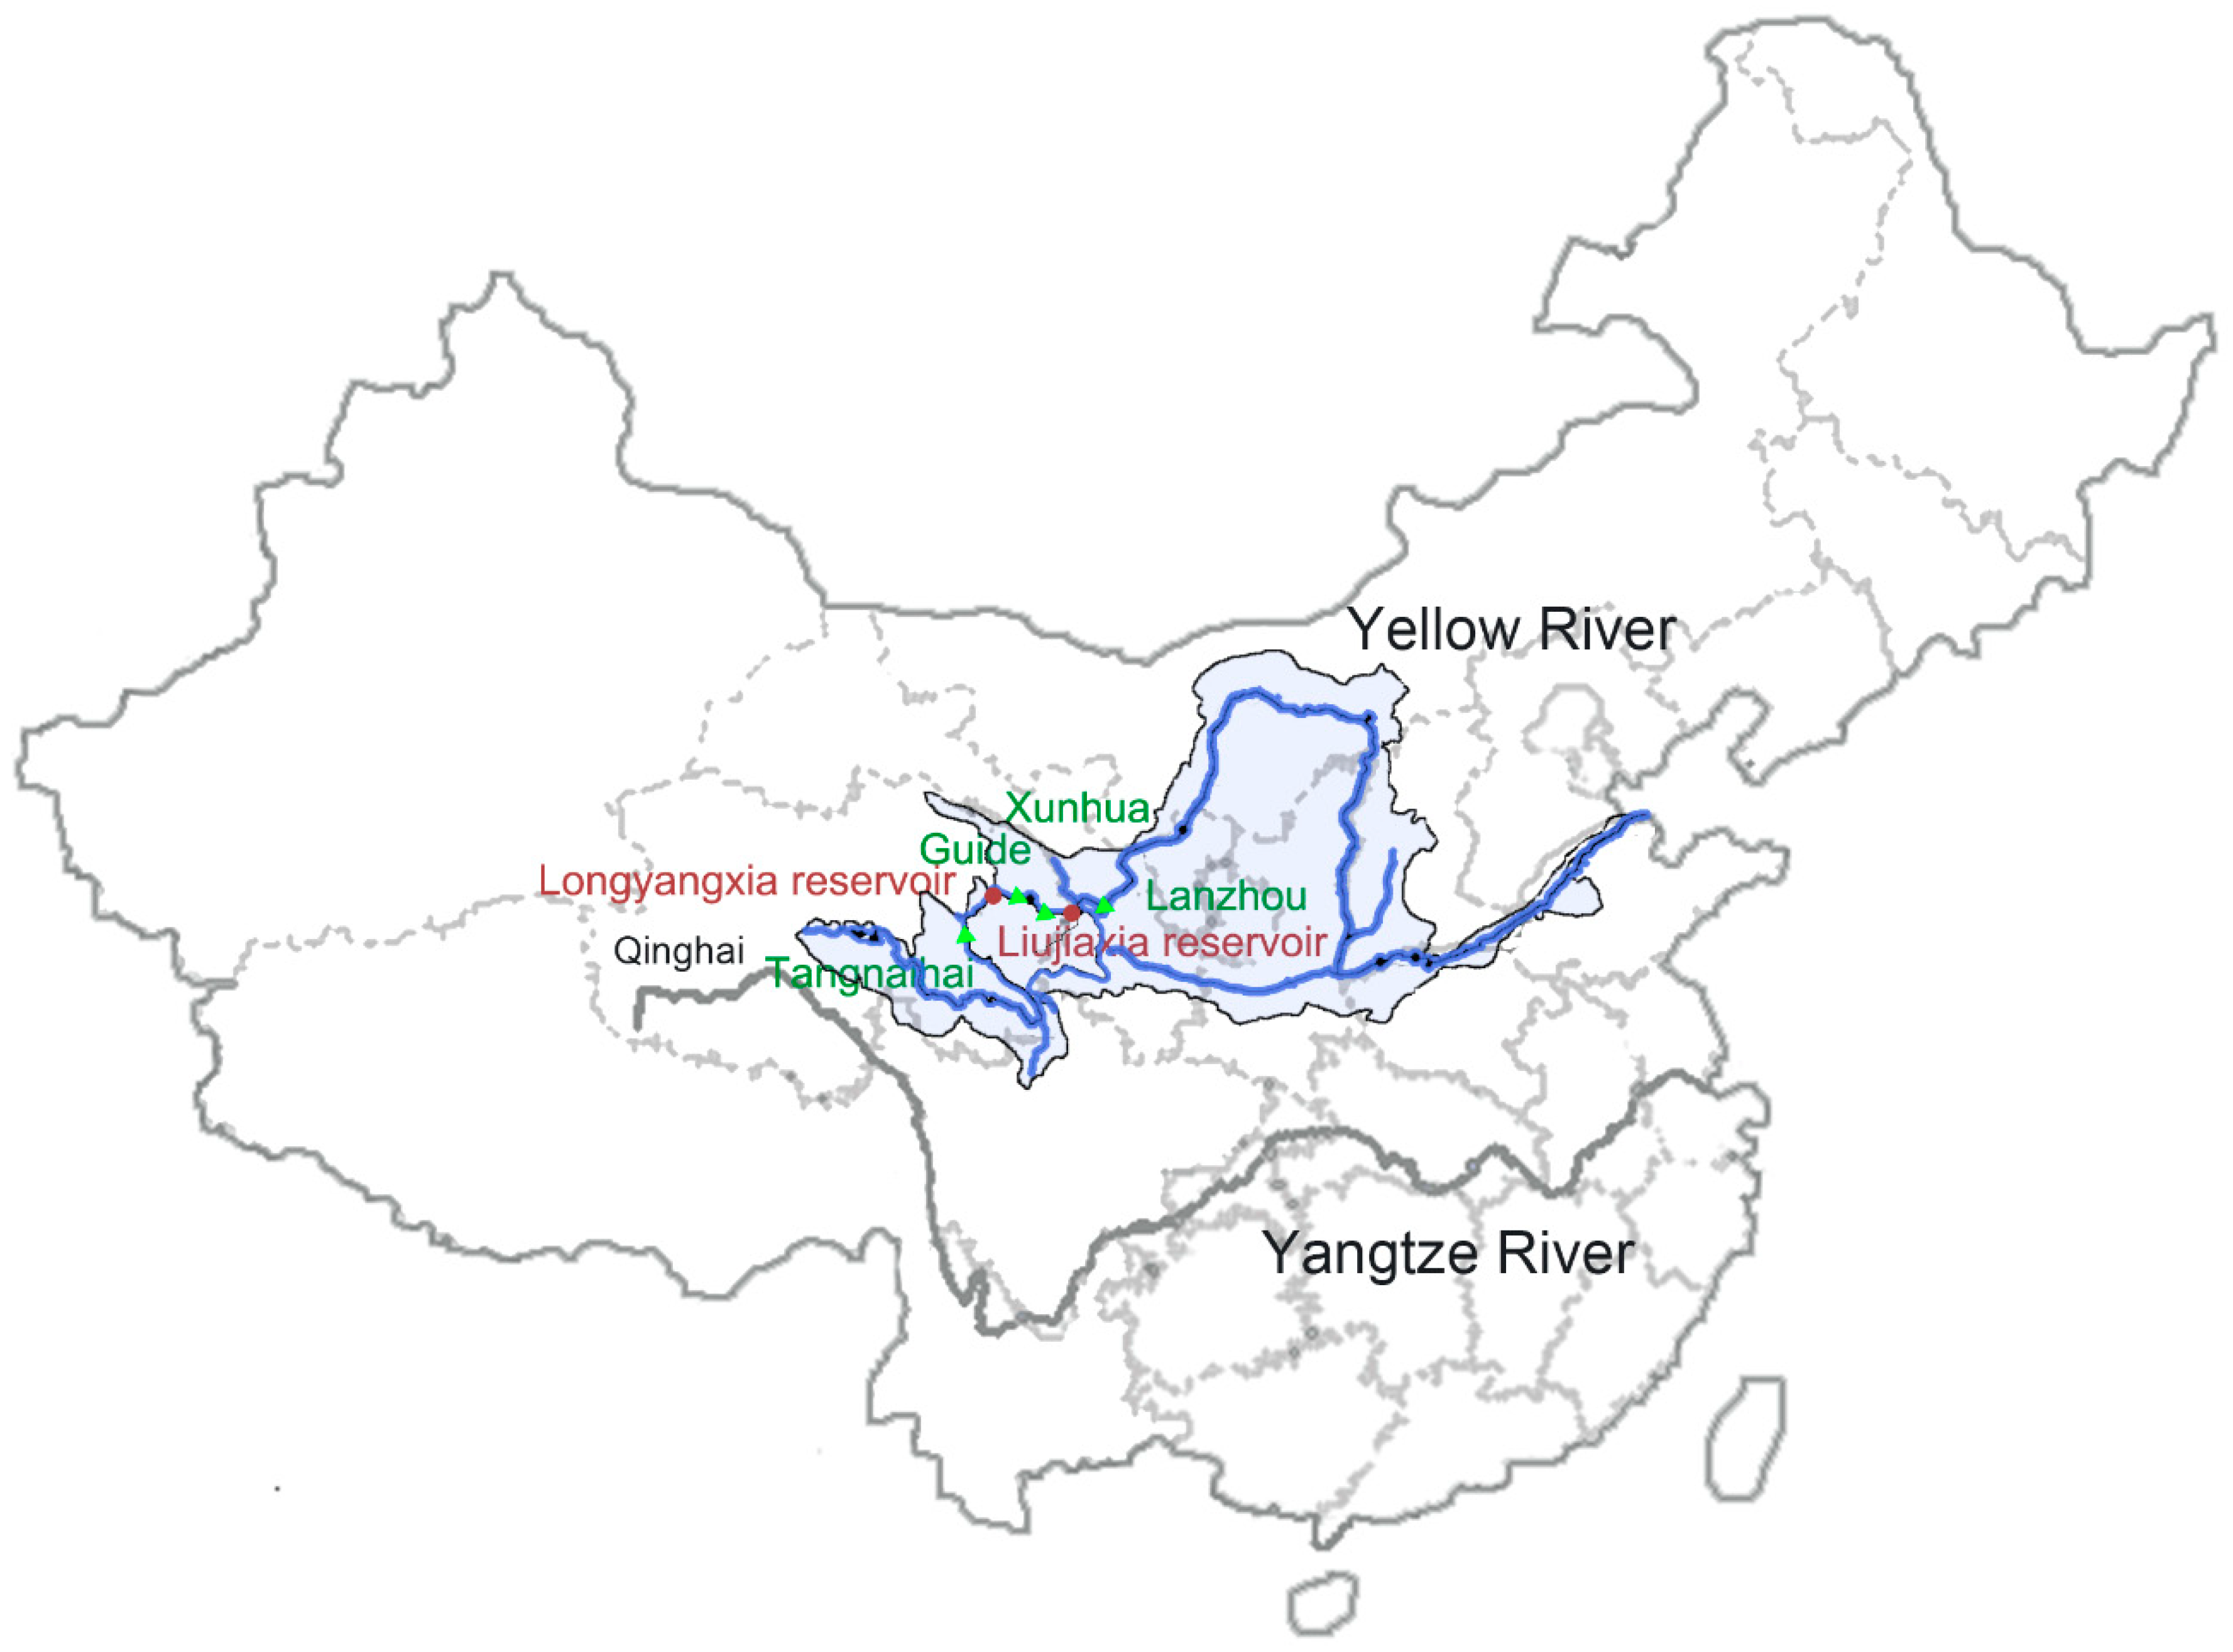
The main regulating reservoirs on the upper reaches of the Yellow River are Longyangxia and Liujiaxia reservoirs. The total regulating capacity of these two reservoirs is as high as 22.9 × 10⁹ m3, accounting for 97.6% of the total regulating capacity of the cascading reservoirs on the upper Yellow River, as shown in Figure 1.
As a cascade-leading reservoir, the Longyangxia project controls the spatial and temporal distribution of water in the whole Yellow River basin with a total reservoir capacity of 27.4 × 10⁹ m3 and a regulating capacity of 19.4 × 10⁹ m3. The Liujiaxia reservoir, about 420 km downstream, plays a counter-regulatory role for the Longyangxia reservoir and has an incomplete annual regulating capacity. The function of the Longyangxia project is mainly power generation with other comprehensive benefits such as flood control, irrigation, ice prevention, aquaculture, and tourism. Construction of the Longyangxia reservoir started in July 1978. The first hydropower unit was put into operation in September 1987, and the project was completed in 1992. The control area of the Longyangxia Reservoir is about 131,400 km2, accounting for 18% of the entire Yellow River Basin. After regulation of the Longyangxia reservoir, the flood peak can be controlled within 4000~6000 m3/s. There are four hydropower units installed with a total capacity of 1280 MW, a guaranteed output of 589.8 MW, and an annual power generation of about 5.94 × 10⁹ kW·h.
2.2. Social and Economic Benefits
The Longyangxia project has produced remarkable social and economic benefits, mainly including:
• Flood control and ice prevention
Since the operation of the Longyangxia and Liujiaxia reservoirs, floods in the upper reaches of the Yellow River have been effectively controlled. The peak flow of the once-in-a-century flood at Lanzhou Station has been reduced from 8080 (in the past) to 6500 m3/s. In recent years, inflow from upstream of the Yellow River has dropped during the flood season, and the major hazards caused by floods have been relatively reduced.
Because of the special topographic and temperature conditions in the upper reaches of the Yellow River, the Ningxia–Mongolia reach freezes from downstream to upstream in winter, and unfreezes from upstream to downstream in spring. The nonfluency of the river leads to congestion of the river channel with frequent ice flood disasters. Sometimes the threat of ice floods in winter is even greater than that of floods in summer. According to statistics, in the 60 years from 1951 to 2010, ice flood disasters occurred in 31 years in the Ningxia–Mongolia reach. Through the joint operation of the Longyangxia and Liujiaxia reservoirs, discharge has been reasonably controlled during the winter, reducing the risk of ice-blown flow in the river as well as channel flooding. Ice disasters downstream have significantly improved. The frequency of violent ice cover breakups has reduced significantly, while the frequency of tranquil ice break-ups has increased instead.
• Water supply and compensation
In recent years, the inflow of the Yellow River has maintained a low level, and the water use of the lower reaches has been excessive, which has intensified the contradiction between the water supply and water demand of the Yellow River. In the 1990s, cutoffs in the lower reaches of the Yellow River appeared over many years. Therefore, in 1998, the State Council authorized the Yellow River Water Conservancy Commission to carry out the unified regulation of water quantity in the Yellow River.
The “Regulations on Water Dispatching of the Yellow River” promulgated by the State Council in 2006 determines that unified regulation of the Yellow River follows the principles of controlling both total water recourse and cross sectional flow. It is stated that water dispatch of the Yellow River should first meet the needs of urban and rural residents for domestic water use and rationally arrange water use for agriculture, industry, and ecological environments to prevent the Yellow River from being cut off. The regulation also clearly states that reservoir management, including the Longyangxia and Liujiaxia projects, must implement the principle of “power generation yields to water dispatching” and discharge according to the dispatching commands.
Since 1992, long-distance water dispatching from upstream cascade reservoirs to provinces downstream such, as Henan and Shandong, has been implemented five times. Although the power generation benefits have been sacrificed, the drought in the middle and lower reaches of the Yellow River was quickly and effectively alleviated with great economic and social benefits. For the Longyangxia reservoir, since the impoundment of the Longyangxia Reservoir in 1986, inflow has been relatively small, and it has been difficult to reach the normal water level. In May of 2003, to relieve cutoff in the Shandong section of the lower reaches of the Yellow River, the Longyangxia reservoir almost fell to the dead water level to increase the discharge.
The “Comprehensive Planning of the Yellow River Basin (2011–2030)” states that the Longyangxia and Liujiaxia reservoirs jointly regulate multiyear water resources of the Yellow River, and they store water in wet years and wet seasons with a maximum annual water storage of 12.2 × 10⁹ m3. The maximum annual water supply of these two reservoirs is 5.6 × 10⁹ m3, which increases the water supply capacity of the Yellow River in dry years and improves the guaranteed rate of water supply for industry and agriculture as well as the firm power of the cascade hydropower stations.
• Power generation
The installed capacity of hydropower in the Qinghai power grid accounts for about 80% of its total installed capacity. The electrical load of Qinghai Province is high in winter and low in summer. However, from November to March in winter, due to the restriction of ice prevention requirements, discharge of the Longyangxia and Liujiaxia reservoirs is limited, and there is insufficient hydropower generation. There is a serious shortage of electricity supply in winter in Qinghai Province. The key to maintain social stability and sustainable development of Qinghai Province is to take better use of hydropower to alleviate the power shortage in winter.
Up to the end of 2015, the Longyangxia project had generated 131 × 109 kW·h in total with an average annual generation of 4.52 × 10⁹ kW·h. The main reason for not reaching the designed generation lies in the continuous low water levels in the initial operation stage. In addition to its own power generation, the Longyangxia project also raises the power generation efficiency of the Liujiaxia station downstream. The average operating water level of the Liujiaxia reservoir rose from 1720.4 m (before the Longyangxia reservoir) to 1725.2 m. With the operation of the Longyangxia reservoir, the water consumption rate of power generation of the Liujiaxia reservoir decreased gradually from 4.50 to 4.16 m3/(kW·h). Since 2005, it has further decreased to 4.02 m3/(kW·h). By lifting the water head, the Liujiaxia reservoir has generated about 11 × 109 kW·h of power.
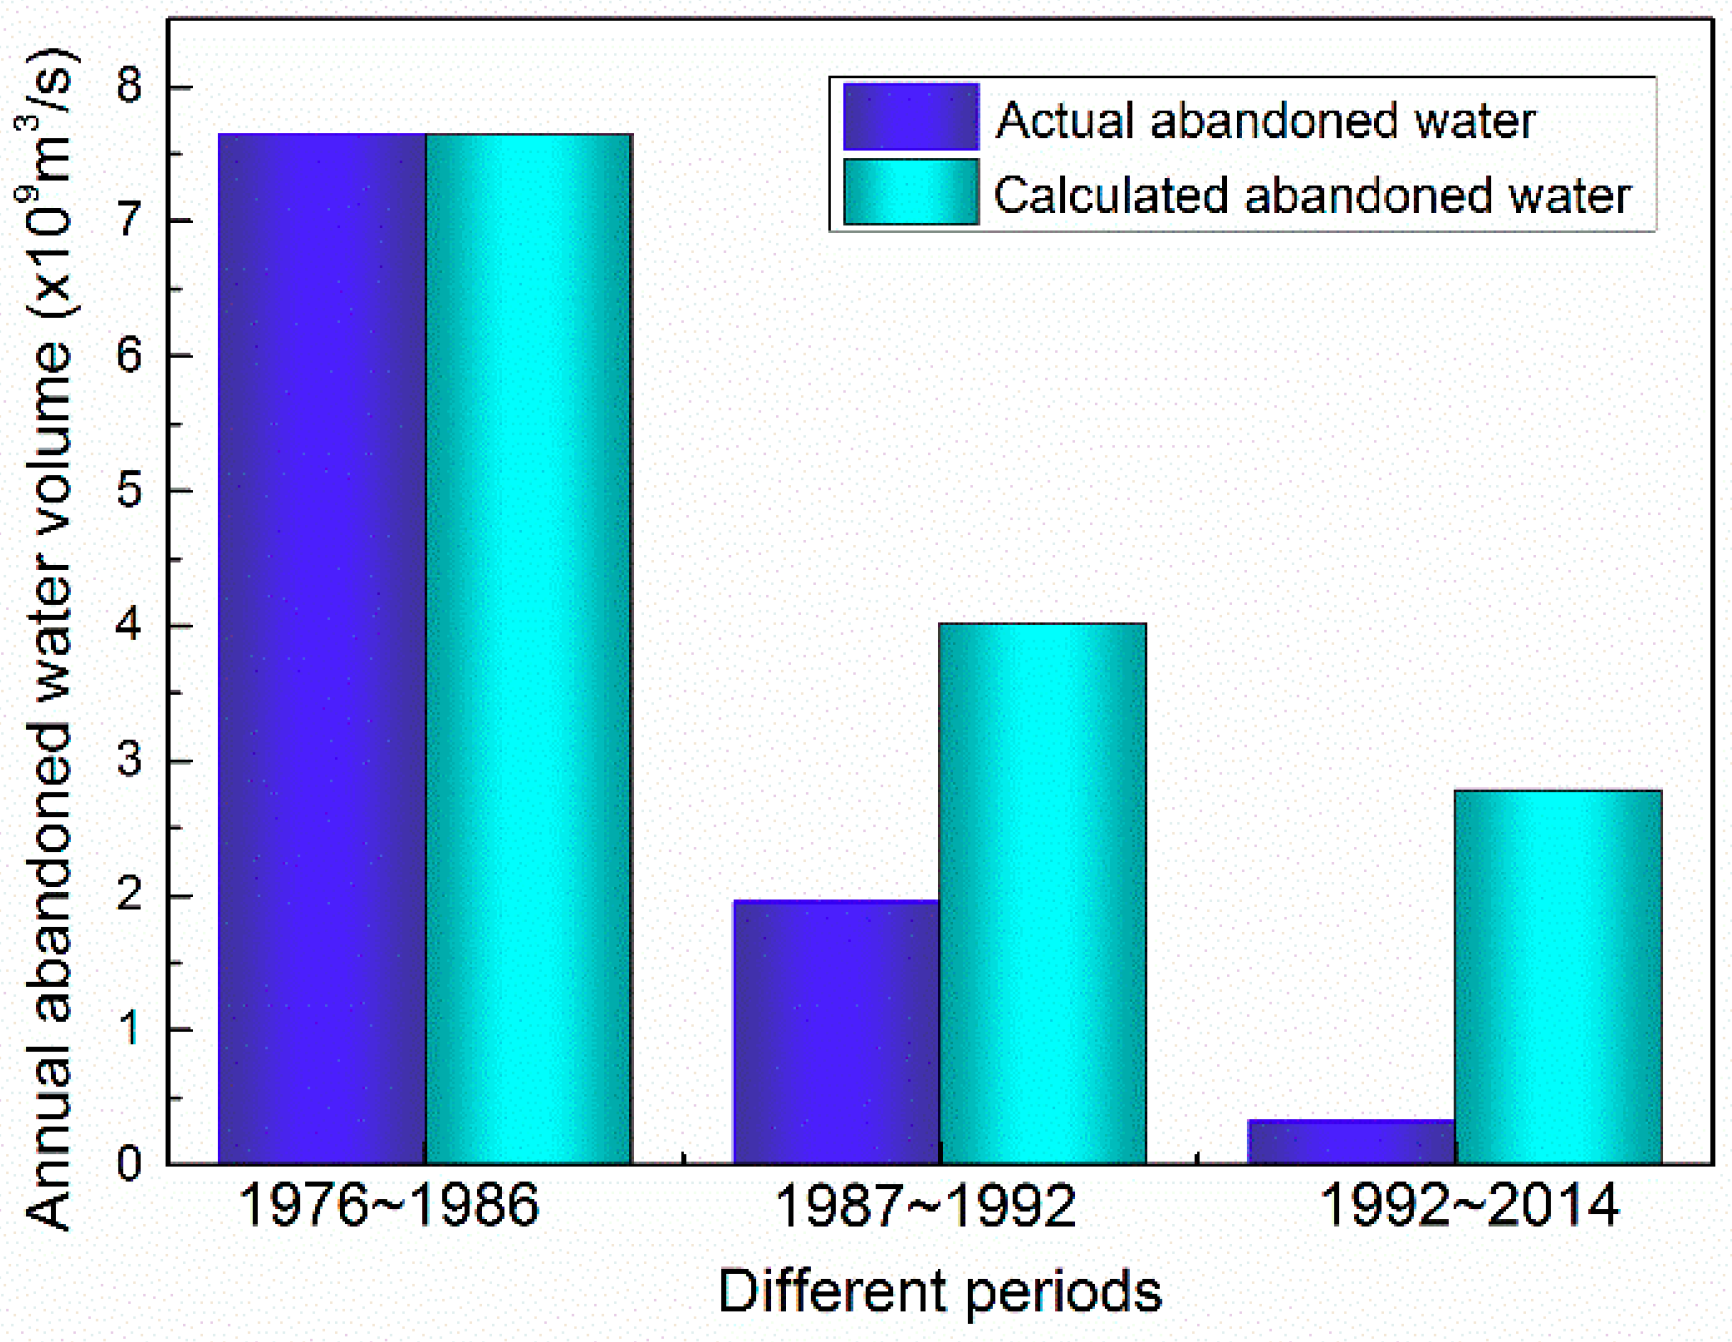
The abandoned water volume of the Liujiaxia reservoir should be 88.7 × 10⁹ m3 from 1987 to 2015 without the regulation of the Longyangxia reservoir, while the actual abandoned water is only 19.5 × 10⁹ m3, as shown in Figure 2. Due to the regulation and storage functions of the Longyangxia reservoir, the equivalent increased power generation of the cascaded reservoirs downstream is about 54.2 × 10⁹ kW·h. With the successive completion of downstream cascading hydropower stations, the indirect power generation benefits brought by the regulation of Longyangxia Reservoir will be more and more obvious.
Besides, hydropower is generally the best choice for compensating and regulating other energy sources in the power grid because of its characteristics of a flexible start-up and shutdown, good regulation performance, and low pollution. The upstream region of the Yellow River has abundant solar radiation and wind resources. By the end of 2017, the installed capacity of new energy, such as photovoltaic and wind power, in the Qinghai power grid reached 9.53 × 10⁹ kW, accounting for 40.6% of its total installed capacity, and the installed renewable energy reached 82.8% when hydropower was accounted for. New energy will mainly rely on hydropower from the main stream of the Yellow Rive for peak regulation.
3. Methodology
In this study, the environmental impacts of the Longyangxia reservoir are indicated by the morphologic changes of the rivers, the flow variations before and after the reservoir’s operation, as well as the peak flow variation. Meanwhile, ecological impacts are investigated upstream and downstream from the reservoir with field sampling, mainly including phytoplankton, zooplankton, and fish. The methodology of sampling, specimen processing, and identification are illustrated below.
3.1. Phytoplankton
• Qualitative specimen collection:
Network #25 with a length of 50 cm, a hoop diameter of 20 cm, and an aperture of 0.064 mm was used to collect small-scale plankton, while Network #13 with a length of 50 cm, a hoop diameter of 20 cm, and an aperture of 0.112 mm was used to collect large-scale plankton. The network was slowly dragged on the water surface for 1–3 min at a speed of 20–30 cm/s, or the surface water filtered a volume of 1.5–5.0 m3.
• Quantitative specimen collection:
A plexiglass water collector was used to collect 1 L of surface water for small plankton. Due to the scarcity of large-scale plankton, 10 L water was collected at each sampling point, filtered by plankton from Network #25, and then collected into glass bottles.
• Specimen processing:
Immediately after the water sample was collected, the stationary liquid was added. For algae, protozoa, and rotifer water samples, 15 mL of Lugol’s iodine solution was added to each liter, and for Cladocera and copepods, 4–5 mL of formalin was added to 100 mL of water samples. The samples were then taken back to the laboratory for preservation.
The fixed water samples from the field needed to be further concentrated in the laboratory. After 24 h of static precipitation of the 1000 mL water samples, the supernatants were carefully siphoned. The remaining 20–25 mL sediments were transferred into a 30 mL volumetric flask.
• Specimen identification:
Qualitative specimens were measured under a microscope with an eyepiece micrometer, and genera and species were determined according to the size, shape, contents, and algae classification criteria (referring to [21]).
Quantitative specimens were usually counted by a 0.1 mL counting frame and a 10 × 40 high-power microscope with oblique grid scanning. Detailed operations included using a 0.1 mL quantitative pipette to absorb the shaken sample solution and putting 0.1 mL into a plankton counting box, which was placed under the microscope to count the number according to [22]. If the number was too small, the plankton on the whole microslide were counted twice for each sample, and the average value was taken. The difference between the results of each count and the average value should be less than 15%, otherwise the number of counts was increased.
The formula for calculating the number of phytoplankton per liter of water sample is shown in Equation (1):
where N is the number of phytoplankton per liter; Cs is the area of the counting frame; Fs is the view area with the microscope; Fn is the number of Fs on the microslide; V is the water volume of 1L sampling after concentration; v is the volume of the counting frame; and Pn is the number of phytoplankton counted.
The calculation of phytoplankton biomass was based on a volume conversion method. According to the shape of the phytoplankton, its volume was measured according to the nearest geometry. Species with a special shape were decomposed into several parts, and then the results were added up.
3.2. Zooplankton
The sectional, temporal, and environmental records of zooplankton sampling are the same as those of phytoplankton. Zooplankton are classified into protozoa, rotifers, Cladocera, and copepods. Protozoa and rotifers were counted using quantitative samples of phytoplankton. For protozoa, a 0.1 mL solution was taken from the concentrated 30 mL sample, which was placed in a 0.1 mL counting frame, and the whole microslide was counted twice for each sample. For rotifers, a 1 mL solution was taken from the concentrated 30 mL sample, which was placed in a 1 mL counting frame, and the whole microslide was counted twice for each sample. The difference between the result of each count and the average value should be less than 15%, otherwise the number of counts was increased. For Cladocera and copepods, a 1 mL counting frame was used, and the quantitative samples of zooplankton filtered with 10 L water were counted several times.
The formula for calculating the number of zooplankton per liter of water sample is shown in Equation (2):
where N is the number of the zooplankton per liter; v is the sample volume after concentration; V is the volume of the sample; C is the volume of the counted sampling; and n is the counted number.
The calculation of zooplankton biomass was based on a volume conversion method. According to the shape of the zooplankton, its volume was measured according to the nearest geometry. Species with a special shape were decomposed into several parts, and then the results were added up. The biomass of Cladocera and copepods was calculated by measuring the body length of different species and using a regression equation to calculate body weight.
3.3. Fish
The fish survey mainly adopted field fishing and reference consulting. Fish specimens were identified on site as soon as possible. A small number of specimens were fixed and preserved in 5% formaldehyde solution.
4. Results and Discussion
4.1. Environmental Impact of the Longyangxia Reservoir
Maintaining the health of the river mainly requires the following aspects: (1) there are natural phenomena such as flood and drought changes in rivers; (2) a certain balance of water needs to be maintained; and (3) rivers should have a certain basic flow and flow regimes to maintain their self-purification capacity and the stability of the ecosystem. In the process of exploiting and utilizing water resources, human activities often break the above needs of rivers. Flow variation is a comprehensive embodiment of climate as well as human activities. Shen et al. [23] analyzed evaporation in the upper Yellow River using data from 1968 to 2008, and they concluded that the annual evaporation of this region was about 220 mm with a slight increasing tendency. The major sediment yield areas of the Yellow River are the middle and lower reaches, and there is little sediment in upper Yellow River. The annual sediment in this river reach is only 0.592 kg/m3, and the annual sediment flux entering the lake is 0.119 × 10¹¹ kg [24]. Besides, the Longyangxia reservoir is located in the untraversed Qinghai–Tibet Plateau, and the ecological environment is almost untouched. Feng [25] tested water samples in the Longyangxia reservoir in 2008, 20 years after the reservoir’s operation, and concluded that the water quality met the standard of grade II according to the “Environmental quality standards for surface water”, which means that it can be used in the first-level protection area of surface water sources for centralized domestic and drinking water, in the habitat of rare aquatic organisms, in the spawning field for fish and shrimp, in the feed field for young fish, etc. Hence, the impacts of the Longyangxia reservoir on evaporation, sediment, and water quality were ignored in this study. The environmental impact of the Longyangxia reservoir is discussed in the following aspects.
4.1.1. Morphologic Changes of the Rivers
The Yellow River reach between the Longyangxia and Liujiaxia reservoir has great waterfalls and abundant hydraulic resources with 14 hydropower stations planned, among which 13 stations have been built. The completed projects are basically connected continuously. There are only two natural reaches, with the lengths of 35 and 13 km, respectively. The exploitation rate of this reach is as high as 88.6%. As the reservoir modifies the hydrologic flow along the seasons, it has an impact on the hydro-morphology equilibrium of the Yellow River downstream from the dam. The diversiform river forms, including wide valley, canyon, riverbed, shoal, deep pool, and rapid and slow flows have no longer existed due to the submergence of reservoirs. The environment has completely changed from a flowing water habitat to a lake/reservoir habitat. No fish passage facilities have been constructed in any hydropower station, which has formed a multistage barrier for fish.
The Longyangxia reservoir is located in Gonghe Basin. The original river area was 14.63 km2, while it rose to 383 km2 after the impoundment of the Longyangxie reservoir with a backwater length of about 95 km. The expansion ratio of the water surface area is 26.2, and the river morphology notably changes. In summary, management of the river has very stressful impacts on river functioning and associated ecological ecosystems.
4.1.2. Flow Variation Analysis
Except for the initial storage stage, the Liujiaxia reservoir has little influence on the annual runoff since it is an annual regulating reservoir, and the interannual variation of the river reach downstream is basically consistent with natural conditions. After the Longyangxia reservoir was put into operation, the inflow from upstream has been small, and it has operated at a lower water level for a long time. Due to its storage and regulation, the flow regime upstream and downstream has changed.
Dividing the period into a natural period (1956–1968), a single reservoir operation period with the Liujiaxia project (1969–1986), and a joint operation period with both the Longyangxia and Liujiaxia reservoirs (1987–2000), the long-term hydrological series of the Tangnaihai, Guide, Xunhua, and Xiaochuan hydrological stations in Figure 1 in the Longyangxia–Liujiaxia-controlled river reach are compared and analyzed, as shown in Table 1.
It can be seen from Table 1 that, compared with the period from 1956 to 1968, the flow at each hydrological station increased in the period from 1969 to 1986, and the increment was not much different for different stations; while the flow in the period from 1987 to 2000 of the Tangnaihai station, which represents the natural inflow in the upper reaches, increased by 6%, and that of the stations downstream the Longyangxia reservoir varied slightly; hence, the dam led to a decreased flow of 5%–6% during the 1987–2000 period. Compared with the period from 1969 to 1986, the flows of all hydrological stations decreased in 1987–2000, and the decrement range rose along the river.
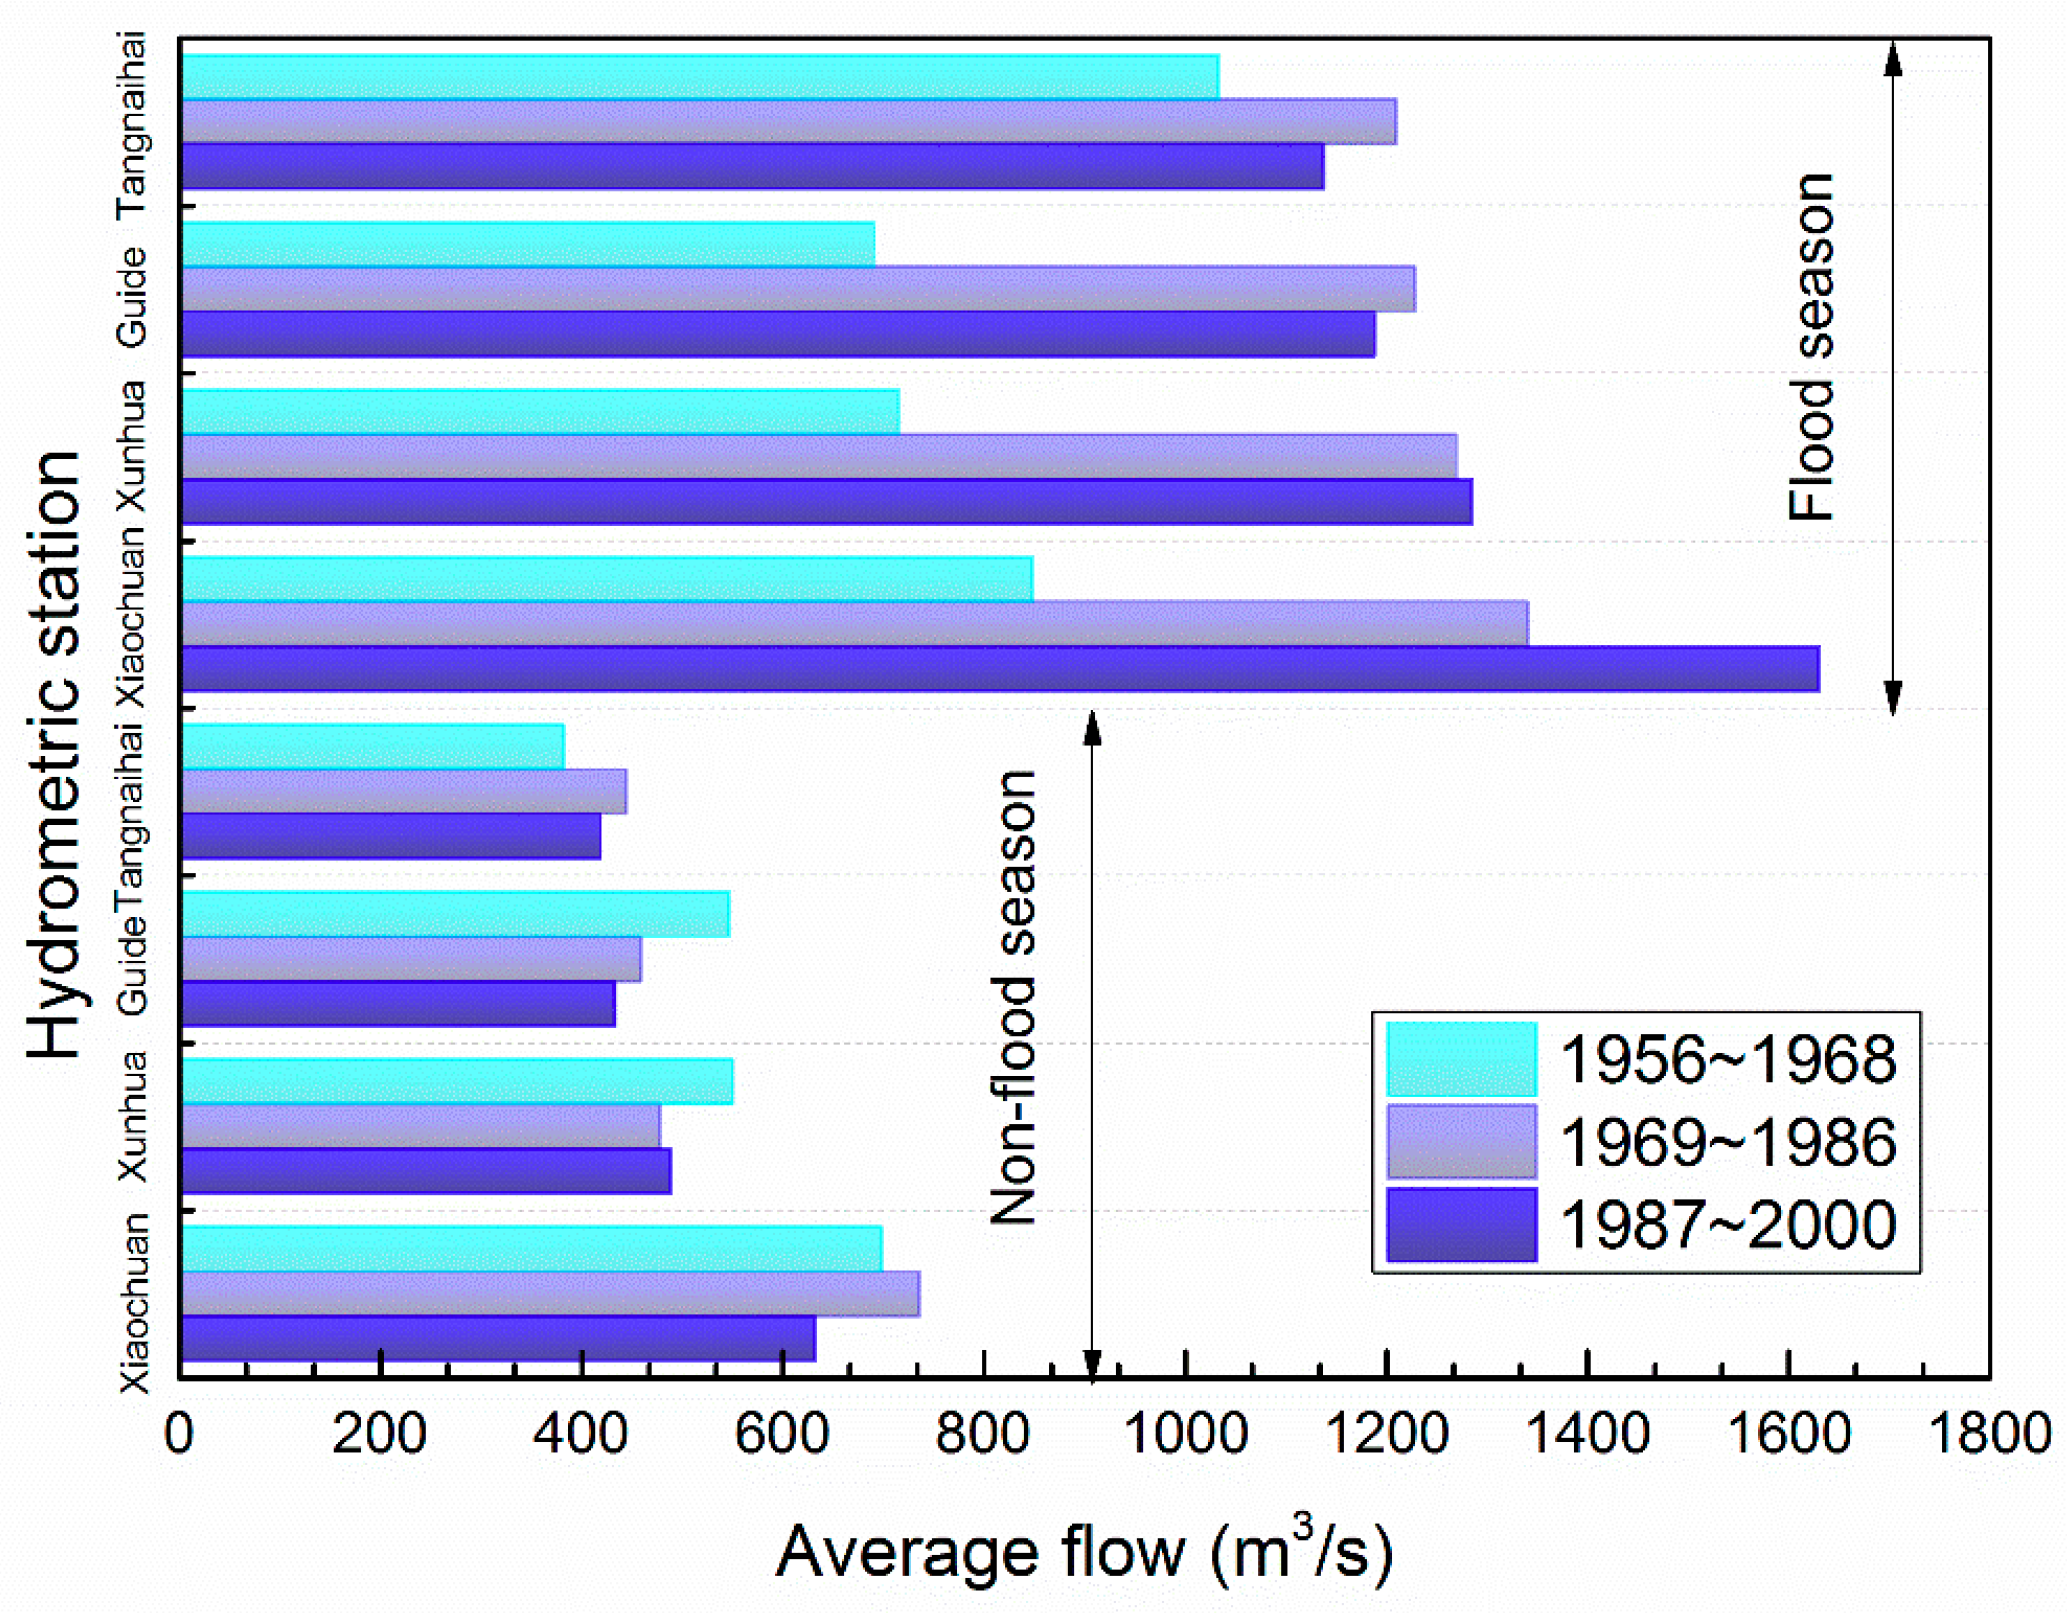
The statistics of flow in the flood season (from June to September) and the nonflood season (from October to the May next year) are shown in Figure 3.
It can be seen from Figure 3 that the flow processes at the Tangnaihai and Guide stations during the single reservoir operation period with the Liujiaxia reservoir (1969–1986) were basically the same as those before impoundment. With the regulation of the Liujiaxia reservoir, the discharge at the Xiaochuan station changed significantly. The discharge in the nonflood season decreased, while that in the flood season increased. After the Longyangxia reservoir was put into operation (1987–2000), the inflow in the upper reaches of the Yellow River was relatively low during the flood season, and Tangnaihai Station was 24% lower than that in 1956–1986. After regulation by the Longyangxia reservoir, the annual distribution of runoff was greatly affected by the large amount of water supply and power generation during downstream ice prevention and irrigation periods. The average flow at the Xiaochuan station in the flood season decreased from 57% in natural conditions to 39% after regulation, while the average value in the nonflood season increased from 43% in natural conditions to 61% after regulation.
Through joint regulation of the two reservoirs, the flow process tended to be uniform. The discharge of the Liujiaxia reservoir at the Xiaochuan station was reduced in the flood season, while it was basically the same as that when the single reservoir was put into operation in the nonflood season. It can be inferred that, in general, the single operation of the Liujiaxia reservoir has met the requirements of irrigation and ice prevention.
4.1.3. Changes of the Peak Flow
Operation of the Longyangxia reservoir has greatly changed the natural flow process. Floods have been trapped, and the peak flow has been greatly reduced. In the initial stage of impoundment in 1989, the daily peak flow into the reservoir was 4140 m3/s, while the outflow was only around 70 m3/s. Even after the reservoir entered into a normal operation period in 1992, the two floods that entered the reservoir in the flood season were also intercepted, and the reservoir discharge was less than 100 m2/s. As a result of reservoir regulation, the characteristic “high peak with large water amount” of the inflow in the flood season has basically disappeared, which appears more prominent in normal and dry years.
4.2. Ecological Impact of the Longyangxia Reservoir
4.2.1. Change Analysis of Fishes
According to the recent survey, there are 46 species of fish in the main stream from the Longyangxia reservoir to the Liujiaxia reservoir, which affiliated to 4 orders and 7 families. Of these, there are 28 indigenous species, accounting for 60.87% of the total species, including 11 cyprinid species, 15 cobitidae species, and 2 catfish species. There are 18 exotic fish species that account for 39.13% of total species. The proportion of exotic species is relatively large in this area, some of which have even formed natural populations. The river section has basically been exploited, and the dominance of indigenous fish has declined. The detailed changes in the previous survey is illustrated below.
The Longyangxia Reservoir started impoundment in October 1986 and began to discharge in February 1987. In the survey carried out by the Qinghai Institute of Aquaculture Research in 1988, no obvious impact of the Longyangxia reservoir on the fish was observed, and they even caught Platpharodon extremus Herz.
According to an investigation at the Longyangxia reservoir in 1991, it can be inferred that in the first three years after the impoundment of the Longyangxia reservoir, there had been a prosperous period for Gymnodiptychus eckloni Herz and Schizopygopsis pylzovi Kessler, which was similar to the sharp increase of Leuciscus chuanchicus Kessler in the Yellow River in the early impoundment of the Liujiaxia reservoir. The reason should be closely related to flow variation and also related to the sediment conditions at the reservoir tail. Sediment deposition changed the suitable gravel sediment for spawning, which is unfavorable to fish that produce demersal eggs.
After completion of the Longyangxia reservoir, fishery departments also carried out fish farming with Ctenopharyngodon idella, Hypophthalmichthys molitrix, Aristicluthys nobilia, Cyprinus carpio, Carassius auratus, and so on. Cyprinus carpio and Carassius auratus quickly formed natural populations in the reservoir. However, because of the low water temperature of the river, Ctenopharyngodon idella, Hypophthalmichthys molitrix, and Aristicluthys nobilia could grow normally in the reservoir area but could not reproduce naturally. In the late 1990s, cage culturing of Oncorhynchus mykiss as well as Protosalanx hyalocranius and Hypomesus olidus was carried out. Oncorhynchus mykiss is able to produce in natural rivers, and they have been caught in the upper reaches of the Yellow River. The dominant population of Protosalanx hyalocranius was not formed in the reservoir environment, while Hypomesus olidus formed a natural population in the reservoir, with fishing amounts of hundreds of thousands of kilograms each year, and they appear in the upper reaches of the Longyangxia reservoir. However, the habits of swallowing demersal eggs of Hypomesus olidus have a negative impact on indigenous fish.
In 2007, the main indigenous fish caught by the Yellow River Aquaculture Research Institute in Longyangxia reservoir area was Gymnodiptychus eckloni Herz. At the Longyangxia reservoir tail, indigenous fish such as Gymnodiptychus eckloni Herz, Platpharodon extremus Herz, Schizopygopsis pylzovi Kessler, Chuanchia labiosa Herzenstein, and Gymnodiptychus pachycheilus Herz could be caught.
A fish survey conducted in the Longyangxia reservoir area in July 2017 showed that the main catches in front of the dam were mainly exotic species such as Hypomesus olidus, Cyprinus carpio, and Carassius auratus, as well as Triplophysa adapted to a quiet water environment such as Nemacheilinae and Trilophysa brevviuda. The predominant species of catches in the Longyangxia reservoir area were still Hypomesus olidus followed by Carassius auratus, Pseudorasbora parva, and Cyprinus carpio. The indigenous fish Gymnodiptychus eckloni Herz began to appear in the Longyangxia reservoir area and dominates the reservoir tail. Other indigenous fishes such as Platpharodon extremus Herz, Schizopygopsis pylzovi Kessler, Chuanchia labiosa Herzenstein, and Acanthogobio guentheri Herz also had distributions of a certain scale.
In general, seven main indigenous fish species distributed in the upper reaches of the Yellow River, including Gymnodiptychus eckloni Herz, Platpharodon extremus Herz, Schizopygopsis pylzovi Kessler, Chuanchia labiosa Herzenstein, Gymnodiptychus pachycheilus Herz, Triplophysa siluroides, and Acanthogobio guentheri Herz, still exist in the Longyangxia reservoir river reach. However, populations of four species, including Platpharodon extremus Herz, Schizopygopsis pylzovi Kessler, Chuanchia labiosa Herzenstein, and Gymnodiptychus pachycheilus Herz, have declined severely. Only Gymnodiptychus eckloni Herz has a larger population, and Acanthogobio guentheri Herz is still prominent in the Liujiaxia reservoir reach. The composition of fish species varies greatly in different sections of the river. Although the diversity of indigenous species is high, their overall resources have seriously declined. The community structure of indigenous fish in different areas has been simplified and fragmented, and the community structure has changed greatly.
4.2.2. Impact on Phytoplankton
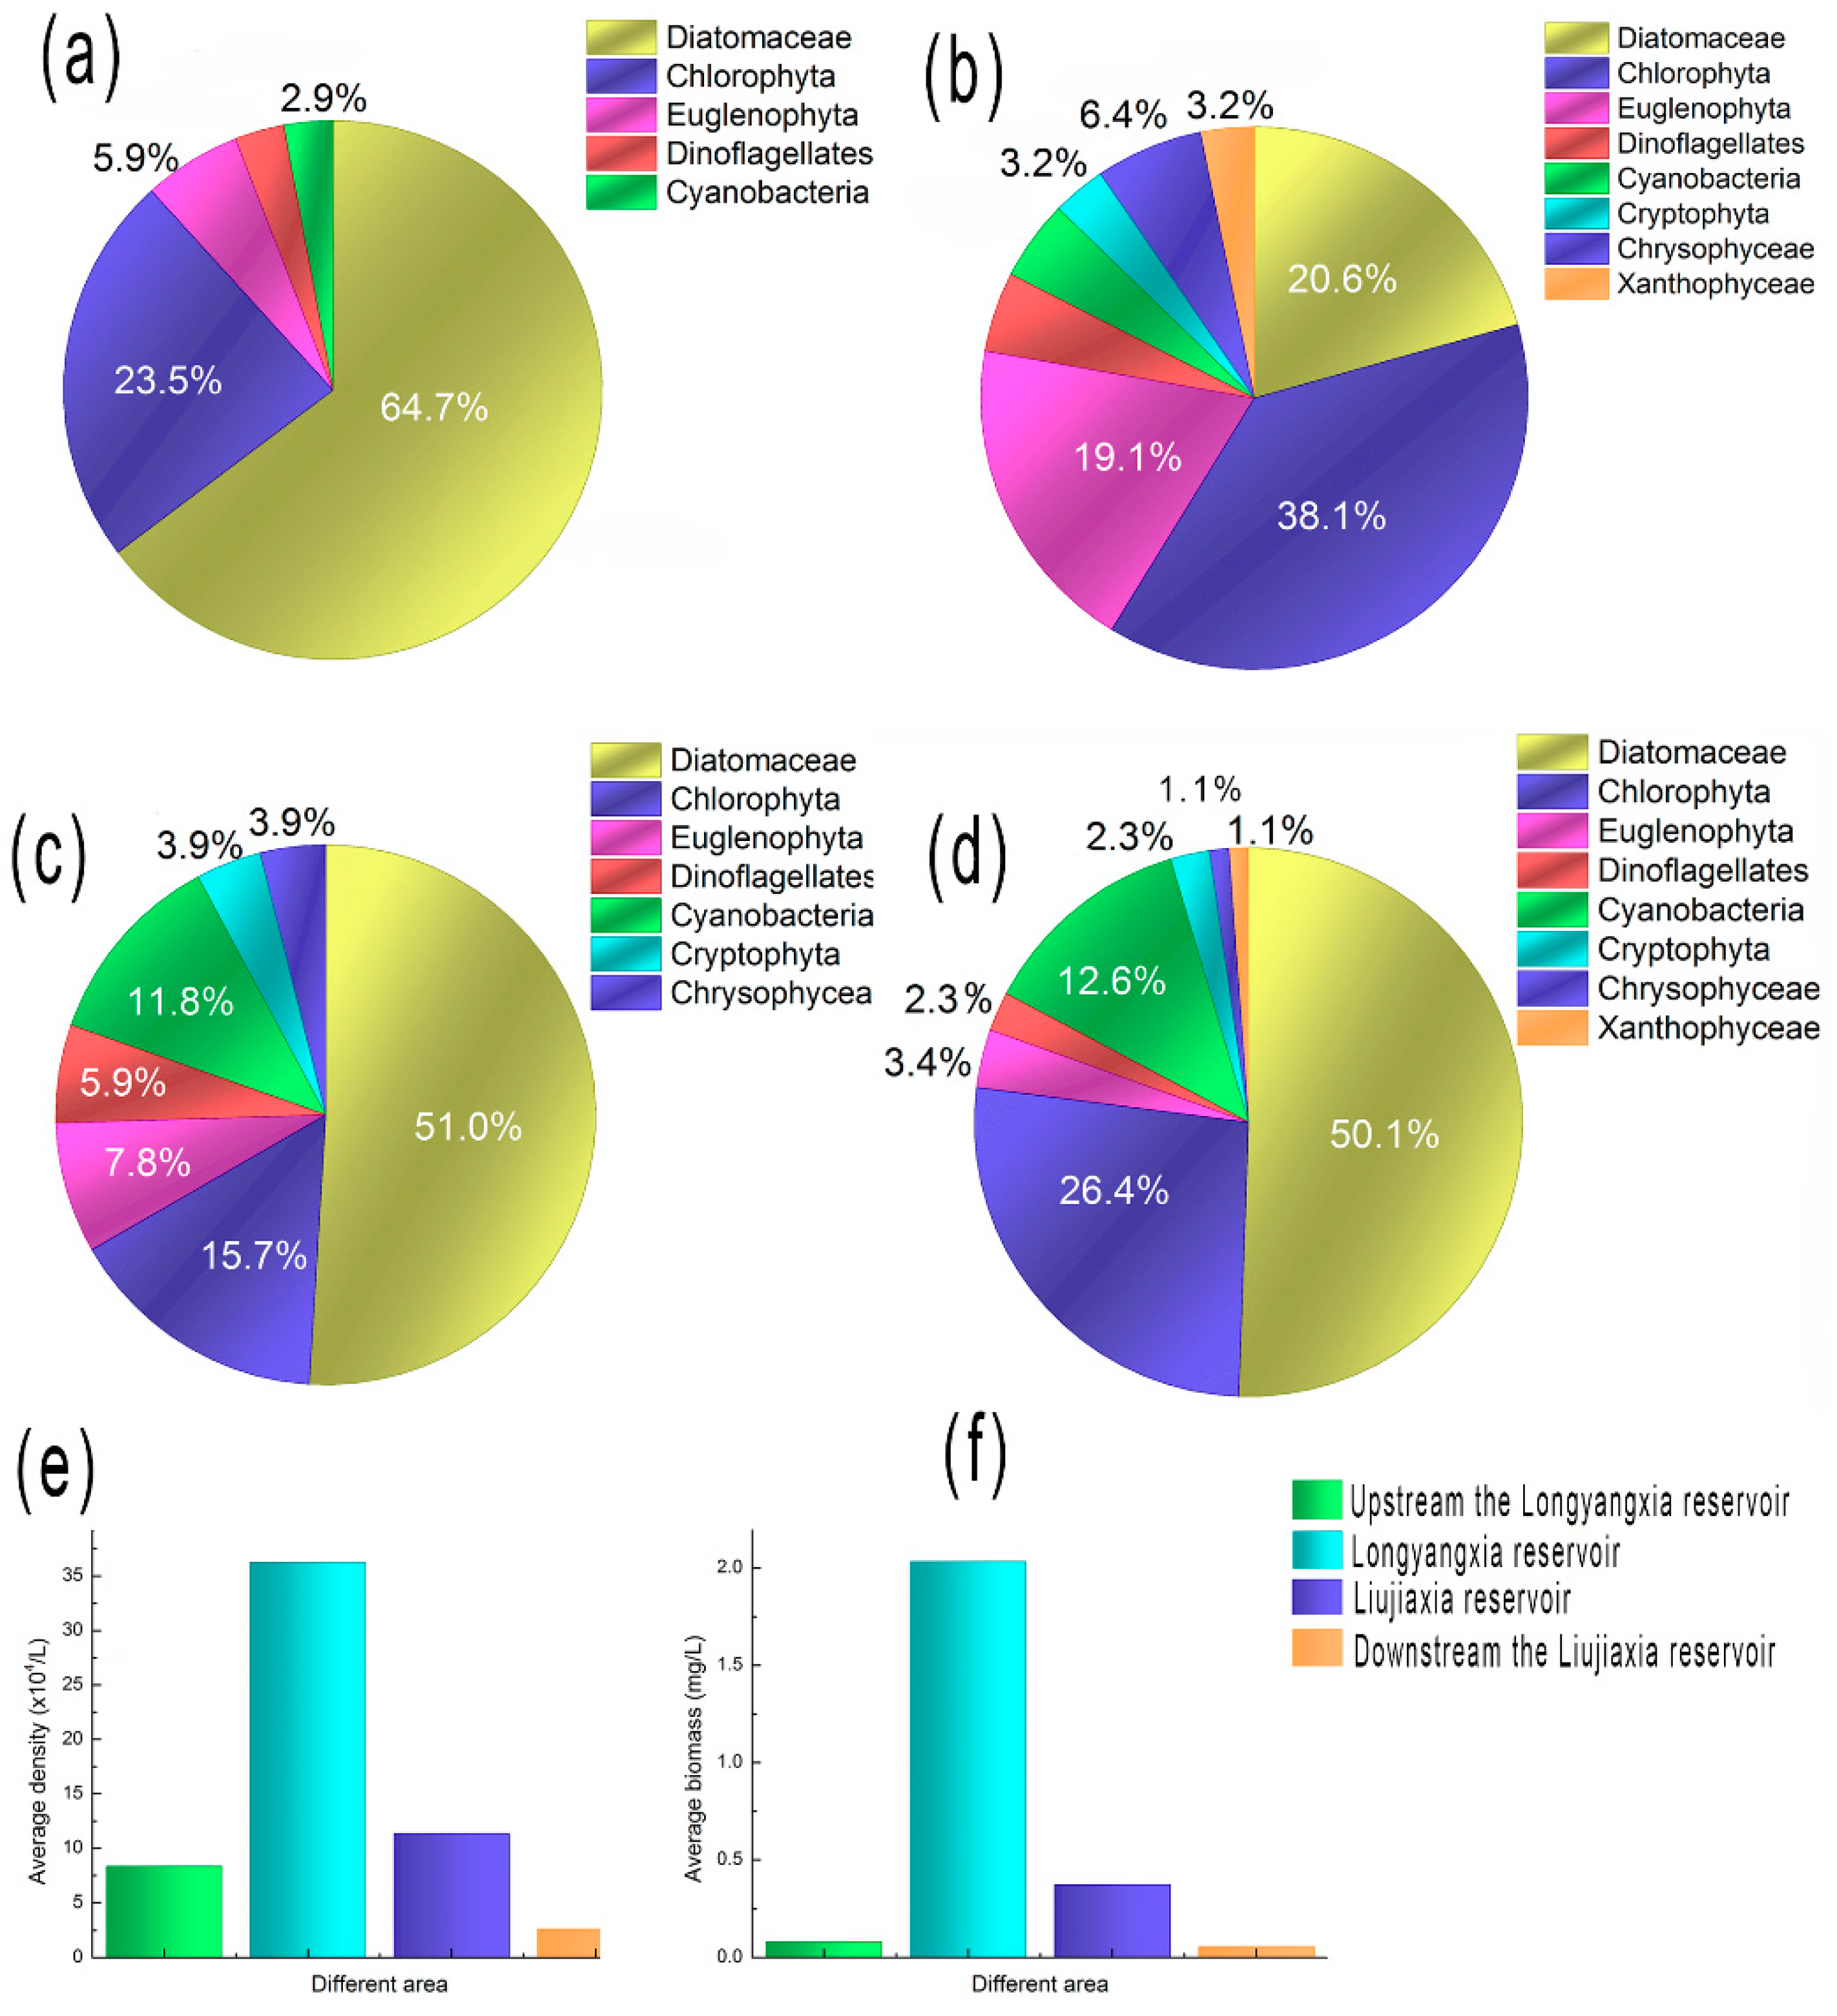
To compare the differences of phytoplankton and benthic organisms between rivers and reservoirs, in order to illustrate the influence of reservoirs on bait organisms, survey data from the river reach upstream of the Longyangxia reservoir, downstream of the Liujiaxia reservoir, and in the reservoir area were used at the same time, as shown in Figure 4.
It can be seen from Figure 4 that the composition of phytoplankton in reservoirs and the river has notably changed. Diatomaceae are dominant in rivers, while both Diatomaceae and Chlorophyte have equal stress in the reservoir. Moreover, the biomass density in the reservoir is about 4.4 times larger than that in the river.
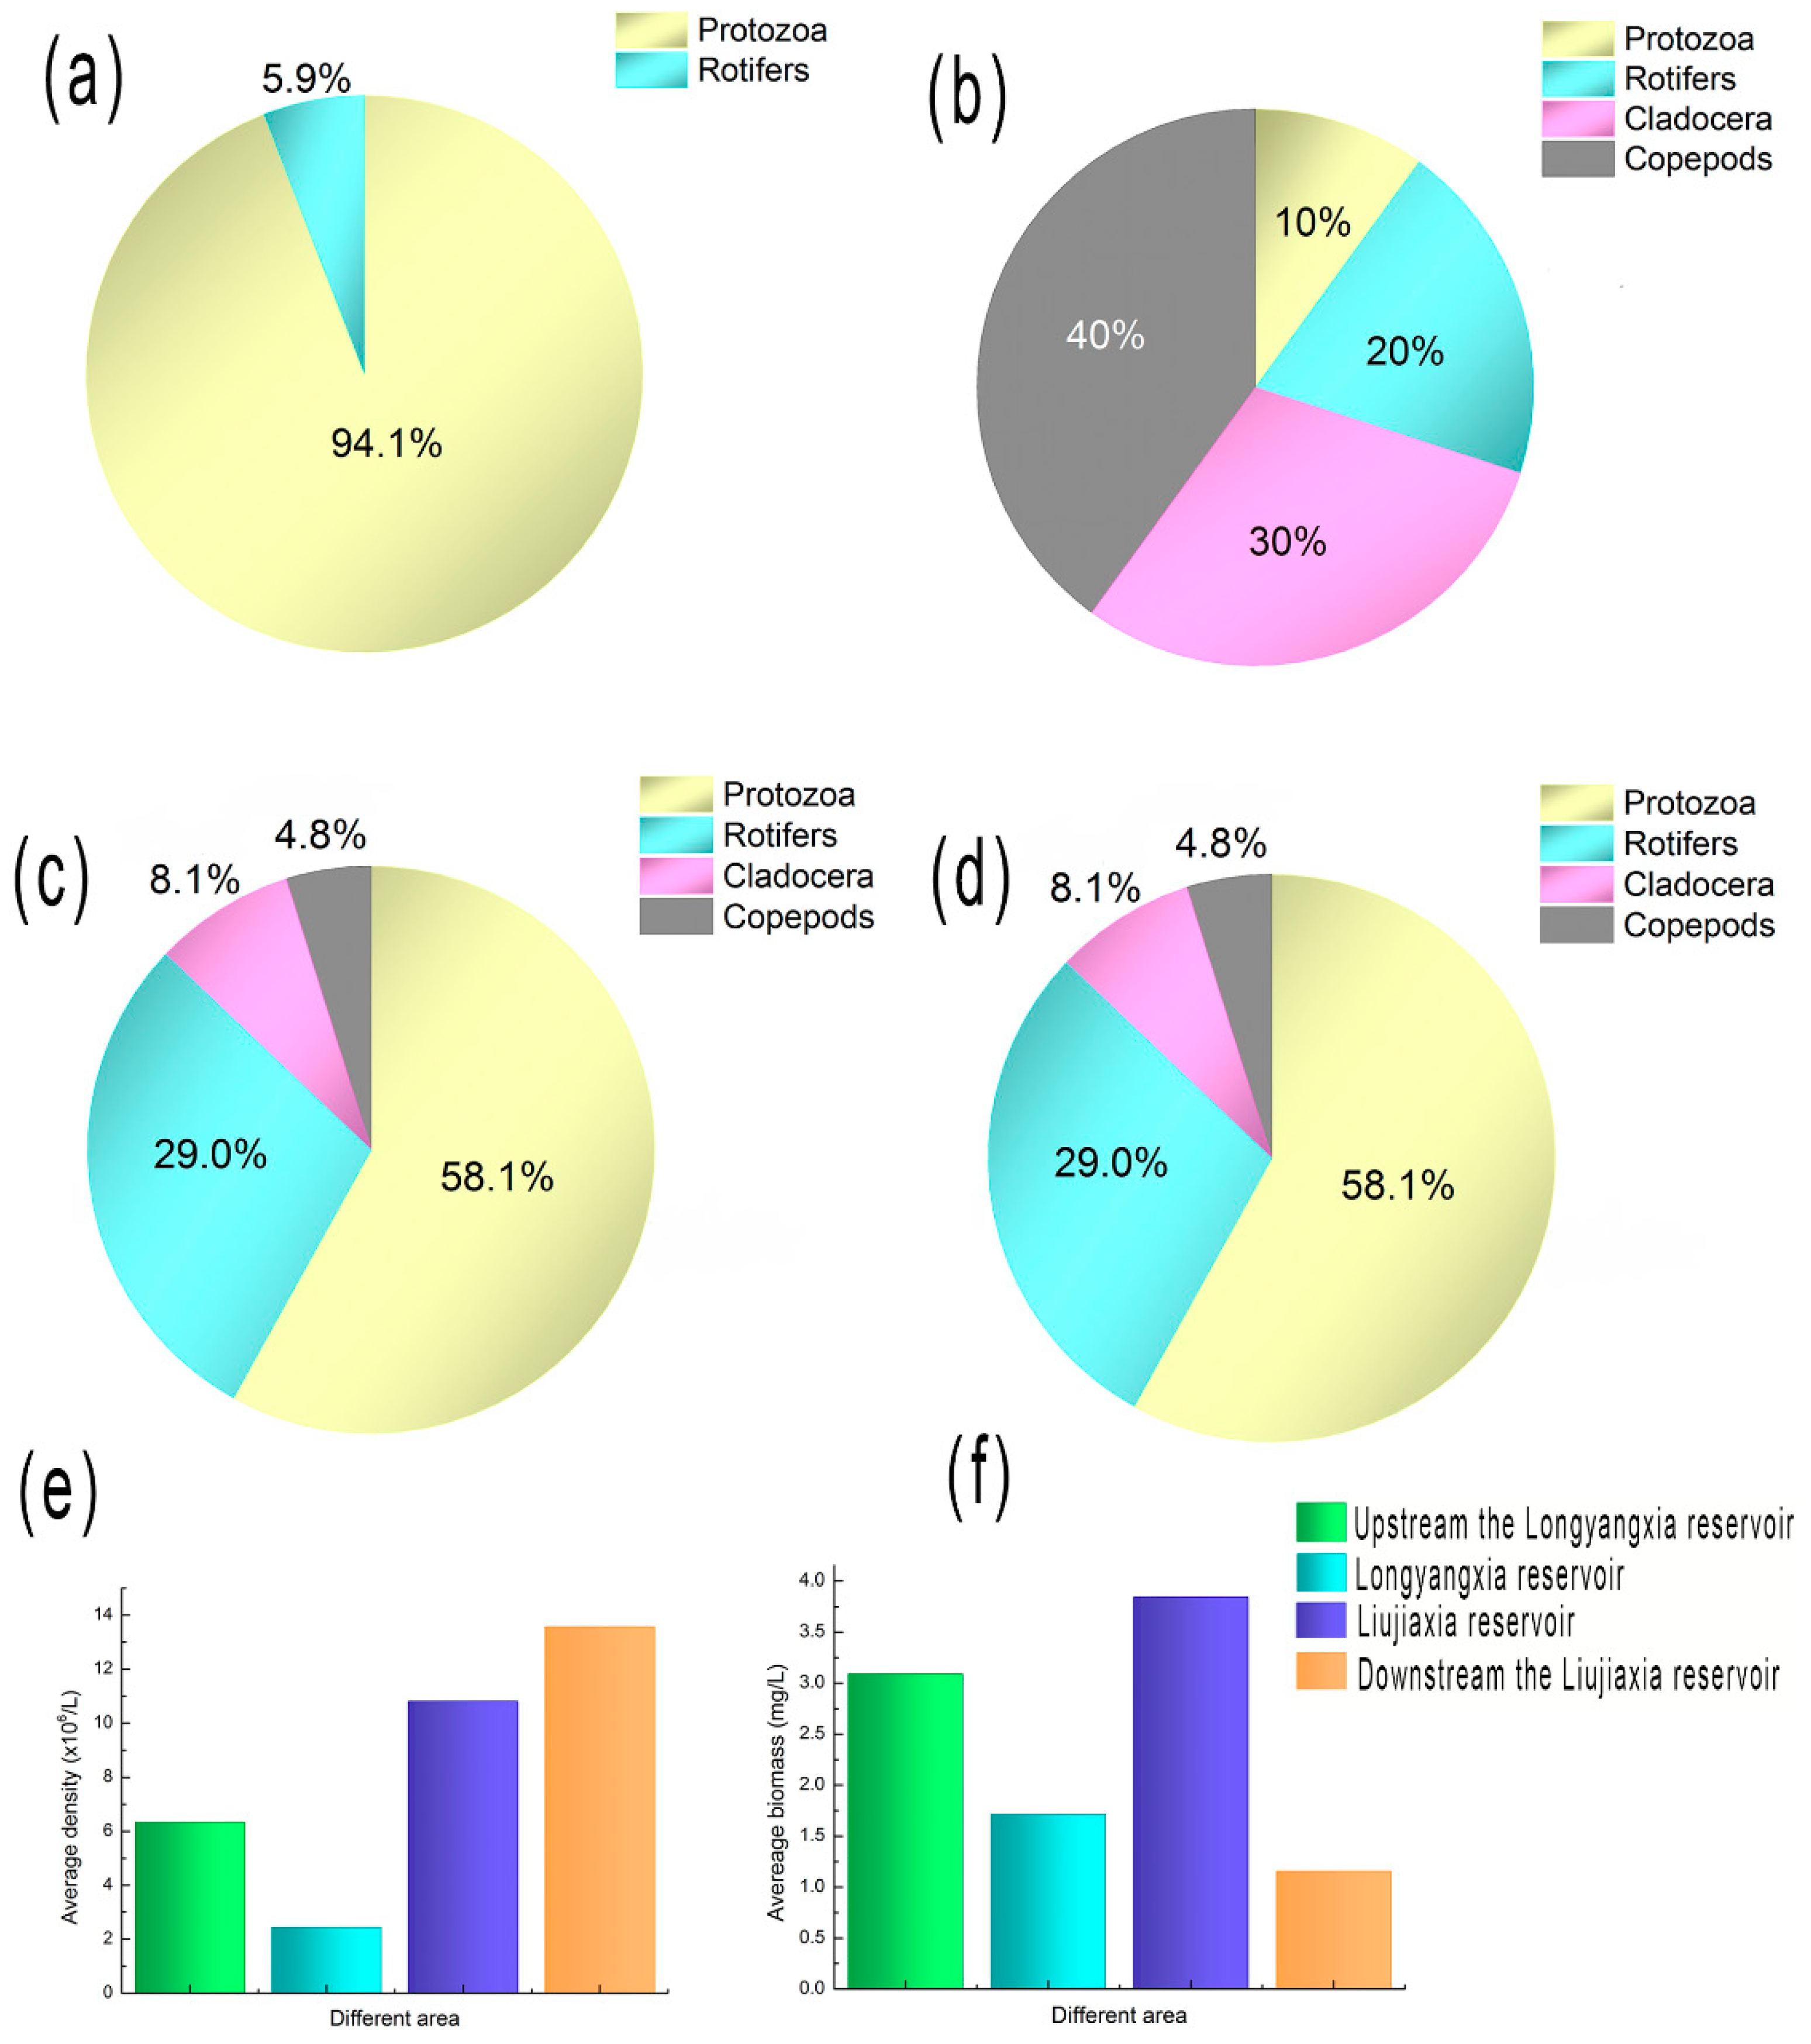
4.2.3. Impact on Zooplankton
The zooplankton in the Longyangxia and Liujiaxia reservoirs as well as the upper and lower reaches are shown in Figure 5. It can be seen that the composition of the zooplankton in the reservoirs and rivers are different to a large extent. Since the Liujiaxia reservoir has entered the Loess Plateau from the Qinghai–Tibet Plateau with a higher air temperature, zooplankton of the Liujiaxia reservoir are nearly five times higher than that in the Longyangxia area. The density of zooplankton in the Liujiaxia reservoir is similar to that in the mainstream of the Yellow River downstream.
5. Discussion and Conclusion
According to the investigation and analysis above, operation of the Longyangxia and Liujiaxia reservoirs is carried out under the requirements of a unified regulation of the Yellow River basin by the government with results aimed at comprehensive coordination of water supply, ice prevention, and other comprehensive power utilization and generation goals. After the operation of the Longyangxia reservoir, the intra-annual distribution of water in the reach tends to be more uniform, and the abandoned water has decreased, which is conducive to the benefit of the cascading hydropower stations. On the other hand, due to impoundment of the reservoirs, the diversiform river morphology, such as canyons, broad valleys, riffles, pools, interphase rapids, and slow flows, has disappeared and has completely changed from a flowing water habitat to a lake/reservoir habitat. With the regulation of runoff, the characteristic “high peak with large water quantity” of water flow in the flood season has basically disappeared. Such changes may lead to adverse effects on ecological functioning of the Yellow river.
The indigenous fish in the upper reaches of the Yellow River mainly produce adhesive and demersal eggs, which are highly adapted to their habitats. Under natural conditions, the river reach with a broad valley is suitable for the spawning and reproduction of indigenous fish. New spawning habitats formed in the reservoir tail after impoundment, which were mainly for Gymnodiptychus eckloni Herz and most Triplophysa. Suitable habitats of other main indigenous species, including Platpharodon extremus Herz, Schizopygopsis pylzovi Kessler, Chuanchia labiosa Herzenstein, Gymnodiptychus pachycheilus Herz, and Acanthogobio guentheri Herz, shrunk on different levels, which negatively impacted the biodiversity. In addition, with an increase in the impound water habitat, fishes existing in plains such as Carassius auratus, Pseudorasbora parva, and Cyprinus carpio, as well as imported species such as Oncorhynchus mykiss, Protosalanx hyalocranius, and Hypomesus olidus, increased. Hypomesus olidus became the dominant species, but since they prey on the fertilized eggs of indigenous fish, it has caused great damage to indigenous fish.
Diatomaceae and Chlorophyta dominate the phytoplankton community in the whole reach. The impoundment of reservoirs contributes to the reproduction and growth of phytoplankton. Compared with the river reaches upstream and downstream, the average density and biomass of phytoplankton in the reservoir are more abundant, which may lead to a negative impact on the ecosystem, and is the consequence of an increase in the residence time and in the summer surface water temperature. The dominant genera of zooplankton are protozoa. Overall, the increase in phytoplankton biomass demonstrates that the trophic level has probably increased due to the impoundment of the reservoir.
Generally, in the past 30 years after the construction of the Longyangxia reservoir, significant socio-economic benefits have been made, while the water area nearby has formed a new ecological environment, and the trophic level of the aquatic environment has probably increased.
Author Contributions
Conceptualization, J.Q. and F.F.L.; Methodology, T.J.L. and F.F.L.; Formal Analysis, J.Q. and F.F.L.; Investigation, J.Q. and F.F.L.; Writing—Original Draft Preparation, J.Q.; Writing—Review and Editing, T.J.L. and F.F.L; Visualization, J.Q.; Supervision, T.J.L. and F.F.L; Project Administration, F.F.L.; Funding Acquisition, J.Q. and F.F.L.
Funding
This research was founded by National Key R&D Program of China, grant number 2016YFE0201900, 2017YFC0403600, and National Natural Science Foundation of China, grant number 91847302, 51879137.
Conflicts of Interest
The authors declare no conflict of interest.
References
- Nilsson, C.; Svedmark, M. Basic principles and ecological consequences of changing water regimes: Riparian plant communities. Environ. Manag. 2002, 30, 468–480. [Google Scholar] [CrossRef]
- Nehring, R.B. Evaluation of Instream Flow Methods and Determination of Water Quantity Needs for Streams in the States of Colorado. In Division of Wildlife; Collins, F., Ed.; Colorado Division of Wildlife: Fort Collins, Colo, USA, 1979; p. 144. [Google Scholar]
- Bunn, S.E. Water for the Environment: Recent Approaches to Assessing and Providing Environmental Flows: Concluding Comments. In Proceedings of the AWWA Forum, Brisbane, Australia, 29 April 1998. [Google Scholar]
- IUCN (The World Conservation Union). Report of the 11th Global Biodiversity Forum: Crisis of Freshwater Biodiversity. 1999. Available online: https://portals.iucn.org/library/sites/library/files/documents/1999-040.pdf (accessed on 11 July 2019).
- Peet, R.K. The measurement of species diversity. Ann. Rev. Ecol. Syst. 1974, 5, 285–307. [Google Scholar] [CrossRef]
- Simpson, E.H. Measurement of diversity. Nature 1949, 163, 688. [Google Scholar] [CrossRef]
- Pielou, E.C. Ecological Diversity; John Wiley and Sons Inc.: New York, NY, USA, 1975. [Google Scholar]
- Zhong, H.P.; Liu, H.; Geng, L. Ecology and Environment Cumulative Effects of Cascaded Hydropower Development in Nujiang River. Water Resour. Power 2008, 26, 52–59. [Google Scholar]
- Petts, G.E. Long-Term Consequences of Upstream Impoundment. Environ. Conserv. 1980, 7, 325–332. [Google Scholar] [CrossRef]
- Burris, R.K.; Canter, L.W. Cumulative impacts are not properly addressed in environmental assessment. Environ. Impact Assess. Rev. 1997, 17, 5–18. [Google Scholar] [CrossRef]
- Cooper, T.A.; Canter, L.W. Documentation of cumulative impacts in environmental impact statements. Environ. Impact Assess. Rev. 1997, 7, 385–411. [Google Scholar] [CrossRef]
- Canada Environmental Assessment Agency. Cumulative Effects Assessment Practitioners Guide; Canada Environmental Assessment Agency: Ottawa, ON, Canada, 1999. [Google Scholar]
- Tharme, R.E. A global perspective on environmental flow assessment: Emerging trends in the development and application of environmental flow methodologies for rivers. River Res. Appl. 2003, 19, 397–441. [Google Scholar] [CrossRef]
- Murchie, K.J.; Hair, K.P.E.; Pullen, C.E.; Redpath, T.D.; Stephens, H.R.; Cooke, S.J. Fish response to modified flow regimes in regulated rivers: Research methods, effects and opportunities. River Res. Appl. 2008, 24, 197–217. [Google Scholar] [CrossRef]
- Bunn, S.E.; Arthington, A.H. Basic principles and ecological consequences of altered flow regimes for aquatic biodiversity. Environ. Manag. 2002, 30, 492–507. [Google Scholar] [CrossRef]
- Santos, R.M.B.; Sanches Fernandes, L.F.; Cortes, R.M.V.; Varandas, S.G.P.; Jesus, J.J.B. Pacheco FAL Integrative assessment of river damming impacts on aquatic fauna in a Portuguese reservoir. Sci. Total Environ. 2017, 601, 1108–1118. [Google Scholar] [CrossRef] [PubMed]
- Kang, H.; Jung, S.H.; Park, D. Development of an ecological impact assessment model for dam construction. Landsc. Ecol. Eng. 2017, 13, 15–31. [Google Scholar] [CrossRef]
- Horsák, M.; Bojková, J.; Zahrádková, S.; Omesová, M.; Helešic, J. Impact of reservoirs and channelization on lowland river macroinvertebrates: A case study from Central Europe. Limnologica 2009, 39, 140–151. [Google Scholar] [CrossRef] [Green Version]
- Wang, Y.; Zhang, N.; Wang, D.; Wu, J.; Zhang, X. Investigating the impacts of cascade hydropower development on the natural flow regime in the Yangtze River, China. Sci. Total Environ. 2018, 624, 1187–1194. [Google Scholar] [CrossRef]
- Ministry of Water Resources PRC. Yellow River Water Resources Bulletin; Water Resources of the People’s Republic of China: Beijing, China, 2017.
- Hu, H. The Freshwarter Algae of China: Systematics, Taxonomy and Ecology; China Science Publishing & Media Ltd.: Beijing, China, 2006. (In Chinese) [Google Scholar]
- Zhang, Z. Freshwater Plankton Research Methods; China Science Publishing & Media Ltd.: Beijing, China, 1991. (In Chinese) [Google Scholar]
- Shen, H.; Li, L.; Chen, X.; Dai, S.; Wang, Z.; Liu, C. Impacts of climate change and fluctuations on flows into the longyangxia reservoir. Resour. Sci. 2010, 32, 1513–1519. (In Chinese) [Google Scholar]
- Ministry of Water Resources of the People’s Republic of China. China River Sediment Bulletin; Ministry of Water Resources of the People’s Republic of China: Beijing, China, 2017; p. 24. (In Chinese)
- Feng, H. The Study of Aquatic Biodiversity and the Evaluation of Ecosystem Health in Huanghe River Upper Reach from Longyangxia to Liujiaxia. Master’s Thesis, Northwest University, Xi’an, China, 2009. (In Chinese). [Google Scholar]
Figure 1.
Yellow River basin and the location of the Longyangxia and Liujiaxia reservoirs.

Figure 2.
Comparison of the actual and calculated abandoned water of the Liujiaxia reservoir in different periods: (1) 1976~1986, before the impoundment of the Longyangxia reservoir; (2) 1987~1992, before the completion of the Longyangxia reservoir; and (3) 1992~2014, after the operation of the Longyangxia reservoir.

Figure 3.
Comparison of average flow at different hydrometric stations in different periods.

Figure 4.
Genera composition of the phytoplankton in different water areas: (a) in the river reach upstream from the Longyangxia reservoir; (b) in the Longyangxia reservoir; (c) in the Liujiaxia reservoir; and (d) in the river reach downstream from the Liujiaxia reservoir. (e) The average density in different areas; and (f) the average biomass in different areas.

Figure 5.
Genera composition of the zooplankton in different water areas: (a) in the river reach upstream from the Longyangxia reservoir; (b) in the Longyangxia reservoir; (c) in the Liujiaxia reservoir; and (d) in the river reach downstream from the Liujiaxia reservoir. (e) The average density in different areas; and (f) the average biomass in different areas.


Table 1.
Annual flow statistics in different periods.
| Hydrologic Station | 1956–1968 | 1969–1986 | 1987–2000 | ||||||
|---|---|---|---|---|---|---|---|---|---|
| Flow (m3/s) | Flow (m3/s) | Compared with 1956–1968 | Flow (m3/s) | Compared with 1956–1968 | Compared with 1969–1986 | ||||
| Variation | Ratio | Variation | Ratio | Variation | Ratio | ||||
| Tangnaihe | 551 | 693 | +142 | 25.7% | 585 | +34 | 6.2% | –108 | 15.6% |
| Guide | 570 | 707 | +137 | 24.0% | 574 | +4 | 0.7% | –133 | 18.8% |
| Xunhua | 584 | 723 | +139 | 23.8% | 584 | 0 | 0% | –139 | 19.2% |
| Xiaochuan | 706 | 909 | +203 | 23.0% | 713 | +7 | 1.0% | –196 | 21.6% |
© 2019 by the authors. Licensee MDPI, Basel, Switzerland. This article is an open access article distributed under the terms and conditions of the Creative Commons Attribution (CC BY) license (http://creativecommons.org/licenses/by/4.0/).
Share and Cite
MDPI and ACS Style
Qiu, J.; Li, T.-J.; Li, F.-F. Evaluation of Environmental and Ecological Impacts of the Leading Large-Scale Reservoir on the Upper Reaches of the Yellow River. Sustainability 2019, 11, 3818. https://doi.org/10.3390/su11143818
AMA Style
Qiu J, Li T-J, Li F-F. Evaluation of Environmental and Ecological Impacts of the Leading Large-Scale Reservoir on the Upper Reaches of the Yellow River. Sustainability. 2019; 11(14):3818. https://doi.org/10.3390/su11143818
Chicago/Turabian StyleQiu, Jun, Tie-Jian Li, and Fang-Fang Li. 2019. "Evaluation of Environmental and Ecological Impacts of the Leading Large-Scale Reservoir on the Upper Reaches of the Yellow River" Sustainability 11, no. 14: 3818. https://doi.org/10.3390/su11143818
Note that from the first issue of 2016, this journal uses article numbers instead of page numbers. See further details here.