Article

Identification of Polluted Sites in Four Major Rivers in Kuantan, Malaysia based on Water Chemistry Estimates of Aquatic Microbial Activity

by
Daisuke Kozaki
1,*,
Norhasmira Idayu binti Harun
2,
Chan Hein Chong
2,
Murni Hayati binti Esraruddin
2,
Nor Atiah binti Yunus
2,
Aini Syazana binti Derahman
2,
Kee Seng Pu
2,
Nurul Syazwani binti Alias
2,
Kumutharani A/P Annamalai
2,
Sarmila Nagappan
2,
Mohd Hasbi bin Ab. Rahim
2,* and
Mashitah M. Yusoff
2
1
Department of Chemistry and Biotechnology, Faculty of Science and Technology, Kochi University, 2-5-1 Akebono-cho, Kochi city, Kochi 780-8520, Japan
2
Faculty of Industrial Sciences and Technology, Universiti Malaysia Pahang, Lebuhraya Tun Razak, 26300 Gambang Kuantan, Pahang Darul Makmur, Malaysia
*
Authors to whom correspondence should be addressed.
Sustainability 2019, 11(14), 3813; https://doi.org/10.3390/su11143813
Submission received: 5 June 2019 / Revised: 9 July 2019 / Accepted: 9 July 2019 / Published: 11 July 2019
(This article belongs to the Special Issue Sustainable Water Resource Management)

Abstract

:
Kuantan in Pahang, Malaysia has experienced rapid development and environmental degradation over the past decade following the implementation of The National Physical Plan 2005. To assess water quality and identify polluted areas in the region, we measured the water chemistry and microbial activity in response to land-use changes for four major rivers, namely, Pahang, Kuantan, Belat, and Galing, using data from ion chromatography and portable water quality monitoring devices. The following were concluded: (1) significant differences in chemical oxygen demand, COD concentration among all monitored rivers suggest that COD and its associated biological reactions are key parameters to assess anthropogenic water quality degradation in our study area; (2) due to the low anthropogenic wastewater pollution, the dominant microbial reactions in the Pahang, Kuantan, and Belat rivers were aerobic microbial oxidation of organic compounds and nitrification by nitrifying bacteria, allowing the rivers to self-purify; (3) the Galing River predominantly experiences anaerobic decomposition of organic compounds through microbial denitrification and sulfate reduction due to the heavy anthropogenic land use in the river basin; and (4) the western side of the Galing River and upstream sites located within the industrial and business/servicing areas in the Kuantan city center experience the heaviest pollution.

1. Introduction

In recent years, environmental pollution of the atmosphere, hydrosphere, and pedosphere in South East Asian countries has gained global recognition due to the region’s rapid economic, industrial, and agricultural development [1,2]. Malaysia, in particular, has experienced rapid industrial and agricultural growth. Almost 60% of the country’s major rivers have been regulated for domestic, agricultural, and industrial purposes since the 1990s due to the wastewater pollution from housing, industrial, business or servicing areas [3,4,5].
The Sustainable Development Goals (SDGs) were adopted by the United Nations Sustainable Development Summit in September 2015 to eradicate poverty and to achieve a sustainable future in terms of economy, education, food, gender, healthcare, environment, technology, sustainability, etc. [6]. Of these SDGs, SDG 6 (“Ensure availability and sustainable management of water and sanitation for all”) included the following scope as one of the targets: “By 2030, improve water quality by reducing pollution, eliminating dumping and minimizing release of hazardous chemicals and materials, halving the proportion of untreated wastewater and substantially increasing recycling and safe reuse globally.” In a future scope in the “11th Malaysia Plan” in line with SDG 6, enhancing environmental sustainability through green growth is included as one of the six pillars of the plan to ensure that over 99% of the population is served by clean and treated water by 2020 [7].
To achieve the above scope for Malaysia, securing water resources based on detailed water quality monitoring, understanding water quality condition, and identifying polluted areas are extremely important tasks.
In line with the above scopes and SDGs, several research groups have conducted studies Kuantan, the state capital of Pahang, Malaysia, and the surrounding area. Kuantan is the largest city in the East Coast of Peninsular Malaysia and the 18th largest city in all of Malaysia based on population data from 2010 [8]. Urbanized central Kuantan and the surrounding area have developed dramatically over the last ten years, leading to hydrosphere degradation following the implementation of the “Kuantan District Locality Plan 2004–2015” [9]. Rashid et al. [10] studied the influence of water quality on fish occurrences in the Pahang River. Rahman et al. [11] studied the concentration of several heavy metals in the Kuantan River during the pre- and post-monsoon seasons. Lee et al. [12] conducted a study to improve the water quality of the Galing River in terms of a model simulation of the environmental fluid dynamic code. Mazhar et al. [13] also evaluated the water quality of the Galing River based on water quality indexes with numerical modeling. Wan et al. [14] applied an automatic water quality monitoring system to the assessment of the Galing River water quality and succeeded in monitoring water pollution in real time. In addition, in recent years, the atmosphere and hydrosphere in Kuantan and the surrounding area have been polluted by the mining of bauxite soil. Kusin et al. [15] studied the occurrence and potential ecological risk assessment of the impact of bauxite mining on the water and sediments in terms of Pb, Cd, Cr, As, etc. Noor et al. [16] summarized the potential health impact of bauxite mining in the Kuantan area.
As shown above, several rivers were studied individually based on different parameters and scales, while our research group studied the pollution levels of three major rivers (Kuantan, Belat, and Galing) in the Kuantan area comprehensively using the same parameters, scales, and methods to compare in parallel [17]. Our previous research revealed that pollution levels in the three rivers (Kuantan River: Class I–III; Belat River: Class I–III; and Galing River: Class I–V) were related to the level of urbanization in the river basin, such as the average land-use proportion for housing and business/services: the Kuantan River (7.78% and 0.829%, respectively) < the Belat River (21.1% and 1.69%, respectively) < the Galing River (30.5% and 5.38%, respectively).
Based on the above results, more detailed monitoring and evaluation in terms of the differences of the aquatic microbial activities are unequivocally required to secure the major water resources. Therefore, the goals of this study were set as: understanding the pollution level and the attained level of the threshold of each river’s self-purification ability and identification of the polluted areas/sources for the four major rivers in Kuantan and the surrounding area.
To achieve these goals, the following research was conducted in this study: (1) more detailed and broader water quality monitoring in the Galing River, which was the most polluted river in the Kuantan area in the previous study; (2) new water quality monitoring of the Pahang River, the largest and most important river in Peninsular Malaysia, which flows through Pahang State; and (3) comprehensive evaluation of the four rivers’ water quality conditions based on the aquatic microbial activities by adding the information from (1) and (2) to previous data.
Overall, water quality information including ion concentrations (anions: sulfates (SO42−), chlorine (Cl−), and nitrate (NO3−), cations: sodium (Na+), potassium (K+), ammonium (NH4+), magnesium (Mg2+), and calcium (Ca2+)) and water quality indexed parameters in the Natural Water Quality Standards (NWQS) for Malaysia (dissolved oxygen, DO; total phosphorus, TP; pH; and chemical oxygen demand, COD) using ion chromatography (IC) and portable water monitoring devices, respectively, were obtained from 41 sampling sites (Pahang River: 6 sites; Kuantan River: 9 sites; Belat River: 7 sites; and Galing River: 19 sites). By using the above monitoring data, grasping the major rivers’ water pollution situations, detailed identification of the polluted river basin area, and understanding the characteristics of the dominant microbial biological reactions in each rivers were achieved.

2. Materials and Methods

2.1. River Water Sampling

In this study, our research group selected four rivers, namely, the Pahang River, Kuantan River, Belat River, and Galing River, to achieve exhaustive water quality evaluation for the high-priority rivers in Pahang State. The first, the Pahang River, is the largest river not only in Pahang State but also in Peninsular Malaysia. The length of the river is 440 km and it drains an area of 29,300 km2, of which 27,000 km2 lie within Pahang (which is about 75% of the state) and 2300 km2 is located in Negeri Sembilan [18]. The second river, the Kuantan River, is the largest river in the capital area of Pahang, Kuantan and the major source of the water supply for domestic, industrial, and agriculture usage, providing 350,000 m3/day and covering 1630 km2 of the catchment area [17,19]. The third, the Belat River, is the 2nd largest river in Kuantan and a source of water supply for domestic usage, covering 43.27 km2 of the catchment area [20]. Finally, the Galing River is located in the most urbanized area in Kuantan, as shown in Figure 1, and its length and catchment area coverage are 7.7 km and 22.7 km2, respectively [21].
To assess the water quality degradation by agricultural/industrial/household wastewater from the river basin area, we collected water samples in the dry season (February to November) based on the average monthly precipitation trend from 2000–2012 in Kuantan, as shown in Figure S1 [22]. Daytime water samples were collected from 6 sites on the Pahang River (in April 2016), 9 sites on the Kuantan River (in June 2014), 7 sites on the Belat River (in June 2014), and 19 sites on the Galing River (in March 2016), as shown in Figure 1. In addition, water samples were collected from 8 sites on the Galing River (in May 2014 and May, August, and November 2015) to compare the pollution condition of the western (G1a-4~6) and eastern (G2-2~3) sides on a long-term basis. All river water samples were collected from the center of the river in the surface water layer, 0 to 15 cm from the surface, using a polyethylene terephthalate bucket water sampler. The ion concentration ratios in downstream sites (P-6, K-7~K-9, B-7, G1a-7, G1a-8, and G2-5) were similar to the ion concentration ratios in seawater [23], suggesting high mixing of river water and seawater, as shown in Figure S2. These downstream sampling points were, therefore, excluded from the study, as it is difficult to assess the anthropogenic impacts on river water composition using the IC system if concentration ratios are affected by seawater. The water samples were collected in polypropylene bottles and stored at 6 °C in a refrigerator after filtration with a 0.45 μm syringe filter for IC monitoring. They were then directly injected into the IC system without dilution after their temperature returned to 25 ± 3 °C in our laboratory. Unfiltered water samples were stored at 6 °C for COD and TP monitoring.

2.2. Reagents

Reagents used for standard samples and eluents were of analytical grade and purchased from Sigma–Aldrich Co. (St. Louis, USA). Solutions were prepared by dissolving reagents in water to a concentration of 0.1 M and then diluting as needed. Water used was obtained from an ELGA-DV25 (ELGA LabWater Co., High Wycombe, UK).

2.3. IC System for Ion Concentration Measurements

The IC system was constructed as follows: dual-head pump for eluent (DP-8020; Tosoh Co., Tokyo, Japan), column oven-equipped sample injector (CTO-10AVP; Shimadzu Co., Kyoto, Japan), conductometric detector (CDD-6A; Shimadzu Co., Kyoto, Japan), and two separation columns packed with polymethacrylate-based weakly acidic cation exchanger (TSKgel Super IC–A/C; column size: 150 × 6.0 mm ID, particle size: 4 μm, exchange group: carboxyl group in H+ form, exchange capacity: 0.1 mEq/mL; Tosoh Co., Tokyo, Japan). The chromatographic separation conditions were selected based on our previous research as follows: eluent: 6 mM tartaric acid and 2 mM 18-crown-6; eluent flow rate of eluent: 0.5 mL min−1; column temperature: 40 °C; injection volume: 30 μL [17]. By using the above optimized conditions, anions were separated based on the anion-exclusion mechanism, while cations were separated based on the cation-exchange mechanism, and simultaneous separation of anions and cations was achieved. Additionally, the calibration curves of the analyte were linear in the 0.050–1.0 mM range, and the correlation coefficients were 0.9958–0.9999. Ionic concentrations of anions and cations contained in the river water samples were determined based on the absolute calibration curve method. The detection limits (S/N = 3) were 0.632–2.22 μM. The relative standard deviations (RSDs) of the peak areas of the analyte ions were 0.40–1.5% under the optimal conditions.

2.4. Analyses of Water Quality Indexed Parameters

In the monitoring of water quality indexed parameters, a portable DO sensor (DO-31P; DKK-TOA Co., Tokyo, Japan) and pH sensor (Cyberscan pH510; Thermo Scientific, Ltd., Waltham, MA, USA) were used for the monitoring of DO and pH, respectively.
A portable UV/Vis detector (DR900; HACH Co., Loveland, CO, USA) with a COD test based on the potassium dichromate method (COD-HR; C-MAC Co., Daejeon, Korea) was used to monitor the COD [24]. In the process of monitoring the COD, 2 mL of the collected sample were added to the COD-HR test glass vial, which was heated for 2 h at 150 °C using a heating reactor (DRB200; HACH Co., Loveland, CO, USA). The heated test glass vials pre-cooled in the reactor for approximately 20 min to 120 °C or less and then cooled to room temperature in a vial rack. The cooled test vials were monitored using the portable UV/Vis detector at 420 nm.
A portable UV/Vis detector with a TP test based on the phosphovanadomolybdate spectrophotometric method (TP-HR; C-MAC Co., Daejeon, Korea) was used to monitor the TP [25]. In the process of monitoring the TP, 5 mL of the collected sample and potassium persulfate were added to the TP-HR test glass vial, which was heated for 30 min at 150 °C using a heating reactor. The heated test glass vials were cooled to room temperature in a vial rack, and 2 mL of 1.54 N sodium hydroxide and 0.5 mL of molybdovanadate reagent were added. After 7 min, the test vials were monitored using the portable UV/Vis detector at 420 nm.

3. Results

3.1. Behavior of the Ionic Concentration and Water Quality Indexed Parameter Values in the Pahang, Kuantan, Belat, and Galing Rivers

Our research group monitored the water quality behaviors of ionic species and the water quality indexed parameters of the Pahang (in April 2016), Kuantan (in June 2014), Belat (in June 2014), and Galing (in March 2016) rivers to compare and understand the water pollution conditions as shown in Figure 2. The average monitoring values for water quality in the up- (P-1 to 3, K-1 to 4, and B-1 to 3) and midstream (P-4 to 5, K-5 to 6, and B-4 to 6) portions of the Pahang, Kuantan, and Belat rivers and those in the western (G1) and eastern (G2) sides of the Galing River were summarized, with their classification based on the National Water Quality Standard for Malaysia (NWQS for Malaysia) (Table S1), as shown in Table S2 [26].

3.1.1. Ionic Species

In the behaviors of anions, SO42−, Cl, and NO3 monitored in the Pahang, Kuantan, and Belat rivers indicated an increasing trend from up- (P-1 to 3, K-1 to 4, and B-1 to 3) to midstream (P-4 to 5, K-5 to 6, and B-4 to 6), as shown in Figure 2A–C. In the case of the Galing River, higher concentration trends were obtained in the western side (G1) compared with the eastern side (G2) in terms of the SO42− and Cl, while a higher NO3 concentration trend was obtained in eastern side (G2). In addition, the highest SO42− and Cl concentration and the lowest NO3 concentration were detected in the Galing River.
In the behaviors of cations, K+ and Mg2+ monitored in the Pahang, Kuantan, and Belat rivers indicated an increasing trend from up- (P-1 to 3, K-1 to 4, and B-1 to 3) to midstream (P-4 to 5, K-5 to 6, and B-4 to 6), as shown in Figure 2F,G. In the case of Na+ concentration, a clear trend was not found in the Pahang, Kuantan, or Belat rivers, and the highest concentrations were detected from K-6 and B-6 in the Kuantan and Belat rivers, respectively, as shown in Figure 2D. Regarding NH4+ concentration, a decreasing trend was seen in the Pahang and Belat rivers, while a clear trend was not seen in the Kuantan River, as shown in Figure 2E. In the case of the concentration of Ca2+, an increasing trend was seen in the Kuantan and Belat rivers, while a clear trend was not seen in the Pahang River, as shown in Figure 2H. Regarding the Galing River, higher concentration trends were obtained in the western side (G1) compared with the eastern side (G2) in terms of all the monitored cations.

3.1.2. Water Quality Indexed Parameters

In the behaviors of the DO value, a decreasing trend from up- to midstream was observed in the Pahang, Kuantan, and Belat rivers, as shown in Figure 2I. In the case of the Galing River, higher DO concentration trends were obtained in the eastern side compared with the western side. Regarding TP, decreasing, stable, and increasing trends were found in the Pahang, Kuantan, and Belat rivers, respectively, as shown in Figure 2J. In addition, a higher TP concentration trend was obtained in the western side compared with the eastern side of the Galing River. In terms of the behaviors of the pH value, they were seen to be almost stable from up- to midstream except from G1a-1, -2, and -3, as shown in Figure 2K. In the case of the COD value, a stable trend was found in the Pahang River, while increasing trends were seen in the Kuantan and Belat rivers, as shown in Figure 2L. In addition, a higher COD concentration trend was obtained in the western side compared with the eastern side of the Galing River.

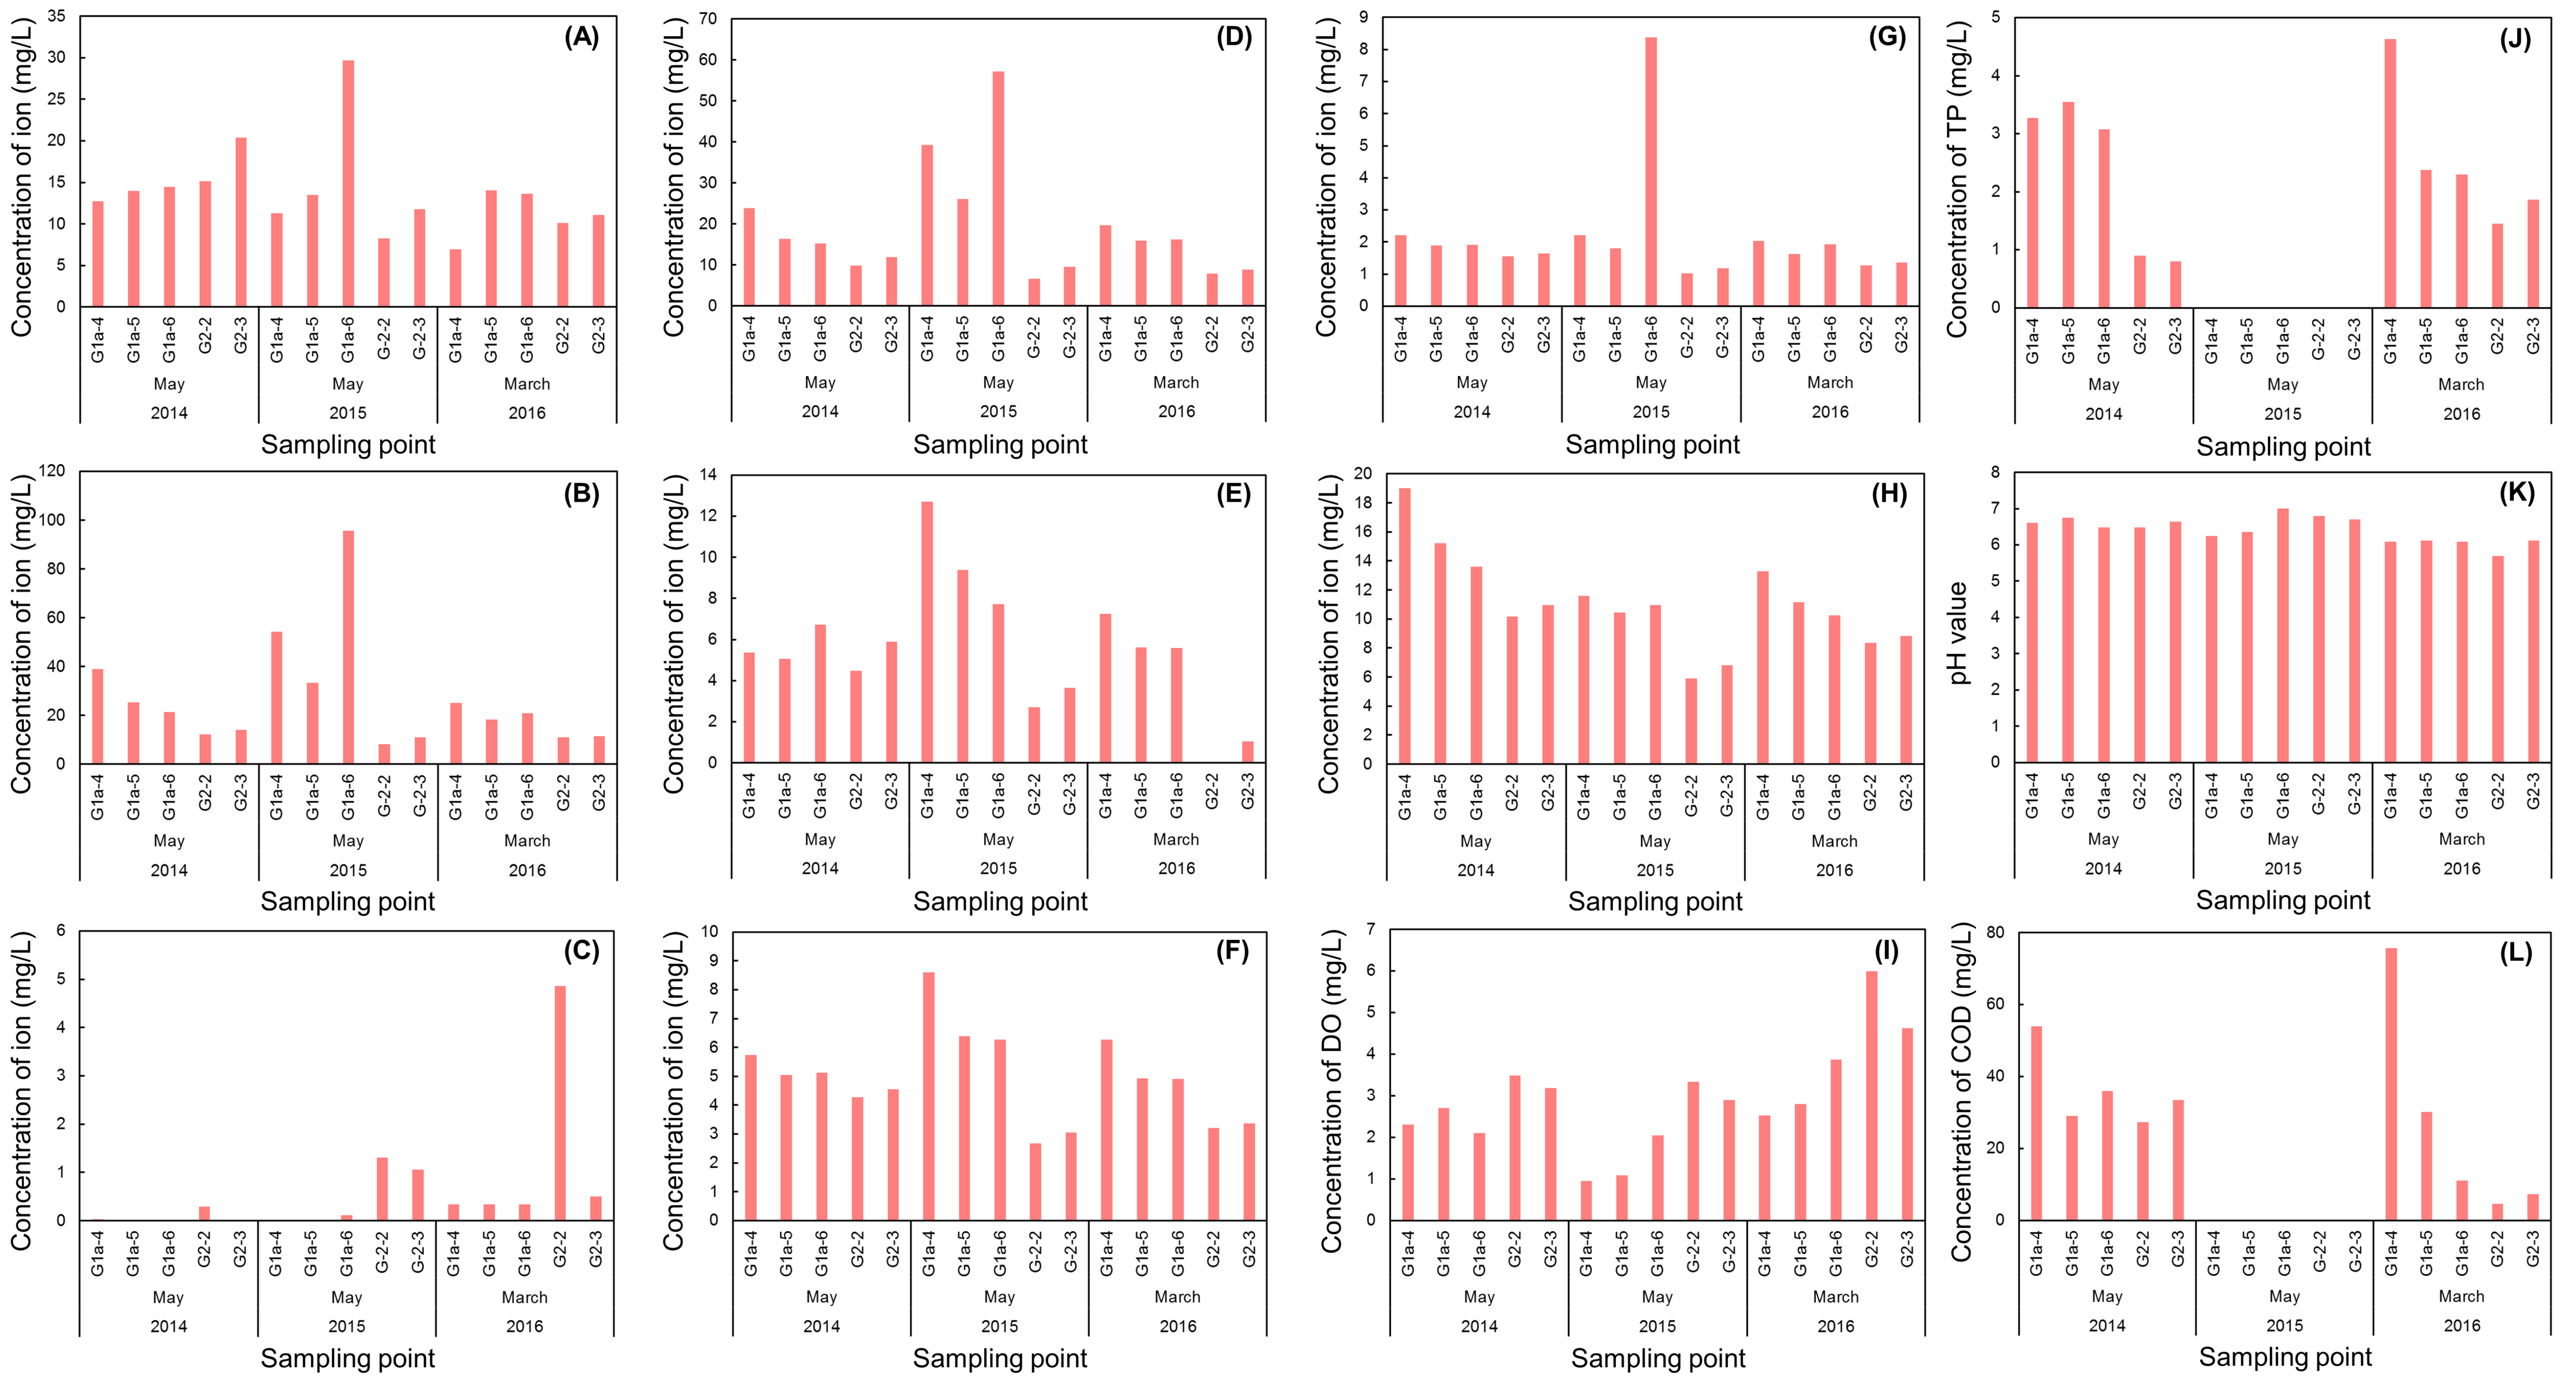
3.2. Long-Term Behaviors of the Ionic Concentration and Water Quality Indexed Parameter Values in the Galing River

Our research group monitored the water quality of the Galing River over three years (May 2014, May, August, and November 2015, and March 2016) to understand the long-term trend and single-year trend of the western (G1a-4~6) and eastern (G2-2~3) sides. All data were illustrated as shown in Figure 3 and Figure 4, and the average value of each side of the Galing River water chemistry for three years is summarized in Tables S3 and S4.

3.2.1. Three Years’ Trend from 2014 to 2016

In the behaviors of all ionic species (Figure 3B,D–H) except SO42− (Figure 3A), NO3 (Figure 3C), TP (Figure 3K), and COD (Figure 3L), higher values were found in the western side compared with the eastern side throughout the three years. On the other hand, opposite trends were observed in the NO3 and DO, as shown in Figure 3C,I, respectively. In the case of pH, similar values were found in the western and eastern sides throughout the three years. Regarding SO42, a clear trend between the western and eastern sides was not found, as shown in Figure 3A. In addition, a dramatic change for the obtained values was not observed, and the eastern and western side trends also remained the same for all monitored parameters for the three years.

3.2.2. Single-Year Trend in May, August, and November 2015

In the behaviors of all ionic species (Figure 4B,D,E,F,G, H) except SO42− (Figure 4A) and NO3 (Figure 4C), higher values were found in the western side compared with the eastern side throughout the year 2015. On the other hand, opposite trends were observed in the NO3 and DO, as shown in Figure 4C,I, respectively. In the case of pH, similar values were found in the western and eastern sides throughout 2015. As with the case in three years’ trend from 2014 to 2016, a dramatic change for the obtained values was not seen, and the eastern and western side trends also remained the same for all monitored parameters in 2015.

4. Discussion

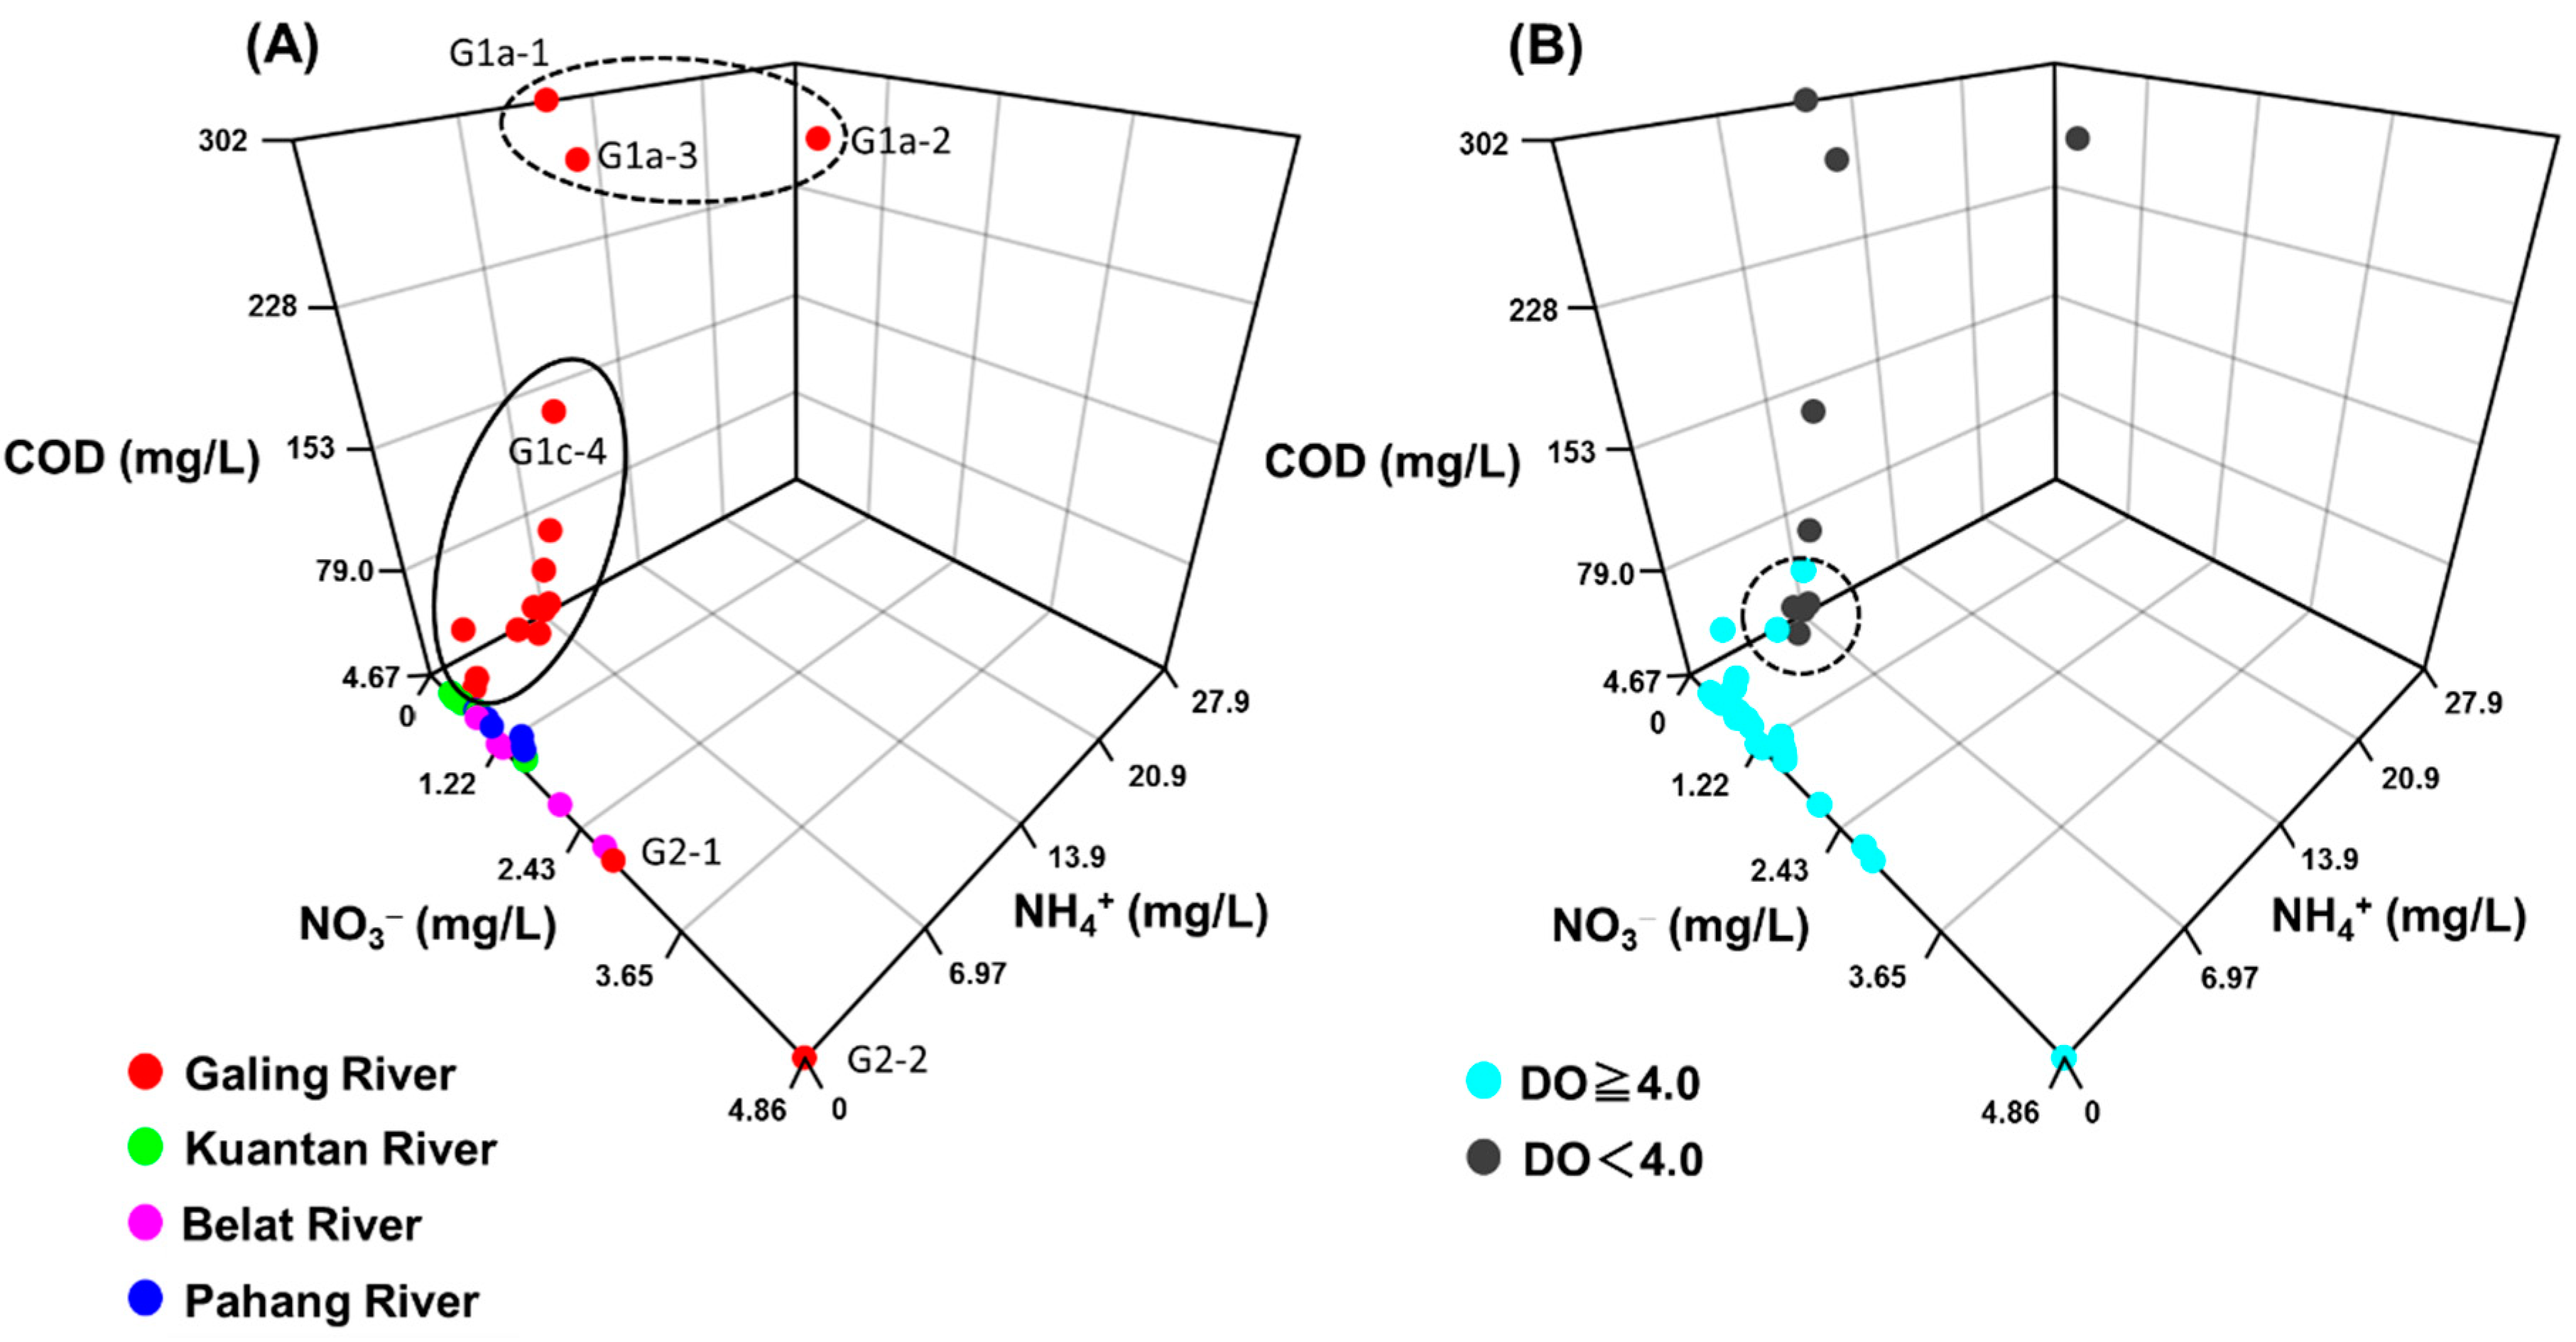
4.1. Statistical Comparison of River Chemistry Data among the Pahang, Kuantan, Belat, and Galing Rivers

In this section, the average concentration of ionic species and water quality index values in each river was compared using the Student’s t-test, as shown in Figure 5, Table 1 [27].
The results of the Student’s t-test showed significant differences (p = 2.40 × 10⁻⁸~3.79 × 10⁻²) in the concentrations of Cl, Na+, K+, NH4+, Ca2+, DO, TP, and COD in the Galing River compared with the Pahang, Kuantan, and Belat rivers, highlighted by the gray cells in Table 1. The observed differences in chemical data are likely due to the variability in land use among the four rivers. The Pahang, Kuantan, and Belat rivers predominantly consist of forest (Pahang: 73.2%; Kuantan: upstream: 74.7%, midstream: 48.2%; and Belat: 15.3%) and agricultural land (Pahang: 16.7%; Kuantan: upstream: 20.2%, midstream: 45.6%; and Belat: 36.2%), while the Galing River basin predominantly consists of housing areas (30.5%), as shown in Figure 6. Combined, these results suggest that these parameters are influenced by human activities, specifically household wastewater released from the basin area.
Significant differences were observed in the concentrations of SO42− between the Galing River and the Pahang and Kuantan rivers, though no significant difference was observed between the Galing River and the Belat River. Additionally, significant differences were shown in the concentrations of Mg2+ between the Galing River and the Kuantan and Belat rivers, while no significant difference was observed between the Galing River and the Pahang River. We therefore concluded that river SO42− and Mg2+ concentrations are not strongly influenced by human activity compared with the above parameters.
Conversely, no significant differences in the concentration of NO3 (p = 8.58~59.3) were observed among the four rivers. Although similar trends in NO3 concentrations were observed in each river, the levels of NO3 concentrations in the Pahang, Kuantan, and Belat rivers were much lower due to the limited human activity in the river basin area. Furthermore, lower observed levels of NO3- are likely due to the nitrate consumption through biological denitrification, which will be discussed in greater detail in Section 4.2.
River water pH tends to vary gradually and is typically influenced by the surrounding geology (area source), human activities (point source), etc. [28,29,30]. River pH remained fairly stable in all rivers of our monitoring study, suggesting that pH is predominantly correlated with the geology of the river basin area. However, sampling sites G1a-1 and G1a-2 showed large changes in pH, which is discussed further in Section 4.3. In addition, the basin zone and rock type of the Kuantan, Belat, and Galing rivers are the same (acidic intrusive, basic intrusive gabbro, Quaternary clay, silt, sand, and peat), while the Pahang River basin area consists of Permian phyllite, volcanics, slate, and shale with subordinate sandstone and schist, Triassic interbedded sandstone, siltstone, and shale, Quaternary clay, silt, sand, and peat [13]. We, therefore, observed significant differences in the pH values between the Pahang River and the other three rivers (p = 6.52 × 10⁻⁵~1.93 × 10⁻³), and no significant differences were observed (p = 13.6~55.2) among the Kuantan, Belat, and Galing rivers (Table 1).
Finally, we observed significant differences in COD concentrations among all monitored rivers based on the land use of the region and the results of the Student’s t-test (Figure 5 and Table 1). Thus, the COD value is a key parameter for effectively evaluating the influence of human activity on river water.

4.2. Inferring River Biological Reactions from WQI and Ionic Concentrations

In this section, the WQI values and ionic concentrations of the four rivers are discussed based on land use and biological activity related to COD.

4.2.1. Aerobic Microbial Activity in the Pahang, Kuantan, and Belat Rivers

The relationships among NO3, NH4+, and COD concentrations in each river are illustrated in Figure 7A, and their correlation with DO concentration is plotted in Figure 7B. In three of the rivers, the Pahang, Kuantan, and Belat, a lower concentration of NH4+ was detected, which is likely attributable to aerobic biological reactions (Equations (1) and (2)) [31,32,33]. In Figure 7A, we observed a linear correlation between NO3, NH4+, and COD in the Pahang, Kuantan, and Belat rivers. In the case of these rivers, similar trends such as the higher average concentrations of NO3 (1.64, 0.969, and 1.34 mg/L, respectively) and lower average concentrations of NH4+ (0.0840, 0.0327, and 0.0400 mg/L, respectively) and the COD (5.66, 1.67, and 21.0 mg/L, respectively) under oxygenated conditions (5.30, 5.66, and 4.90 mg/L, respectively) were detected in the four monitored rivers in this study where microbial aerobic oxidation of organic compounds (Equation (1)) and nitrification (Equation (2)) are facilitated. Our results suggest that the three rivers are able to self-purify following environmental loading of contaminants (COD, TP, etc.) derived from human activities.
(CH2O)106(NH3)16H3PO4 + 14H2O → 39CO2 + 14HCO3 + 53CH4 + 16NH4+ + HPO42−
NH4+ + 1.83O2 + 1.98HCO3 → 0.0210C5H7NO2 + 0.979NO3 + 1.04H2O + 1.88H2CO3

4.2.2. Anaerobic Microbial Activity in the Galing River

The large parts of the Galing River (excluding sites G2-1 and G2-2) showed significant differences in the relationship of COD, NH4+, NO3, and DO concentrations relative to those of the Pahang, Kuantan, and Belat rivers (Figure 7). Lower concentrations of DO and NO3 and higher concentrations of NH4+ were observed in the Galing River. The lower DO values and higher concentration of NH4+ in the river water implies high consumption of the DO in the river water due to the high microbial decomposition of the high concentration of organic compounds (COD) (Equation (3)). Anoxic conditions promote microbial denitrification converting NO3 into nitrogen gas (Equation (4)) [34,35,36]. The correlation between NO3, NH4+, and COD in the Galing River can be grouped into two categories as shown in the solid- and dotted-line circles in Figure 7A. These results are discussed in greater detail in Section 4.3. The river water in the Galing River switches from aerobic to anaerobic conditions when the concentrations of COD and NH4+ are increased, as shown in the dotted-line circles in Figure 7B. The switching point is the threshold level at which the Galing River self-purifies.
(CH2O)106(NH3)16H3PO4 + 14H2O → 39CO2 + 14HCO3 + 53CH4 + 16NH4+ + HPO42−
NO3 + 1.08CH3OH + 0.24H2CO3 → 0.056C5H7O2N + 0.47N2↑+ 1.68H2O + HCO3
Combined, our results demonstrated that almost all biological reactions in the Galing River occurred under anaerobic conditions due to the heavy inflow of household, business/servicing, and industrial wastewater containing high COD concentrations compared with the Pahang, Kuantan, and Belat rivers.

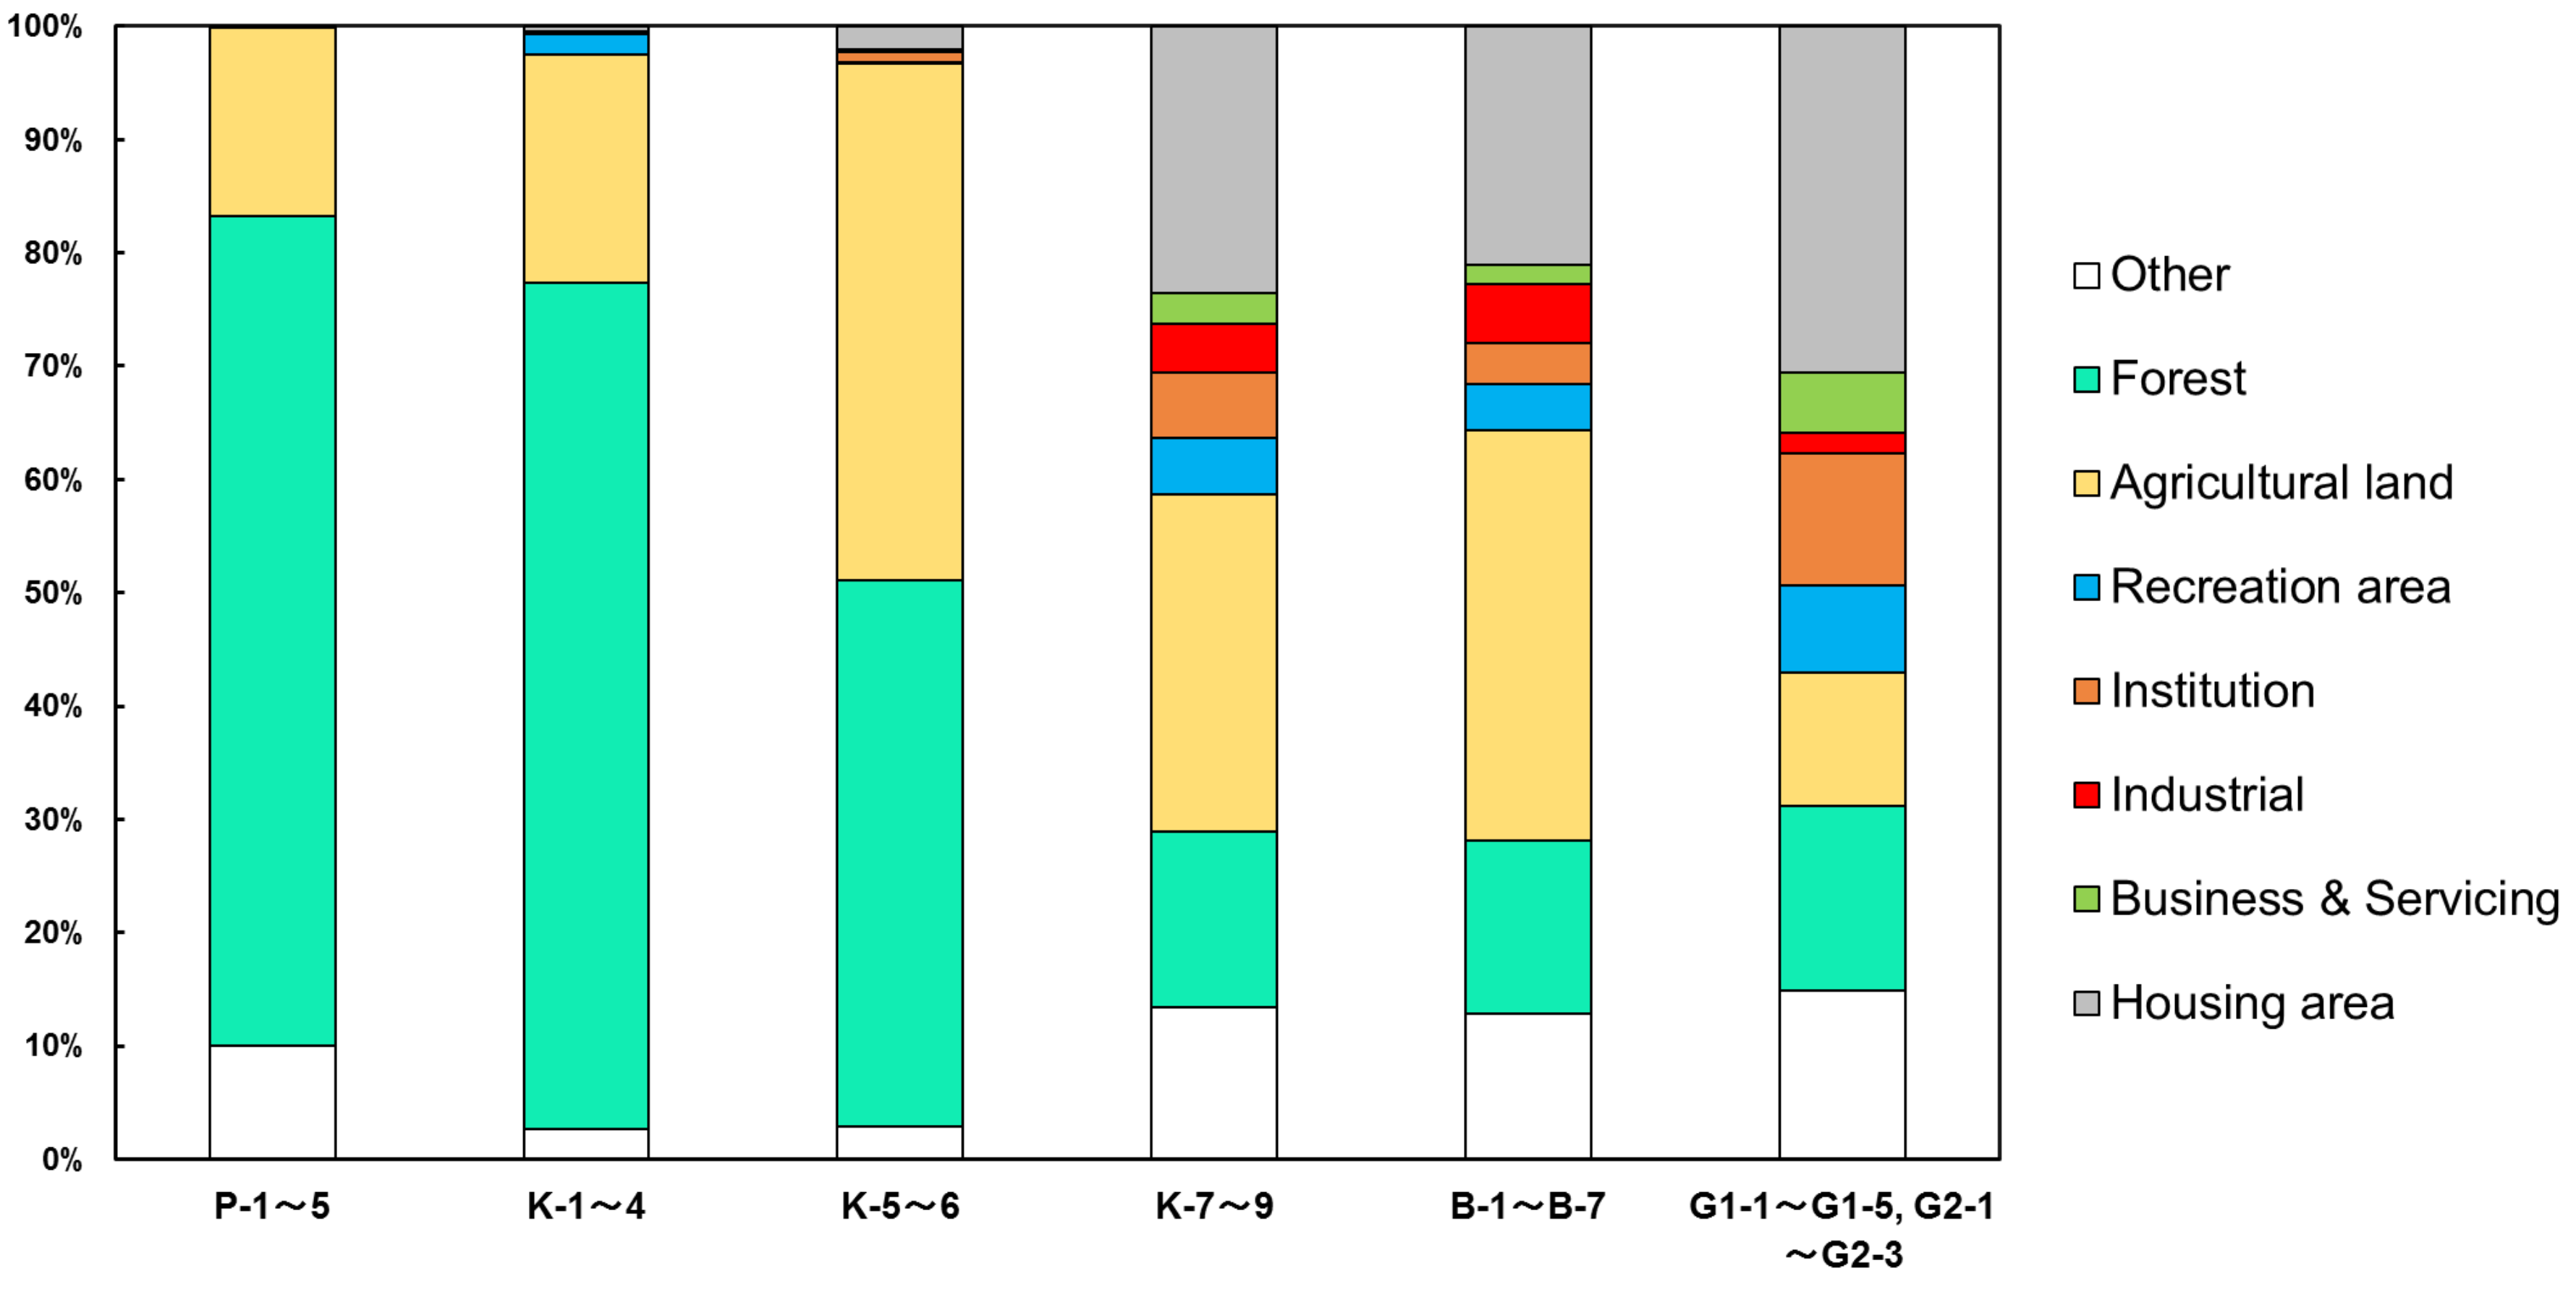
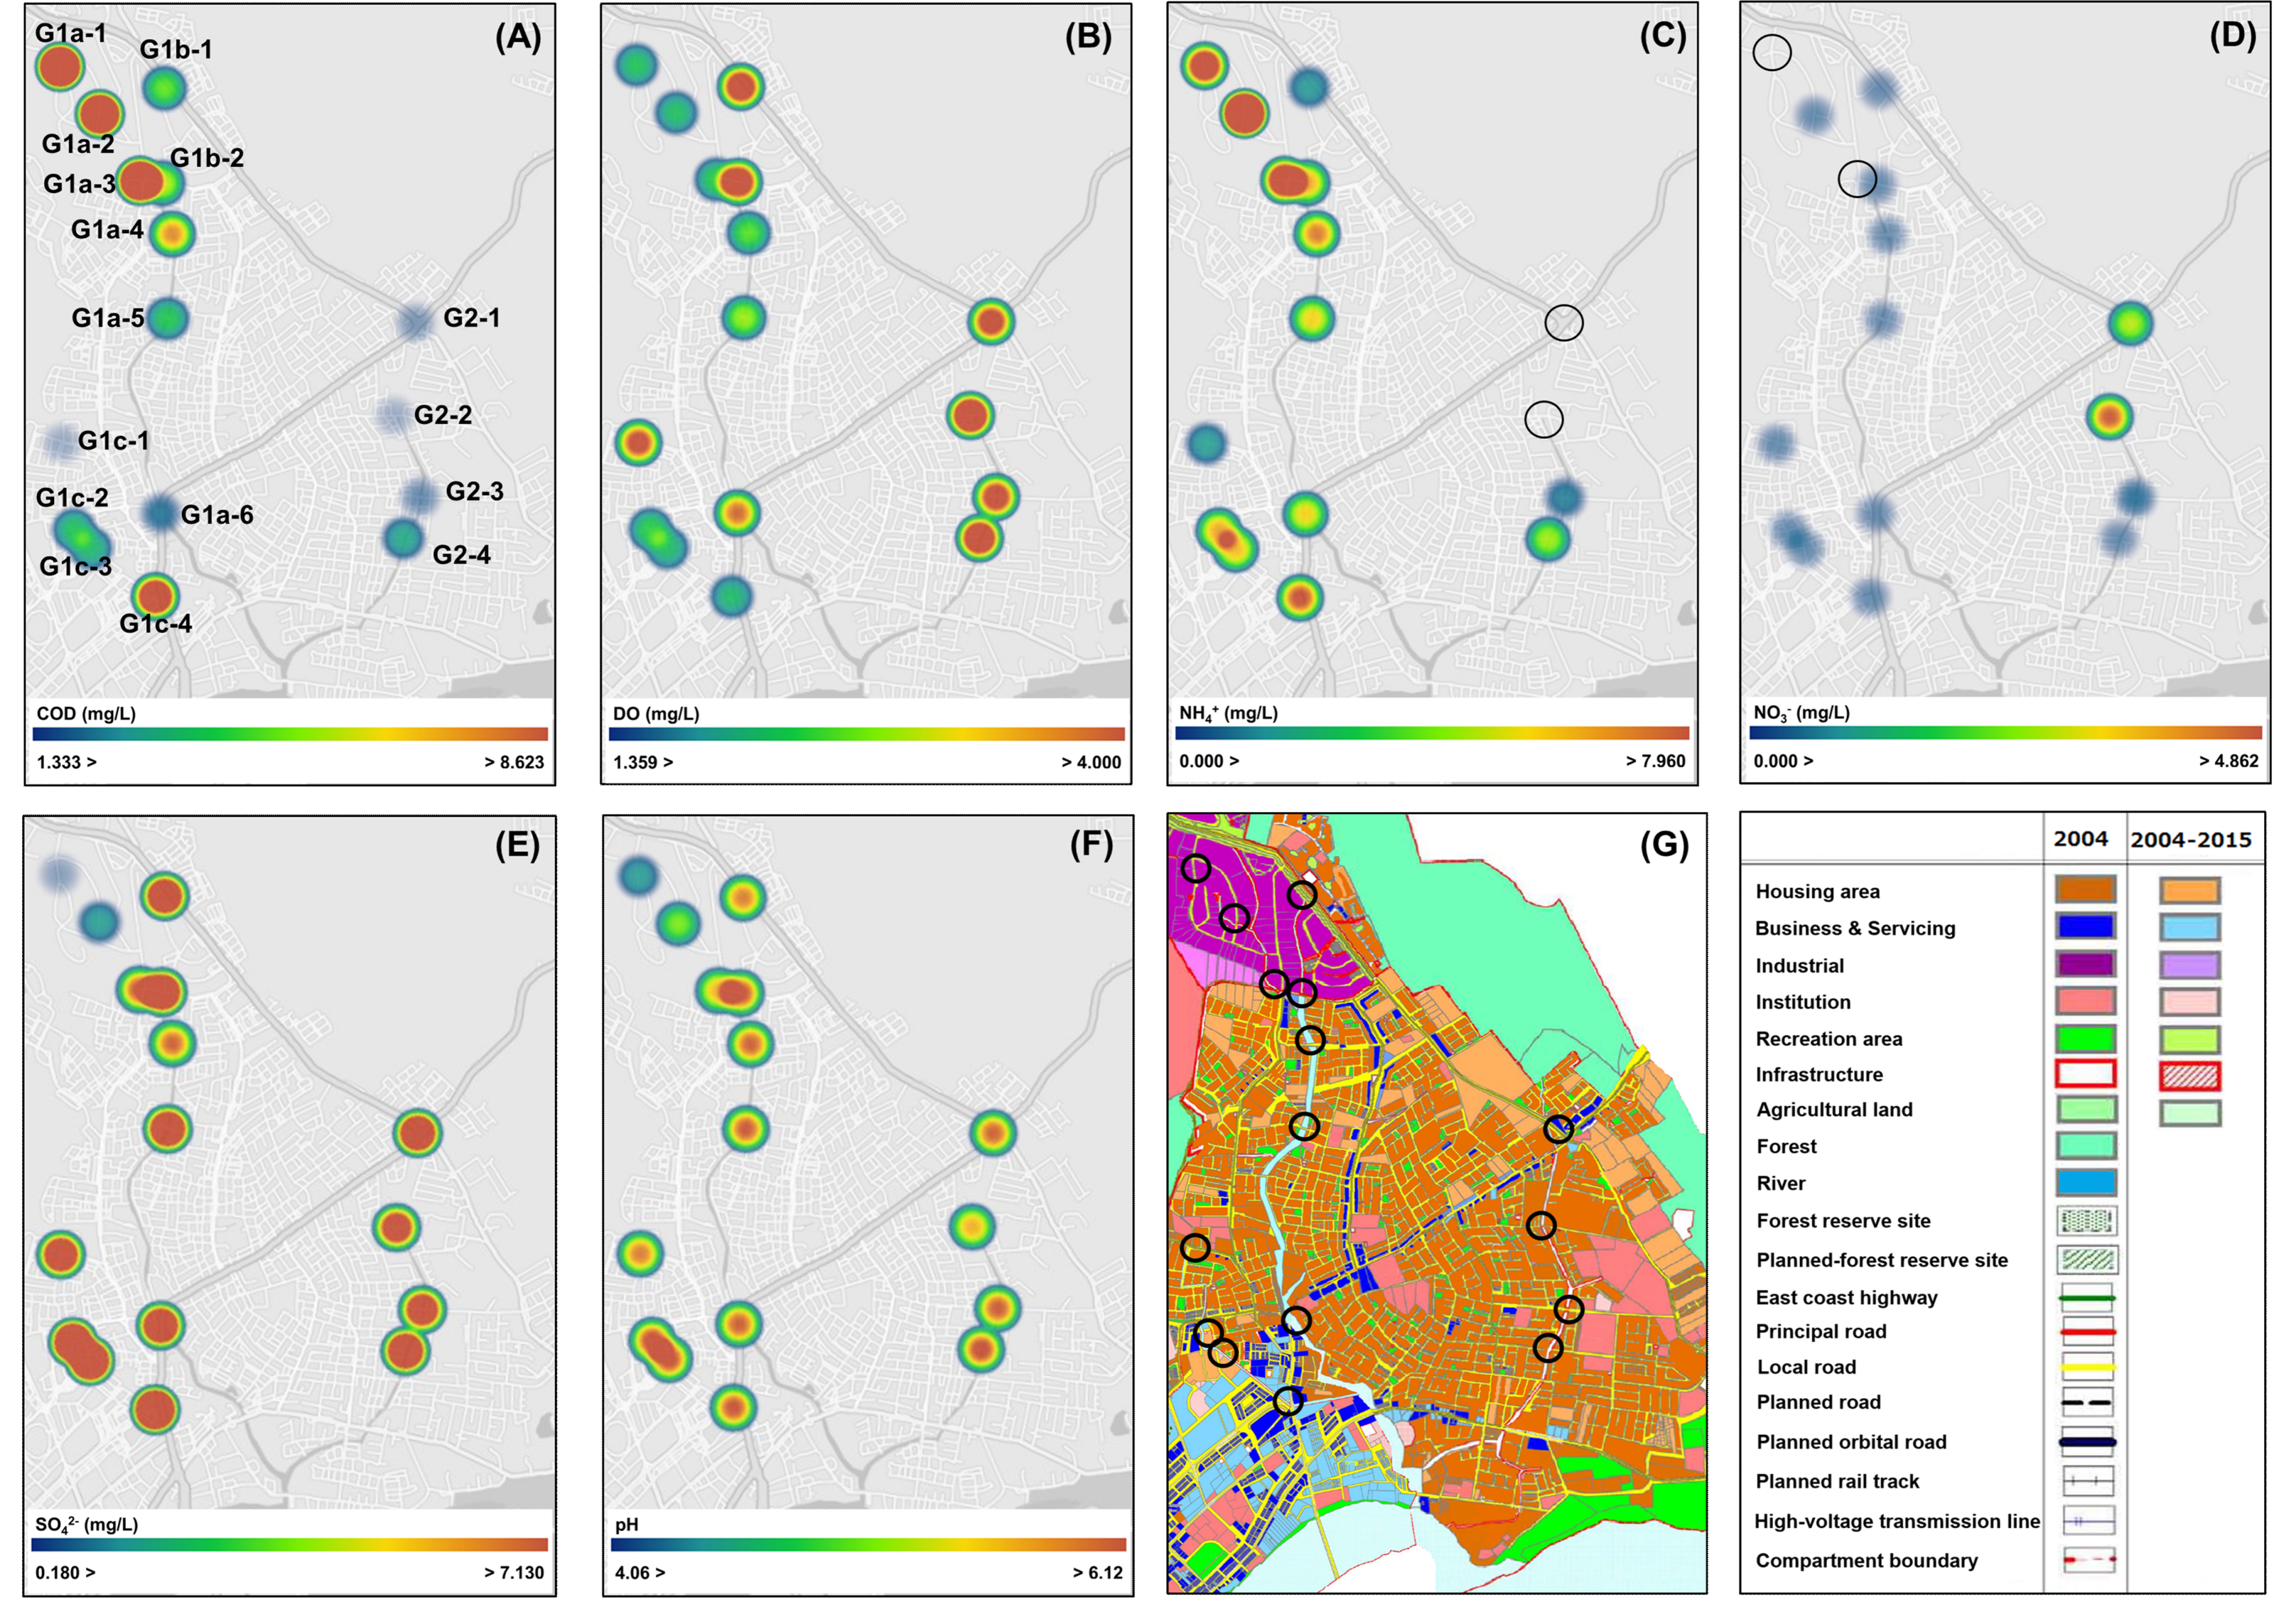
4.3. Identification of Polluted Regions in the Galing River

To evaluate and identify areas of high environmental load in the Galing River, key parameters such as COD, DO, NH4+, NO3, SO42−, and pH were compared with land-use data in Kuantan city, as shown in Figure 8. As shown in Figure 8A, higher COD values were detected on the western side of the Galing River (G1) relative to the eastern side (G2). Higher microbial decomposition of organic matter and subsequent denitrification in anoxic conditions in the western side resulted in lower concentrations of DO and NO3 and higher concentrations of NH4+ (Figure 8B,D,C, respectively). Consistent with the three-year monitoring results (Table S3) and the single-year (Table S4) trend of the western (G1a-4~6) and eastern (G2-2~3) sides, the average values of COD and NH4+ monitored in the western side were constantly higher (COD: 1.31~6.50 times, NH4+: 4.66~29.7 times) than those of the eastern side, while the average values of DO and NO3 monitored in the eastern side were constantly higher (DO: 1.41~2.38 times, NO3: 1.10~11.6 times) than those of the western side. Combined, the results indicate that environmental degradation as a result of human activity is more prolific in the western side of Kuantan city.
The highest COD values were detected at sites G1a-1~3 and G1c-4. Furthermore, lower concentrations of NO3 and DO and high concentrations of NH4+ were monitored at sites G1a-1~3 and G1c-4 (Figure 8B–D). Specific correlations between COD, NO3, and NH4+ were identified at sites G1a-1~3, as illustrated by the dotted-line circle in Figure 7A. We identify these sampling sites as heavily industrialized (Figure 8G), and they are, therefore, associated with higher environmental loading from industrial wastewater. The highest COD and NH4+ concentrations were detected at site G1c-4, as illustrated by the solid-line circle in Figure 7A. This sample site is located in a central business and servicing area in Kuantan city and is, therefore, subject to wastewater containing high concentrations of COD.
The lowest concentrations of SO42− were observed at site G1a-1 (Figure 8C), followed by the second lowest SO42− concentrations downstream at site G1a-2 (Figure 8E). In addition, NO3 was not detected at site G1a-1 and, the lowest pH values were also detected at these sampling sites (Figure 8F). Combined, our results suggest that the river is undergoing sulfur reduction by sulfate-reducing bacteria (Equation (5)) under anaerobic and low NO3 conditions [37,38]. We suggest that the high environmental load from the river basin caused high rates of organic decomposition through sulfur reduction in anoxic conditions. This process caused a decrease in SO42− concentration and lowered the river water pH, as demonstrated in Equation (5).
2CH3OCHOHCOO + SO42− → 2CH3COO + HS + 2HCO3 + H+

5. Conclusions

In this study, our research group monitored ionic concentrations and water quality indexed values of the Pahang, Kuantan, Belat, and Galing rivers located in Kuantan and the surrounding area using IC and portable water monitoring devices. From the obtained data, we observed significant differences in COD concentration among all monitored rivers based on the results of Student’s t-test, suggesting that the COD and the related biological reactions taken together are the key parameter to assess anthropogenic water quality degradation in our study area.
The following aerobic aquatic biological reactions related to the COD were expected based on the monitored river water chemistry data in the Pahang, Kuantan, and Belat rivers: aerobic microbial oxidation of organic compounds and nitrification by nitrifying bacteria. The results suggested that the environmental loading derived from human wastewater in these rivers was under the threshold level of self-purification. On the other hand, the Galing River predominantly experiences anaerobic decomposition of organic compounds through microbial denitrification and sulfate reduction, and the results suggested that the environmental loading from the Galing River basin area was over the threshold level of self-purification. In addition, the western side of the Galing River was more polluted compared with the eastern side. Particularly, we identified high environmental loading from nearby upstream industrial and midstream business/servicing areas, which needs to be addressed based on wastewater treatment, such as aeration for aerobic biological degradation of organic compounds.
As a result, understanding the pollution level and the attained level of the threshold of each river self-purification ability and identifying the polluted areas of the major rivers in Kuantan and the surrounding area was achieved through more detailed monitoring and evaluation in terms of the differences in the aquatic microbial activities.
However, this study focused on the general water quality parameters and ionic species in water samples and the above useful information is the limit of this study. According to Bourg et al. [39] and Withanachchi et al. [40], there is a diurnal variation in water temperature, pH, DO, biological reaction and the monitoring of the diurnal variation in these paramitas will be required to understand the condition of higher pollution area in more detail.
Additionally, the environmental conditions of the Kuantan area have been moderately polluted not only due to the presence of urbanization and industrialization but also due to the mining of bauxite in the area surrounding Kuantan in recent years [15,16]. In terms of directions for future study, different types of samples, such as river sediment, and different types of monitoring methods, such as atomic absorption spectrometry (AAS), cold vapor AAS, etc., to monitor several metal species (Pb, Cd, Cr, As, Al, Hg, etc.) derived from the bauxite mining area will be required in our research to understand the effect of the mining to the surrounding aquatic environment.

Supplementary Materials

The following are available online at https://www.mdpi.com/2071-1050/11/14/3813/s1.

Author Contributions

D.K., N.I.b.H., and M.H.b.A.R. performed data analysis and manuscript drafting, with support from M.M.Y. Water sample collection and analysis was conducted by D.K., N.I.b.H. and supported by C.H.C., M.H.b.E., N.A.b.Y., A.S.b.D., K.S.P., N.S.b.A., K.A/P.A., and S.N. D.K. managed the river water quality analysis of this project. All of the authors read and approved the submitted manuscript.

Funding

This study was supported by JSPS KAKENHI Grant Number 18K18207. We also acknowledge support by the Tosoh Corporation, Bioscience Division for the separation columns used in this study.

Conflicts of Interest

The authors declare no conflict of interest.

References

  1. Philip, H.; Carol, W. The Politics of Environment in Southeast Asia; Psychology Press: Brighton, UK, 1998; pp. 1–28. [Google Scholar]
  2. Economic and Social Commission for Asia and Pacific, United Nations. The State of the Environment in Asia and the Pacific 2005 Economic Growth and Sustainability; United Nations: New York, NY, USA, 2005; pp. 20–113. [Google Scholar]
  3. Aiken, S.R.; Colin, H.L. Environment and Federal Government in Malaysia. Appl. Geogr. 1988, 8, 291–314. [Google Scholar] [CrossRef]
  4. Suleyman, A.M.; Abdul, R.A.; Garoot, S.E. The Impact of Economic Development on Water Pollution: Trends and Policy Actions in Malaysia. Water Resour. Manag. 2008, 22, 485–508. [Google Scholar]
  5. Faridah, O.; Alaa, E.M.E.; Ibrahim, M. Trend analysis of a tropical urban river water quality in Malaysia. J. Environ. Monit. 2012, 14, 3164–3173. [Google Scholar]
  6. Sustainable Development Goals Knowledge Platform. Sustainable Development Goals. United Nations. Available online: https://sustainabledevelopment.un.org/?menu=1300 (accessed on 30 May 2019).
  7. Economic Planning Unit, Prime Minister’s Department, Government of Malaysia. Malaysia Sustainable Development Goals Voluntary National Review 2017; Government of Malaysia: Kuala Lumpur, Malaysia, 2017.
  8. The Source of Malaysia’s Official Statistics. Key Summary Statistics for Local Authority Areas, Malaysia, 2010; Department of Statistics: Kuala Lumpur, Malaysia, 2010.
  9. JPBD Pahang Town and Country Planning Department. Kuantan 2015; Pahang Town and Country Planning Department: Kuantan, Malaysia, 2015.
  10. Rashid, Z.A.; Amal, M.N.A.; Shohaimi, S. Water Quality Influences on Fish Occurrences in Sungai Pahang, Maran District, Pahang, Malaysia. Sains Malaysia. 2018, 47, 1941–1951. [Google Scholar] [CrossRef]
  11. Rahman, M.M.; Awang, M.B.; Jalal, K.C.A.; Aisha, S.; Kamaruzzaman, B.Y. Study on Toxic Chemicals in Kuantan River During Pre And Post Monsoon Season. Aust. J. Basic Appl. Sci. 2013, 7, 24–30. [Google Scholar]
  12. Lee, K.Y.; Ho, L.Y.; Tan, K.H.; Tham, Y.Y.; Ling, S.P.; Qureshi, A.M.; Ponnudurai, T.; Nordin, R. Environmental and Occupational Health Impact of Bauxite Mining in Malaysia: A Review. Int. Med. J. Malays. 2017, 16, 137–150. [Google Scholar]
  13. Mazhar, M.I.; Shoaib, M.; Farid, H.U.; Lee, J.L. Assessment of Water Quality Profile Using Numerical Modeling Approach in Major Climate Classes of Asia. Int. J. Environ. Res. Public Health 2018, 15, 2258–2283. [Google Scholar]
  14. Wan Ishak, W.M.F.B. Development of an Automatic Monitoring System for the Assessment of Water Quality in Galing River, Kuantan, Advances In Bio-Informatics, Bio-Technology and Environmental Engineering ABBE 2014, Birmingham, UK, 16–17 November 2014; Institute of Research Engineers and Doctors: New York, NY, USA, 2014. [Google Scholar]
  15. Kusin, F.M.; Rahman, M.S.A.; Madzin, Z.; Jusop, J.; Yusuff, F.M.; Ariffin, M.; Syakirin, M.M.Z. The Occurrence and Potential Ecological Risk Assessment of Bauxite Mine-impacted Water and Sediments in Kuantan, Pahang, Malaysia. Environ. Sci. Pollut. Res. 2017, 24, 1306–1321. [Google Scholar] [CrossRef]
  16. Noor, H.A.; Norlen, M.; Lokman, H.S.; Thahirahtul, A.Z.; Daud, A.R. Potential Health Impacts of Bauxite Mining in Kuantan. Malays. J. Med. Sci. 2016, 23, 1–8. [Google Scholar]
  17. Kozaki, D.; Ab. Rahim, M.H.B.; Wan Ishak, W.M.F.B.; Yusoff, M.M.; Mori, M.; Nakatani, N.; Tanaka, K. Assessment of the River Water Pollution Levels in Kuantan, Malaysia, Using Ion-Exclusion Chromatographic Data, Water Quality Indices, and Land Usage Patterns. Air Soil Water Res. 2016, 9, 1–11. [Google Scholar] [CrossRef]
  18. Tachikawa, Y.; James, R.; Abdullah, K.; Desa, M.N.B.M. Catalogue of Rivers for Southeast Asia and the Pacific-Volume V, 7-5 Pahang River; Hydrology and Water Resources Research Laboratory, Kyoto University: Kyoto, Japan, 2004. [Google Scholar]
  19. Ahmad, S.M.S.; Hafizan, J.; Azman, A.; Mohd, K.A.K.; Mohd, F.K.; Mohd, E.T.; Nor Azlina, A.A.; Che Noraini, C.H.; Mohd, S.S. Flood risk pattern recognition using chemometric technique: A case study in Kuantan River Basin. J. Teknol. 2015, 72, 137–141. [Google Scholar]
  20. Yusof, N.M. Effect of the Wind-Induced on Road Accident Along East Coast Expressway. Open Access Repository of UMP Research & Publication. 2012. Available online: http://umpir.ump.edu.my/7922/1/NORAIN_BINTI_MD_YUSOF.PDF (accessed on 30 May 2019).
  21. Kozaki, D.; Harun, N.I.B.; Rahim, M.H.B.A.; Mori, M.; Nakatani, N.; Tanaka, K. Determination of Water Quality Degradation Due to Industrial and Household Wastewater in the Galing River in Kuantan, Malaysia Using Ion Chromatograph and Water Quality Data. Environments 2017, 4, 35. [Google Scholar] [CrossRef]
  22. Japan Meteorological Agency. Locational Data Graphs (The World Weather Data Tool). Available online: http://www.data.jma.go.jp/gmd/cpd/monitor/climatview/graph_mkhtml.php?&n=48657&p=24&s=1&r=1&y=2013&m=9&e=0&k=0 (accessed on 30 May 2019).
  23. Nikanorov, A.M.; Brazhnikova, L.V. Chapter 3: Water chemical composition of rivers, lakes and wetlands. In Types and Properties of Waters—Encyclopedia of Life Support Systems; Khublaryan, M.G., Ed.; Eolss Publishers: Oxford, UK, 2009; Volume 2, pp. 42–79. [Google Scholar]
  24. United States Environmental Protection Agency. Federal Register: Ranges 3 to 150 mg/L COD and 20 to 1500 mg/L COD for Wastewater Analyses (Standard Method 5220 D); United States Environmental Protection Agency: Washington, DC, USA, 1980.
  25. Standard Methods for the Examination of Water and Wastewater (Standard Methods); 4500-P Phosphorus: C; Vanadomolybdophosphoric Acid Colorimetric Method American Public Health Association; American Water Works Association and Water Environment Federation: Washington, DC, USA, 1999.
  26. Water Environment Partnership in Asia (WEPA), Ministry of the Environment of Japan. National Water Quality Standards for Malaysia. Available online: http://www.wepa-db.net/policies/law/malaysia/eq_surface.htm#pagetop (accessed on 5 July 2019).
  27. Gardener, M. (Ed.) Statistics for Ecologists Using R and Excel: Data Collection, Exploration, Analysis and Presentation (Data in the Wild), 2nd ed.; Pelagic Publishing: Exeter, UK, 2017. [Google Scholar]
  28. Muhammad, A.A.; Mohd, J.M.; Ismail, Y. Morphology, Geology and Water Quality Assessment of Former Tin Mining Catchment. Sci. World J. 2012, 2012, 1–15. [Google Scholar] [Green Version]
  29. Monique, L.N.; Charles, C.R.; Kathleen, A.D. Influence of Bedrock Geology on Water Chemistry of Slope Wetlands and Headwater Streams in the Southern Rocky Mountains. Wetlands 2011, 31, 251–261. [Google Scholar]
  30. Ake, N.; Lars, H. Relationships between drainage area characteristics and lake water quality. Environ. Geol. Water Sci. 1992, 19, 75–81. [Google Scholar]
  31. Pena, M.A.; Katsev, S.; Oguz, T.; Gilbert, D. Modeling dissolved oxygen dynamics and hypoxia. Biogeosciences 2010, 7, 933–957. [Google Scholar] [CrossRef] [Green Version]
  32. Hall, E.R.; Murphy, K.L. Estimation of nitrifying biomass and kinetics in wastewater. Water Res. 1980, 14, 297–304. [Google Scholar] [CrossRef]
  33. Tanaka, K. Determination of bicarbonate ion in biological nitrification process water by ion-exclusion chromatography with coulometric detection. Bunseki Kagaku 1981, 30, 358–362. (In Japanese) [Google Scholar] [CrossRef]
  34. Martin, R.E.; Taphonomy, A. Process Approach; Cambridge University Press: Cambridge, MA, USA, 1999. [Google Scholar]
  35. Knowles, R. Denitrification. Microbiol. Rev. 1982, 46, 43–70. [Google Scholar]
  36. Hamlin, H.J.; Michaels, J.T.; Beaulaton, C.M.; Graham, W.F.; Dutt, W.; Steinbach, P.; Losordo, T.M.; Schrader, K.K.; Main, K.L. Comparing denitrification rates and carbon sources in commercial scale upflow denitrification biological filters in aquaculture. Aquac. Eng. 2008, 38, 79–92. [Google Scholar] [CrossRef]
  37. Thauer, R.K.; Jungermann, K.; Decker, K. Energy conservation in chemotrophic anaerobic bacteria. Bacteriol. Rev. 1977, 41, 100–180. [Google Scholar] [PubMed]
  38. Bryant, M.P.; Varel, V.H.; Frobish, R.A.; Isaacson, H.R. Biological Potential of Thermophilic Methanogenesis From Cattle Wastes; Academic Press: Exeter, UK, USA, 1977; pp. 347–359. [Google Scholar]
  39. Bourg, A.C.; Bertin, C. Diurnal variations in the water chemistry of a river contaminated by heavy metals: Natural biological cycling and anthropic influence. Water Air Soil Pollut. 1996, 86, 101–116. [Google Scholar] [CrossRef]
  40. Withanachchi, S.S.; Ghambashidze, G.; Kunchulia, I.; Urushadze, T.; Ploeger, A. Water Quality in SurfaceWater: A Preliminary Assessment of Heavy Metal Contamination of the Mashavera River, Georgia. Int. J. Environ. Res. Public Health 2018, 15, 621. [Google Scholar] [CrossRef] [PubMed]
Figure 1. Map of the study location indicating the sampling site.
Sustainability 11 03813 g001
Figure 2. Behavior of the ionic concentration and water quality indexed parameter values in the Pahang, Kuantan, Belat, and Galing rivers; (A) SO42, (B) Cl, (C) NO3, (D) Na+, (E) NH4+, (F) K+, (G) Mg2+, (H) Ca2+, (I) dissolved oxygen; DO, (J) total phosphorus; TP, (K) pH, (L) chemical oxygen demand; COD in the Pahang (A-1 to 5), Kuantan (K-1 to 6), Belat (B-1 to 6), and Galing rivers (G1a-1 to G2-4).
Sustainability 11 03813 g002
Figure 3. Three years’ trend of the ionic concentration and water quality indexed parameter values in the western and eastern sides of the Galing River from 2014 to 2016; (A) SO42, (B) Cl, (C) NO3, (D) Na+, (E) NH4+, (F) K+, (G) Mg2+, (H) Ca2+, (I) DO, (J) TP, (K) pH, (L) COD in the western side (G1a-4 to Ga-6) and eastern side (G2-2 to G2-3) of the Galing River.
Sustainability 11 03813 g003
Figure 4. Single-year trend of the ionic concentration and water quality indexed parameter values in the western and eastern sides of the Galing River in May, August, and November 2015; (A) SO42, (B) Cl, (C) NO3, (D) Na+, (E) NH4+, (F) K+, (G) Mg2+, (H) Ca2+, (I) DO, and (J) pH in the western side (G1a-4 to Ga-6) and eastern side (G2-2 to G2-3) of the Galing River.
Sustainability 11 03813 g004
Figure 5. Comparison of the average concentration of ionic species, DO, TP, pH, and COD in the Pahang, Kuantan, Belat, and Galing rivers.
Sustainability 11 03813 g005
Figure 6. Land-use percentage in the Pahang, Kuantan, Belat, and Galing river basins. Note: This is based on the data obtained from the Jabatan Perancangan Bandar dan Desa (JPBD) Pahang Town and Country Planning Department and Hydrology and Water Resources Research Laboratory, Kyoto University [9,18].
Sustainability 11 03813 g006
Figure 7. Relationships among the concentration of NO3, NH4+, and COD in the Galing, Kuantan, Belat, and Pahang rivers.
Sustainability 11 03813 g007
Figure 8. Changes in (A) COD, (B) DO, (C) NH4+, (D) NO3, (E) SO42, (F) pH, and (G) land usage in the Galing River and basin area. Note: Figure 8 (G) is based on the data obtained from the JPBD Pahang Town and Country Planning Department [9].
Sustainability 11 03813 g008
Table 1. p value from Student’s t-test for inorganic ionic species and water quality indexed parameters of the Natural Water Quality Standards (NWQS) for Malaysia.
Tested Riversp-Value of Student’s t-Test (%)
Inorganic Ionic SpeciesWater quality indexed parameters of the NWQS for Malaysiaa
River 1/River 2SO42−ClNO3Na+NH4+K+Mg2+Ca2+DOTPpHCOD
Pahang/Kuantan12.773.415.411.6 × 10−38.002.5836.7 × 10−419.3 × 10−223.123.619.3 × 10−42.49
Pahang/Belat53.57.4550.248.4 × 10−212.212.662.4 × 10−437.6 × 10−227.45.5465.0 × 10−621.0 × 10⁻²
Pahang/Galing15.3 × 10−356.2 × 10−48.5811.3 × 10−415.1 × 10−324.0 × 10−286.127.5 × 10−526.9 × 10−314.0 × 10−220.1 × 10−41.17
Kuantan/Belat24.727.119.37.2050.611.652.137.88.309.1255.22.40
Kuantan/Galing38.8 × 10−463.0 × 10−459.327.5 × 10−50.14216.9 × 10−344.5 × 10−424.0 × 10−728.0 × 10−418.5 × 10−213.61.91
Belat/Galing7.8311.3 × 10−39.6944.7 × 10−50.14372.9 × 10−334.6 × 10−460.9 × 10−719.0 × 10−11.0222.63.79

