1. Introduction
The growing openness and integration of the world has led to an increase in the importance of comparing individuals, organizations, countries, and regions. In the context of ensuring the sustainable economic development of countries, an objective assessment of the current situation, possibilities, and capabilities when compared with competitors is important. Competitiveness analysis is focused on identifying and characterizing decisive factors, and nowadays, considerable attention is paid to the countries’ competitiveness assessment. Porter [
1] belongs to the group of initiators of this research science, as he investigated business competitiveness and understood the close link between micro and macro levels. The business environment creates conditions for the competitiveness of enterprises, which is then reflected in the country’s competitiveness. The basis of this system are the skills, decisions, and real performance of businesses. However, more sophisticated strategies and more productive activities require more educated people, better information, more effective government decisions, better infrastructure, developed research institutions, and so on. Therefore, a higher quality, productivity, and market success of business production is reflected in the country’s export performance, in its economic growth, and, ultimately, in the higher standard of living of its inhabitants.
The many years of crises that lie behind us—the financial crisis, the euro area sovereign debt crisis, and now the migration crisis—have put Europe to the test. National interests of member states have regained prominence and policy debates are often dominated by questions of competitiveness. Moreover, integrated markets and human resources are the backbone of Europe’s prosperity.
The European economy is currently facing a long-awaited dynamic recovery. Consumer and business confidence are rising, and industrial production growth is accelerating. Even more encouragingly, the upturn is broad-based, driven not only by domestic consumption but increasingly by investment and export stimulus from a growing global economy. However, these short-term successes should not disguise the long-term challenges facing the European economy. Therefore, the recent economic recovery gives no grounds for complacency. Instead, the opportunity must be taken to improve the potential for sustainable long-term growth in Europe [
2].
Decisive measures are needed to raise Europe’s competitiveness in order to support higher levels of productivity, employment, and prosperity. The effects of the crisis have exacerbated structural weaknesses and contributed to a legacy of economic and policy challenges that need to be tackled. These challenges have been made more pressing by the unprecedented rise in migration witnessed over the past year, and which—in all likelihood—will continue in the near future. The way to tackle these challenges is through deeper European market integration, further cohesion and convergence, strengthening and development of markets, and an increase of efforts to make Europe stronger and more competitive. Openness, innovation, skills development, and the free movement of goods and services, labor, and capital are the drivers of Europe’s competitiveness, growth, and prosperity. Furthermore, according to the European Investment Bank, gaps exist in European investment in business innovation and investment in human capital is also needed to sustain European competitiveness over the long-term [
3].
As reported by [
4], international competitiveness has long been a major preoccupation of economic thought and has been receiving increasing attention from scientists, policy makers, businesses and the general population alike. According to [
5], the analysis of competitiveness allows an appreciation of the extent to which the various economies of the world’s countries have managed to face economic challenges. The competitiveness has been and remains a priority in the plan of the scientific debate, but also a major concern for all world economies. Economic policies and institutional reforms were accepted as basic tools for an increase in intensity of the competitiveness and sustainable performance. A country’s competitiveness is variously measured and the level of competitiveness comprises many variables of economic prosperity. The various determinant factors of competitiveness and country specific macroeconomic indicators allow classification of the world economies in different stages of development.
The main aim of this paper was to detect the significant interrelations among the assessment of global competitiveness, business environment as well as human development in the EU (28) countries for the period of 2006–2017. In addition, we also analyzed other economic relations and implications on the global scale. What is the level of Europe’s potential in the context of long-term global competitiveness? Is Europe an equally attractive investment place for entrepreneurship and small and medium-sized enterprises (SMEs)? What about the effect of human resources’ quality and demographic trends in Europe? Is there a significant economic impact of the business environment and human capital on an increasing multidimensional perceived competitiveness within the EU (28) countries? In this research paper, we focused on finding answers to the above questions and SMEs related issues. The paper is a more detailed and in-depth continuation of our previous research studies concerning the global competitiveness and economic growth of European countries [
6].
Our findings in this study indicate the important impact of the quality of a business environment measured by the DBI and an effective human resources movement measured by the HDI as competitive advantages on global competitiveness.
The paper is organized as follows. Firstly, we review the empirical literature related to the issue concerning competitiveness, the business environment, and human development on the global scale. These closely interconnected economic categories are analyzed in the form of internationally known multi-criteria indices. In the next chapter, we briefly introduce the methodology and analyzed data. The initial empirical part of the study focused on the development analysis of the above mentioned indices within the EU (28) member states over the years 2006 to 2017. The following partial analyses evaluate the results of individual regression models designed in order to detect the significant interrelations among the assessment of global competitiveness, the business environment as well as human development in the EU (28) countries during the monitored period. In line with the performed analyses, the last partial analysis was focused on the verification of the designed models and prediction of the GCI score for 2018 on the basis of the DBI. The last two chapters discuss the main results in the broadest context possible and also highlight the limitations and future research directions.
3. Materials and Methods
The main aim of this paper was to detect the significant interrelations among the assessments of global competitiveness, the business environment as well as human development in the EU (28) countries for the period 2006–2017.
The input variables of the created models consisted of the following indices: The global competitiveness index (GCI), doing business index (DBI), and human development index (HDI). In this regard, the DBI analyzes a country’s business environment in terms of its attractiveness to investors; the HDI is focused on the level of human development and potential as an important factor for the development and sustainability of a country. Within the realized regression analysis, the DBI and HDI represent independent model variables, while the GCI represents the dependent variable.
The data relating to individual indices were collected based on annually published online reports over the period of 2006 to 2017 and processed by STATISTICA software (version 13).
To perform the analysis, for the aggregation of EU (28) countries, we included the following states: Austria (AT), Belgium (BE), Bulgaria (BG), Croatia (HR), Cyprus (CY), Czech Republic (CZ), Denmark (DK), Estonia (EE), Finland (FI), France (FR), Germany (DE), Greece (EL), Hungary (HU), Ireland (IE), Italy (IT), Latvia (LV), Lithuania (LT), Luxembourg (LU), Malta (MT), the Netherlands (NL), Poland (PL), Portugal (PT), Romania (RO), Slovakia (SK), Slovenia (SI), Spain (ES), Sweden (SE), and the United Kingdom (UK).
The descriptive statistics of input variables are presented in
Table 1. Attention should be given to the mean, median, and standard deviation, as well as the minimum and maximum values of individual indices within the period 2006–2017. In addition, the brackets contain particular values, state abbreviations, and the year in which the minimum and maximum values were recorded.
The panel analysis determined the relationship between the dependent variable (GCI) and independent model variables represented by the DBI and HDI. Within the panel data analysis, we focused on time series analysis (2006–2017) on a sample of 28 European countries, which represented a set of 329 observations.
The panel data were a combination of cross-sectional and time data. For the panel data, a time series for each entity was used within the cross-section selection. Most often, panel data is used to examine the evolution of different units from the same sector, market, or geographical unit, with a broad cross-sectional structure and only a few time periods [
50,
51,
52].
The basic regression model of panel data is:
where the index,
i, denotes the cross-sectional dimension,
i = 1,…,
n; the index,
t, is the time dimension,
t = 1,…,
T; the variables,
x1 to
xk, are explanatory variables not including the unit vector; and the variables,
z1 to
zq, represent individual effects—the diversity that can distinguish an individual or a whole group from other entities—and a possible unit vector was included here. Individual effects do not change with time. Under the above framework [
53,
54], three basic cases were distinguished:
- 1.
Pooled Regression—if the individual effect is only a unit vector, which means that the single α parameter is a common constant, then the resulting model is:
- 2.
Fixed Effects Model (FEM)—if the individual effects of
z1 to
zq are unobservable but correlated with the explanatory variables, the solution is to include all effects in the estimable conditional average using the relation,
αi = α1zi1 + α2zi2 + … + αqziq, and the resulting
FEM model is:
where the fixed effect,
αi, means a specific constant for each cross-sectional unit.
- 3.
Random Effect Model (REM)—if the individual effects of
z1 to
zq are unobservable but not correlated with the explanatory variables, the solution is a compound random component,
εi + uit, which, in addition to the original one, also assumes a specific random component for each cross-sectional unit and
REM model, which is:
The Hausman specification test was used to choose between the FEM and REM models. The null hypothesis assumes that the parameter estimates of the generalized least squares method in the REM model and the least squares method in the FEM model are consistent, thus the least squares estimate is not efficient. In an alternative hypothesis, only the least squares method is consistent. If the value of the statistics is
H > χ2c, then we reject the null hypothesis about the consistency of both estimators and the FEM model is more suitable. If the value of the statistics is
H < χ2c, then we cannot reject the null hypothesis and the REM model will be recommended [
54].
In accordance to the above mentioned theoretical approaches and the main aim of this research paper, the following hypotheses were set:
Hypotheses 1 (H1). There is a statistically significant relation between the assessment of global competitiveness (GCI) and the business environment (DBI) within the EU (28) countries.
Hypotheses 2 (H2). There is a statistically significant relation between the assessment of global competitiveness (GCI) and human development (HDI) within the EU (28) countries.
To detect the existence of a correlation between the independent variable (GCI) and the two dependent variables (DBI and HDI), the regression analysis methodology was applied to estimate the regression model coefficients.
In the context of global competitiveness assessment, regression models have been applied in many research studies. The authors [
1] studied the influence of various indicators related to the knowledge of economy on country competitiveness in the European Union (EU). Based on the Pearson coefficient and panel-data regression models, the authors analyzed the GCI in relation to research and development (R&D) expenditure (as a % of GDP), the percentage of the population with tertiary education, lifelong learning, GDP per capita, and debt to equity. The findings highlighted the crucial role of both innovation and education as determinants of EU competitiveness and economic convergence.
The authors [
34] investigated the impact of some macroeconomic, individual, and business environment-related factors (GDP, GDP per capita, total tax rate, inflation rate, foreign direct investments, ease of access to finance, unemployment rate, fear of failure rate, entrepreneurial intentions, perceived capabilities, perceived opportunities, cost of business start-up procedures, time required to start a business, number of procedures needed for establishing a new firm) on the total entrepreneurial activity (TEA) rate in 18 European Union countries for a period of 14 years (2002–2015). The authors used three regression models and applied a panel data fixed effect model approach. The results of the study highlighted that the inflation rate, foreign direct investments, access to finance, and total tax rate are the main macroeconomic determinants of entrepreneurship.
In this study, the adequacy of regression models was assessed using the analysis of variance (ANOVA), which was has also been applied in other empirical studies [
31,
55,
56] and many others. The results of the regression analysis in a general form of two novel models are the following:
Linear regression models provide a rich and flexible framework that is applicable in many economic areas and issues. However, linear models are not suitable for all cases. There are many problems where dependent variables and independent variables (predictors) are linked through a known nonlinear function, which leads to the construction of a nonlinear regression model (NRM). In general, a non-linear model has the following form:
where
θ is k × 1 of the unknown parameter vector and ε is the uncorrelated random error with a zero mean value. Another prerequisite is a normal error distribution. Since the mean error value is zero:
then the function, f(x,
), is the regression function of a nonlinear regression model. The values of individual regression coefficients can then be obtained by the least squares method formulated as:
To find the least squares estimate, it is then necessary to differentiate this equation with respect to each component of the parameter,
, which leads to a system of normal equations for nonlinear regression. The normal equations then have the following form:
where j = 1, 2, …, k and where
is the estimate of the regression coefficient,
.
Based on the results of the GD (Equation (5)) and GH (Equation (6)) models, we designed the third GDH (Equation (14)) model to simultaneously reflect the non-linear relations among the dependent variable (GCI) and two independent variables (DBI and HDI). The GDH (Equation (14)) model is described in more detail in
Section 4.3. Considering the availability of data, the intention of this paper was also to compare the real GCI 2018 score published in the Report of World Economic Forum and the quantified GCI 2018 score by means of the GD (Equation (5)) model using real DBI scores.
4. Results
The first partial analysis focused on the comparison of the average GCI, DBI, and HDI scores achieved by EU (28) countries during the years 2006 to 2017 in terms of the analyzed economic categories—global competitiveness, business environment, and human development (see
Table 2). In the second partial analysis, attention was paid to the evaluation of the individual regression modelling results. In line with the performed analyses, the last partial analysis was focused on the verification of the designed models and prediction of the GCI score for 2018 on the basis of the DBI.
4.1. The Development Analysis of Selected Multi-Criteria Indices within the EU (28) Countries
In order to assess the actual positions of the EU (28) countries, the initial analysis focused on the GCI, DBI, and HDI indices development over the years 2006 to 2017. Based on the average scores of the above mentioned multi-criteria indices, we analyzed the results achieved as well as the rankings of the EU (28) member states.
4.1.1. The Development Analysis of the GCI within the EU (28) Countries
Brief comments concerning the assessment of individual indices over the monitored period are presented in the text below, starting with the most common one, the GCI.
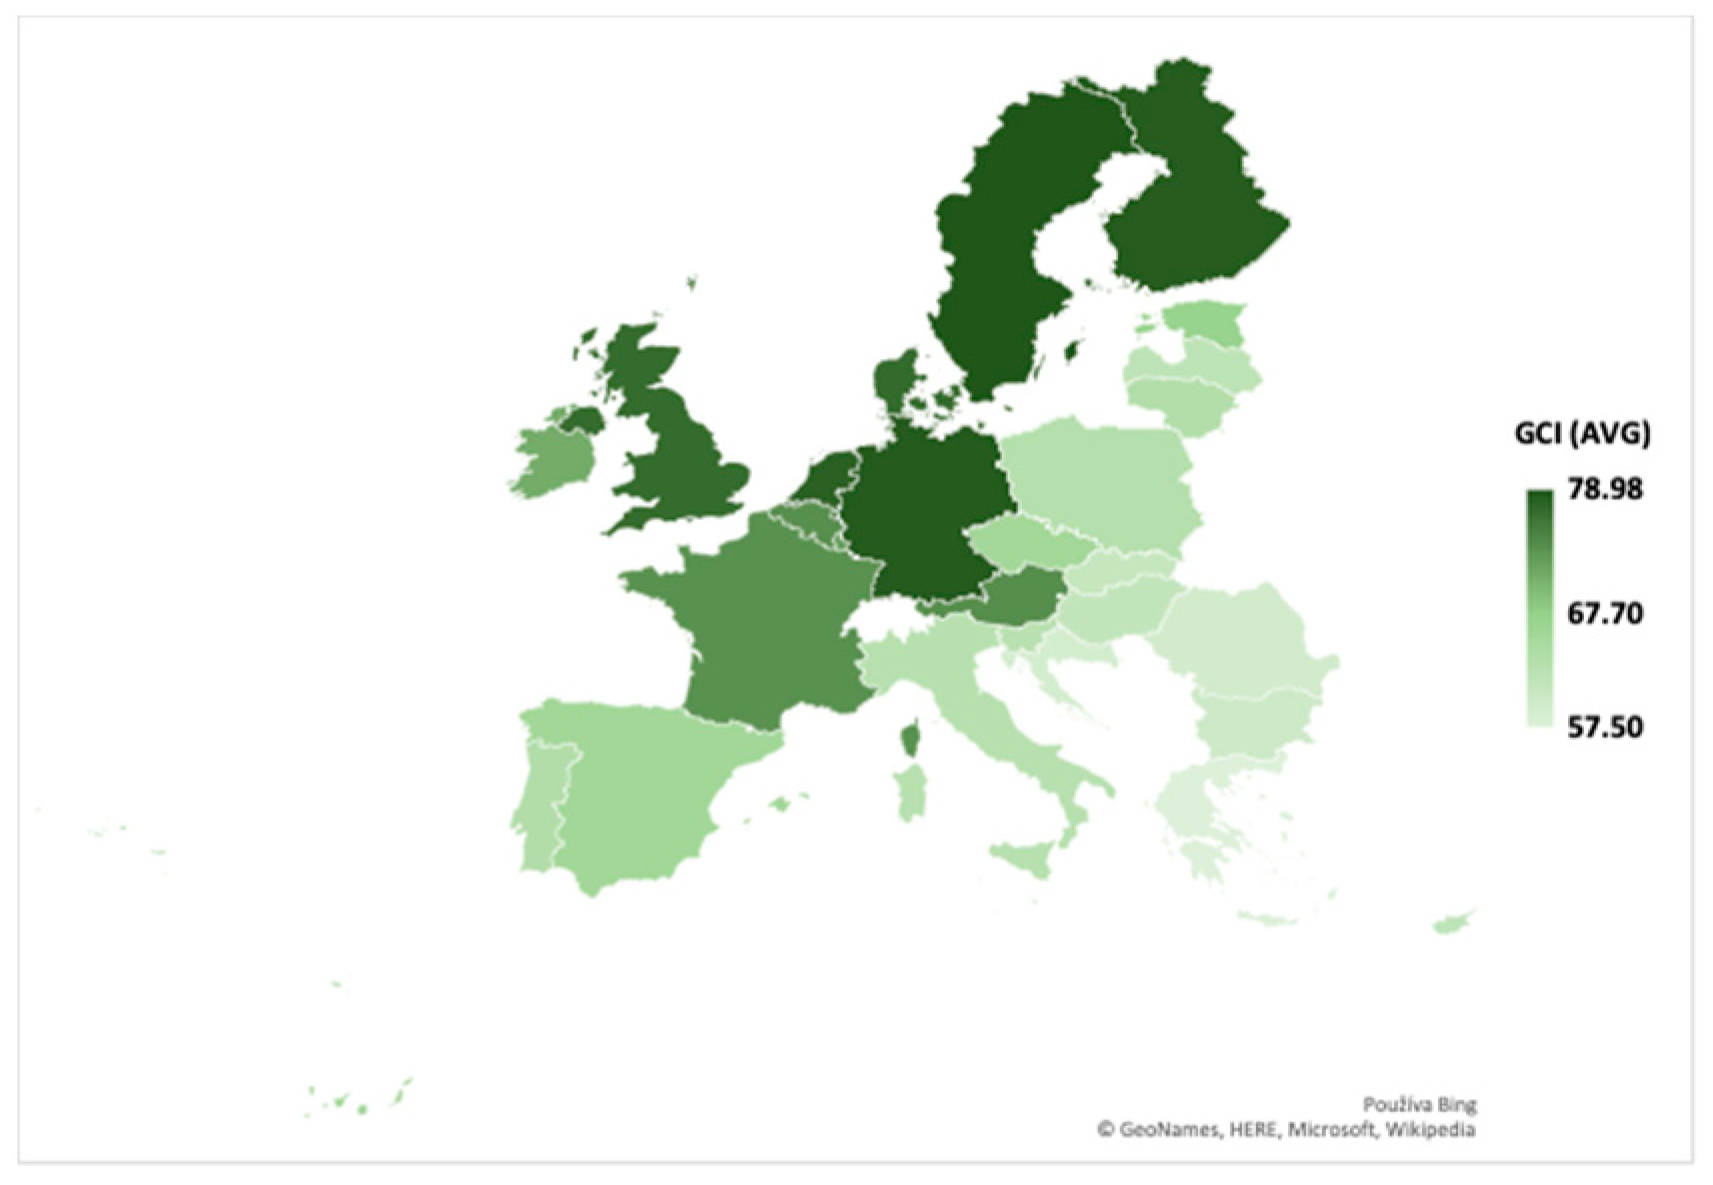
Figure 1 graphically presents the average GCI score within all the member states of EU (28) in the period of 2006 to 2017.
Compared to other multi-criteria indices assessment, the lowest average values were recorded in the case of the GCI. Moreover, the most significant global competitiveness disparities among the EU (28) countries were identified since the GCI score range during the years of 2006 to 2017 reached the highest value of 27.15. According to the development of the GCI score for all member states, an increasing trend of the average values (from 66.73 to 69.60) was noted, representing a positive and desirable development. Over the period analyzed, the average GCI score within all EU (28) member states achieved the level of 67.70. The lowest GCI score in the period of 2006–2009 was recorded in the case of Bulgaria and since 2010, for Greece. In this context, the least competitive countries in the EU included Greece (57.50), Croatia (58.93), Romania (59.35), and Bulgaria (60.00). Finland ranked first in the four years (2006, 2012–2014), Denmark (2007–2008), Sweden (2009–2011), and Germany (2015). In the last two years of the analyzed period, two countries, Germany and the Netherlands, ranked first in the global competitiveness score. The best average GCI score was achieved in Sweden (78.98), and Finland achieved the highest GCI score (82.29) within the European area in 2006. Sweden, Germany, Finland, the Netherlands, Denmark, and the United Kingdom can also be ranked among the best-rated countries.
4.1.2. The Development Analysis of the DBI within the EU (28) Countries
In the following partial analysis, we focused on the business environment assessment of the EU (28) member states by means of the DBI.
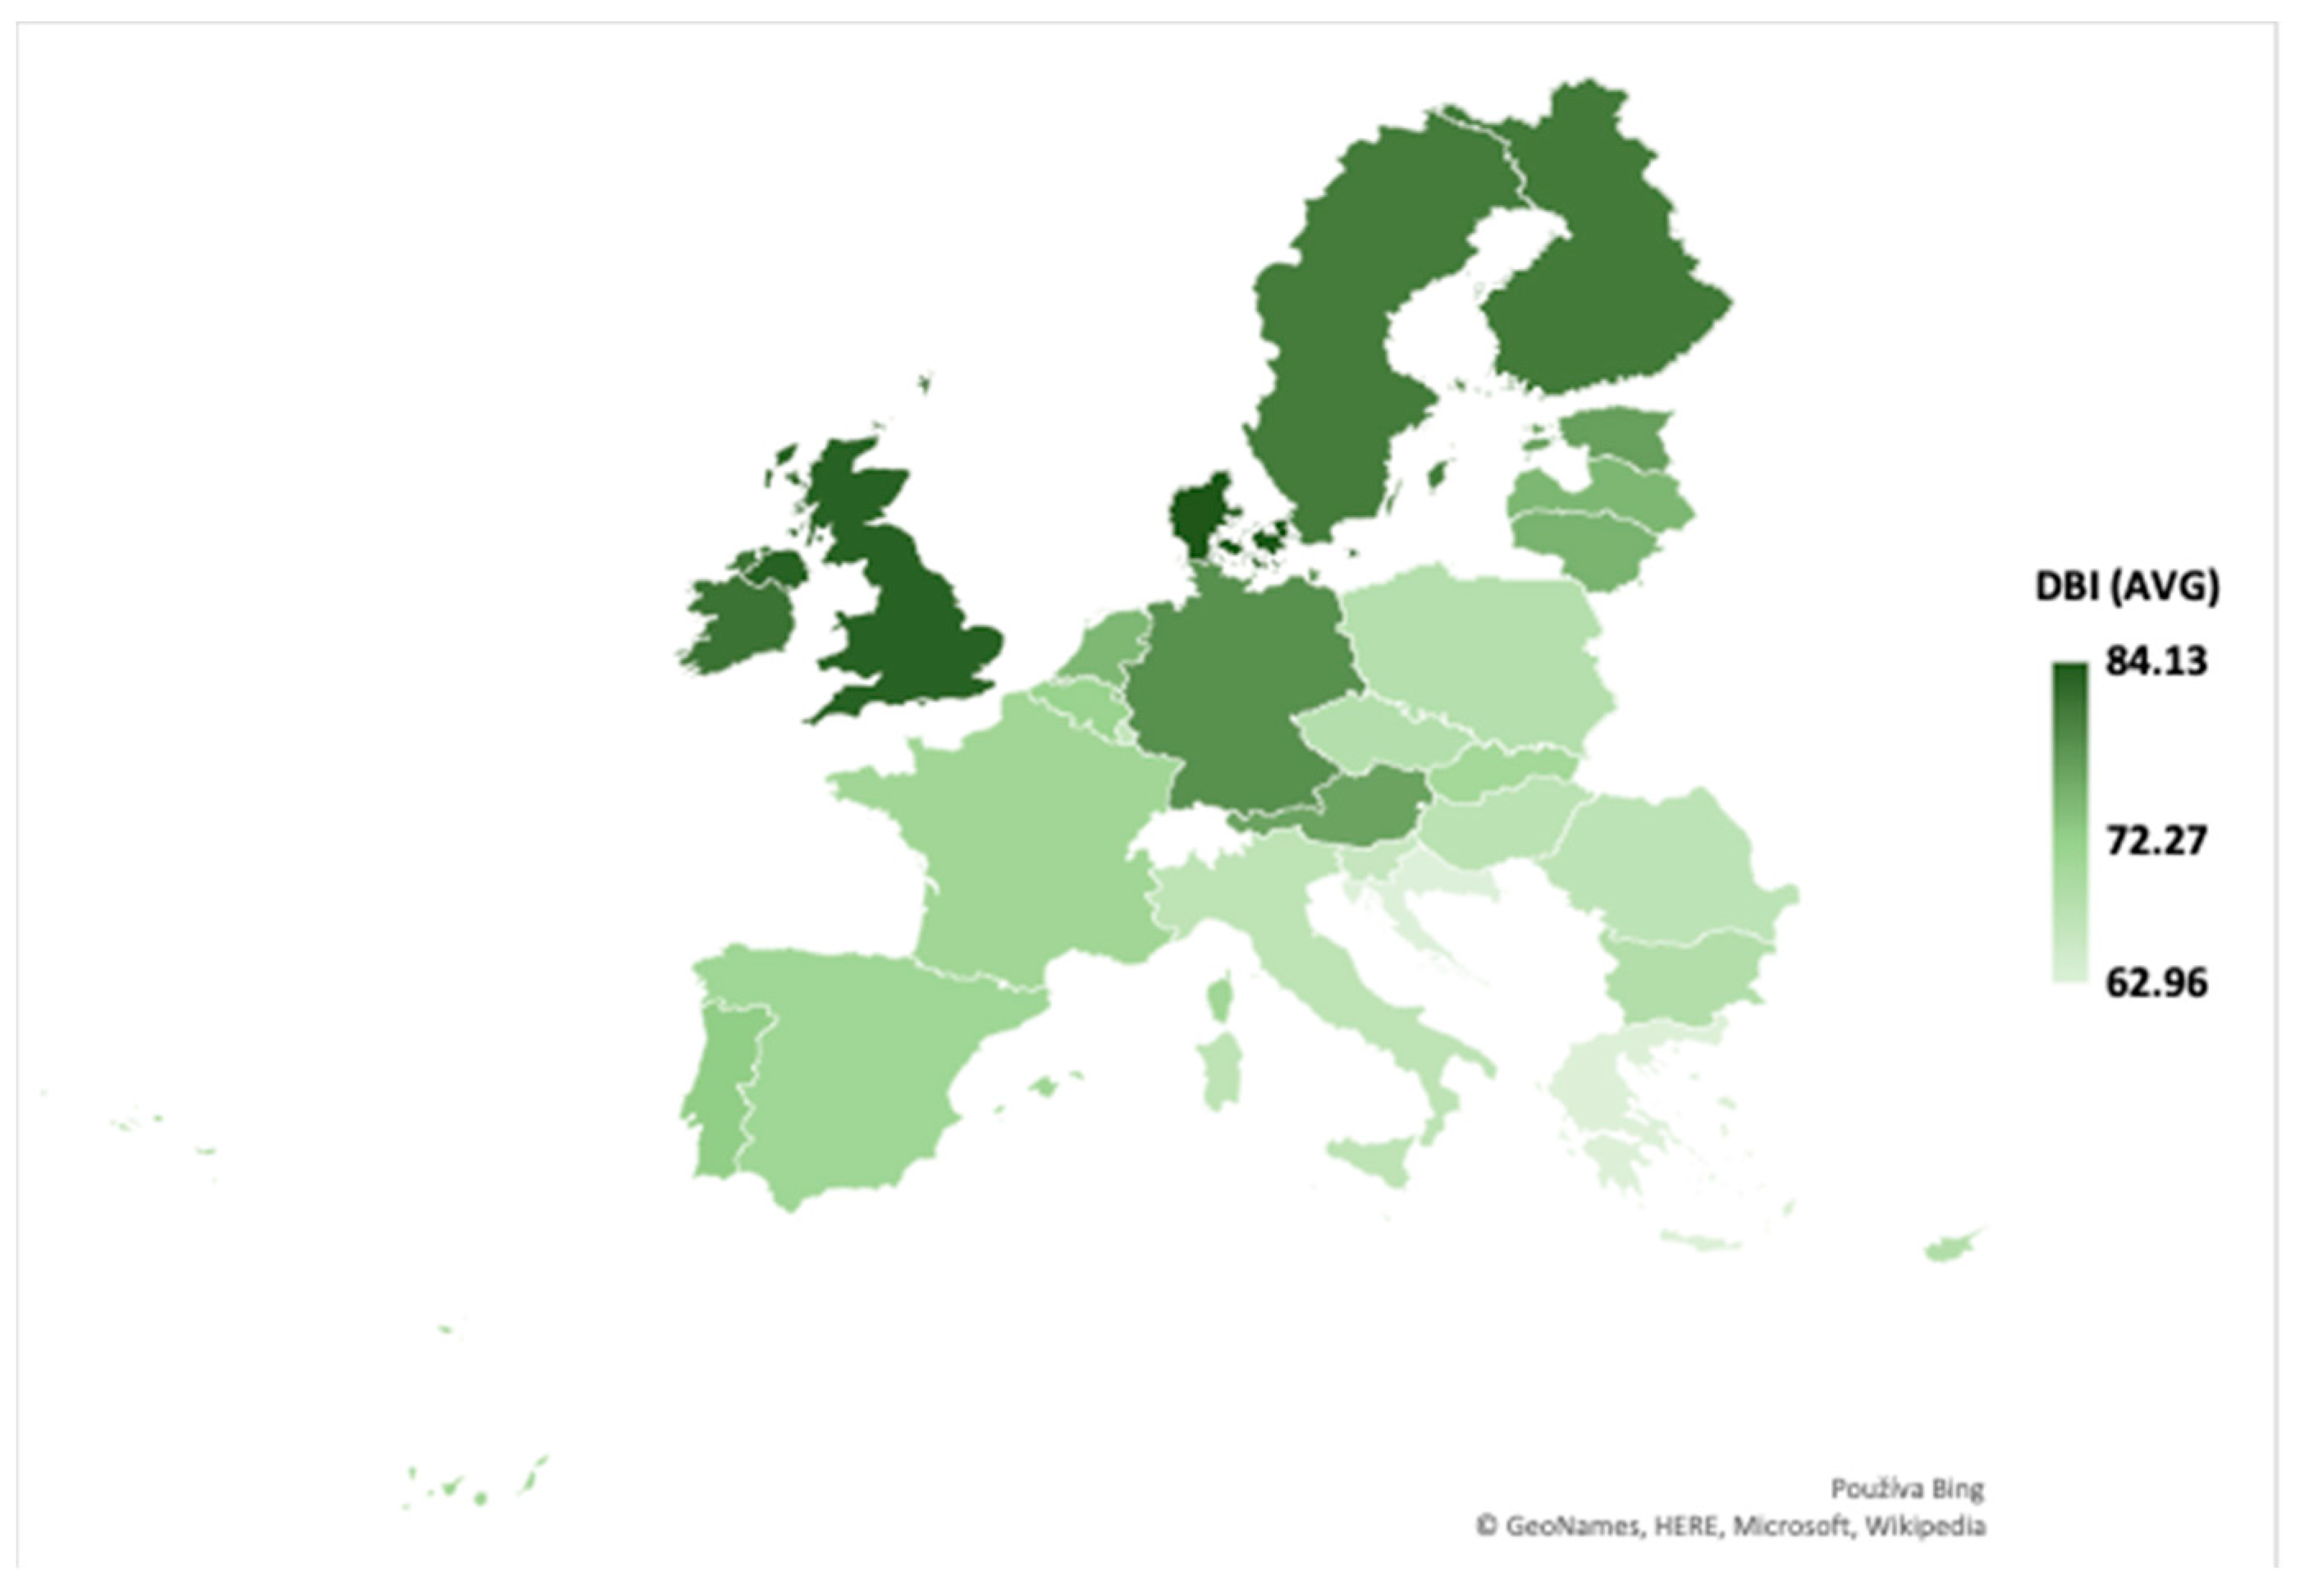
Figure 2 below illustrates the average DBI score achieved during the analyzed years of 2006 to 2017.
The development of the average DBI score in all EU (28) countries showed a growing trend (from 68.50 to 76.38), except in 2017, when a slight decline was recorded. The average DBI score within the EU (28) countries attained a level of 72.27. Overall, the worst-rated countries in terms of the DBI were Croatia (2006–2009), Greece (2010–2012), and Malta (2013–2017), while vice-versa, Denmark has consistently achieved the best results since 2009 as well as Ireland (2006–2008). Based on the average results, the business environment was best evaluated in Denmark (84.13), Great Britain (83.06), Ireland (81.46), Finland (80.75), and Sweden (80.68). The least attractive business conditions except for Malta (63.51) were identified in the case of Greece (63.02) and Croatia (62.96).
4.1.3. The Development Analysis of the HDI within the EU (28) Countries
The last multi-criteria index subjected to the brief development analysis within all the EU (28) countries was the HDI.
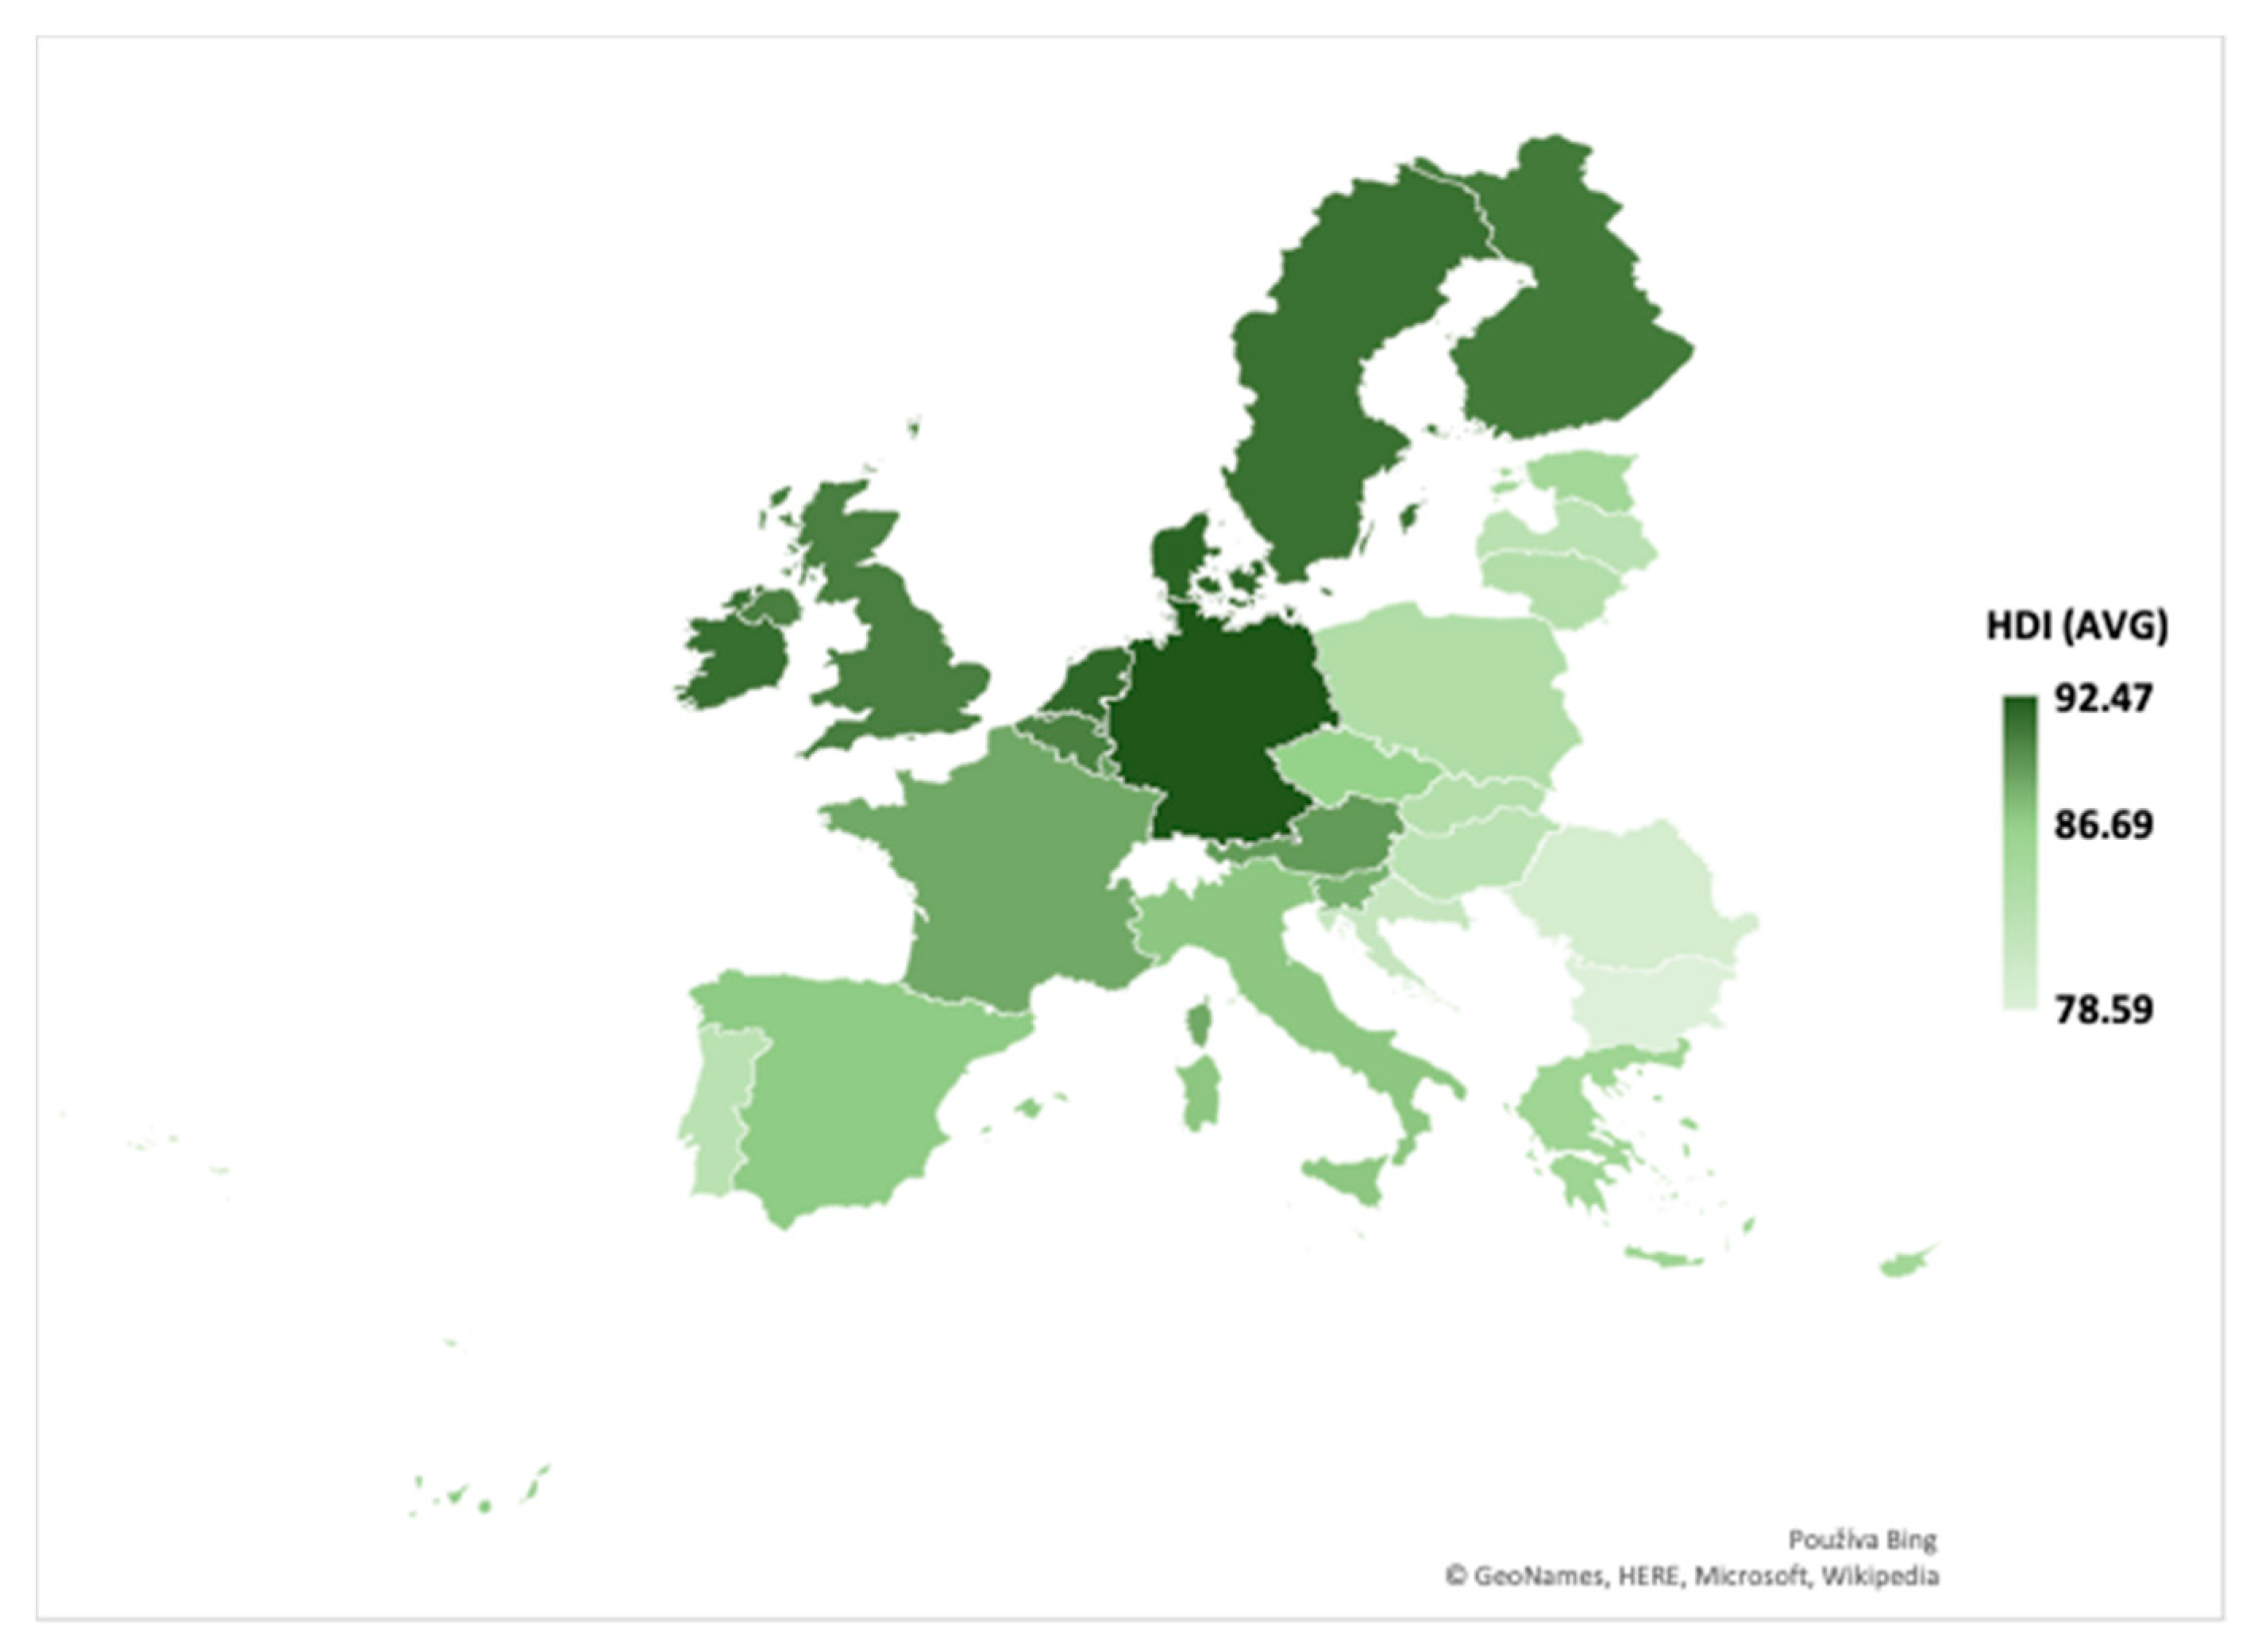
Figure 3 demonstrates the resulting HDI average score over the years of 2006 to 2017.
Over the analyzed period, the average HDI score (within all the EU (28) countries evaluated) reached the highest values in comparison with the GCI and DBI. Besides that, all countries acquired a desirable growing trend of the average HDI score (from 84.84 to 88.38). Based on the comparative analysis of the DBI across the EU (28) countries, we can conclude that the lowest average value was achieved by Bulgaria (78.59), while vice-versa, the highest score was recorded by Germany (92.47). From all indices analyzed, the HDI scores achieved the lowest difference (13.88) between the best and the worst. This fact indicates that European countries are the most balanced within human development. Based on a comparative analysis across the EU, we can conclude that the overall lowest average HDI values were achieved for Bulgaria from 2006 to 2014. Although Romania’s HDI was lower in 2015 to 2017 and during the analyzed years of 2006 to 2017, the average value was 79.63. In addition to these two countries, the development of human capital was also negatively evaluated for Croatia (81.40), Hungary (82.63), Latvia (82.75), and Portugal (82.76). On the other hand, with the exception of 2017, the highest HDI value was achieved by Germany (2006–2012, 2014–2016) and Denmark (2013). Currently, Ireland (93.8) is the leader in this area together with Germany, Sweden, the Netherlands, Denmark, Finland, and the United Kingdom.
4.2. The Results of the Panel Analysis and Regression Modeling
The following partial analysis focused on an evaluation of the panel analysis and regression modeling results. As part of the regression model constructions, the GCI represented a dependent variable reflecting each country’s global competitiveness and two independent variables were also included—the DBI and HDI.
4.2.1. Results of the Panel Analysis
The panel analysis was used to determine the relationship between the dependent variable (GCI) and the independent model variables represented by the DBI and HDI. Within the panel data analysis, we focused on time series analysis (2006–2017) on a sample of 28 European countries, which represented a set of 329 observations.
Based on the Hausman test, where the test statistic value reached H = 93.0842 and a significance level of p = 6.1238·10−21, we can conclude that at the selected 5% level of significance, the null hypothesis of the Hausman test can be accepted and thus the random effects of the model are consistent in favor of the fixed effect model. To further analyze the panel data, we chose a fixed effect model (FEM).
The fixed effect model (FEM), unlike the combined regression model, assumes a diversity of cross-sectional units in absolute members.
We can see that in the model, the matrix columns, D, represent artificial variables, D1 to Dn, which are dit = 1 for the i cross-section unit, and dit = 0 for all other cross-sectional units.
Based on the panel data and the results listed above, the basic features of the analyzed model were as follows:
- ▪
Model: Fixed-effects, using 329 observations.
- ▪
Included 28 cross-sectional units.
- ▪
Time-series length: Minimum 7, maximum 12.
- ▪
Dependent variable: GCI.
Table 3 shows that there is a direct linear relationship between the GCI and HDI. At the same time, the impact of the DBI on the change in the GCI value was not confirmed. Further results of the panel analysis can be summarized as follows: The average value of the investigated dependence of the GCI was 67.8305 with a standard deviation of 7.2166. The sum of the squares of the residues was 790.6613. The modified determination index as a measure of the model’s ability to explain the change in the GCI variable of interest was 95.3714%. The Fisher–Snedecor test criterion converted to a probability scale of
p = 3.0·10
−181 points to the fact that the selected fixed-coefficient model was adequate, and thus the predictors chosen (HDI and DBI) were suitable for describing the investigated GCI variable.
The difference between the individual cross-sectional units was tested by using the F-test, which compared the FEM model and the combined regression model, represented by:
We compared this with the table value, F (n − 1, nT − k − n) at the chosen significance level, α. If the statistics value was greater than the table value, we rejected the null hypothesis that cross-sectional units have the same absolute terms. Since the test statistics, F (27, 299) = 55.6126, converted to a probability scale reached p = 4.3622·10−100, the null hypothesis of the equality of absolute members of cross-sectional units was rejected.
4.2.2. The Results of Regression Modeling—GD Model
When creating the first regression model (GD model), we focused on estimating the existence of a relation between the global competitiveness assessment (GCI) and business environment assessment (DBI) in the complex environment of EU (28) member states over the years 2006–2017.
The designed regression model GD (Equation (5)) assumes a statistically significant GCI dependency on the DBI change and individual year within the analyzed period, 2006–2017. Based on the essential parameters in the case of the GD model, the proportion of the GCI variability (RSquare) represented 48.5447% and the adjusted determination coefficient affecting the extent of the variability explanation of the analyzed data by the given model was 48.0697%.
In accordance to analysis of variance (ANOVA), it can be stated that the variability caused by random errors was significantly lower than the variability of the measured values explained by the regression model. The achieved value of the significance level (Prob > F) points to the adequacy of the above mentioned model, which was confirmed by the Fisher–Snedecor test criterion (F = 102.2052). The significance level achieved a value of 0.0001, so it can be concluded that this model was adequate within the selected significance level, α = 5%. The assigned predictors explained the change of the examined multi-criteria index (GCI) in an appropriate manner.
In
Table 4, estimates of the effect size of the individual variables of the GD (Equation (5)) regression model are presented, which indicates the impact of the predictors on the observed GCI change. Based on the analysis performed, it is evident that the DBI score, as well as its square number of this index, were significant factors. The intercept of the above-mentioned model was not statistically significant at the chosen significance level of α = 5%. In addition, the variable "Year" was modelled as a nominal variable and was not statistically significant either. Due to the statistical insignificance of the variable "Year" as a predictor, we removed this variable from the model. The results of this exclusion led to the validity of the created model in all analyzed years, 2006–2017. Moreover, the results presented in
Table 4 indicate that the GCI score growth was determined by the DBI score increase.
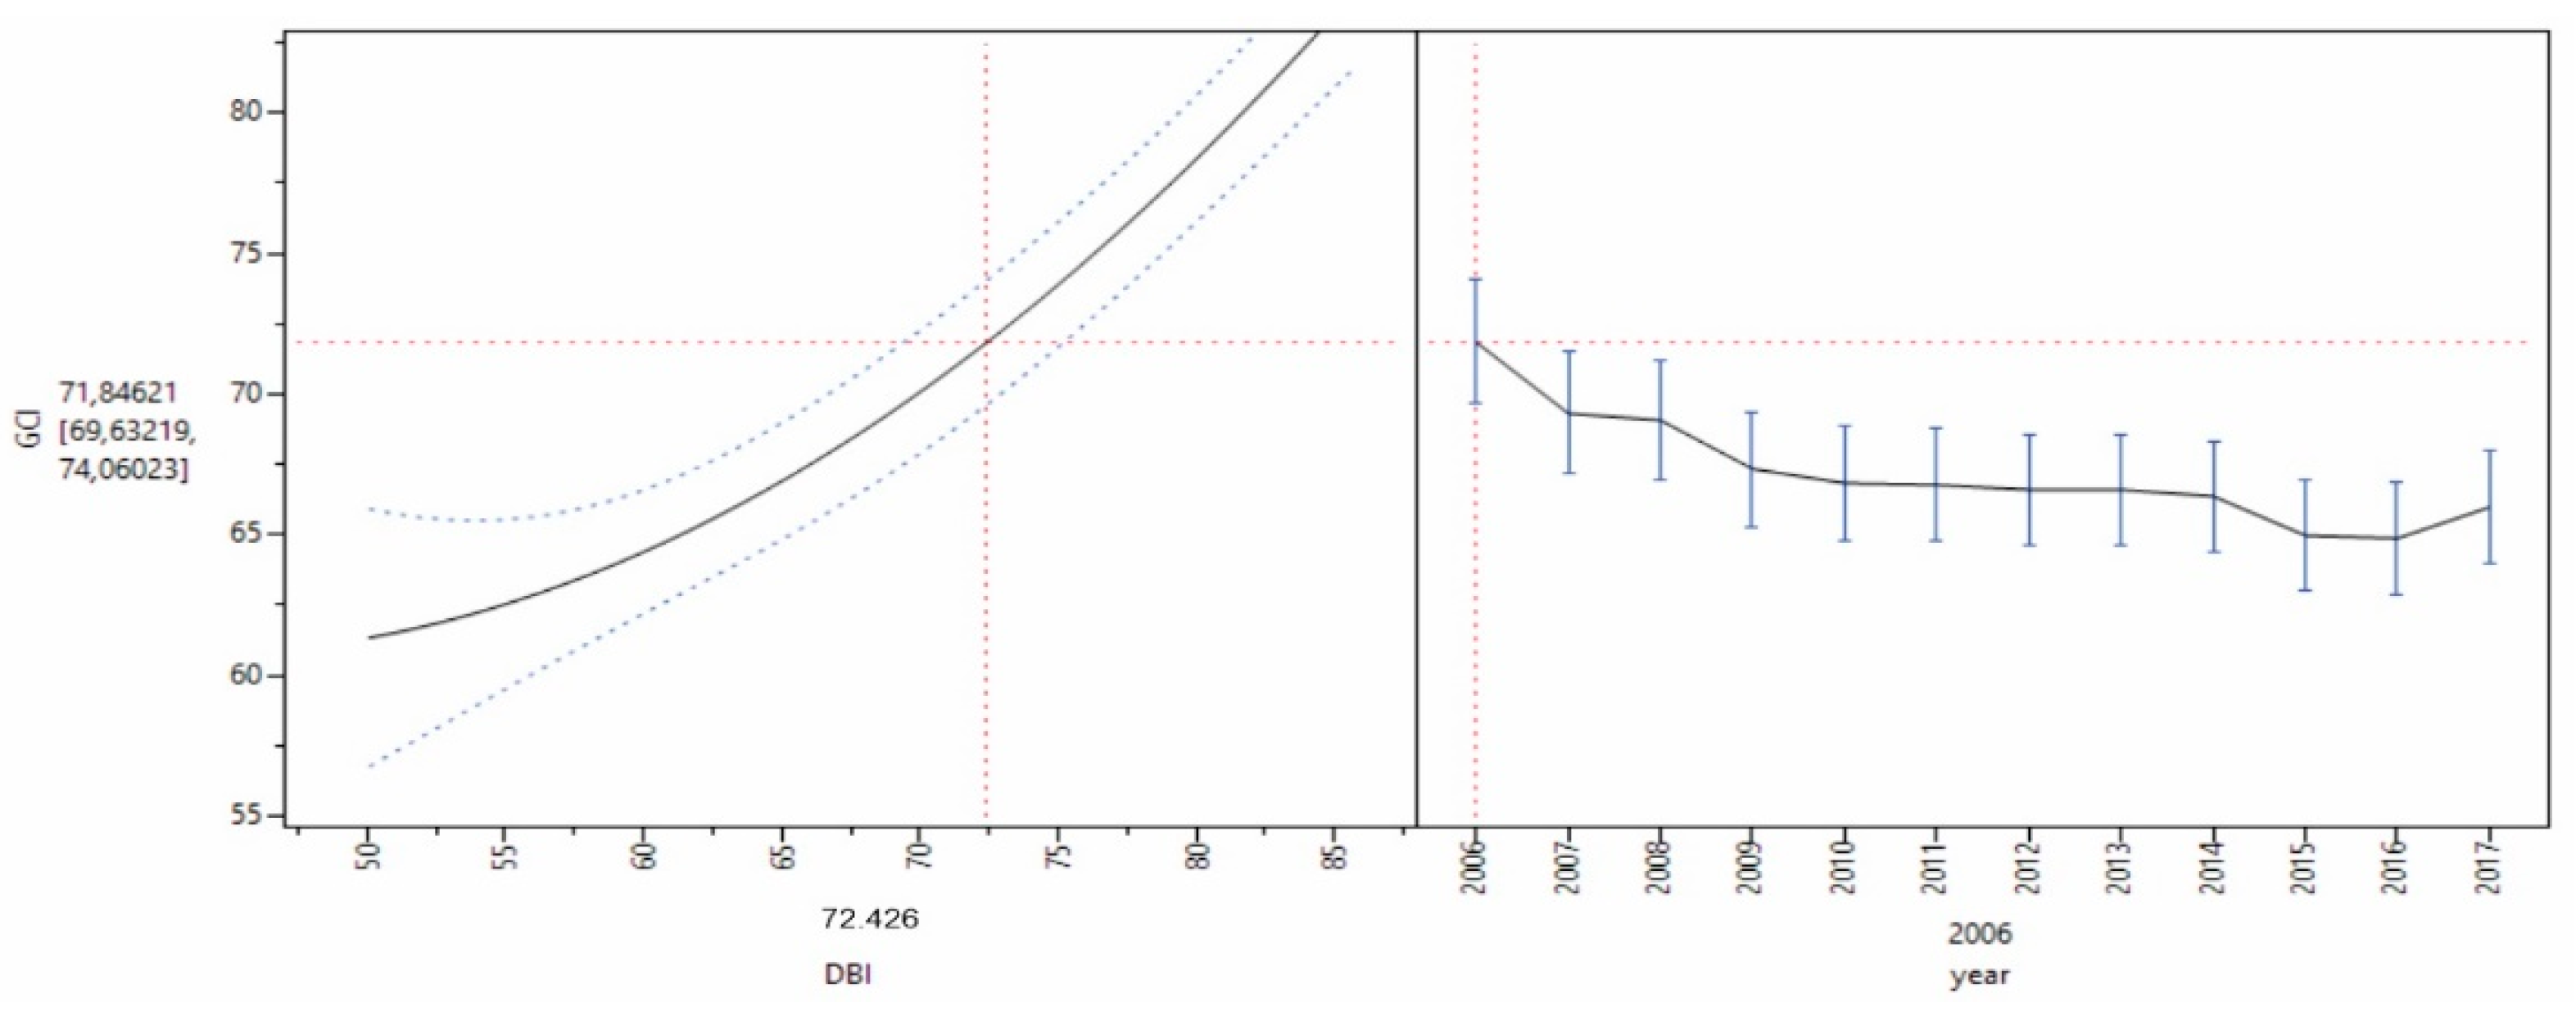
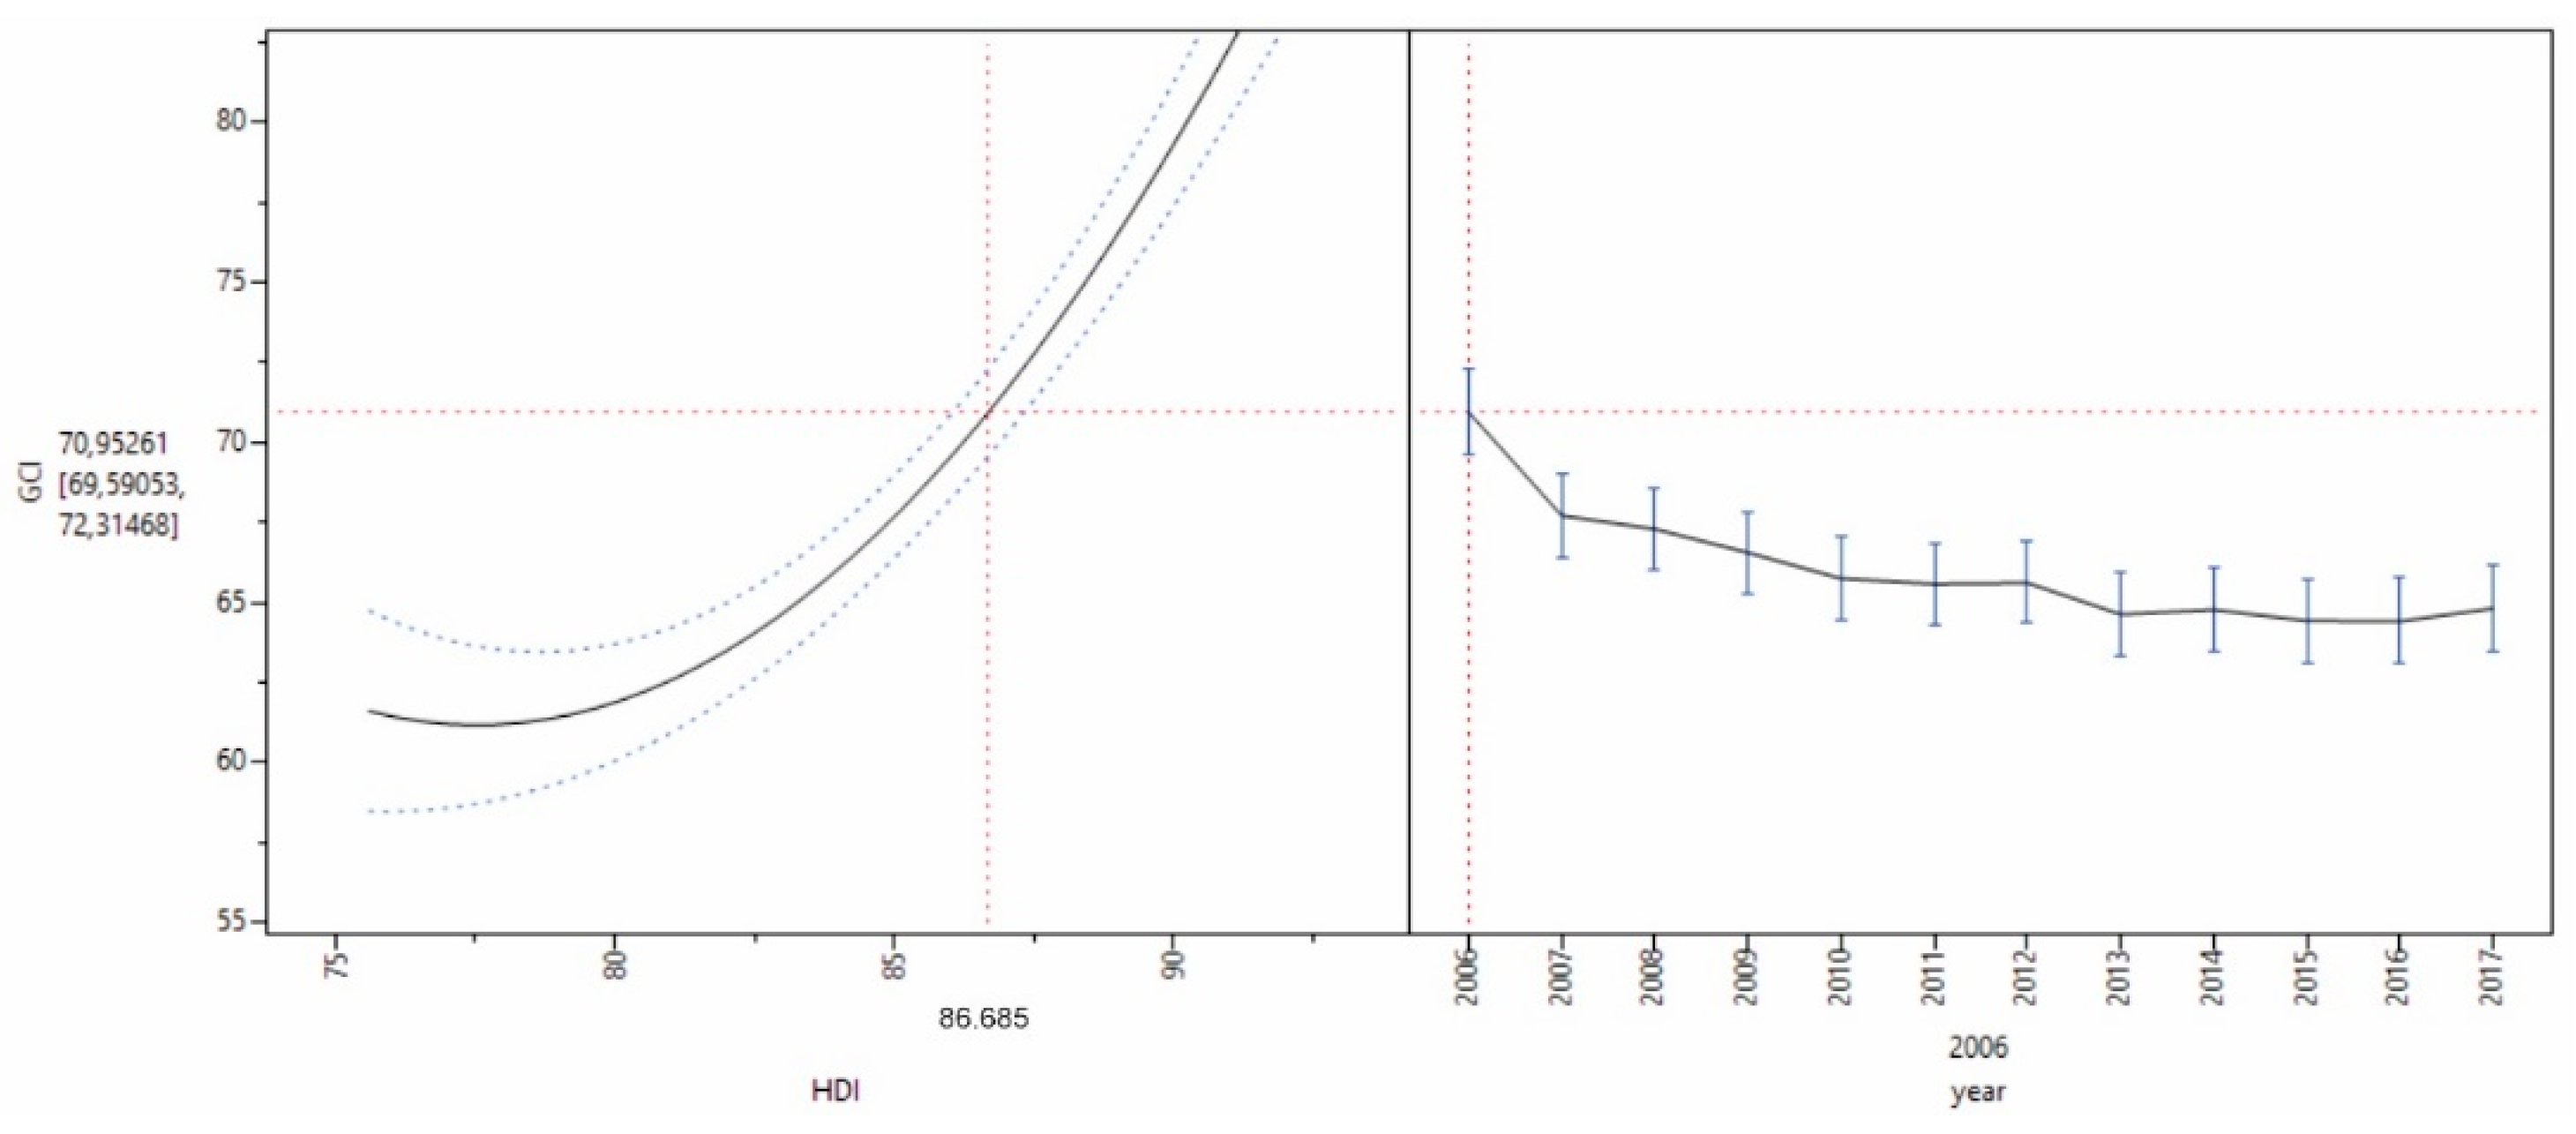
The prediction profile of the GD (Equation (5)) model illustrated in
Figure 4 points to the finding that the dependency of the GCI in relation to the DBI is non-linear. This result was also confirmed by the parameter estimation presented in
Table 4. The course of dependency represents the quadratic function whose graph was a parabola. However, no local extreme was evident in the interval of the values examined.
In accordance to the parameter estimation within the GD model (
Table 4) and taking into account the constant added to the model in order to deal with the non-orthogonality of the input data, the final prediction model has the following form:
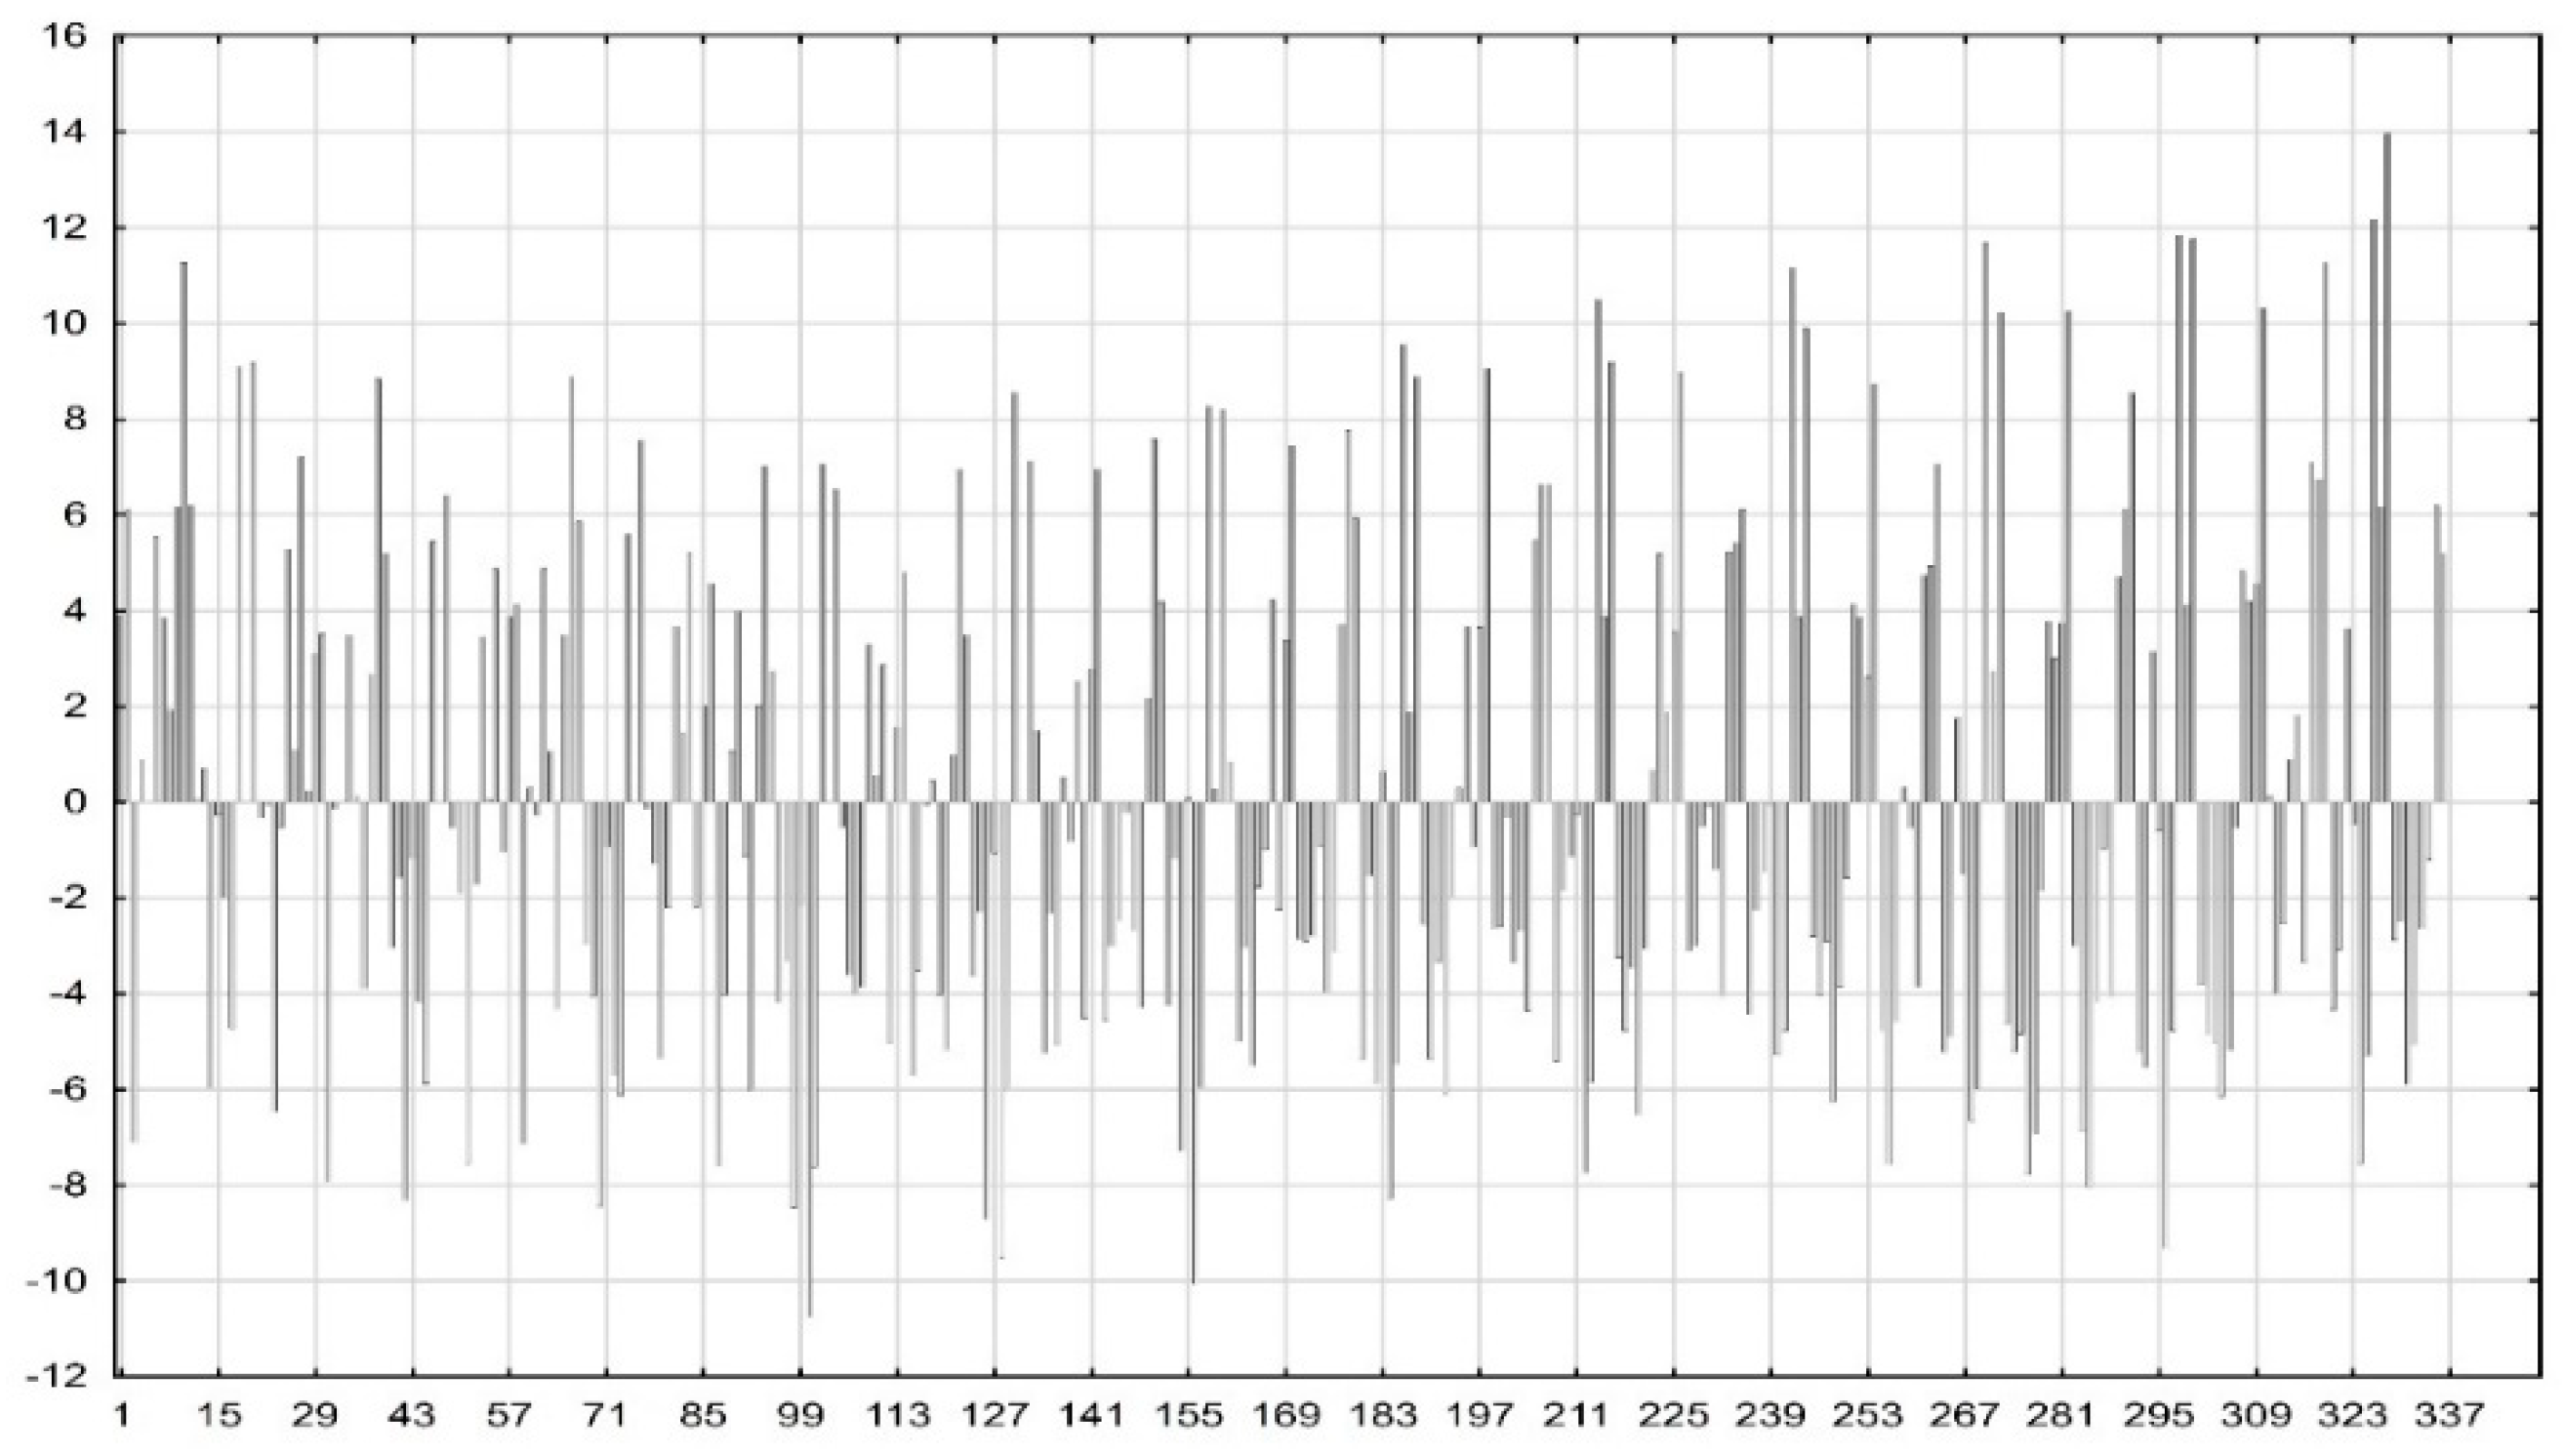
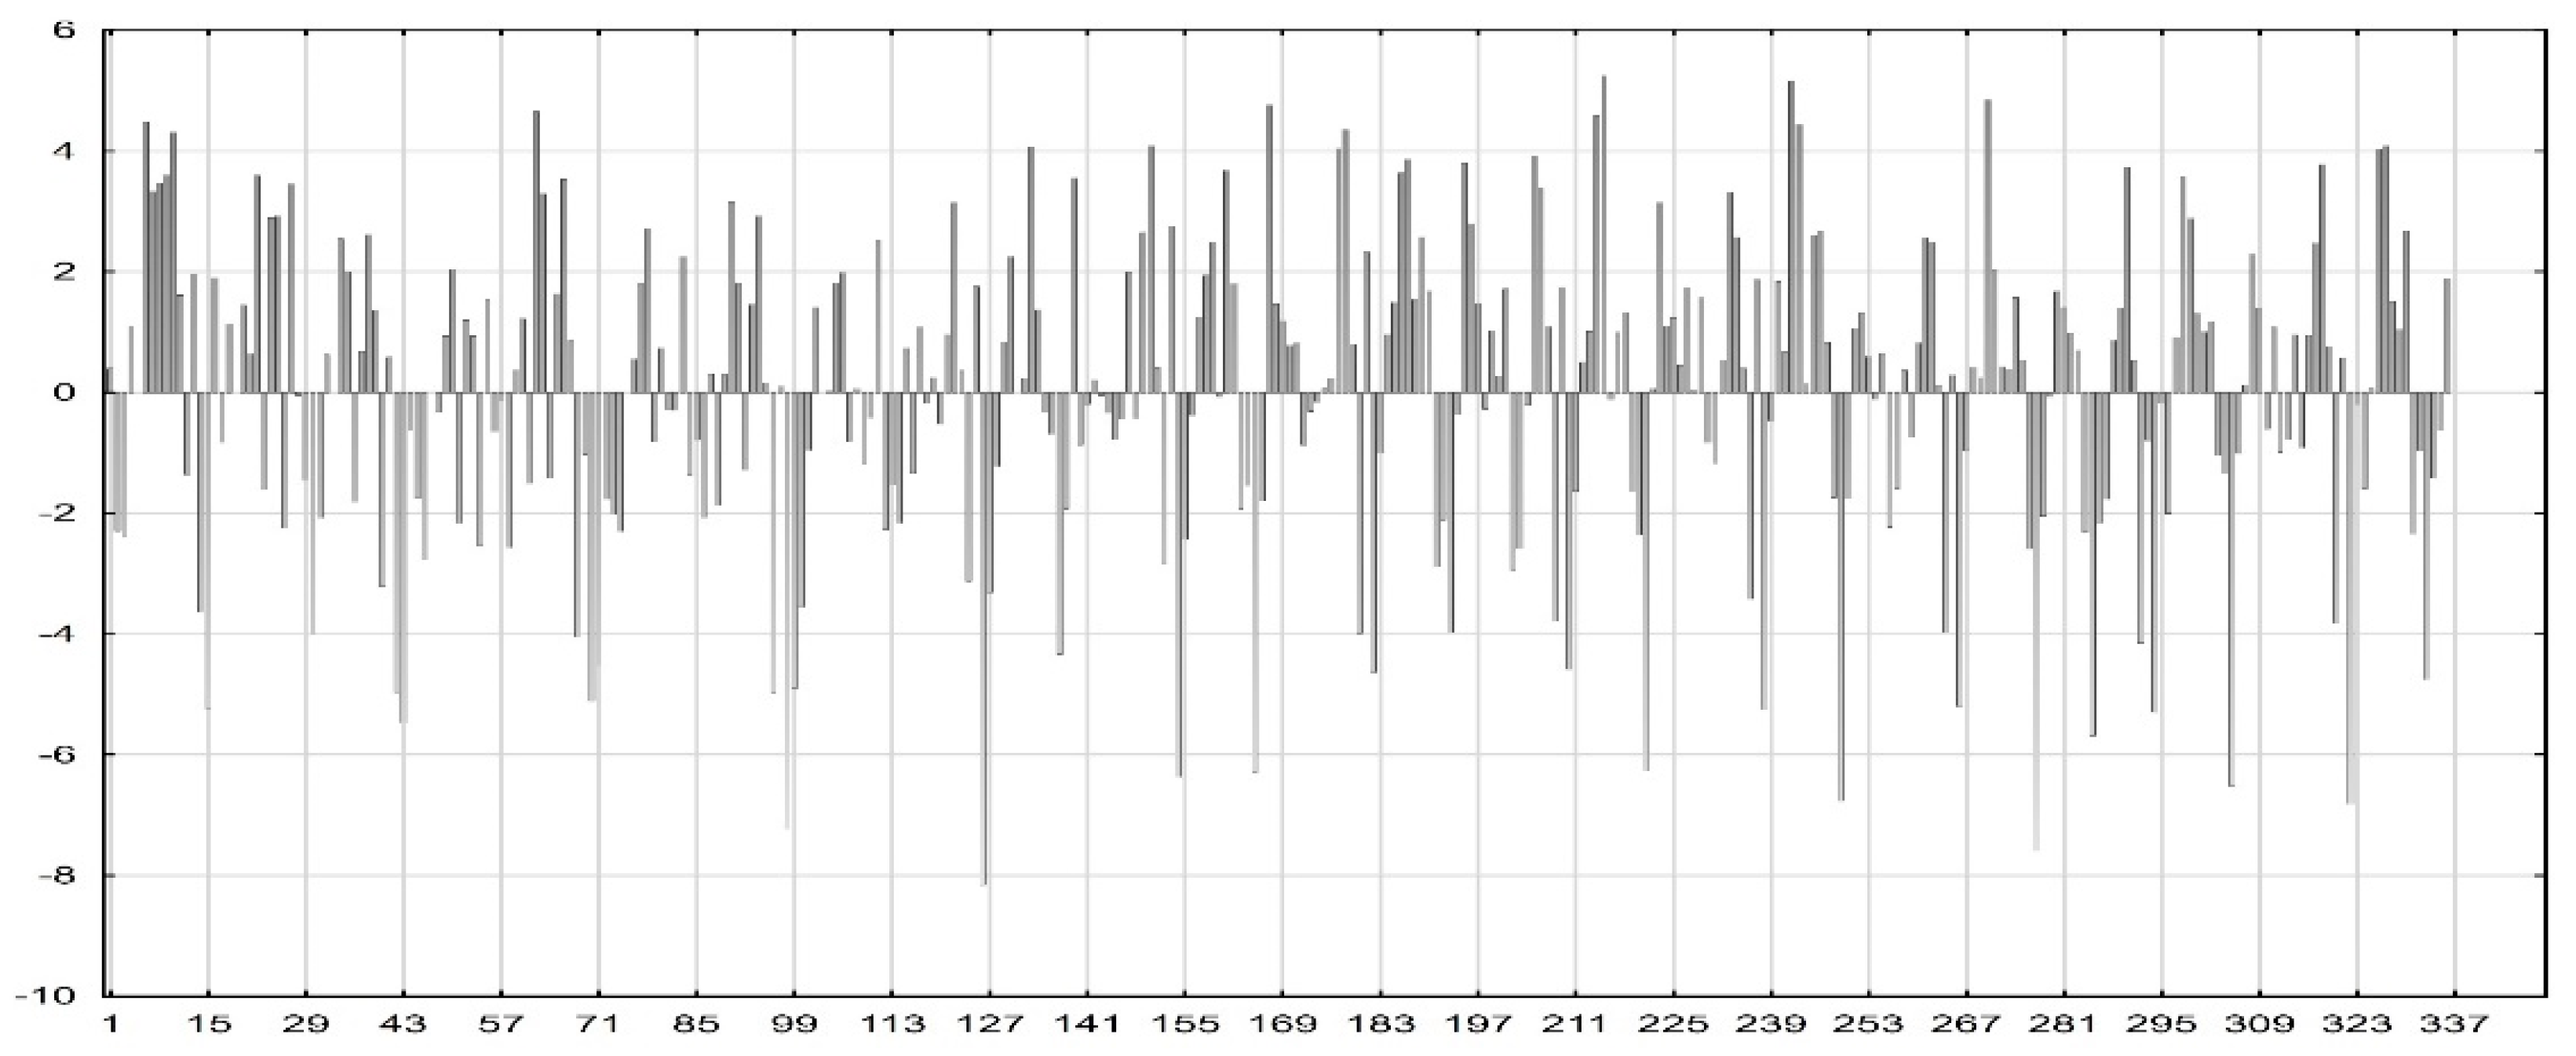
The residuals of predictive GD (Equation (12)) model are presented in
Figure 5. The residuals quantified as the difference between the actual value of GCI and the GCI value calculated using the GD (Equation (12)) prediction model achieved a median equal to 0. Despite the relatively low value of the adjusted determination coefficient, the residuals variance was quite significant. The residuals variance ranged from a minimum value of −10.7428, up to the maximum value of +13.9593. Therefore, the overall actual range of variance was 24.7021.
Since the results of the non-linear regression were the basis for creating the GD model, a statistically significant relation between the GCI and DBI exists. Furthermore, at the significance level of α = 5%, we can conclude that the research hypothesis, H1, was confirmed.
4.2.3. The Results of Regression Modelling—GH Model
When constructing the second regression model (GH model) for the period, 2006–2017, the attention was focused on detecting the relationship between the evaluation of the global competitiveness level (GCI) and human development (HDI) within the EU (28) member states.
The analyzed GH regression model assumed a statistically significant GCI dependency on the HDI change and individual year within the monitored period, 2006–2017. The GCI proportion of variability (RSquare) reached a level of 79.0178% and the adjusted determination coefficient reflecting the extent of data variability explained by the given model attained a value of 78.7642%.
The results of the variance analysis (ANOVA) for the second analysis of the GH (Equation (6)) regression model indicate that the variability due to random errors was significantly lower than the variability of values explained by the GH (Equation (6)) regression model. The achieved level of significance (Prob > F) points to the adequacy of this regression model based on the Fisher–Snedecor test criteria (F = 311.6314). Since the significance level (0.0001) was lower than the selected significance level of α = 5 %, this model was considered as significant and suitable. In this regard, the HDI factor represents an adequate predictor for prognosticating the value of the GCI.
Table 5 presents estimates of the effect size of the individual variables of the GH (Equation (6)) regression model, which describes the predictors’ impact on the analyzed response—the GCI. In line with the performed analysis, the HDI was identified as a significantly acting factor as well as the square number of this index. The absolute variable of the model was statistically significant within the selected significance level of α = 5%. However, the year modeled as a nominal variable was confirmed as insignificant. Due to the statistical insignificance of the year as a predictor, it was necessary to exclude it completely from this model. The consequence of this exclusion was the validity of the model in all analyzed years, 2006–2017. In addition,
Table 5 indicates that the increasing HDI score caused the growth of the GCI score.
Figure 6, reflecting the prediction profile of the analyzed GH (Equation (6)) model, points to the same fact as
Table 5 regarding the parameter estimation—the GCI dependency on the HDI change is non-linear. The course of dependence itself was expressed by a quadratic function, so a graphical representation of this function is a parabola.
Figure 6 indicates that there is a local minimum of a function (approximately at the level of 80 of the HDI) in which the dependency changes from concave to convex. Increasing the HDI value to a local minimum caused a decrease in the GCI score. By contrast, exceeding the local minimum of the analyzed dependency resulted in a significant GCI increase.
Based on the result of
Table 5 and considering the constant added to the model in order to deal with the non-orthogonality of the input data, the final prediction model was constructed as follows:
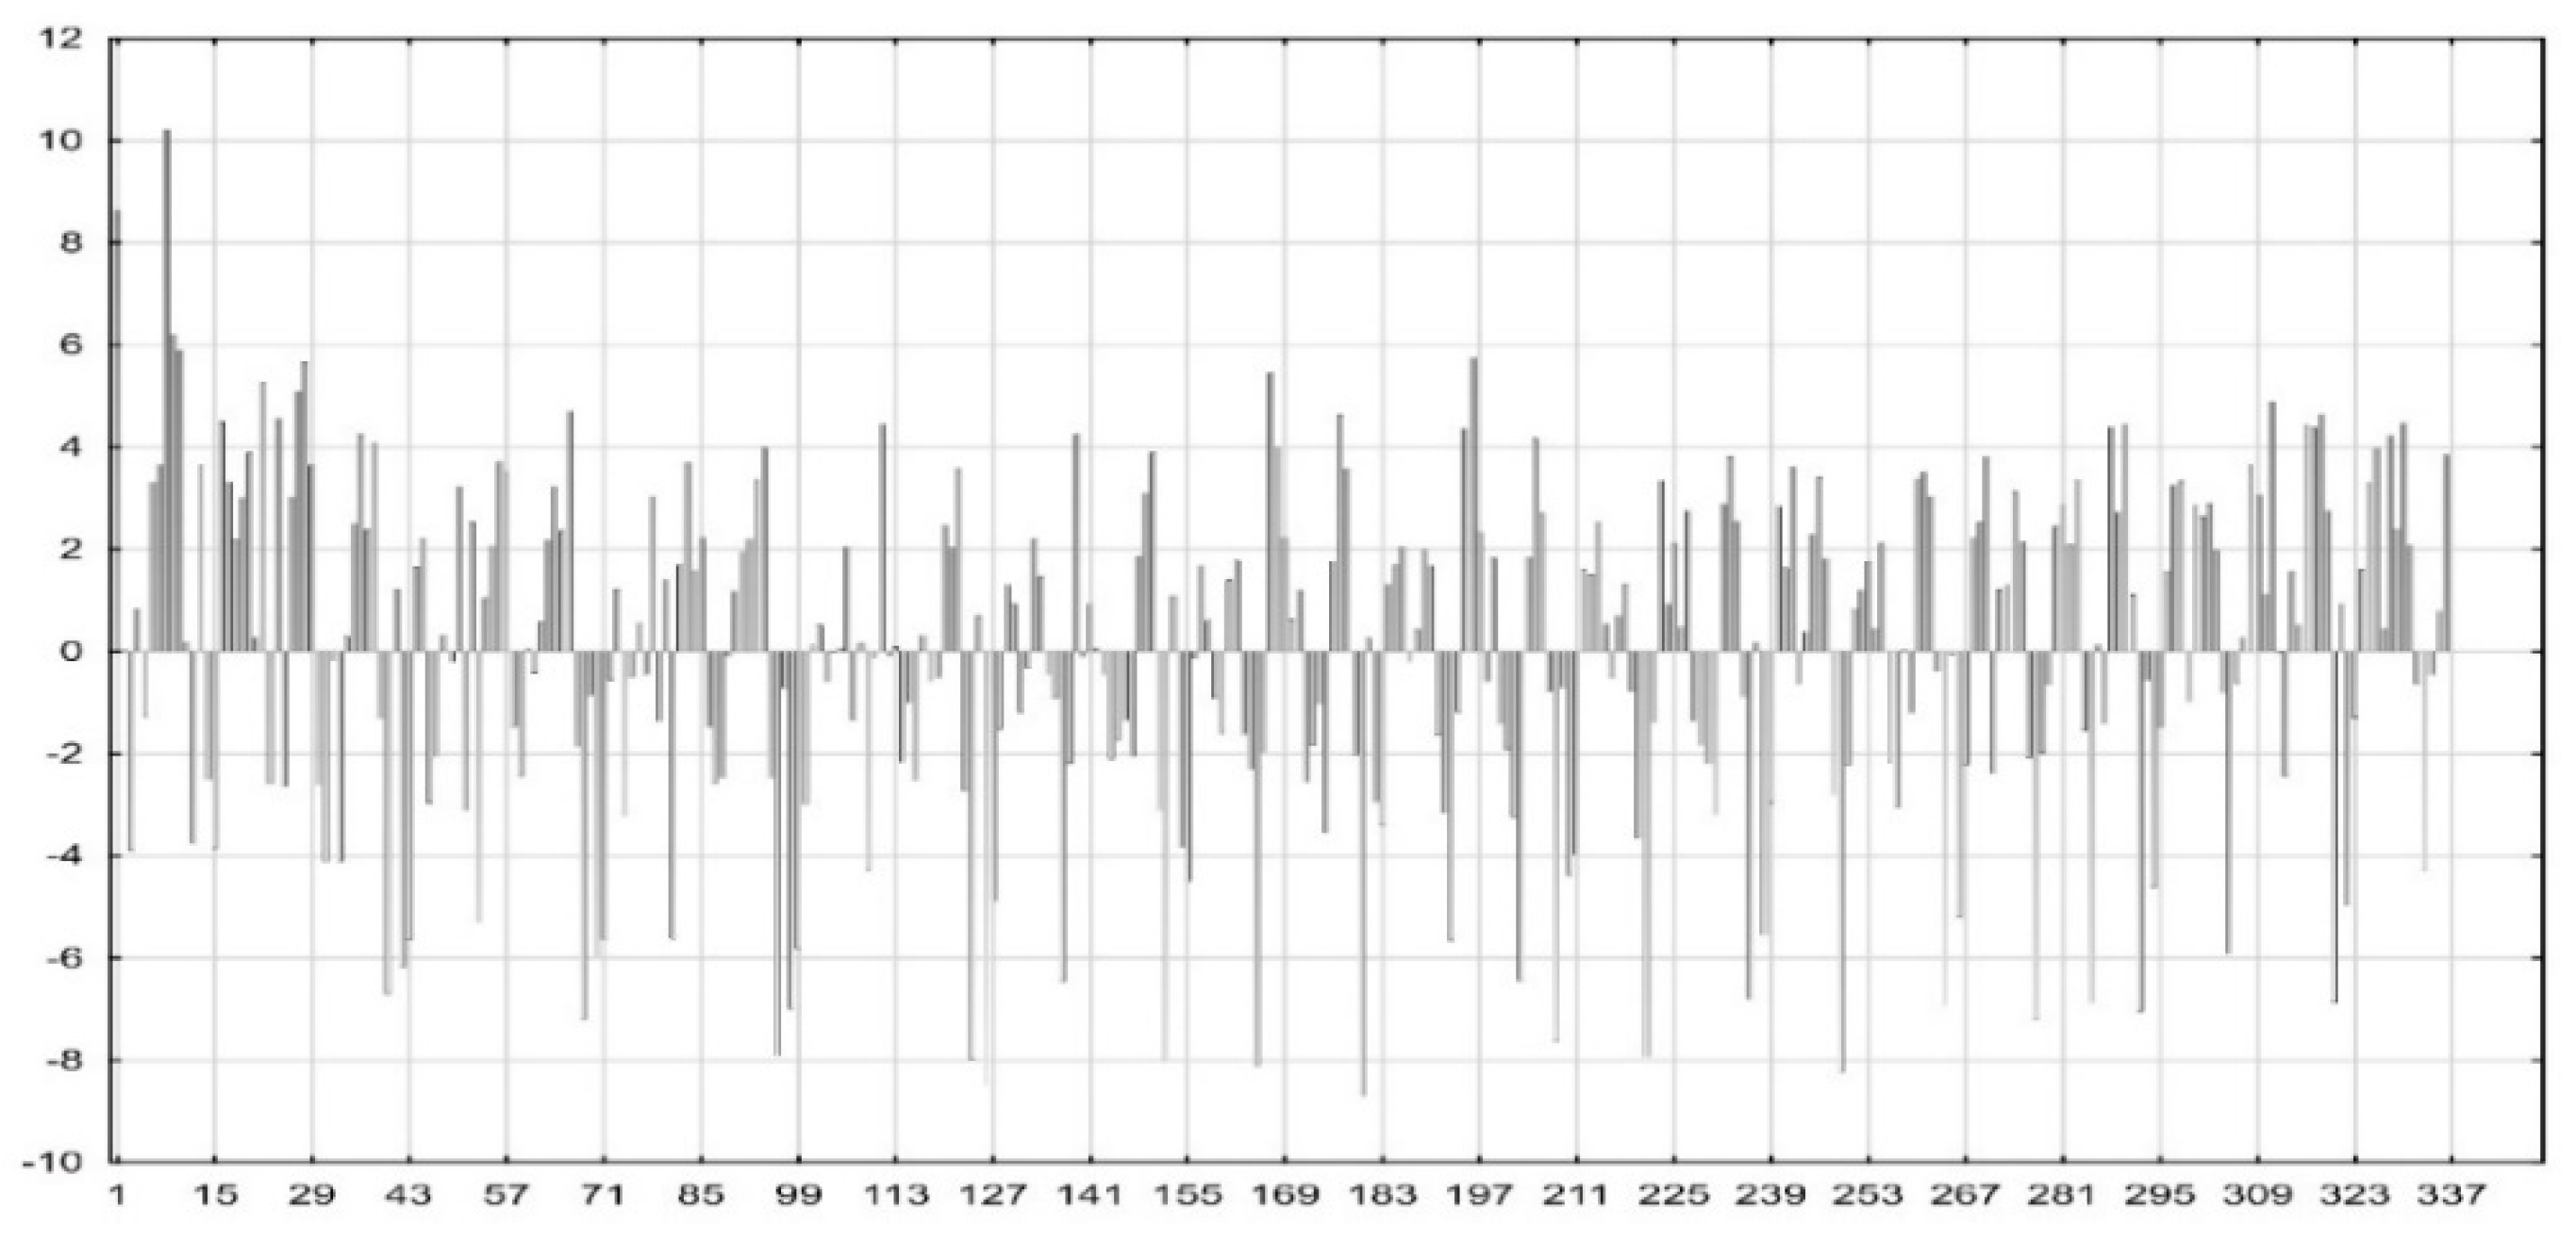
The following
Figure 7 illustrates the residuals of the GH (Equation (13)) predictive model. Residuals calculated as the difference between the real GCI value and the GCI value quantified by the GH (Equation (13)) model reached a mean of 0. The minimum value was at the level of −8.7093, while vice-versa, the maximum value was +10.2065. Thus, the real deviation range reached the level of 18.9158.
Since the results of the non-linear regression represent a starting point for the creation of the GH model, we can state that there is a correlation between the GCI and HDI indices. In this regard, the research hypothesis, H2, was confirmed at the significance level of α = 5%.
4.3. The Results of Regression Modelling—GDH Model
Based on the results of the previous non-linear regression analysis, we proceeded to create the third regression model—the GDH model. In this case, the model consisted of one dependent variable (GCI score) and two independent variables represented by the indices, the DBI and HDI. The GDH model was aimed at detecting the existence of relations among the global competitiveness assessment (GCI) and the impact of two indices at the same time.
The analysis of relations within the third model in the context of the GCI, DBI, and HDI was based on the following general relation:
Based on the essential parameters results achieved, it is obvious that that the proportion of the variability of the examined GCI (RSquare) represented 87.5091% and the adjusted determination coefficient affecting the extent of the variability explanation of the selected data by the given model achieved a value of 87.1163%.
The analysis of variance (ANOVA) results showed that the variability caused by random errors was significantly lower than the variability of measured values explained by the regression model. The achieved value of the significance level (Prob > F) points to the adequacy of the model used based on the Fisher–Snedecor test criterion (F = 222.7846). The significance level achieved a value at 0.0001, so it can be concluded that the model was adequate at the chosen significance level of α = 5%. In this regard, the assigned predictors were adequate for prognosticating the value of GCI.
The quantified estimates of the effect size of the individual variables in the regression model, GDH (Equation (14)), are presented in
Table 6. Moreover, from the performed analysis, it is evident that the indices, HDI and DBI, are considered to be significantly effecting factors, but the variable "year" is not. At the significance level if α = 5%, the interaction of the HDI and DBI indices was statistically significant as well as the square number of these indices. The change of the GCI score was also determined to be significant by the square interaction of the HDI and DBI indices, as well as by the square interaction of the HDI and the individual year. In addition, from the analysis, it is evident that the HDI (expressed by main effect) had the most significant impact on the GCI score change.
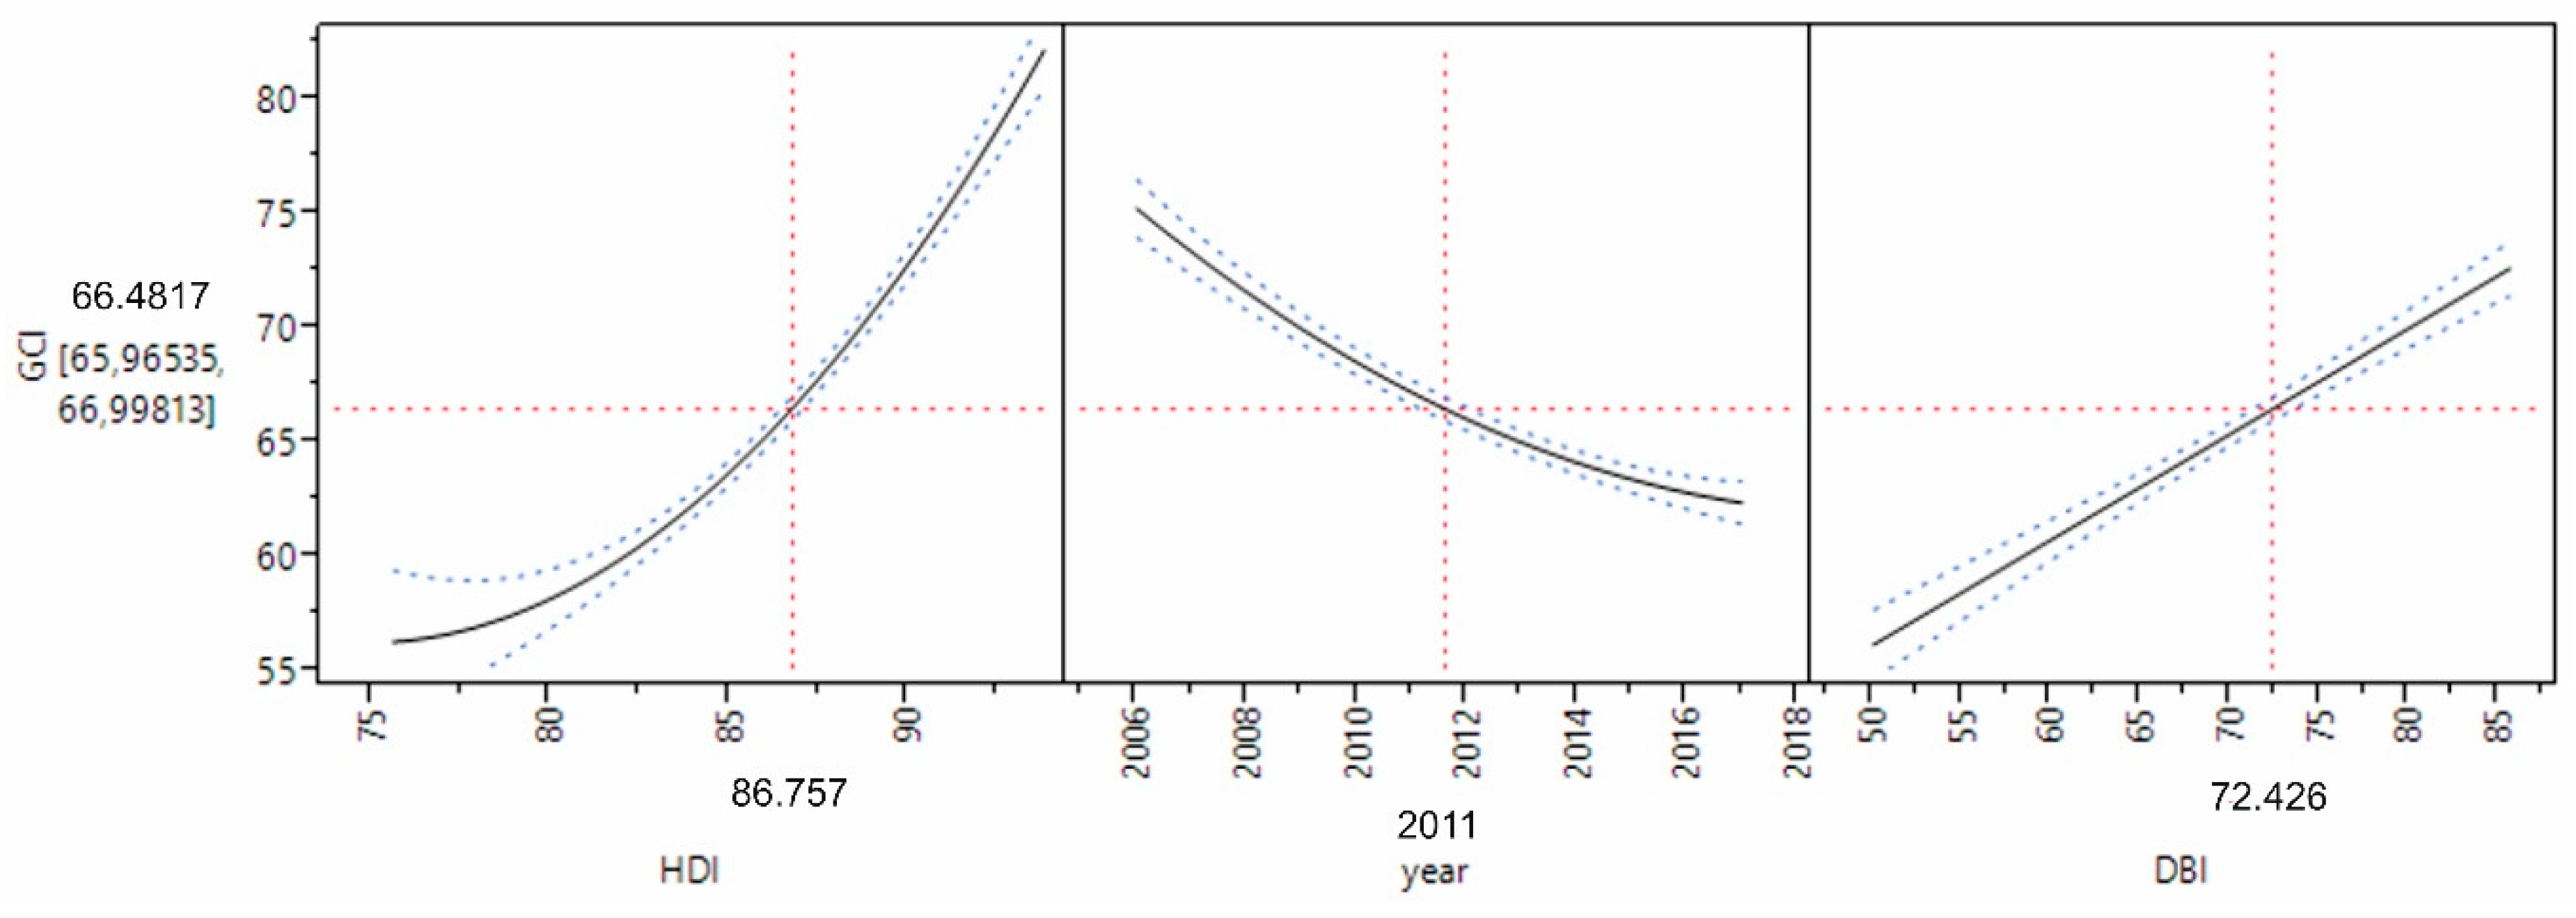
The prediction profile of the analyzed model, GDH, listed in
Figure 8 points to the finding that the dependence of the GCI on the DBI and HDI indices, as well as, on the "year" variable, is non-linear. The parameter estimation analysis (
Table 6) confirms the mentioned findings. The course of dependency of the HDI and DBI indices represented the quadratic function whose graph is a parabola. Furthermore,
Figure 8 shows that there was a local minimum of the function, whereby the dependency changes from concave to convex. However, no local extreme was evident in the interval of the values examined. The impact of the HDI on the change of the GCI score was expressed as parabola, as in the previous cases. This local minimum of the HDI score was about 72. Increasing the HDI score to the local minimum value caused a decrease of the GCI score. However, the local minimum value, which over fulfilled the dependency examined, led to significant increase of the GCI score. Based on the impact of the input variable "year" as the last predictor modelled, we found that increasing the variable "year" led to a decrease of the GCI score.
In accordance to the parameter estimation in the GDH model (
Table 6) and taking into account the constant that was added to the model in order to deal with the non-orthogonality of the input data, the final prediction model has the following form:
The residuals of the GDH (Equation (15)) predictive model are shown in
Figure 9. The residuals quantified as the difference between the actual value of the GCI and the GCI value calculated using the GDH (Equation (15)) prediction model achieved a median equal to 0. The overall actual variance range achieved a value at the level of 13.3935. In this regard, the residuals’ variance ranged from a minimum value of −8.4163 up to the maximum value of +5.2473.
The last partial analysis focused on the GDH model creation point out that the interrelations among the global indexes examined were not linear. Individual global indices acting as independent variables within the GDH model affected the GCI score change non-linearly. It is also important to point out the significant effect of the interactions of independent variables. In addition, the year in which the index was evaluated played a major role in predicting the GCI score. However, these conclusions offer the opportunity for a deeper analysis of individual global indices and a detection of the causes of non-linearity and their interactions.
4.4. The Verification of the Regression Models
Based on the results of the previous non-linear regression analysis, we focused on the verification of the GD (Equation (12)) and GH (Equation (13)) model. Given the unavailability of the HDI scores for 2018, this verification analysis was only performed for the GD model (Equation (12)). Our intention was to predict the GCI 2018 score based on the (real) available DBI scores and then compare the difference between the calculated GCI 2018 score and the GCI score published in World Economic Forum 2018 report. The following
Figure 10 graphically presents the GD (Equation (12)) model verification and the GCI score prediction for 2018.
Due to the GCI and DBI data availability for 2018, the proposed GD model for this particular year was verified. Despite the fact that mathematical statistical models were valid only in the range of values used in their construction, the GD model verification reached an average deviation of quantified and real values at the level of 6.1236%. The minimum deviation was calculated for Estonia (0.4994%), while the maximum deviation was found for Luxembourg (19.5141%). In this regard, the result achieved can be considered acceptable. However, due to the complexity of the GDH model, its application in 2018 would result in a significantly lower deviation.
5. Discussion
In general, few research studies have been devoted to an assessment of the global competitiveness of countries in relation to other multi-criteria indices. Globally known organizations evaluate countries annually according to different criteria or aspects. Based on the data available, authors have focused on the assessment of competitiveness, business, or innovation environment from different perspectives using various indices or indicators (see the literature review). However, an examination of the interrelations among various indices using regression modelling has not been analyzed yet.
As an example, a multi-criteria assessment of the business environment within the selected countries was provided by [
57]. The authors selected four different types of indices related to the business environment—the KOF
(“Konjunkturforschungsstelle” = the German word, meaning Economic cycle research institute) index of globalization, the corruption perception index, the global innovation index, and the GCI—in order to compare results with average values over the European Union. In the research study, benchmarking and factor analysis was employed to identify and compare factors of business development. Multi-criteria analysis of sustainable socio-economic growth and development was addressed by [
58]. The HDI was used as an indicator for human development, while the gross domestic product (GDP) was used as an indicator to reflect economic growth. Although the results showed that economic growth has a negative short term relationship with the HDI, the result was not significant. However, the coefficient for the long term relationship was significant. The findings confirmed that economic growth leads to human development, and macroeconomic policies aimed at achieving sustainable economic growth should be maintained. Another perspective for global competitiveness assessment was presented by [
59]. The author assessed competitiveness based on innovation and investment in human capital in relation to unemployment and economic growth. The approach, based on panel vector-autoregressive models, indicated a lack of labor productivity and investment in human capital in order to decrease unemployment and increase economic growth. In regard to competitiveness, the paper [
60] tested the relations between the GCI and economic growth rate by means of panel Granger causality analysis based on the annual data for 114 countries divided into five groups by income criteria for the period of 2006 to 2014. The results confirmed a strong unidirectional causality between the indicators analyzed, i.e., GDP growth causes global competitiveness. Additionally, the authors found that the GCI was not successful in predicting economic growth.
The panel analysis results suggest that there is a direct linear relationship between the GCI and HDI. Moreover, the impact of the DBI on the change in the GCI score was not confirmed.
In our study, the regression models, GD (Equation (12)), GH (Equation (13)), and GDH (Equation (15)), point to the fact that the analyzed interrelations among the GCI (as dependent variable) and the DBI and HDI (as independent variables) are nonlinear. The application of nonlinear regression analysis led us to this conclusion and also revealed an interesting result. Based on the analysis, it was revealed that the real dependence among the analyzed indices shows some local minima, and after they were exceeded, the GCI score increased parabolically, depending on the DBI and HDI score increase. In addition to the above, the complex regression model, GDH (Equation (15)), also detected the mutual influence of the interaction of the DBI and HDI on the GCI score change. Therefore, the undisputed benefit of the resulting prediction model is uncovering deeper connections between the effects of the DBI and HDI on the overall GCI score change, as well as designing a computational model for predicting the GCI score with an average error at the level of 14%. In this regard, verification of the regression model (Equation (15)) on 2018 data pointed to its validity with an average deviation of 3.597%.
6. Conclusions
Economic prosperity and sustainable economic growth can be achieved by increasing competitiveness and creating a favorable business environment, while preserving a sufficient level of socio-economic cohesion. All the above-mentioned components are closely linked. Taking into account the overall results, we came to the conclusion that the business sector represents a key role in the process of sustainable economic development, for the reason that business activities are realized by human resources and contribute to a considerable improvement of competitiveness. A stable social market economy, environmentally-friendly economic development, and an enhancement of competitiveness lead to sustainable business strategies. We identified the main areas of countries’ interests by creating three novel models with a combination of three indices—the GCI, DBI, and HDI. Our findings are important for policy decision-making processes and to attract investors with new technologies and innovation activities.
Globalization, growing international competitiveness, dynamic development of information and communications technology, growing role of knowledge, demographic problems, and shortages of resources, at the turn of the 19th and 2oth centuries, created great challenges for the European Union [
61]. These circumstances have increased competition and forced all economies to pay more attention to international competitiveness, business conditions, and sustainable economic development. Today’s Europe seeks smart, inclusive, and environmentally economic growth. This fact is also highlighted by [
62], who consider the growth of the European Union as a combination of intelligent growth, sustainable growth, and growth-supporting integration. Moreover, one of the most urgent economic and managerial issues is, according to [
63], the formation of a high level of competitive human capital of countries as well as ensuring high level rankings of global competitiveness.
As reported in the Annual Report on European SMEs 2017/18 [
64], EU (28) SMEs made a significant contribution to the recovery and subsequent expansion of the European economy. They accounted for 47% of the total increase from 2008 to 2017 in the value added generated by the non-financial business sector, and for 52% of the cumulative increase in employment in the sector. In fact, their contribution exceeded what would have been expected based on their relative importance in the economy. The number of SMEs in the EU (28) increased by 13.8% between 2008 and 2017. Overall, in 2017, SMEs in the EU (28) non-financial business sector accounted for almost all EU-28 non-financial business sector enterprises (99.8%), about 66.4% of the total EU (28) employment, and slightly less than three-fifths (56.8%) of the value added generated by the non-financial business sector. Based on our research results, a significant impact of business environments and human capital on the position of EU (28) countries within global competitiveness rankings was confirmed. As SMEs account for more than 90% of the total number of EU(28) enterprises and two-thirds of the total EU (28) employment, with the expected continuation of this strong recovery of European SMEs, we see the potential in developing this business sector, which is considered an important driver of the recent growth and competitiveness of many European SMEs.
To survive in the current competitive and unpredictable business environment, it is significant for firms to search and enforce capabilities that lead them to adapt and cope with the dynamic changes of the environment for their sustainability [
65].
However, our findings also have some limitations. The data unavailability in the case of the HDI score for 2018 can be considered as one of the main research limitations, since it was not possible to verify the GH (Equation (13)) model and subsequently predict the GCI score for 2018. We assume that increasing the complexity of a new prediction model by including the HDI would reduce the deviations and contribute to an improvement of the model’s predictive ability. In view of the economic disparities and various political conditions for sustainable development, it is difficult to state whether the paper results were valid for all countries analyzed. Therefore, it would be interesting to verify the regression models created for each country. We consider the assessment of European countries via the overall GCI, DBI, and HDI scores as insufficient to understanding important and often hidden interrelations and factors influencing the countries’ overall potential. For future research, a deeper analysis of these indices is recommended. The analysis of indices should explore linkings and dependencies of individual pillars and indicators on the evaluation of global competitiveness and prosperity. In the case of the GCI, attention should be focused on investigating 12 pillars and 114 indicators, the DBI should be analyzed through 10 dimensions and 45 indicators, and the HDI should be examined through 3 dimensions and 4 indicators. Moreover, since the current study was concentrated on only the selected multi-criteria indices, future investigations should integrate more diverse economic, social, and innovation areas and aspects (in the form of other multi-criteria indices) to analyze the growth potential of individual countries thoroughly. In our opinion, analysis should be extended to two other indices, namely the global innovation index (GII) and the economic freedom index (EFI).


 ,
, 


