Mapping the ESG Behavior of European Companies. A Holistic Kohonen Approach
by
 ,
,
Irina-Eugenia Iamandi
1,2,* ,
,
Laura-Gabriela Constantin
1,2,
Sebastian Madalin Munteanu
3 and
Bogdan Cernat-Gruici
1 1
Faculty of International Business and Economics, The Bucharest University of Economic Studies, 6 Romană Square, 010374 Bucharest, Romania
2
Research Center in International Business and Economics (CCREI), 6 Romană Square, 010374 Bucharest, Romania
3
Faculty of Management, The Bucharest University of Economic Studies, 6 Romană Square, 010374 Bucharest, Romania
*
Author to whom correspondence should be addressed.
Sustainability 2019, 11(12), 3276; https://doi.org/10.3390/su11123276
Submission received: 3 May 2019
/
Revised: 5 June 2019
/
Accepted: 7 June 2019
/
Published: 13 June 2019
(This article belongs to the Special Issue Comparative Corporate Social Responsibility (CSR) and Sustainable Development Goals (SDGs))
Abstract
:In the context of increased awareness for complying with the multiple requirements for sustainable development, the stakeholders need to have the proper information for analyzing the corporate behaviors from various perspectives. Thus, the purpose of this research is to investigate and map the sustainability patterns of European companies at the beginning of 2019, in order to uncover valuable insights into the corporate sustainable behaviors. The Environmental, Social and Governance (ESG) performances of 1165 European companies were considered by applying the Kohonen neural network for clustering purposes at three main levels: (1) ESG overall level, including country and sectoral perspectives; (2) ESG thematic level; (3) ESG four-folded innovative level (stakeholder, perspective, management level and focus views). All three analyses carried out show a three-clustering solution—Lower, Middle and Higher ESG clusters. Most firms are top ESG performers and the companies with good ESG scores also have more related controversies. The results highlight the sustainability profiles of the examined companies. Firstly, the environmental and social priorities are preferred over corporate governance targets. Secondly, companies tend to implement a business-customized ESG approach for achieving organizational efficiency and competitiveness. Thirdly, there is a higher consideration of employees, external-directed measures, operational issues and process-orientation in the corporate ESG performance and development. The ESG approach of the European reporting companies is mainly mature, strategic and long-term oriented, aimed to increase the corporate competitiveness and to support the societal well-being altogether.
1. Introduction
The disclosure of corporate sustainability through integrated reporting and the enclosure of environmental, social and governance (ESG) criteria as part of the sustainable finance desideratum are topical concerns in mainstream academic studies, economic practice, and for European and other international policy makers and organizations [1,2,3,4,5,6,7,8,9,10,11,12].
In line with these focal points, there are several entrenched ESG performance-related academic themes: ESG reporting, ESG investing and relationships between ESG conduct and corporate financial/economic performance [13,14,15,16]. Typically, when approaching ESG performance, researchers concentrate on one or few economic sectors from a specific region or country (e.g., European basic materials industry in Dufwa and Hammarström (2015) [17]), analyze many companies from various countries and use large databases that provide ESG scores (e.g., Thomson Reuters’ Asset4 in Aouadi and Marsat (2018) [18], Ferrero-Ferrero, Fernández-Izquierdo and Muñoz-Torres (2016) [19] and Ortas et al. (2015) [20], Vigeo in Cavaco and Crifo (2014) [21], Bloomberg’s ESG in Han, Kim and Yu (2016) [22]) or operate with international classifications of performance-rated companies (e.g., S&P500 in Nollet, Filis and Mitrokostas (2016) [23], MSCI in Tang, Hull and Rothenberg (2012) [24], FTSE in Li et al. (2018) [25]). However, there are few papers that center only/mostly on the ESG performance [26,27,28,29] and, to our knowledge, none of these addresses exclusively the European case.
Our paper fills this gap by being a refined ESG focused-only analysis. Further, it addresses the current acknowledged requirements of the stakeholders (particularly, of the investors) for pillar-based and model-based sustainability insights from ESG analysis [6,8]. The objective of the present research is to identify the European sustainability pattern by mapping the corporate ESG behavior through a neural network analysis, explicitly the Kohonen self-organizing map (SOM). In order to contribute to a comprehensive European perspective, a large sample of companies is employed: all ESG reporting corporations registered in Thomson Reuters EIKON/Refinitiv database that are simultaneously headquartered in European countries/territories and listed on European stock exchanges at the beginning of January 2019.
We developed the examination on the premise that ESG reporting is usually employed, as the main source for measuring corporate sustainability through ESG scores [27]. Additionally, ESG factors are/should be considered by issuers in their overall business strategy and investors are increasingly including ESG criteria into the investment and decision-making practices [4,6,8,16,30].
Present research involves a three-level analysis. The first level represents a general scrutiny developed around the clustering of the companies by the three main ESG pillars. This examination also reflects the ESG risk exposure and provides country and sector insights. The second level consists in a detailed investigation aimed at grouping the business entities according to specific ESG themes included in the main ESG pillars. The third level of the analysis is an original enquiry based on four distinct organizational sustainability facets (main beneficiaries, perspective, management level, and functional focus of the ESG behaviors). This last part is furthered through a set of ESG-based innovative composite scores proposed by the authors. Specifically, our analysis enhances the ESG research stream through several contributions.
Our research joins the general literature that endorses SOM for business analyses [31]. As pointed out by researches, SOM enriches the grouping solution when compared to other clustering techniques by revealing the non-linear connections among the variables [32,33,34]. Additionally, the paper connects to more recent studies that apply Kohonen neural networks on rather large samples of European companies for mapping various forms of organizational performance [35,36]. Distinctively, our paper specifically targets the visualization of sustainability performance through Kohonen clustering. As far as we know, this is the first research on the ESG conduct of European companies developed through Kohonen neural network analysis. Furthermore, on the one hand, the ESG Kohonen maps illustrate the relative short/medium-term ESG behavior for the sample companies. On the other hand, it is widely accepted that ESG integration into various business aspects is hindered by “short-termism” [8] (p. 45). Thus, in our opinion, the ESG maps have the potential to moderate the mismatch between long-term oriented ESG performance and the short-term inclined investment profitability by providing periodically updated model-based ESG analyses.
This paper relates to recent studies advancing that the sustainable investing process should consider the overall ESG scores and all ESG pillars [27,28,29,37] and even the links between them [27,28,29]. We further contribute by employing SOM and clustering the entire sample of European companies. By doing this, we strongly put the first focus on the ESG performance, and later we derive the homogeneity/heterogeneity grasps at sector/country level. Additionally, the newer ESG TR/Refinitiv ESG Scores are employed for an up-to-date perspective and a detailed ESG assessment is advanced for the thematic and originally constructed scores.
The investigation also accounts for ESG related controversies reflected as essential factors for sustainability analyses in recent academic works [2,15,18,26,29,38,39,40]. Thus, we contribute with an ESG controversies-performance framework by analyzing the links between the ESG controversies (understood as risks) and ESG performance (regarded as opportunities).
Overall, the central development resides in a unitary and comprehensive ESG research that mirrors the various facets of the same phenomenon. The main outcome encompasses several maps of the European ESG performance cohesion, while, implicitly, revealing several sustainable reporting patterns. The conclusions reflect the following key findings: (1) European companies have a mature sustainable behavior, are highly ESG integrated and their sustainability model surpasses the sector or country level. (2) The ESG controversies impact mostly the top corporate sustainability performers. (3) The investigated businesses apply a strategic and individualized ESG model that balances the general welfare and the corporate overall performance.
The structure of the paper is the following: Section 2 presents a review of the specialized literature on ESG and the role of its components; Section 3 details the research data and applied methodology; Section 4 highlights the main results and a set of discussions for the three investigation levels; Section 5 outlines the conclusions of the research, the limitations and further research directions.
2. Literature Review
There is increased interest in identifying patterns of corporate sustainability, as companies are not only ‘judged’ by their financial performance, but also by their capacity to react to different environmental, social and corporate governance challenges. Additionally, the corporate integrated performance is supported by how well companies succeed in assimilating different sustainability criteria into their daily business practices on a customized basis. Analyzing the corporate sustainability patterns and classification by similar responsible conduct may offer valuable insights into how well companies thrive by changing their strategic orientations.
The following sub-sections of the literature review restate the role of ESG criteria in the context of sustainable development, emphasize the impact of various ESG components on the total corporate performance and justify the need for a structured ESG investigation through the use of clustering methods. These sub-sections provide the theoretical background for our in-depth investigation of ESG corporate behaviors at the European level.
2.1. Connecting Sustainability–CSR–ESG. ESG Reporting
Sustainable development is typically understood as a balance between the economic, social and environmental concerns [41] (p. 1408), with equal focus on present and future goals. While “sustainable development” (SD)/“sustainability” is identified as a broad concept to be mainly applied at the global, national or regional level (e.g., [42,43]), the operationalization of SD at the organizational level is best reflected in “corporate social responsibility” (CSR) or, more explicitly and easily to quantify, in “environmental, social and governance” (ESG) criteria to be fulfilled by companies in addition to their financial indicators. The transition from SD to ESG through CSR is also identified in the European Commission’s Communication from 2002 regarding the contribution of CSR to SD [44], where the integration of environmental and social matters in the wide-ranging business conduct of the companies lies in the heart of the CSR definition. The connection between CSR and ESG is explained by Miller (2018) [45], which states that CSR refers to the overall commitment of a company to its various stakeholders and the related socially responsible behaviors, whereas ESG refers to the explicit criteria that could be used to assess the sustainability practices of the company. In brief, ESG is about “the criteria used to evaluate a company’s commitment to CSR” [45], and ESG performance is the most suitable method for measuring “the corporate sustainable performance” [46].
The use of ESG data and indicators is a practical way of understanding CSR and integrating sustainability into corporate investment decisions (Sgambati, in Skroupa (2018) [47]). Moreover, ESG is associated with the concept of “socially responsible investments” (SRI), while it also affects a larger spectrum [48], like corporate “sustainable financial value” [46]. In recent literature [17,19,22,23,46,49,50,51,52], CSR and corporate sustainability are frequently proxied and measured through ESG scores.
The behavior of an ESG dedicated company reflects environmental consciousness (e.g., preservation of natural environment and biodiversity, reduced ecological impact, lower harmful carbon emissions, reduced usage of water and exhaustible resources, reduced climate and regulatory risks), social awareness (e.g., better treatment of employees, increased contribution to the wellbeing of the community, promotion of diversity and human rights, health and safety at work, ethical behavior) and best practices in corporate governance (e.g., accountability and transparency, higher protection of shareholders’ rights, eradication of corporate bribery/corruption and unfair practices, managerial effectiveness and structure, and consolidation of an independent board of fairly paid directors) [30,48]. The ESG criteria are used by responsible investors to screen their potential investments. The integrated reporting [53]—economic, environmental, social and corporate governance criteria considered altogether—accurately present the ‘health’ of a company and its long-term performance in the context of sustainable development.
Different studies [4,48,50,54,55] suggest that investors increasingly consider the inclusion of ESG criteria into their investment decisions due to their assumed potential to create long-term and sustainable value for the shareholders, mitigating risks, complying with stakeholders’ demands and supporting sustainability, in general. Another two reasons for including sustainability criteria refer to the personal ethical values of the investors (screening the companies to include in or to exclude from their portfolios) and the aim of inducing a direct positive impact on the communities [4,50]. However, eliminating the so-called ‘sin industries’ [15] and strictly investing based on ‘sentiment or values strategies’ does not prove to be a financially efficient approach if portfolio diversification is not previously applied [56].
Although sustainability disclosure is mainly a voluntary corporate matter, the regulations in force at the European level [57,58] are highly useful for stakeholders, in general, and especially for investors. In order to facilitate sustainability reporting [59], there are well-known international and global organizations providing specialized guidance for professional disclosure of corporate ESG data: Organisation for Economic Co-operation and Development (OECD), United Nations Global Compact (UNGC), International Organization for Standardization (ISO), Global Reporting Initiative (GRI), Sustainability Accounting Standards Board (SASB) etc. The peculiarities of managing sustainable business operations in different industries need sectoral dedicated analyses (e.g., GRI, SASB) to investigate the ESG commitment of companies [60,61,62].
Apart from the organizations offering support for companies in their sustainability reporting endeavors, there are institutions that rate companies according to their ESG performance in order to help various stakeholders take the best-informed business decisions, regardless whether they are investors, customers, employees or wide communities. For instance, Refinitiv (the prior Financial and Risk business of Thomson Reuters) provides detailed and aggregated ESG performance and controversies-related data to customizing sustainable investment strategies, based on Thomson Reuters ESG Scores for companies, which are computed on a yearly basis from company-reported data [63]. The previous Thomson Reuters’ Asset4 ESG ratings or the new ESG scores were used in various studies (for example, [17,18,19,20,27,48,56,64,65,66,67,68]) to quantify the corporate sustainability or responsible behavior.
The business case for including ESG criteria into the corporate strategy and investment decisions benefit from an increased interest in recent literature. Although the link between ESG performance and corporate financial performance is still debated in specialized studies (e.g., [15,19,69]), a series of advantages related to the creation of business value are identified for ESG committed companies: reinforced stakeholder engagement and trust [55,70], better financial outputs both in market-based and accounting-based measures [4,25,70,71], good management of operational, reputational, legal and supervisory risks [4,30,55], enhanced relationships with business partners, customers and employees [30,71], better management quality [4], improved productivity and operational performances mainly through process and product innovation [30,71], higher organizational effectiveness and competitive advantages [19,72], lower cost of capital [30] etc.
After a consistent synthesis of studies related to the impact of ESG, Brooks and Oikonomou (2018) [15] concluded that the positive effect of ESG performance is lower than the negative effect of ESG neglect on the financial performance, because usually investors are more averse to risks than favorable to opportunities [55]. The conclusion of Brooks and Oikonomou (2018) [15] reiterates the need to analyse the different ESG components, even if the positive contribution of ESG is not always statistically significant to corporate financial performance. Therefore, the prerequisite of identifying sustainability patterns at country or industry level becomes even more stringent, since the stakeholders select their companies of interest based on corporate responsible behaviors towards specific ESG issues.
2.2. Unravelling ESG Behavior
The effects of CSR/ESG inputs may be difficult to assess because of the composite nature of the concepts (multi-dimensional constructs that highly influence each other) and their variate outcomes (different influences on corporate performance and stakeholders). The analysis of Thomson Reuters’ Asset4 ESG sustainability index conducted by Jitmaneeroj (2016) [27] revealed that the ESG total score is influenced by both the direct effects of its four components (environmental, social, governance and economic pillars) and the indirect effects of their causal inter-relations [27]. The influence of these components is industry-specific and Jitmaneeroj (2016) [27] found the following descending order of their primary contribution to industry sustainability: social performance (the most important component for the majority of the economic sectors), environmental performance, economic performance and corporate governance performance (without significant importance in any economic sector) [27].
When separating the environmental (E), social (S) and corporate governance (G) facets from the ESG scores, various studies found that the impact of the three dimensions on the corporate financial/economic performance of the companies is dissimilar [22,49,52,67,68]. This finding supports the need for customizing the sustainability efforts of the companies according to the business context [7,67,70,73], as the impact of ESG components significantly varies across countries and sectors or industries [4,30,73,74]. The ESG contributions should be particularly directed towards the matter(s) that is/are generating the highest increase in the corporate value and economic-financial performance [71,75]. Some examples are stated by Amel-Zadeh and Serafeim (2018) [4]: dealing with climate change and resource use/efficiency (environmental pillars) in the energy sector, emphasizing the corporate policies related to business partners and suppliers (social pillars) in the consumer and retail sectors or stressing proper corporate governance policies and board management issues (governance pillars) in the financial sector [4]. On the contrary, the corporate support equally directed towards all ESG components is not considered an efficient strategy [75], because the impact of each component seems to be more effective depending on the country, sector/industry, local business conditions and company size and strategy. Moreover, as pointed out by Porter et al. (2012) [71], the aggregation of some ESG indicators or dimensions is not always relevant to be included in the business strategy. The need for a focused ESG approach emerges because companies have limited resources to allocate between their inter-related sustainability objectives [27,70].
Some examples are provided below regarding the different impact that various ESG components have on the corporate financial performance. This outline is about how companies group and how they vary according to their preference for certain sustainability issues. The need for identifying in detail the pattern of ESG involvement is justified by the diverse findings achieved in the literature.
Nollet, Filis and Mitrokostas (2016) [23] and Velte (2017) [68] found that the corporate governance component has the strongest contribution to improved corporate financial performance, partly due to its positive influence on shareholders and/or the long tradition of corporate governance reporting. In a study developed for the Korean market, Han, Kim and Yu (2016) [22] showed that the corporate governance performance was positively related to financial performance, the environmental performance was found to be negatively related to financial outcomes and the social performance had no statistically significant impact on the financial results. Analyzing Korean companies as well, Yoon, Lee and Byun (2018) [52] confirmed the positive contribution of corporate governance to corporate value especially for the large companies. Using an international sample of investment and fund managers, van Duuren, Plantinga and Scholtens (2016) [37] (p. 531) found that the professional asset managers appreciate the governance component the most out of all three ESG dimensions, as a good indicator of the management quality.
Regarding Nordic countries (Sweden, Finland, Denmark and Norway), the empirical results of Dahlberg and Wiklund (2018) [50] showcase that the environmental component has the highest impact on financial performance, as the ecological issues are very relevant for investors in these countries. Sassen, Hinze and Hardeck (2016) [66] used a broad sample of European companies and applied a different view regarding corporate value, which was based on decreased risks instead of higher financial outputs. Their results revealed that social performance significantly contributes to decreasing the companies’ risks, followed by environmental performance. The same impact order of ESG components on the corporate economic performance was exposed by Sila and Cek (2017) [67] for a set of Australian companies: high influence for social performance, medium influence for environmental performance, and almost no influence at all for governance performance. For the Brazilian case, Miralles-Quirós, Miralles-Quirós and Valente Gonçalves (2018) [49] noted that the environmental component (for companies not included in environmentally sensitive industries) and the social and corporate governance components (for companies in environmentally sensitive industries) are the ones that render positive and significant results. The influence of industries in determining the environmental, social and corporate governance contributions was investigated in the literature from different perspectives [27].
The topic of the ESG controversies related to environmental, social and governance issues was investigated in the literature because of the assumed negative impact that the ESG problems or weaknesses may have on the corporate financial results and the need to deal with them. De Franco (2018) [38] (p. 2) empirically proved that strong controversies (“failures of a company to address and mitigate associated risks”) negatively affect the financial performance from the investors’ perspective. This effect was confirmed only for European and US stocks, while an opposite result was achieved for the Asia-Pacific region, where a lower number of controversial stocks were examined [38]. The ESG controversies are usually based on public or media disclosure of ESG-related corporate scandals, and Aouadi and Marsat (2018) [18] interestingly found a positive impact of ESG controversies over the firm value, which could be associated with an increased corporate visibility but not a higher appreciation of the company.
Cavaco and Crifo (2014) [21] explored the corporate complementarity-substitutability of ESG dimensions and found that responsible corporate behavior towards employees, customers and suppliers (social and business dimensions) may contribute to strengthening of financial performance, but mutually supporting the environment and the customers and suppliers (ecological and business dimensions) may be detrimental to financial performance because of the relationships between the stakeholders involved. The results of Cavaco and Crifo (2014) [21]—for European firms—reinforce the need for specialization and synergies in corporate responsible involvement for rendering the best financial performance.
The rather contradictory results that were achieved on the contribution of ESG components to the enhancement of financial performances are due to the differences between investigated countries, as well as variances in applied methodologies [67]. For instance, the differences between countries are pointed out by Dahlberg and Wiklund (2018) [50] (e.g., Korea versus Nordic countries), while the methodological variances appear both for data collection and data processing (e.g., issues related to ESG data reporting, comparability, quantification, reliability, suitability and cost efficiency were identified by Amel-Zadeh and Serafeim (2018) [4]). From a methodological perspective, Kasem, Trenz and Hřebíček (2014) [76] presented two methods for assessing corporate sustainability and ESG decision-making, depending on the equal or different impact that ESG indicators and dimensions have on corporate financial performance. Moreover, Kasem, Trenz and Hřebíček (2014) [76] proposed the use of neural networks (e.g., Kohonen self-organizing map) for ESG clustering, as a new method of sustainability assessment and classification of a large set of ESG indicators.
2.3. ESG Clusterization
Clustering based on CSR or ESG performance has been rarely used in the specialized literature, but it is seen as an increasing trend in the context of sustainable development and organizational sustainability. For example, the clustering solution was applied by Jamali, Sidani and El-Asmar (2009) [77] in order to advance on the role and impact of CSR. They conducted a cross-cultural empirical study on three countries in the Middle East (Lebanon, Syria, and Jordan) and they emphasized the four clusters related to managerial attitudes towards CSR.
The cluster analysis was also used by Afonso, Fernandes and Monte (2012) [41] for grouping nineteen Portuguese top companies by their social performance (CSR) and then investigating the (cor)relation between their social and financial performance. The results outlined the existence of three CSR clusters (High, Medium and Low CSR) and the positive relation between CSR and financial performance was not confirmed, but the ‘middle path’ was reinforced instead: the Medium CSR group of companies had the best financial performance in terms of ROA (return on assets) and ROS (return on sales).
Cluster-based research conducted by Ortas et al. (2015) [20] showed that the national and institutional contexts—as complex aggregations of economic, social, political, legal, cultural etc. factors—influence the ESG performance of companies that act differently regarding the main sustainability issues. The authors analyzed the ESG performance of a series of sustainable companies in Spain, France and Japan, and a two-cluster solution was emphasized: the companies in Spain and France had relatively similar behavior and they were rather inclined to support social and corporate governance issues (European group), while the Japanese companies were more devoted to environmental issues (Asian group).
In Jitmaneeroj (2016) [27] the clustering research is centered on analyzing the ESG performance and the relations among ESG components. International companies are grouped through expectation maximization (EM) clustering within each of the Thomson Reuters economic sectors. The employed variables are initially the four TR ASSET4 pillars (environmental, social, governance and economic) and afterwards their components. Further, the author analyzes for each sector the causal directions among the ESG scores used in the clustering solution.
The correlations previously presented in brief between different components of ESG and their dissimilar contribution to corporate financial performance reaffirm the need of a structured and more refined investigation of mapping the companies according to their sustainable behaviors. In view of the above-mentioned research and methodological considerations and as previously stated, the aim of our paper is to strategically disclose sustainability patterns in ESG clustered companies at the European level and not to identify correlations between ESG and corporate financial performance.
3. Research Data and Methodology
The present research is developed around the original analysis for mapping the sustainable behavior of European companies by applying a Kohonen neural network. An unsupervised learning method is used in order to reveal homogeneity structures in a suite of environmental, social and governance data. Our intent is to explore and discover new ESG knowledge by uncovering sustainability patterns, making the chosen model highly suitable for the present research. While obtaining a topological panorama of the original sustainability entry variables displayed as a grid of neurons, we simultaneously account for nonlinear statistical connections between the ESG dimensions [78,79].
Our research objective consists of analyzing the European corporate sustainable conduct. Therefore, the set of records used covers all ESG reporting companies—selected from the Thomson Reuters (TR) EIKON database—that are simultaneously headquartered in Europe (as depicted in Table 1) and listed on a stock exchange pertaining to this region, as defined by the aforementioned data provider. Table 1 presents a sectoral analysis of the ESG reporting/transparency degree for the companies recorded in TR database and headquartered in Europe at the beginning of 2019. With an average of only 10% of the companies voluntarily engaged in ESG reporting, the analysis is not aimed to be extrapolated to all companies in Europe, but to reflect the sustainability patterns of the European business entities dedicated to reporting about their environmental, social and governance performances. Moreover, there are sharp differences in the ESG transparency between the ten economic sectors: the Telecommunication Services lead the ranking with a share of around 31.5% of the companies involved in ESG reporting, while, at the opposite end, only roughly 6.5% of the Technology firms report on their sustainability efforts. We removed 79 companies listed on a non-European stock exchange of the total of 1244 ESG reporting business organizations headquartered in Europe in order to achieve our entirely European sample. For the remaining of the article, the investigated firms will be simply called “European companies”.
Our final research sample (as of 11 January 2019) includes 1165 European corporate entities that are not equally dispersed between countries and economic sectors. For instance, there are European countries not represented at all in the sample (e.g., Romania, Bulgaria), since no company head-quartered in those countries has recently reported on its ESG performance according to the TR database. For a more profound insight into the companies’ reporting pattern, please refer to Table 2, which displays the allocation of companies by countries (28) and by market-based economic sectors (10). The companies from UK dominate the sample, followed by those from Germany and France. As for the economic sectors, the Financials clearly leads the sample, while the Telecommunication Services and the Utilities seem to be the laggards of ESG reporting when strictly counting the number but not the share of the reporting business organizations.
The data collected from TR EIKON represents the most recent ESG available information computed by TR according to the published reports of the companies at the moment of the analysis: the ten ESG categories scores; the Environmental, Social and Corporate Governance aggregated scores based on the previous ten categories; the ESG scores; the ESG Combined scores (the ESG scores adjusted with the controversies scores); and the ESG Controversies scores [63].
The neural network algorithm is employed as a means of grouping the European companies into distinct clusters according to their ESG achievements. An overall exhibit panel reflects different profiled sustainability clusters. Specifically, the ESG entry data forms input vectors that, while presented to the neurons of the input layer, are transmitted to a two-dimensional map space also consisting of neurons, generally known as the output layer. The clustering result resides in a self-organizing map—SOM (the output layer of neurons) that accounts for different groups of the analyzed records. The foundation of this method is a competitive learning process among the neurons (nodes) of the output layer for “winning” the entry records. By employing the Euclidean distance, based on the value comparison of the ESG variables and the centers of the output nodes, the companies will be assigned to a cluster encompassing similar records through training the model and adjusting the weights (“strengths”) between the neurons in the input and output layers [78,79,80,81,82,83].
Our three-part unfolded research reveals the topology of the corporate European ESG performance and employs the following input fields of the new ESG scores of TR EIKON in the Kohonen model:
- The three ESG pillar scores (Environmental—ENV_S, Social—SOC_S and Corporate Governance—GOV_S)—for mapping the total ESG performance in European companies, as a general composite picture of its three main dimensions;
- Eight out of ten ESG categories scores (Resource Use, Emissions, Environmental Innovation, Workforce, Human Rights, Community, Product Responsibility and CSR Strategy)—for representing a theme-based European ESG behavior;
- A set of scores reflecting various ESG approaches that we computed based on the ten Thomson Reuters ESG themes (as explained in Table 3)—for drawing a panoply of innovative views on the ESG conduct at European level.
The proposed ESG composite indicators (exposed by various ESG approaches) were introduced in order to provide a solution to the increasing need of the companies to consider the sustainability criteria from a strategic and focused perspective rather than from an integrated and broad outlook. The business-related investigation of the European ESG corporate behavior was customized in this paper by using a four-folded approach for the clustered companies:
- ESG Stakeholder View—Identifying the main groups of beneficiaries targeted by the responsible actions of the companies for finding the favorite corporate orientation in terms of stakeholders;
- ESG Perspective View—Recognizing the preference for internal or external ESG-related actions as a strategic valuation of the measures considered to render the highest positive corporate results;
- ESG Management Level View—Categorizing the sustainable efforts of the companies giving the hierarchical levels involved for seizing the corporate preference for specific actions when managerial structuring is considered; and
- ESG Focus View—Highlighting the ESG-related priorities of the companies from a functional point of view, by identifying the corporate prevalence for applying ESG in technological processes based on innovation, in human relationships developed with various interest groups or in communication processes based on image creation.
We designed all four ESG approaches in order to answer to specific ESG investigation needs for pattern identification. The allocation of the ESG categories in each ESG main component reflects our perceptions regarding the investigated issues. We used a similar methodology to Thomson Reuters when computing the four ESG views. Table 3 presents in detail the four ESG innovative indicators.
We also proposed and calculated a computed variable (ESG.Combined_A) to reflect the controversies impact on total ESG score, as an average between ESG_S and ESG.Controversies_S.
The descriptive statistics of the variables exhibited in Table 4 reflect that the companies included in the final sample are, on average, higher ESG performers, with mean scores above a 50-medium threshold. Moreover, on average, they seem to be more performant on the Environmental component and less on the Corporate Governance one. The thematic ESG perspective conveys the highest average performance for the Human Rights constituent and the lowest for the Management one. The lower propensity towards corporate governance actions and the higher tendency to emphasize environmental and social accomplishments noticed for the European companies is partially supported by the characteristics of the regional market. As for the innovative ESG approaches, the companies achieve the highest average score for the ESG component related to employees (ESG.Em_S) of the ESG Stakeholder View, and the lowest average score on the image edge through the communication oriented ESG score (ESG.Co_S). This final trait is a result of the ESG Controversies component, that also reflects a lower than 50 average score and is included in the ESG.Co_S. The comparison of the medians illustrates a rather similar situation as in the case of the mean values, with fairly equivalent edges for the total, thematic and innovative ESG approaches. The skewness and kurtosis coefficients indicate that the sample data is, generally, not normally distributed.
The European companies indicate uniformity in ESG performance, having high mean and median values on the ESG scores. Investigating on this ESG behavior, our research relies on the main advantages of the Kohonen neuronal network. The first one revolves around the ability to incorporate the nonlinear connections between the clustering variables and to reduce this ESG multi-dimensional space to a two-dimensional grid. The visualization of the companies is thus simplified, as they are displayed on the map by their relative sustainable conduct resemblance. Further, SOM is generally presented as more accurate in categorizing most of the cases accordingly into their fitting cluster in comparison with other clustering methods (e.g., k-means, expectation maximization clustering) [84] (p. 324).
We also designed an ordinal variable controversies-related (ESG_RE) based on the ESG Controversies Score of Thomson Reuters, whose architecture reflects three levels of exposure to ESG risks: higher exposure, lower exposure and no exposure, as presented in Table 5. Since the companies are to be investigated as well according to their negative externalities exposed in the mass-media, the ESG_RE variable is further used to map the exposure to ESG risks and performances altogether within the general analysis.
Before profiling the analysis of training the Kohonen neural network, all the input fields were standardized as requested by computing the z-scores for the ESG variables. The research results, including the figures and tables, were obtained by employing the SPSS IBM Modeler and Statistics programs.
For each set of ESG scores, there were 70 clustering models trained with the Kohonen algorithm accounting for different sizes of the SOM (width—up to 10 and length—up to 7). In terms of building settings, the default values of the IBM SPSS Modeler (linear learning rate decay, neighbourhood—2, initial eta—0.3, cycles—20, neighbourhood—1, initial eta—0.1, cycles—150) were employed. Several features were considered in order to select, validate and profile the clustering models, as reflected in the specialized literature [82,85,86].
With the purpose of accounting for at least a ‘fair’ goodness-of-fit of the grouping, a value of minimum 0.2 of the silhouette measure of cohesion and separation was accepted (the higher values being preferred), while the predictor importance was considered to be approximately around a value of at least 0.2 and the ratio of sizes of the largest cluster to the smallest cluster lower than 2.
The Shapiro-Wilk test reflected the abnormal distribution of data in each group, so the ESG clustering results were validated both internally and externally by employing non-parametric tests. Specifically, the original fields (the ESG grouping data, the ESG scores, the ESG combined scores and the ordinal variable reflecting the controversy edge) were used to investigate the statistically significant difference between the ESG clusters through running the Kruskal–Wallis (KW) and/or the Jonckheere–Terpstra (JT) for ordered alternatives rank-based non-parametric tests. The latter of the two also accounts for a statistically significant ordered pattern of the clustering solution [87], apart from displaying significant differences between independent groups (reflected in rejection of the null hypothesis of the same distribution across the categories of the various ESG clusters and through the pairwise comparison analysis).
Additionally, at visual inspection, all the distributions of the inputs for the KW and JT non-parametric tests were generally found to be the same, very similar or similar. Consequently, the results of the ESG research are reflected mostly by their medians. Contrasting with this, for the analysis regarding the total ESG performance (mainly, the ESG_S) across countries within and between clusters, the results will reflect the interpretation of the KW test so as to epitomize the dissimilar distributions of the ESG_S.
Complementary, for a thorough and comprehensive analysis within and between clusters, some non-parametric statistical tests were performed for the ESG variables that either were statistically significant predictors in each neuronal analysis or significantly differentiated across the ESG Kohonen groups, according to the necessary comparisons: the Related Samples Sign Test (when asymmetrical distributions, but low number of ties were found), the Wilcoxon Signed Rank Test or the Friedman Test. This examination was run to account for significant median difference among the compared ESG performance variables or for differences in the distributions of these variables. To explain the contrasts between and within samples (clusters), the pairwise comparison analyses were conducted through the Dunn procedure with Bonferroni correction. We also followed Laerd Statistics (2015, 2017) [88,89,90,91,92,93] for the non-parametric analysis.
4. Results and Discussion
The main results of the analysis advance on the three research directions, revealing six different corporate European ESG displaying panels. The silhouette measure of cohesion and separation ranges between 0.227 and 0.403 as follows:
- The total ESG performance clustering result—0.321;
- The thematic ESG performance grouping solution—0.227;
- The four topologies of the various approaches on the ESG performance: Stakeholder View—0.264; Perspective View—0.403; Management Level View—0.329; and Focus View—0.293.
Therefore, the goodness-of-fit of the grouping solutions is asserted to be ‘fair’ and we may pursue our research as stated in the specialized literature [85,86,94,95,96].
The Kohonen mapping of the European corporate ESG behavior emphasizes the following topographies for the six grouping outcomes:
- A three-cluster solution revealing statistically significant dissimilar sustainability performances for the European ESG reporting companies. This result reflects that the firms in our sample pertain to one of the following typologies in terms of the average (mean and median) sustainable behavior: Lower ESG performance, Middle ESG performance or Higher ESG performance. This finding reflects the cohesion of corporate sustainability patterns at European level and the tendency of the investigated companies to influence each other when it comes to the ESG integration. Assuming that ESG reporting is a proxy for sustainability involvement, all the investigated companies are eventually good performers in terms of ESG behaviors when compared with the majority of non-reporting business organizations within the economic sectors; however, the clustering solution is based on the relative ESG performances that each group records against the others.
- A statistically significant upward trend in the medians of the inputs for each model from the lowest to the highest grouping result in terms of disclosed sustainability accomplishments. Specifically, the JT for ordered alternatives test ascertains these findings and the pairwise comparison analysis confirms the results at the level of each pair of clusters.
- A statistically significant upward trend in the medians for the ESG and ESG Combined scores among the three formed clusters, discovered through the JT for ordered alternatives test. The ESG and ESG Combined scores reflect the corporate sustainable performance and, respectively, the controversies discounted ESG performance.
- A statistically significant descending trend in the medians of the ordinal ESG controversies related variable (from no exposure to higher exposure to ESG risks) with respect to the upward evolution of the ESG behavior, excluding the pairwise comparison of the Lower and Middle clusters within the ESG Focus View analysis. These patterns are also confirmed with the JT for the ordered alternatives test. Overall, this result is quite intriguing, suggesting a probably inverse relationship between the ESG performance and the controversies related performance. This finding should be interpreted with due caution from at least two standpoints, where the high ESG performance is both an effect and a cause of the high ESG related controversies. On the one hand, an increased emphasis of certain business organizations on their ESG performance and reporting outcomes may occur as a measure to counteract the higher ESG controversies recently related to them on the market. On the other hand, the same result could be perceived as an augmented societal scrutiny and intransigence with regards to the leading ESG reporting companies, because the stakeholders’ claims are higher concerning the entities with proven sustainability potential.
- A statistically significant differentiation among the formed clusters from the viewpoint of the Shareholders ESG category, except for the thematic ESG analysis, reflected by the overall effect of the omnibus non-parametric tests. However, the pairwise comparison analysis displays no statistically meaningful dissimilarities among one pair of clusters: between the Middle and the Higher ESG clusters for the ESG total analysis and three of the ESG Approaches (Stakeholder View, Perspective View and Focus View) and among the Lower and the Middle ESG clusters (for Management Level View). Thus, we conclude that in terms of the achieved shareholders’ performance related to ESG, the companies from the analyzed sample are rather similar.
The three ESG clusters revealed by SOM emerge as a handy analysis tool for a profound assessing of the companies even when the ESG pillar/thematic/innovative behavior seems alike. The analysis of the distribution of the companies across economic sectors/countries targets the discovery of ESG patterns within and across clusters. These two variables (industry and country) are widely considered in the ESG/CSR specialized literature and act as control variables. Thus, the main interests are in finding similar groupings of companies across clusters and dissimilar classifications of companies within clusters. Of chief importance, these evaluations initiate while already encompassing the linear and non-linear connections uncovered by SOM between the ESG disclosed performance. These examinations offer valuable insights: firstly, that overall, the results substantiate the grouping solution through a harmonized sustainable behavior in each cluster and a dissimilar one across the three levels of ESG performance; and secondly, investors can assess each company simultaneously in terms of its relative ESG performance and position among sector and/or country peers.
4.1. Mapping the Total ESG Performance for the European Companies
For the sustainability research developed around clustering the European companies based on the main three pillars as a reflection of the total ESG performance, the Modeler Kohonen resulted in a topology defined by an input layer formed of 3 neurons and a 3 × 2 output layer composed of 6 neurons of which only three were used (X = 0, Y = 0; X = 1, Y = 0; and X = 2, Y = 0).
As displayed in Figure 1a, the results of the topology of the total ESG performance, obtained by mapping the relationships between the three main sustainability dimensions—Environmental, Social and Corporate Governance—reflect that the majority of the sampled companies (42.6%) pertain to the higher ESG performance group. The ‘classic’ components of a corporate responsible conduct (environmental and social achievements) differentiate more within the clustering solution when compared with the governance edge, as mirrored by the values of the predictors’ importance (see Figure 1b). However, the output reflects that the European companies are the most dissimilar in terms of their disclosed environmental practices. These findings suggest that, at the European level, the environmental requests that companies have to conform with are more different than the corporate governance demands. Especially in the case of large inter/multi-national companies, the compliance with shareholder and management requests—as part of the governance practices—seems to become more uniform, to give these business entities the opportunity to operate in more national settings.
As a reflection of the total ESG performance, the scatterplot of the Kohonen grid map is displayed in Figure 2, emphasizing the difference in the membership records in terms of the ESG score by the size of the circles and various shades of green (e.g., larger circles and darker green for Higher ESG).
Figure 3 exhibits the medians by cluster for the three ESG pillars, the corresponding composite ESG Score, the ESG Combined Scores discounted for relevant controversies, as well as the medians of the entire sample and the values corresponding to the 25th and 75th percentiles of the sample.
The first insight, confirmed through both statistically significant differentiations of the medians of the ESG scores and their increasing trend across all the three groups, is the blueprint of the Lower ESG – Middle ESG – Higher ESG performance between the Kohonen clusters (green shades). The cluster comparison analysis through a boxplot approach (green shades versus orange shades) at the level of the medians reflects the layout of the ESG performances and emphasizes the subsequent aspects with respect to the median of the entire sample and the corresponding values of the 25th and 75th percentiles:
- The lower ESG companies achieve environmental, social and governance performances below the 25th percentile of the sample, except for the ESG Combined Scores. All the medians are below the 2nd quartile.
- The middle ESG companies perform lower on all three dimensions (below the median) than the entire sample, while the values of the ESG Combined Scores exhibit a different behavior. All the medians of the middle cluster are above the 1st quartile and below the 3rd quartile.
- The higher ESG European businesses exhibit higher values than the 75th percentile of the sample on the environmental and social pillars, but lower on the corporate governance one. The medians of the ESG and ESG Combined Scores are also higher than the 3rd quartile.
For an exhaustive view, the following aspects regarding the median ESG performances are further inferred, supported by the Wilcoxon Signed Rank Test, Friedman Test and the post hoc analysis:
- At the level of the lower ESG group, the sustainable performance is found to be statistically diverse across the three pillars.
- At the level of the middle ESG group, the pairwise analysis stressed the statistically significant characteristic of the corporate sustainable engagement between two pairs of the sustainable performances. This result shows a rather homogenous median performance of the sustainability ‘traditional’ pillars (E and S) for the middle ESG Kohonen cluster.
- At the level of the higher ESG group, the sustainable performance is found to be statistically diverse across the three pillars.
Overall, both the median social (SOC_S) and the median environmental (ENV_S) performances are found to be statistically higher than the median governance (GOV_S) performance at the level of each cluster. This finding reiterates the higher propensity of large European companies for focusing—both in practice and in reporting patterns—on the environmental and social issues, considering that the broad society (customers, employees, business partners, local communities and administration etc.) rather appreciates their involvement in these types of direct matters, while the corporate governance issues are of a specific interest only for the investors or shareholders.
Moreover, for each ESG group, the Related-Samples Sign Test with continuity correction confirmed that the median of the paired differences between the ESG.Combined_A (average-combined overall ESG performance) and ESG_S (three-pillar based ESG performance) is statistically different from zero. For each cluster, the following conclusions emerged:
- At the level of the lower ESG group, an increase in the average-combined ESG performance (when accounting for the controversies layer) was recorded for 321 companies, while a decrease was recorded for 68 companies. Specifically, a significant median increase in ESG performance of 6.87 was acknowledged when considering the controversies impact across the three-pillar based ESG performance (with a median of 42.96) and the average-combined overall ESG performance (with a median of 48.44).
- At the level of the middle ESG group, an increase in the average-combined ESG performance (when accounting for the controversies layer) was recorded for 99 companies, while a decrease was recorded for 181 companies. Specifically, a significant median decrease in ESG performance of 1.16 was acknowledged when considering the controversies impact across the three-pillar based ESG performance (with a median of 59.28) and the average-combined overall ESG performance (with a median of 58.25).
- At the level of the higher ESG group, an increase in the average-combined ESG performance (when accounting for the controversies layer) was recorded only for 3 companies, while a decrease was recorded for 493 companies. Specifically, a significant median decrease in ESG performance of 12.17 was acknowledged when considering the controversies impact across the three-pillar based ESG performance (with a median of 73.00) and the average-combined overall ESG performance (with a median of 61.71).
Summarizing the above findings, the negative impact of ESG controversies increases as ESG performances grow. As previously stated when investigating the exposure to ESG risks, the higher attention on sustainability performances of the leading companies in the field may be due to high ESG controversies that they need to counteract or to high pressures from the stakeholders that expect a totally sustainable behavior from these companies. Conversely, the sustainability performances of the ESG laggards are not so harshly penalized by the incidence of controversies, indicating a lower interest in ESG behaviors of the uncontroversial companies or a slightly positive attitude from the stakeholders that usually focus their claims on the ESG leaders. The ESG controversies news in the mass-media frequently refer to larger sustainable companies with a consolidated tradition in ESG reporting, and, as a consequence, these are the companies most affected by ESG scandals.
Figure 4 shows the merged ESG performance for each of the three clusters based on their social, environmental and governance scores. Overall, companies included in the Higher ESG cluster seem to have more consistent sustainable behaviors, especially for the environmental and social dimensions.
To account for the controversies, the ESG performance—ESG risk exposure framework is outlined in Figure 5. The grouping solution reveals some interesting facts:
- There are three large groups of companies that follow the binomial relations between ‘no ESG risk exposure’–‘direct correspondence between ESG Combined and ESG performances’.
- A large number of companies with lower exposure to ESG risks are found in the Higher and Lower ESG clusters, while the Middle ESG cluster contains only two companies of this kind.
- There is a large number of companies in the Higher ESG cluster with high exposure to ESG risks.
- All three clusters contain a significant number of companies with high exposure to ESG risks that are subsequently penalized in terms of overall ESG performance. However, more companies from the Higher ESG cluster seem to exhibit lower performance, which confirms that companies with high ESG scores also have more related controversies.
For a comprehensive image of the three clusters, we show the medians of the ESG performance by country of headquarters (Figure 6) and by economic sector (Figure 7). These two investigations are aimed at consolidating the clustering solution and to confirm the achieved findings.
At country level (Figure 6), the analysis shows whether there are differences in the total ESG performance (ESG_S) between countries, within and across clusters that differ in terms of sustainability. By visually inspecting the histograms of the ESG scores of each country/territory of headquarters, we found that the distributions of the ESG scores were dissimilar.
Table 6 exhibits a detailed spread of companies at country and cluster level. Three particular cases are highlighted for a series of countries that have companies in each cluster. Spain, France, Netherlands, Portugal, and Sweden have the majority (more than 50%) of their companies included in the Higher ESG cluster. Austria is the only country with the majority of its companies (more than 50%) in the Middle ESG cluster. The Czech Republic, Guernsey, Ireland, Luxembourg, Poland and Russia are the countries/territories with at least 50% of their sustainability investigated companies included in the Lower ESG cluster. However, due caution is needed when analyzing the national prevalence for a specific cluster, because of the high differences in the number of investigated companies from each country.
The distributions of the ESG_S were revealed not to be significantly different between countries within each sustainability cluster, reflecting a rather homogenous ESG reporting behavior across countries at cluster level (Figure 6). This homogeneity of the sustainability patterns confirms the accuracy of the Kohonen clusterization. Moreover, in order for the companies to be truly performant, the findings reiterate the corporate need for developing strong ESG behaviors irrespective of country. Across clusters, some peculiarities were revealed:
- For the countries/territories with a very small/small number of ESG reporting companies and/or an allocation of the companies in only one cluster (Cyprus, Czech Republic, Gibraltar, Hungary, Isle of Man, Jersey, Malta, Portugal, and Ukraine), the KW test could not be run or it revealed no statistically significant difference between ESG scores across clusters for the respective countries.
- For a second group of countries/territories (Belgium, Greece, Guernsey, Ireland, Luxembourg and Norway), a statistically significant difference among the mean ranks was identified only for two clusters (Lower ESG–Higher ESG).
- A third group of countries exhibited different ESG behaviors among a pair of clusters:
- ○
- Higher ESG–Middle ESG and Higher ESG–Lower ESG (Austria, Denmark, Spain, Finland, France, Netherlands and Sweden);
- ○
- Higher ESG–Lower ESG and Middle ESG–Lower ESG (Poland and Russia).
- There was also a fourth group of countries for which the pairwise comparisons reflected that the mean ranks of ESG_S proved to be statistically dissimilar across all clusters (Switzerland, Germany, United Kingdom and Italy).
The majority of investigated countries/territories (15 out of 28) proved a significant difference between low and high ESG corporate performers. Out of these 15 countries, 12 are members of the European Union and the analysis discriminated between the extreme sustainable performances of the companies headquartered in these developed countries. The pattern of finding significant differences between all three clusters of ESG performances was identified in the case of four countries (three of them are EU members) comprising a large and very large number of companies. This evidence may also indicate their likely contribution in delineating the three ESG clusters.
As for the ESG analysis by the economic sector (Table 7 and Figure 7), several particularities were highlighted. Table 7 shows the distinct situation of the Energy sector, which is the only one with the majority of its companies (51.35%) included in the Higher ESG cluster.
After analyzing the differentiation of the median ESG_S across clusters at the level of each economic sector both through the KW test and the JT test, the differences in the three ESG pillar-based scores were found to be statistically significant across the three ESG groups for nine economic sectors.
After running the KW test, the median ESG_S performances in each sustainability cluster was not statistically different across the ten economic sectors (Figure 7), indicating a homogeneous sustainable behavior across economic sectors. Similar with the analysis at country level, the sectoral investigation validates the soundness of the clusterization solution and confirms the distribution of the companies in the three groups based on their ESG interlinkages. As such, the corporate sustainability performance is not dependent on the economic sector, but on the ability of the companies to deal with the ESG issues. However, several idiosyncrasies emerged from the pairwise comparisons for other ESG variables:
- The median social (SOC_S) performances in the Higher ESG cluster are statistically dissimilar across three economic sectors.
- The median environmental (ENV_S) performances in the Higher ESG cluster are statistically different across four economic sectors.
- In the Middle ESG cluster, the median ESG.Combined_S and the median ESG.Combined_A are statistically different for some economic sectors.
Top ESG corporate performers within the Financials sector show better environmental performance than: Basic Materials, Consumer Non-Cyclicals, Industrials, and Utilities. This indicates that services-oriented economic sectors perform better or have lower negative impact than production-oriented sectors in what concerns environmental issues. Considering the business focus, we also investigate the social contribution of the Financials. The results show that this economic sector registered lower performance than three other sectors (Consumer Cyclicals, Healthcare and Utilities), which are traditionally characterized by high pressures for responsibly complying with social duties. Regarding intermediate ESG performers, the nature of the business activities is decisive yet again. Companies from the Telecommunication Services seemed to be less harshly penalized for related ESG controversies or have a better image in the media than the organizations from other six economic sectors (Basic Materials, Industrials, Financials, Consumer Non-Cyclicals, Energy and Utilities).
4.2. Mapping the Thematic ESG Performance for the European Companies
The more granular part of the analysis was conducted for eight out of the ten main ESG categories. In order to obtain at least a ‘fair’ coefficient of cohesion and separation and to elevate it for a better delineation of the clustering output, we eliminated the two ESG variables related to shareholders and management. This is justified by the fact that the information provided by companies regarding these corporate governance issues may be very similar, especially for large businesses. This similarity resides in the fact that shareholders and management related information is usually offered by companies in their financial reports which are regulated in regard to the type of information provided. Both the ESG and the Management Scores are used in the analysis as they statistically differentiate between the clusters.
The Kohonen SOM reflected an input layer formed of eight neurons and a 1 × 3 output layer composed of three winning neurons (X = 0, Y = 0; X = 0, Y = 1; and X = 0, Y = 2). The result of mapping the main ESG themes shows that the majority of European companies are included in the Higher ESG cluster, while the minority covers the Middle ESG cluster, as presented in Figure 8a. Overall, the employed variables differentiate fairly between ESG paths, all impact factors achieving higher than 0.4 scores. The category of Resource Use differs the most within the three clusters, since the investigated companies pertain to different economic sectors with various production patterns. The Community related activities differ as well, since the sample contains organizations that try to cater in a customized manner to local or national requirements. Interestingly, the Environmental Innovation and the Product Responsibility categories are the most similar among the grouping solutions (see Figure 8b); one reason for this finding could be the tendency of all ESG leading companies in implementing the newest technology for sustainable operations in the market.
Mirroring the mapping of thematic ESG performance, Figure 9 displays the scatterplot of the Kohonen self-organizing map (SOM). Specifically, the picture highlights the ESG scores and the subsequent distinctive sustainability performance of each cluster, reflecting that larger and darker green circles stand for Higher ESG performance.
By plotting the median scores of the statistically significant ESG themes, Figure 10 shows the comparison among the three ESG Kohonen clusters. The group comparison analysis for the medians confirms the layout of the ESG performance. Similar to the total ESG performance analysis, there is graphical evidence of the differentiations of the medians of ESG thematic scores and their increasing trend across all the three groups. Further inspecting Figure 10, the subsequent aspects with respect to the median of the entire sample and the corresponding values of the 25th and 75th quantiles are shown:
- In the lower ESG group, companies achieve median thematic ESG performances below the 25th percentile of the sample, except for the Environmental Innovation, Product Responsibility and Management scores.
- The middle ESG companies perform lower than the median of the entire sample on all nine thematic ESG dimensions. All the medians of the Middle ESG cluster are above the 1st quartile.
- The higher ESG European businesses have higher values than the 75th percentile of the sample only for Resource Use and Community scores.
Moreover, the higher interest in community related issues—like being a good corporate citizen, concerned with business ethics, societal wellbeing and public health—as the companies become increasingly sustainable, indicates that the stakeholders pay more attention to ESG leaders and request them to be more responsible to community issues. On the other hand, the corporate interest for managerial commitment and effectiveness is decreasing when the companies become increasingly sustainable, as management issues could be rather perceived as prerequisites of a responsible corporate behavior. The issues related to human rights are of highest interest for medium and top ESG performers, indicating the corporate emphasis for societal issues that could further influence the strategic development of the business at local level.
For a wide-ranging image, the median ESG performances were also analyzed within each ESG cluster. The results are confirmed by the Friedman test, while the post hoc analysis emphasized that the sustainable performance is significantly diverse between several pairs of the ESG themes. Additionally, there is a clear pattern of differentiation in all three clusters (Table 8), with the same ESG themes (Community, CSR Strategy, Management, Product Responsibility, and Environmental Innovation) exhibiting lower medians (highlighted with light green and bold font) than several other ESG categories (marked with darker green). The explanation for this outcome could reside in a higher propensity of the ESG mature European companies to address distinctive sustainability topics related to their everyday operational activities (e.g., Resource Use, Human Rights, Emissions, Workforce). We also find a relative lack of interest in supporting general sustainability issues that are not directly related to their competitive differentiation (e.g., Community, CSR Strategy, Management). The Higher ESG Cluster distinguishes itself by additionally having two ESG themes (Workforce and Emissions) with statistically significant lower medians than other ESG categories. The results are displayed in Table 8.
In the following stage, we mapped the thematic ESG performances for the ten economic sectors, by highlighting four levels of sustainable performance based on the 25th, 50th and 75th percentiles of the sample for each ESG category. As displayed in Table 9, the research design involved two comparative analyses by ESG theme. The first one is performed across the three clusters, while the second one is within each cluster, across the ten economic sectors. Specifically, within the Kohonen clustering solution, a new level of analysis was considered, by grouping the companies within each cluster by economic sector and stressing the sustainable behavior, for each ESG thematic score, through the following comparisons: between the ten economic sectors within each ESG cluster, and between clusters by looking at the companies of the same economic sector.
The ESG thematic analysis across clusters by economic sectors revealed four situations in terms of the statistical differentiation of sustainable performance for 90 cases:
- No differentiation across groups: This is the case of Management_S, which seems to have a homogenous sustainable performance across the three clusters for BMT, CNC, TEC, TEL and UTL. These five market-based economic sectors have in common the focus of their companies on rather providing goods and infrastructure for the ‘hard’ industries than services for the ‘soft’ industries. As a result, the involved firms are slightly approaching the managerial issues in a common or standardized way, since they are not perceived as a competitive differentiation on the market.
- Differentiation in the ESG thematic scores for one pair of clusters: When solely discriminating between bottom and top sustainability performers, one topic from each ESG component stands out—Environmental Innovation (Environmental performance), Workforce (Social performance) and CSR Strategy (Governance performance). The economic sectors (e.g., BMT, HLC, TEL, UTL) that differentiate in this case have a broad impact on all stakeholders and communities. This finding restates the increased scrutiny of the public when societal welfare issues are addressed by renowned sustainable companies.
- Differentiation in the ESG thematic scores for two pairs of clusters, exhibiting heterogeneity of sustainable behaviors adopted by the European companies: This finding shows that top ESG performers appear to distinguish themselves from their peers in consumer-oriented business sectors with fierce price competition (e.g., CNC, HLC, TEC), where the buyers choose between vendors also based on additional criteria (like remarkable sustainability performance).
- Differentiation in the ESG thematic scores for all three pairs of clusters, highlighting the grouping of companies according to the three levels of sustainability performances: In this situation, three economic sectors (CCS, FIN and IND) lead the ESG differentiation from one cluster to another. This stems from an increased corporate answer to stakeholders’ requests within very competitive and diverse economic sectors.
A series of results may be emphasized from this first ESG thematic analysis.
By considering the number of cases with at least one pair of Kohonen ESG sets statistically different, a great variation in terms of the ESG thematic scores across the three clusters for each industry is depicted. More specifically, the differentiation pattern of the clusters is allotted along the cases as follows: Lower ESG–Higher ESG—85 cases; Lower ESG–Middle ESG—41 cases; and Middle ESG–Higher ESG—47 cases. Also, more than a quarter of the unique cases show significant differentiation between ESG behaviors across all three clusters.
Apart from Management_S, all other variables differentiate on at least one pair of ESG groups; this could be a consequence of Management_S not being among the initial clustering variables. Emissions_S is the variable that pertains to the highest number of cases (five economic sectors) when differentiating across all three clusters at once, while Environmental.Innovation_S achieves the highest number of cases (five economic sectors) by differentiating only across Lower–Higher ESG. This result supports the environmental propensity of the European companies.
Finally, there are three economic sectors that differentiate across clusters on a large number of variables: CCS, FIN, and IND. From this result, it could be inferred that these sectors mimic the ESG behavior of the entire sample regarding the clustering around the ESG themes. However, these are the three largest sectors of the sample and the result could also be interpreted in terms of influencing the ESG behavior of the sample.
The ESG thematic analysis across economic sectors within clusters emphasized a series of interesting aspects that, overall, reflect a low degree of variability in terms of the ESG behavior across the economic sectors, which also confirms the results of the total ESG analysis.
In the framework of a rather homogeneous case at cluster level, the CSR strategy—reflecting the corporate integration of economic-financial, social and environmental considerations altogether into everyday decision-making processes—acted like a differentiator in each of the three ESG clusters. In general, companies approach the issues related to CSR Strategy in a different way, considering the business impact at the local level and the nature of the economic sectors. The services-oriented sectors (e.g., Financials and Healthcare) put a lower emphasis on CSR Strategy than the manufacturing and infrastructure-oriented sectors (e.g., Basic Materials and Utilities).
Another two ESG discriminants at sectoral level were Product Responsibility and Environmental Innovation. The case of differentiating through Product Responsibility was identified inside the group of intermediate ESG performers, specifically for the companies in the Healthcare domain that, by their nature, were more dedicated to this topic than the ones in the Financials and Industrials sectors. Environmental Innovation differentiated within the cluster of top ESG performers, since the business organizations in the Utilities, Consumer Non-Cyclicals, Consumer Cyclicals, Basic Materials and Industrials are more intensely scrutinized than the companies in the Financials regarding their capabilities of reducing the environmental costs and providing ecological products, technologies and processes on the market.
4.3. Mapping Different Approaches of the ESG Performance for the European Companies
The detailed composition of the four ESG Views that we designed are presented in detail in Table 3. The results of the four innovative analyses of these ESG approaches revealed the following Kohonen mappings:
- For the Stakeholder’s View, an input layer formed of four neurons and a 1 × 3 output layer composed of three winning neurons: Lower ESG (X = 0, Y = 0); Middle ESG (X = 0, Y = 1); and Higher ESG (X = 0, Y = 2).
- For the Perspective View, an input layer formed of two neurons and a 3 × 2 output layer composed of six neurons of which only three were used: Lower ESG (X = 0, Y = 0); Middle ESG (X = 1, Y = 0); and Higher ESG (X = 2, Y = 0).
- For the Management Level View, an input layer formed of three neurons and a 3 × 2 output layer composed of six neurons of which only three were used: Higher ESG (X = 0, Y = 0); Middle ESG (X = 1, Y = 0); and Lower ESG (X = 2, Y = 0).
- For the Focus View, an input layer formed of three neurons and a 2 × 3 output layer composed of six neurons of which only three were used: Lower ESG (X = 0, Y = 0); Middle ESG (X = 0, Y = 1); and Higher ESG (X = 0, Y = 2).
As in the case of the total and thematic ESG analyses, the majority of the companies pertain to the Higher ESG clusters, while the minority belong to the Middle ESG groupings (Table 10).
Overall, the employed variables differentiate well between the ESG clusters (as depicted in Figure 11), all impact factors being higher than approximately 0.2. The following ESG patterns are emphasized for the components that are good differentiators at cluster level: the ESG issues with broad societal/public impact lead the stakeholders’ approach, the ESG external-oriented impact discriminates better between the corporate sustainable behaviors from the perspective’s point of view, the ESG topics related to strategic decision-making better separate when taking into account the management level and, finally, the ESG process-orientation based on technology and innovation has higher separation effect when focusing on the sustainable corporate priorities.
The first ESG innovative analysis and the median scores of the statistically significant stakeholder-related ESG performance are reflected in Figure 12. The radar graph also presents different facets regarding the position of the median performance of the ESG stakeholder approach in relation to the median of the entire sample and the corresponding values of the 25th and 75th quantiles:
- In the lower ESG group, companies achieve median stakeholder-related ESG performances below the 25th percentile of the sample, except for the ESG.Ow_S.
- The middle ESG companies perform lower than the median of the entire sample. All the medians of the cluster are above the 1st quartile.
- The higher ESG European businesses have lower values than the 75th percentile of the sample, except for the ESG.Cy_S and ESG.S_S.
A comprehensive view on the median stakeholder-related ESG performance, supported by the Friedman test and the post hoc analysis, offers additional insights:
- At the level of the lower ESG group, the sustainable achievement is found to be statistically diverse across several pairs of ESG performance.
- At the level of the middle ESG group, the pairwise analysis emphasized that the differences in medians are statistically significant between almost all pairs of the stakeholder-related ESG variables.
- At the level of the higher ESG group, the results mirror the Middle ESG cluster case.
As the companies become better performers in their sustainability shift from lower to higher groupings of the ESG Stakeholder View, less attention is paid to owners related issues and a higher emphasis is put on community matters with broad societal impact. This transformation of the corporate sustainable behaviors denotes the maturity of the ESG corporate leaders that manage their responsible actions rather guided by societal (enlightened) reasons than by business (short-termed) motivations. Moreover, including in the case of lower ESG group, the focus on owners related issues is lower than for the rest of ESG variables. For the entire sample of investigated companies, the sustainability efforts related to consumers and community are relatively similar. The employees are the stakeholders that benefit the most from the European companies included in the Middle and Higher ESG clusters, as an acknowledgement of their decisive role at the organizational level.
Going further with the second ESG approach, the median scores of the statistically significant perspective-related ESG performance are displayed in Figure 13. The median performance of the ESG perspective approach in relation to the median of the entire sample and the corresponding values of the 25th and 75th quantiles reflects the following observations:
- In the lower ESG group, companies achieve median perspective-related ESG performances below the 25th percentile of the sample.
- The middle ESG companies perform lower than the median of the entire sample. All the medians of the cluster are above the 1st quartile.
- The higher ESG European businesses have higher values than the 75th percentile of the sample.
The analysis of the perspective-related ESG performance (supported by the Wilcoxon Signed Rank Test and the Related Samples Sign Test) further revealed that the median of the difference across the two sides of the ESG perspective view is statistically different for all three clusters. Specifically, the tests exposed that the median increase in sustainable performance when looking at the ESG.Ex_S in comparison with the ESG.In_S is statistically significant irrespective of the Kohonen cluster.
From the lower to the higher sustainability performance group within the ESG Perspective View, the results underline that the European companies are addressing ESG internal issues and ESG external issues altogether, as intrinsic balancing components of their sustainable behaviors. However, regardless of the ESG cluster, a higher interest for the outer-oriented sustainability facet was identified when contrasted with the inner-oriented sustainability side.
The third innovative ESG approach reflects the ESG Management Level Score. The median scores of the ESG management level view are presented in Figure 14, contouring the related Kohonen clusters:
- In the lower ESG group, the investigated companies achieve median management level related ESG performances below the 25th percentile of the sample.
- The middle ESG companies perform lower than the median of the entire sample, except for the ESG.Ta_S. All the medians of the cluster are above the 1st quartile.
- The higher ESG European businesses have higher values than the 75th percentile of the sample, except for the ESG.Ta_S.
For a comprehensive view of the sustainability related to decision-making levels, the following aspects regarding the median ESG performances are further inferred, supported by Friedman test and the post hoc analysis:
- At the level of the lower ESG group, the pairwise analysis emphasized the statistically significant characteristic of the sustainable performance between two pairs of variables.
- At the level of the middle ESG group, the pairwise analysis stressed a similar situation with the lower ESG group.
- At the level of the higher ESG group, the sustainable performance is found to be statistically diverse across all three management level components.
Although less relevant in the lower and middle clusters of the ESG Management Level View, the ESG strategic issues become more relevant for the top ESG corporate performers. In the lower and middle sustainability groups, the ESG tactical issues and ESG operational issues are similarly addressed by the companies that prefer to concentrate on these medium and short-term sustainability matters, with rather immediate impact at the organizational level. In the higher ESG group, the interest for long-term strategic sustainability issues increases due to integrated competitive reasons (like achieving societal goodwill and license to operate, improved image of responsible corporate citizen), but the businesses are still the most concerned with operational issues.
Finally, the fourth innovative ESG approach considers the ESG Focus Score. The median scores of the ESG focus approach materialize in Figure 15, delineating the matching Kohonen solution by relating the median scores of the clusters with the median of the entire sample and the corresponding values of the 25th and 75th quantiles:
- Within the Lower ESG cluster, only the ESG.Co_S, outlining the image frame of the ESG, has the median above the 25th percentile of the sample.
- Within the Middle ESG cluster there is a similar situation, since only the ESG.Co_S has the median above the median of the sample.
- Within the Higher ESG clusters, the ESG.Po_S and ESG.F_S have medians above the 75th percentile.
For a complete view of this approach, the median differences of ESG performances—supported by Friedman test and the post hoc analysis—show that:
- At the level of the lower ESG group, the pairwise analysis underlined the statistically significant characteristic of the sustainable performance between two pairs of variables.
- At the level of the middle ESG group, the pairwise analysis emphasized the statistically significant characteristic of the sustainable performance between all formed pairs.
- At the level of the higher ESG group, the pairwise analysis also highlighted the statistically significant feature of the ESG performance between all pairs of composite variables.
Regarding the ESG Focus View, irrespective of the corporate sustainability development, the companies prefer to concentrate on ESG process related issues in order to increase their daily operational effectiveness through implementing sustainable technologies and innovation. In the case of the lower ESG group, the ESG human-oriented actions and the ESG communication-oriented measures are addressed in an undifferentiated manner. For the Middle and Higher ESG clusters, the hierarchy between the three pillars is the same, with the motive of image building through ESG involvement situated on the last position. This finding is due to the inclusion of controversies in the ESG.Co_S and stresses the importance of considering the ESG controversies when analyzing the overall corporate sustainable behaviour. Complementary, the results also confirm the strategic role of ESG criteria for corporate development on the long run, with ESG performance valued more than a simple image enhancer.
Typifying the mapping of the sustainable clusters for our four innovative ESG approaches, Figure 16 presents all the investigated companies on each parallel axis corresponding to each component of the four developed ESG views.
The Kohonen maps outline the most intense characteristics of the formed clusters and the visual examination consolidates the achieved results as follows: (a) From a stakeholder viewpoint, all the investigated companies are highly concerned with their employees’ well-being, since personnel is the key-actor for achieving the corporate performances. (b) The internal and external sustainability actions are complementary for the European companies, irrespective of their ESG development, confirming the propensity towards ESG outside issues and the all-inclusive responsible approach that they prefer to implement on the market. (c) The importance of operational differentiation and strategic inclusion of ESG competitive issues increases with the corporate sustainability growth. (d) The progress of the European companies on the sustainability paths highlights their orientation towards technology, innovation and relationship building, since ESG performances are not strengthened only for image purposes, but for strategic competitiveness on the long run.
5. Conclusions
Companies integrate ESG criteria into their business operations and decision-making processes in order to comply with sustainable development goals and improve their overall performance and acceptance on the market. The potential of ESG integration and reporting to enhance corporate financial performance is acknowledged both in the scientific literature [16] and by international practice evidences [6,97]. One group of stakeholders directly influenced by corporate behaviors are the investors. These are becoming particularly concerned with the ESG analysis for assessing risks and finding investing opportunities [6,97]. Moreover, ESG integration may be used to complement fundamental financial analyses [6]. As pointed out in theory and practice [27,97], although some common ESG patterns exist, a general approach is not useful anymore. This is justified by the fact that companies and stakeholders have different needs and sustainability experiences.
Since accurate and specific ESG evaluations are increasingly demanded by managers, investors and public decision-makers, the present study identified a series of corporate sustainability insights at the European level. The final contribution of the article is grounded on considering corporate ESG involvement as a standalone performance, that should be thoroughly investigated according with the particular conditions at business, sectoral and national levels. We employed the Kohonen neural network for grouping companies based on their similarity in ESG behaviors and the most recent ESG data provided by Thomson Reuters EIKON for 1165 companies headquartered in European countries/territories. In order to offer a comprehensive and customized image of corporate ESG involvement in Europe, we developed the analysis at three main levels.
Firstly, we investigated the overall corporate sustainability at the general level, including the country and sectoral perspectives. Secondly, we studied the thematic corporate sustainability at the particular level, for various ESG categories. Thirdly, we proposed and explored four innovative facets of corporate sustainability based on ESG composite views. All our analyses revealed a three-clustering solution, with the majority of companies pertaining to the top performers group.
The European ESG homogeneity-heterogeneity encounter is revealed. The close position of the three clusters on all the topological maps confirm that the investigated companies are all good sustainability performers, as they report on ESG criteria. However, the reporting businesses are grouped into three distinct clusters, showing that three different ESG models exist in Europe. The relative low number of achieved clusters further substantiates the strong cohesion between corporate ESG behaviors at the European level. ESG influence transcends the sectoral and national barriers and the companies do not necessarily apply an ESG model specific to their industry or country. The companies are influenced instead by their competitors or best practice examples, trying to ‘copy’ or ‘reproduce’ the most suitable ESG strategy for their business model. This finding has particular importance for investors and asset managers, that need to consider the precise sustainability performance of the targeted company, and not the ESG patterns at industry or country level. The result is consistent with the recommendation of [6] stating that ESG integration should match the individual case of each and every business organization.
Another finding exposes the link between ESG performance and ESG controversies. In general, companies with good ESG performance also have more sustainability related controversies. This conclusion confirms the outcome of Garvey et al. (2017) [40]. The explanation for this finding is two-folded, with ESG performance and controversies both seen as a cause and effect. On the one hand, companies may consolidate their sustainability involvement in order to improve their image on the market when ESG scandals arise. On the other hand, companies with good ESG performance also have greater exposure and stakeholders tend to ‘judge’ them more harshly. Investors may benefit from this finding by understanding that the analysis of general ESG indicators is not enough. More thorough thematic analyses are needed—as also indicated by Jitmaneeroj (2016) [27]—and the investors and wider community will finally make the difference between greenwashing and real long-term involvement [97].
Going further, the results of our research outline the ESG maturity of European companies. They support the sustainability objectives in the following descending order: environmental, social and corporate governance goals. This finding suggests that the European businesses take into account the investors’ and stakeholders’ ESG integration requirements in order to increase corporate competitiveness. According to Orsagh et al. (2019) [6], corporate governance is the ESG pillar that most investors are currently integrating into their investment process, but, in the coming years, they expect that environmental concerns will get higher attention. We show that European companies are well prepared to answer to this shift in sustainability orientation, due to the fact that they already attach a higher importance to environmental and social matters, while governance issues take a secondary plane. The focus on environmental issues at European level is also confirmed in practice by asset managers of global investment funds [97]. The implication for the investors resides in the unfolded opportunity, with the European companies already reacting to the future needs of the financial markets.
The results of our research also show that companies should be truly ESG performant, irrespective of the economic sector or country. Moreover, companies have understood that they should integrate ESG criteria into their business decisions regardless the reason. The investigation conducted for the ten market-based economic sectors revealed a rather homogenous sustainable behavior at cluster level, with only a limited number of differences between production-oriented and services-oriented sectors. Stakeholders, in general, and investors, in particular, should analyse the ESG involvement based on the individual performances of the targeted company and not only on the peculiarities of the sector or country.
The need for thematic ESG analyses is both confirmed in theoretical [27] and practical terms [97]. Our thematic ESG analysis restated the ESG maturity of the European companies that are ready to cope with the changing requirements and provide customized answer to the investors’ needs. The high ESG corporate performers are increasingly supporting community issues and decreasingly considering management issues. This finding is in line with the results of Orsagh et al. (2019) [6] that found that the current governance propensity is going to be replaced in the near future with the environmental and social inclination of the investors. The companies in Europe specialize in addressing distinct ESG topics directly related to their everyday operational activities and have a relative lack of interest in supporting general ESG issues that do not generate immediate competitive advantages.
The results reveal the ESG diversification-specialization pattern and confirm the findings in previous literature [21,27]. The need for a focused and customized ESG approach is reaffirmed in order for the companies to be fully efficient and competitive. Due to limited corporate resources, not all ESG issues can be equally supported, so investors must identify the topics of interest from their perspective and correlate these with areas of individual corporate involvement.
The results of our ESG innovative analysis highlighted various particularities. The maturity and specialization of the ESG involvement of the European companies is confirmed from different perspectives. Out of all stakeholders considered, the highest corporate sustainable contribution is dedicated to the employees, supporting the strong social policies in Europe. The external and internal directed ESG measures delineate together a balanced integrated approach, while the emphasis on the outside issues indicates that companies are rather dedicated to the broad community wellbeing. In order to increase organizational efficiency and competitiveness, businesses prefer to concentrate on ESG operational issues (Resource Use, Emissions, Human Rights and Product Responsibility). Finally, companies in Europe choose to focus on sustainable technology, innovation and relationship building through ESG integration and they do not use ESG endeavors only for reinforcing their image on the market. In this respect, ESG performance is approached in a strategic way, by implementing measures aimed both to increase the overall corporate competitiveness and to support societal well-being from an enlightened perspective. All these issues together are of real help for the investors that try to identify long term good performing and ‘healthy’ companies.
Forward-looking, the advanced SOM-based ESG-examination solution proves its genuine capacity to be further applied in the ESG analyses of the investors that include sustainability criteria into the investment processes. If replicated, it can reveal the transition of each company between the three ESG performance clusters. The relevance of our results for an ESG analysis is that the transition among clusters would be based both on the ESG scores and on the linear and nonlinear relations between them. Further, the investors can establish the desired analysis level: (1) condensed (the E, S and G scores) or granular (the thematic scores); and (2) at sector and/or country level. Also, this neural network solution could be of real interest for ESG disclosing companies that can have a model-based evaluation of their relative ESG performance considering their peers.
Summarizing the above findings, the results show that each company should apply a particular ESG approach in a common European context, by considering its specific organizational objectives and field of activity. There are no general recipes to be applied and not all issues could be equally supported, but the corporate ESG involvement needs attention and analysis on a continuous basis.
In terms of limitations, we mention a potential bias coming from different numbers of business entities across countries or sectors that could influence the grouping result. Still, the discrimination among sectors/countries was developed to have further insights on ESG and to partially overcome this limitation. Additionally, we omitted company-related control variables (e.g., firm size), as our declared intention is to enrich the ESG-focused-only academic thread and to develop the clustering solution exclusively on ESG criteria, irrespective of other variables. Moreover, the analysis did not approach the ESG performance—economic/financial performance link because this relation was beyond the purpose of our research. Likewise, in terms of limitations, though the Kohonen solution provides a straightforward visualization of the ESG behavior, the result represents a snapshot of the situation. Consequently, this analysis should be periodically applied to account for updated awareness on the newer ESG performance topological maps.
The study should be further expanded to include a more granulated and individualized picture of the ESG performances, to contain a larger number of companies searching for consistency or differentiation when compared with the achieved results and to compare with the case of business organizations from other regions in the world.
Author Contributions
The present research article is the result of shared efforts and intensive collaboration of all authors. All authors have actively contributed to the conception, development, elaboration and writing of the paper, from the abstract to the conclusions and reference list: Conceptualization, I.-E.I., L.-G.C., S.M.M. and B.C.-G.; Data curation, I.-E.I., L.-G.C., S.M.M. and B.C.-G.; Formal analysis, I.-E.I., L.-G.C., S.M.M. and B.C.-G.; Investigation, I.-E.I., L.-G.C., S.M.M. and B.C.-G.; Methodology, I.-E.I., L.-G.C., S.M.M. and B.C.-G.; Writing—original draft, I.-E.I., L.-G.C., S.M.M. and B.C.-G.; Writing—review & editing, I.-E.I., L.-G.C., S.M.M. and B.C.-G. All authors have agreed upon the final form of the article.
Funding
This research received no external funding.
Conflicts of Interest
The authors declare no conflict of interest.
References
- Escrig-Olmedo, E.; Fernández-Izquierdo, M.Á.; Ferrero-Ferrero, I.; Rivera-Lirio, J.M.; Muñoz-Torres, M.J. Rating the raters: Evaluating how ESG rating agencies integrate sustainability principles. Sustainability 2019, 11, 16. [Google Scholar] [CrossRef]
- Taliento, M.; Favino, C.; Netti, A. Impact of environmental, social, and governance information on economic performance: Evidence of a corporate ‘sustainability advantage’ from Europe. Sustainability 2019, 11, 26. [Google Scholar] [CrossRef]
- Badía, G.; Pina, V.; Torres, L. Financial performance of government bond portfolios based on environmental, social and governance criteria. Sustainability 2019, 11, 13. [Google Scholar] [CrossRef]
- Amel-Zadeh, A.; Serafeim, G. Why and how investors use ESG information: Evidence from a global survey. Financ. Anal. J. 2018, 74, 87–103. [Google Scholar] [CrossRef]
- Landi, G.; Sciarelli, M. Towards a more ethical market: The impact of ESG rating on corporate financial performance. Soc. Responsib. J. 2019, 15, 11–27. [Google Scholar] [CrossRef]
- Orsagh, M.; Allen, J.; Sloggett, J.; Bartholdy, S.; Georgieva, A.; Dehman, N.A.; Sofronova, Y. ESG Integration in Europe, the Middle East, and Africa: Markets, Practices, and Data. CFA Institute, Principles for Responsible Investment (PRI). 2019. Available online: https://www.unpri.org/download?ac=6036 (accessed on 21 May 2019).
- Ernst & Young (EY). Is Your Non-Financial Performance Revealing the True Value of Your Business to Investors? EY LLP: London, UK, 2017. Available online: https://www.ey.com/Publication/vwLUAssets/EY_-_Nonfinancial_performance_may_influence_investors/$FILE/ey-nonfinancial-performance-may-influence-investors.pdf (accessed on 21 December 2018).
- EU High-Level Expert Group on Sustainable Finance. Financing A Sustainable European economy. Final Report 2018. Financial Stability, Financial Services and Capital Markets Union (FISMA), European Commission. 2018. Available online: https://ec.europa.eu/info/sites/info/files/180131-sustainable-finance-final-report_en.pdf (accessed on 21 May 2019).
- United Nations Environment Programme (UNEP) and the World Bank Group (WB). Roadmap for A Sustainable Financial System. November 2017. Available online: http://unepinquiry.org/wp-content/uploads/2017/11/Roadmap_for_a_Sustainable_Financial_System.pdf (accessed on 21 May 2019).
- World Federation of Exchanges (WFE). WFE Sustainability Principles. 2018. Available online: https://www.world-exchanges.org/storage/app/media/research/Studies_Reports/2018/WFE%20Sustainability%20Principles%20October%202018.pdf (accessed on 22 May 2019).
- International Organization of Securities Commissions (IOSCO). Statement on Disclosure of ESG Matters by Issuers. 18 January 2019. Available online: https://www.iosco.org/library/pubdocs/pdf/IOSCOPD619.pdf (accessed on 22 May 2019).
- Organization for Economic Co-operation and Development. Social Impact Investment 2019: The Impact Imperative for Sustainable Development; OECD Publishing: Paris, France, 2019; ISBN 9789264311299. [Google Scholar]
- Vitolla, F.; Raimo, N.; Rubino, M. Appreciations, criticisms, determinants, and effects of integrated reporting: A systematic literature review. Corp. Soc. Responsib. Environ. Manag. 2019, 26, 518–528. [Google Scholar] [CrossRef]
- Daugaard, D. Emerging new themes in environmental, social and governance investing: A systematic literature review. Account. Financ. 2019. [Google Scholar] [CrossRef]
- Brooks, C.; Oikonomou, I. The effects of environmental, social and governance disclosures and performance on firm value: A review of the literature in accounting and finance. Br. Account. Rev. 2018, 50, 1–15. [Google Scholar] [CrossRef]
- Friede, G.; Busch, T.; Bassen, A. ESG and financial performance: Aggregated evidence from more than 2000 empirical studies. J. Sustain. Financ. Investig. 2015, 5, 210–233. [Google Scholar] [CrossRef]
- Dufwa, L.; Hammarström, M. Corporate Sustainability and the Financial Implications for the European Basic Materials Industry. Bachelor’ Thesis, University of Gothenburg, Gothenburg, Sweden, Spring. 2015. Available online: https://gupea.ub.gu.se/bitstream/2077/40462/1/gupea_2077_40462_1.pdf (accessed on 8 December 2018).
- Aouadi, A.; Marsat, S. Do ESG controversies matter for firm value? Evidence from international data. J. Bus. Ethics 2018, 151, 1027–1047. [Google Scholar] [CrossRef]
- Ferrero-Ferrero, I.; Fernández-Izquierdo, M.Á.; Muñoz-Torres, M.J. The effect of environmental, social and governance consistency on economic results. Sustainability 2016, 8, 16. [Google Scholar] [CrossRef]
- Ortas, E.; Álvarez, I.; Jaussaud, J.; Garayar, A. The impact of institutional and social context on corporate environmental, social and governance performance of companies committed to voluntary corporate social responsibility initiatives. J. Clean. Prod. 2015, 108, 673–684. [Google Scholar] [CrossRef]
- Cavaco, S.; Crifo, P. CSR and financial performance: Complementarity between environmental, social and business behaviours. Appl. Econ. 2014, 46, 3323–3338. [Google Scholar] [CrossRef]
- Han, J.J.; Kim, H.J.; Yu, J. Empirical study on relationship between corporate social responsibility and financial performance in Korea. Asian J. Sustain. Soc. Responsib. 2016, 1, 61–76. [Google Scholar] [CrossRef] [Green Version]
- Nollet, J.; Filis, G.; Mitrokostas, E. Corporate social responsibility and financial performance: A non-linear and disaggregated approach. Econ. Model. 2016, 52, 400–407. [Google Scholar] [CrossRef] [Green Version]
- Tang, Z.; Hull, C.E.; Rothenberg, S. How corporate social responsibility engagement strategy moderates the CSR–financial performance relationship. J. Manag. Stud. 2012, 49, 1274–1303. [Google Scholar] [CrossRef]
- Li, Y.; Gong, M.; Zhang, X.-Y.; Koh, L. The impact of environmental, social, and governance disclosure on firm value: The role of CEO power. Br. Account. Rev. 2018, 50, 60–75. [Google Scholar] [CrossRef] [Green Version]
- Utz, S. Corporate scandals and the reliability of ESG assessments: Evidence from an international sample. Rev. Manag. Sci. 2019, 13, 483–511. [Google Scholar] [CrossRef]
- Jitmaneeroj, B. Reform priorities for corporate sustainability: Environmental, social, governance, or economic performance? Manag. Decis. 2016, 54, 1497–1521. [Google Scholar] [CrossRef]
- Dorfleitner, G.; Halbritter, G.; Nguyen, M. The risk of social responsibility—Is it systematic? J. Sustain. Financ. Investig. 2016, 6, 1–14. [Google Scholar] [CrossRef]
- Dorfleitner, G.; Halbritter, G.; Nguyen, M. Measuring the level and risk of corporate responsibility—An empirical comparison of different ESG rating approaches. J. Asset Manag. 2015, 16, 450–466. [Google Scholar] [CrossRef]
- Clark, G.L.; Feiner, A.; Viehs, M. From the Stockholder to the Stakeholder: How Sustainability Can Drive Financial Outperformance. 5 March 2015. Available online: http://dx.doi.org/10.2139/ssrn.2508281 (accessed on 20 December 2018).
- Tkáč, M.; Verner, R. Artificial neural networks in business: Two decades of research. Appl. Soft Comput. 2016, 38, 788–804. [Google Scholar] [CrossRef]
- Somers, M.J.; Casal, J. Introducing neural computing in governance research: Applying self-organizing maps to configurational studies. Corp. Gov. Int. Rev. 2017, 25, 440–453. [Google Scholar] [CrossRef]
- Horobet, A.; Belașcu, L.; Ioniță, I.; Șerban-Oprescu, A.-T. A neural networks perspective on the financial integration of European capital markets. Econ. Comput. Econ. Cybern. Stud. Res. 2014, 48, 115–126. Available online: http://www.ecocyb.ase.ro/nr20141/Horobet%20Alexandra.pdf (accessed on 23 May 2019).
- Di Tollo, G.; Tanev, S.; De March, D.; Ma, Z. Neural networks to model the innovativeness perception of co-creative firms. Expert Syst. Appl. 2012, 39, 12719–12726. [Google Scholar] [CrossRef]
- Riva, E.; Lucchini, M. Firm performance: Taxonomy of European companies using self-organizing maps. Qual. Quant. Int. J. Methodol. 2018, 52, 457–477. [Google Scholar] [CrossRef]
- Resta, M.; Garelli, R.; Dameri, R.P. Mapping financial performances in Italian ICT-related firms via self-organizing maps. In Network, Smart and Open: Three Keywords for Information Systems Innovation. Lecture Notes in Information Systems and Organisation; Lamboglia, R., Cardoni, A., Dameri, R., Mancini, D., Eds.; Springer: Cham, Germany, 2018; pp. 271–281. ISBN 978-3-319-62636-9. [Google Scholar]
- Van Duuren, E.; Plantinga, A.; Scholtens, B. ESG integration and the investment management process: Fundamental investing reinvented. J. Bus. Ethics 2016, 138, 525–533. [Google Scholar] [CrossRef]
- De Franco, C. ESG Controversies and Their Impact on Performance; Ossiam: Paris, France, 2018; Available online: https://ossiam.com/files/research_papers/1541146820_ESG_controversies_and_performance_impact.pdf (accessed on 19 December 2018).
- Park, S.-B. Multinationals and sustainable development: Does internationalization develop corporate sustainability of emerging market multinationals? Bus. Strategy Environ. 2018, 27, 1514–1524. [Google Scholar] [CrossRef]
- Garvey, G.T.; Kazdin, J.; LaFond, R.; Nash, J.; Safa, H. A pitfall in ethical investing: ESG disclosures reflect vulnerabilities, not virtues. J. Investig. Manag. 2017, 15, 51–64. [Google Scholar] [CrossRef]
- Afonso, S.C.; Fernandes, P.O.; Monte, A.P. CSR of top Portuguese companies: Relation between social performance and economic performance. Int. J. Soc. Behav. Educ. Econ. Bus. Ind. Eng. 2012, 6, 1407–1411. [Google Scholar]
- Szopik-Depczyńska, K.; Cheba, K.; Bąk, I.; Kiba-Janiak, M.; Saniuk, S.; Dembińska, I.; Ioppolo, G. The application of relative taxonomy to the study of disproportions in the area of sustainable development of the European Union. Land Use Policy 2017, 68, 481–491. [Google Scholar] [CrossRef]
- Ioppolo, G.; Cucurachi, S.; Salomone, R.; Saija, G.; Shi, L. Sustainable local development and environmental governance: A strategic planning experience. Sustainability 2016, 8, 16. [Google Scholar] [CrossRef]
- European Commission (EC). Corporate Social Responsibility: A Business Contribution to Sustainable Development. Brussels. 02 July 2002. Available online: https://ec.europa.eu/europeaid/sites/devco/files/communication-corporate-social-responsibility-sustainable-development-com2002347-20020702_en.pdf (accessed on 20 January 2019).
- Miller, D. CSR, ESG, SRI and Why All Companies Should Care. 18 April 2018. Available online: https://www.managinc.com/news/2018/4/18/csr-esg-sri-and-why-all-companies-should-care-1 (accessed on 21 December 2018).
- Hřebíček, J.; Soukopová, J.; Trenz, O. Current trends of economic modelling of sustainable corporate performance and reporting—Review and research agenda. Procedia Econ. Financ. 2014, 12, 234–242. [Google Scholar] [CrossRef]
- Skroupa, C.P. Define Metrics for ESG, CSR and the Like, and You’ll Grab Wall Street’s Attention. 06 February 2018. Available online: https://www.forbes.com/sites/christopherskroupa/2018/02/06/define-metrics-for-esg-csr-and-the-like-and-youll-grab-wall-streets-attention/#2a6e39a55444 (accessed on 21 December 2018).
- Ribando, J.M.; Bonne, G. A New Quality Factor: Finding Alpha with ASSET4 ESG Data. Starmine Research Note, Thomson Reuters. 31 March 2010. Available online: http://citeseerx.ist.psu.edu/viewdoc/download?doi=10.1.1.429.577&rep=rep1&type=pdf (accessed on 22 December 2018).
- Miralles-Quirós, M.M.; Miralles-Quirós, J.L.; Valente Gonçalves, L.M. The value relevance of environmental, social, and governance performance: The Brazilian case. Sustainability 2018, 10, 15. [Google Scholar] [CrossRef]
- Dahlberg, L.; Wiklund, F. ESG Investing in Nordic Countries: An Analysis of the Shareholder View of Creating Value. Degree Project, Umeå University, Sweden, Spring. 2018. Available online: http://www.diva-portal.org/smash/get/diva2:1229424/FULLTEXT01.pdf (accessed on 8 December 2018).
- Wang, Z.; Hsieh, T.-S.; Sarkis, J. CSR performance and the readability of CSR reports: Too good to be true? Corp. Soc. Responsib. Environ. Manag. 2018, 25, 66–79. [Google Scholar] [CrossRef]
- Yoon, B.; Lee, J.H.; Byun, R. Does ESG performance enhance firm value? Evidence from Korea. Sustainability 2018, 10, 18. [Google Scholar] [CrossRef]
- Roman, A.G.; Mocanu, M.; Hoinaru, R. Disclosure style and its determinants in integrated reports. Sustainability 2019, 11, 16. [Google Scholar] [CrossRef]
- Kocmanová, A.; Dočekalová, M. Construction of the economic indicators of performance in relation to environmental, social and corporate governance (ESG) factors. Acta Univ. Agric. Silvic. Mendel. Brun. 2012, 60, 195–206. [Google Scholar] [CrossRef]
- Koehler, D.A.; Hespenheide, E.J. Finding the Value in Environmental, Social, and Governance Performance. Deloitte Rev. 2013, 12, 98–111. Available online: https://ssrn.com/abstract=2218841 (accessed on 17 December 2018).
- Pokorna, M. Socially Responsible Investing and Portfolio Performance. Master’ Thesis, Erasmus University Rotterdam, Rotterdam, The Netherlands, November 2017. Available online: https://thesis.eur.nl/pub/41396/Pokorna-M.-449106-.pdf (accessed on 14 December 2018).
- European Union (EU). Directive 2014/95/EU of the European Parliament and of the Council of 22 October 2014 Amending Directive 2013/34/EU as Regards Disclosure of Non-Financial and Diversity Information by Certain Large Undertakings and Groups. Official Journal of the European Union; Publications Office of the European Union: Luxembourg, 2014. Available online: https://eur-lex.europa.eu/legal-content/EN/TXT/PDF/?uri=CELEX:32014L0095&from=FI (accessed on 20 January 2019).
- European Commission (EC). Guidelines on Non-Financial Reporting (Methodology for Reporting Non-Financial Information). Official Journal of the European Union. 05 July 2017. Available online: https://eur-lex.europa.eu/legal-content/EN/TXT/PDF/?uri=CELEX:52017XC0705(01)&from=EN (accessed on 20 January 2019).
- Mocanu, M.; Roman, A.G. Financial and non-financial reporting in Romanian entities operating in agriculture, forestry, and fishery. Audit Financ. 2016, 14, 659–669. [Google Scholar] [CrossRef]
- Global Reporting Initiative (GRI). About Sustainability Reporting. 2019. Available online: https://www.globalreporting.org/information/sustainability-reporting/Pages/default.aspx (accessed on 5 January 2019).
- Sustainability Accounting Standards Board (SASB). Why is Financial Materiality Important? 2018. Available online: https://www.sasb.org/standards-overview/materiality-map/ (accessed on 5 January 2019).
- Sustainability Accounting Standards Board (SASB). SASB Materiality Map. 2018. Available online: https://materiality.sasb.org/ (accessed on 5 January 2019).
- Refinitiv. Thomson Reuters ESG Scores. February 2019. Available online: https://www.refinitiv.com/content/dam/marketing/en_us/documents/methodology/esg-scores-methodology.pdf (accessed on 7 March 2019).
- Halbritter, G.; Dorfleitner, G. The wages of social responsibility—Where are they? A critical review of ESG investing. Rev. Financ. Econ. 2015, 26, 25–35. [Google Scholar] [CrossRef]
- Manrique, S.; Martí-Ballester, C.-P. Analyzing the effect of corporate environmental performance on corporate financial performance in developed and developing countries. Sustainability 2017, 9, 30. [Google Scholar] [CrossRef]
- Sassen, R.; Hinze, A.-K.; Hardeck, I. Impact of ESG factors on firm risk in Europe. J. Bus. Econ. 2016, 86, 867–904. [Google Scholar] [CrossRef]
- Sila, I.; Cek, K. The impact of environmental, social and governance dimensions of corporate social responsibility on economic performance: Australian evidence. Procedia Comput. Sci. 2017, 120, 797–804. [Google Scholar] [CrossRef]
- Velte, P. Does ESG performance have an impact on financial performance? Evidence from Germany. J. Glob. Responsib. 2017, 8, 169–178. [Google Scholar] [CrossRef]
- Galant, A.; Cadez, S. Corporate social responsibility and financial performance relationship: A review of measurement approaches. Econ. Res. Ekon. Istraživanja 2017, 30, 676–693. [Google Scholar] [CrossRef]
- Eccles, R.G.; Ioannou, I.; Serafeim, G. The impact of corporate sustainability on organizational processes and performance. Manag. Sci. 2014, 60, 2835–2857. [Google Scholar] [CrossRef]
- Porter, M.E.; Hills, G.; Pfitzer, M.; Patscheke, S.; Hawkins, E. Measuring Shared Value: How to Unlock Value by Linking Business and Social Results. Foundation Strategy Group (FSG). Available online: https://www.hbs.edu/faculty/Pages/item.aspx?num=46910 (accessed on 18 December 2018).
- Allur, E.; Heras-Saizarbitoria, I.; Boiral, O.; Testa, F. Quality and environmental management linkage: A review of the literature. Sustainability 2018, 10, 15. [Google Scholar] [CrossRef]
- Peiró-Signes, A.; Segarra-Oña, M.; Mondéjar-Jiménez, J.; Vargas-Vargas, M. Influence of the environmental, social and corporate governance ratings on the economic performance of companies: An overview. Int. J. Environ. Res. 2013, 7, 105–112. [Google Scholar]
- Nguyen-Taylor, K.; Martindale, W. Financial Performance of ESG Integration in US Investing. Principles for Responsible Investment (PRI). 2018. Available online: https://www.unpri.org/download?ac=4218 (accessed on 21 December 2018).
- Global Reporting Initiative (GRI). Making the Connection: The Real Effect of ESG on Corporate Financial Performance. 03 February 2016. Available online: https://www.globalreporting.org/information/news-and-press-center/Pages/Real-effect-of-ESG-on-Corporate-Financial-Performance.aspx (accessed on 5 January 2019).
- Kasem, E.; Trenz, O.; Hřebíček, J. Statistical method and neural network for sustainability evaluation. In Proceedings of the 32nd International Conference on Mathematical Methods in Economics (MME 2014), Olomouc, Czech Republic, 10–12 September 2014; Talašová, J., Stoklasa, J., Talášek, T., Eds.; Palacký University: Olomouc, Czech Republic, 2014; pp. 396–401. Available online: http://mme2014.upol.cz/downloads/MME_2014_Proceedings.pdf (accessed on 21 December 2018).
- Jamali, D.; Sidani, Y.; El-Asmar, K. A three country comparative analysis of managerial CSR perspectives: Insights from Lebanon, Syria and Jordan. J. Bus. Ethics 2009, 85, 173–192. [Google Scholar] [CrossRef]
- Kohonen, T. Self-Organizing Maps, 3rd ed.; Springer: New York, NY, USA, 2001; ISBN 978-3-540-67921-9. [Google Scholar]
- Deboeck, G.; Kohonen, T. Visual Explorations in Finance with Self-Organizing Maps; Springer: London, UK, 1998; ISBN 978-3-540-76266-9. [Google Scholar]
- Wendler, T.; Gröttrup, S. Data Mining with SPSS Modeler: Theory, Exercises and Solutions, 1st ed.; Springer International Publishing: Bern, Switzerland, 2016; ISBN 978-3-319-28707-2. [Google Scholar]
- Larose, D.T.; Larose, C.D. Discovering Knowledge in Data: An Introduction to Data Mining, 2nd ed.; John Wiley & Sons, Inc.: Hoboken, NJ, USA, 2014; ISBN 978-0-470-90874-7. [Google Scholar]
- Tsiptsis, K.K.; Chorianopoulos, A. Data Mining Techniques in CRM: Inside Customer Segmentation, 1st ed.; John Wiley & Sons Ltd.: Chichester, UK, 2009; ISBN 978-0-470-74397-3. [Google Scholar]
- Nisbet, R.; Elder, J.; Miner, G. Handbook of Statistical Analysis and Data Mining Applications, 1st ed.; Elsevier, Academic Press: London, UK, 2009; ISBN 978-0-12-374765-5. [Google Scholar]
- Abbas, O.A. Comparisons between Data Clustering Algorithms. Int. Arab J. Inf. Technol. 2008, 5, 320–325. Available online: https://iajit.org/PDF/vol.5,no.3/15-191.pdf (accessed on 21 May 2019).
- Sarstedt, M.; Mooi, E. A Concise Guide to Market Research: The Process, Data, and Methods Using IBM SPSS Statistics, 3rd ed.; Springer: Heidelberg, Germany, 2019; ISBN 978-3-662-56706-7. [Google Scholar]
- Tkaczynski, A. Segmentation using two-step cluster analysis. In Segmentation in Social Marketing: Process, Methods and Application, 1st ed.; Dietrich, T., Rundle-Thiele, S., Kubacki, K., Eds.; Springer: Singapore, 2017; pp. 109–125. ISBN 978-981-10-1833-6. [Google Scholar]
- Field, A. Discovering Statistics Using IBM SPSS Statistics, 5th ed.; SAGE Publications: London, UK, 2017; ISBN 978-1526436566. [Google Scholar]
- Laerd Statistics. Statistical Tutorials and Software Guides. Available online: https://statistics.laerd.com/ (accessed on 30 March 2019).
- Laerd Statistics. Friedman Test Using SPSS Statistics. Statistical Tutorials and Software Guides. Available online: https://statistics.laerd.com/spss-tutorials/friedman-test-using-spss-statistics.php (accessed on 30 March 2019).
- Laerd Statistics. Kruskal-Wallis H Test Using SPSS Statistics. Statistical Tutorials and Software Guides. Available online: https://statistics.laerd.com/spss-tutorials/kruskal-wallis-h-test-using-spss-statistics.php (accessed on 30 March 2019).
- Laerd Statistics. Sign Test Using SPSS Statistics. Statistical Tutorials and Software Guides. Available online: https://statistics.laerd.com/spss-tutorials/sign-test-using-spss-statistics.php (accessed on 30 March 2019).
- Laerd Statistics. Wilcoxon Signed-Rank Test Using SPSS Statistics. Statistical Tutorials and Software Guides. Available online: https://statistics.laerd.com/spss-tutorials/wilcoxon-signed-rank-test-using-spss-statistics.php (accessed on 30 March 2019).
- Laerd Statistics. Jonckheere-Terpstra Test Using SPSS Statistics. Statistical Tutorials and Software Guides. Available online: https://statistics.laerd.com/spss-tutorials/jonckheere-terpstra-test-using-spss-statistics.php (accessed on 30 March 2019).
- Aguayo, R.; Cañadas, G.R.; Assbaa-Kaddouri, L.; Cañadas-De la Fuente, G.A.; Ramírez-Baena, L.; Ortega-Campos, E. A risk profile of sociodemographic factors in the onset of academic burnout syndrome in a sample of university students. Int. J. Environ. Res. Public Health 2019, 16, 10. [Google Scholar] [CrossRef]
- Gamito, P.S.; Morais, D.G.; Oliveira, J.G.; Brito, R.; Rosa, P.J.; de Matos, M.G. Frequency is not enough: Patterns of use associated with risk of Internet addiction in Portuguese adolescents. Comput. Hum. Behav. 2016, 58, 471–478. [Google Scholar] [CrossRef]
- Lepp, A.; Li, J.; Barkley, J.E.; Salehi-Esfahani, S. Exploring the relationships between college students’ cell phone use, personality and leisure. Comput. Hum. Behav. 2015, 43, 210–219. [Google Scholar] [CrossRef]
- Kissi, D. Sustainability Analysis and Stewardship: Raising The Bar in ESG. An Interview with BNP Paribas Asset Management’s Helena Viñes Fiestas. 13 April 2018. Available online: https://www.garp.org/#!/risk-intelligence/all/all/a1Z1W000003IWVaUAO (accessed on 21 April 2019).
Figure 1.
The Kohonen model summary of total environmental, social and governance (ESG) performance for European companies.
Figure 1.
The Kohonen model summary of total environmental, social and governance (ESG) performance for European companies.
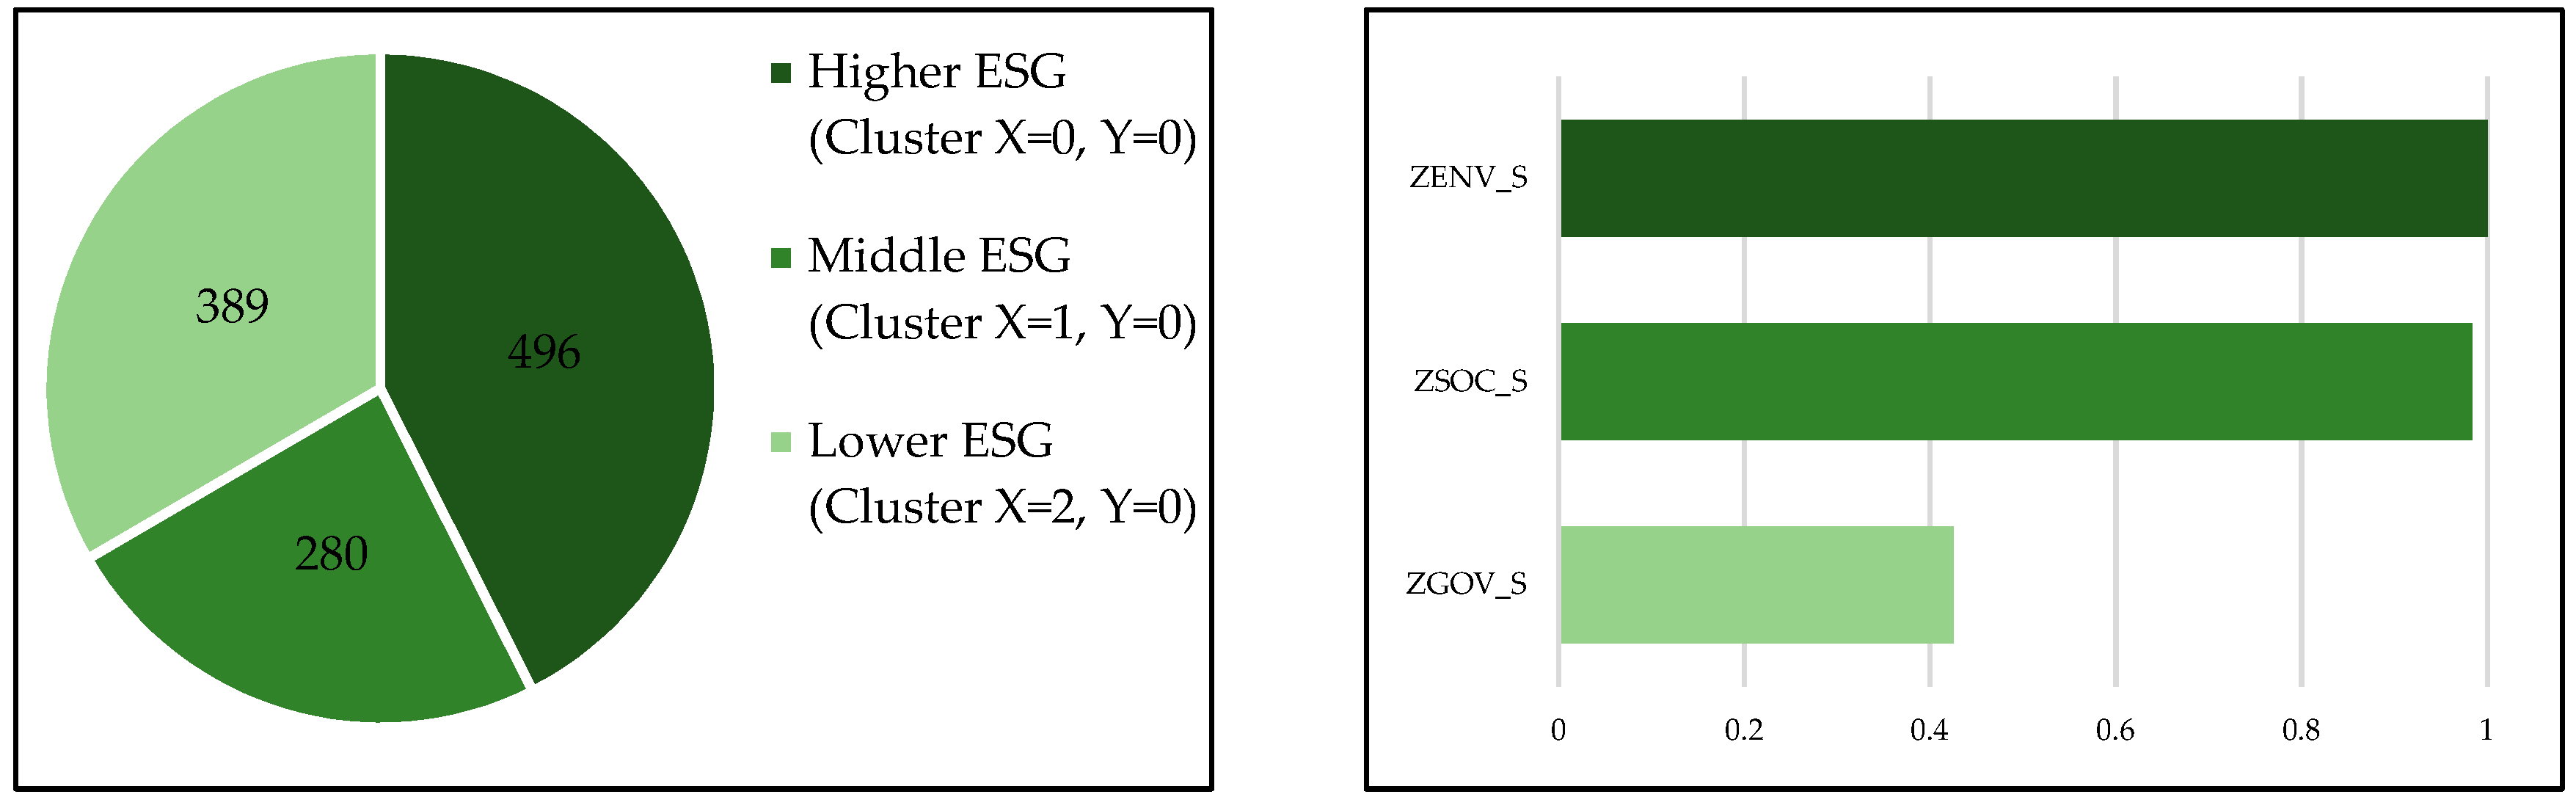
Figure 2.
The Kohonen self-organizing map (SOM) of total ESG performance for European companies.

Figure 3.
The median total ESG performance for European companies by ESG clusters.

Figure 4.
The 3D map of environmental, social and governance performances for European companies by ESG clusters.
Figure 4.
The 3D map of environmental, social and governance performances for European companies by ESG clusters.

Figure 5.
The map of ESG risks exposure overlaying total ESG performance for European companies.

Figure 6.
The map of total ESG performance for European companies by country.

Figure 7.
The map of total ESG performance for European companies by economic sector.
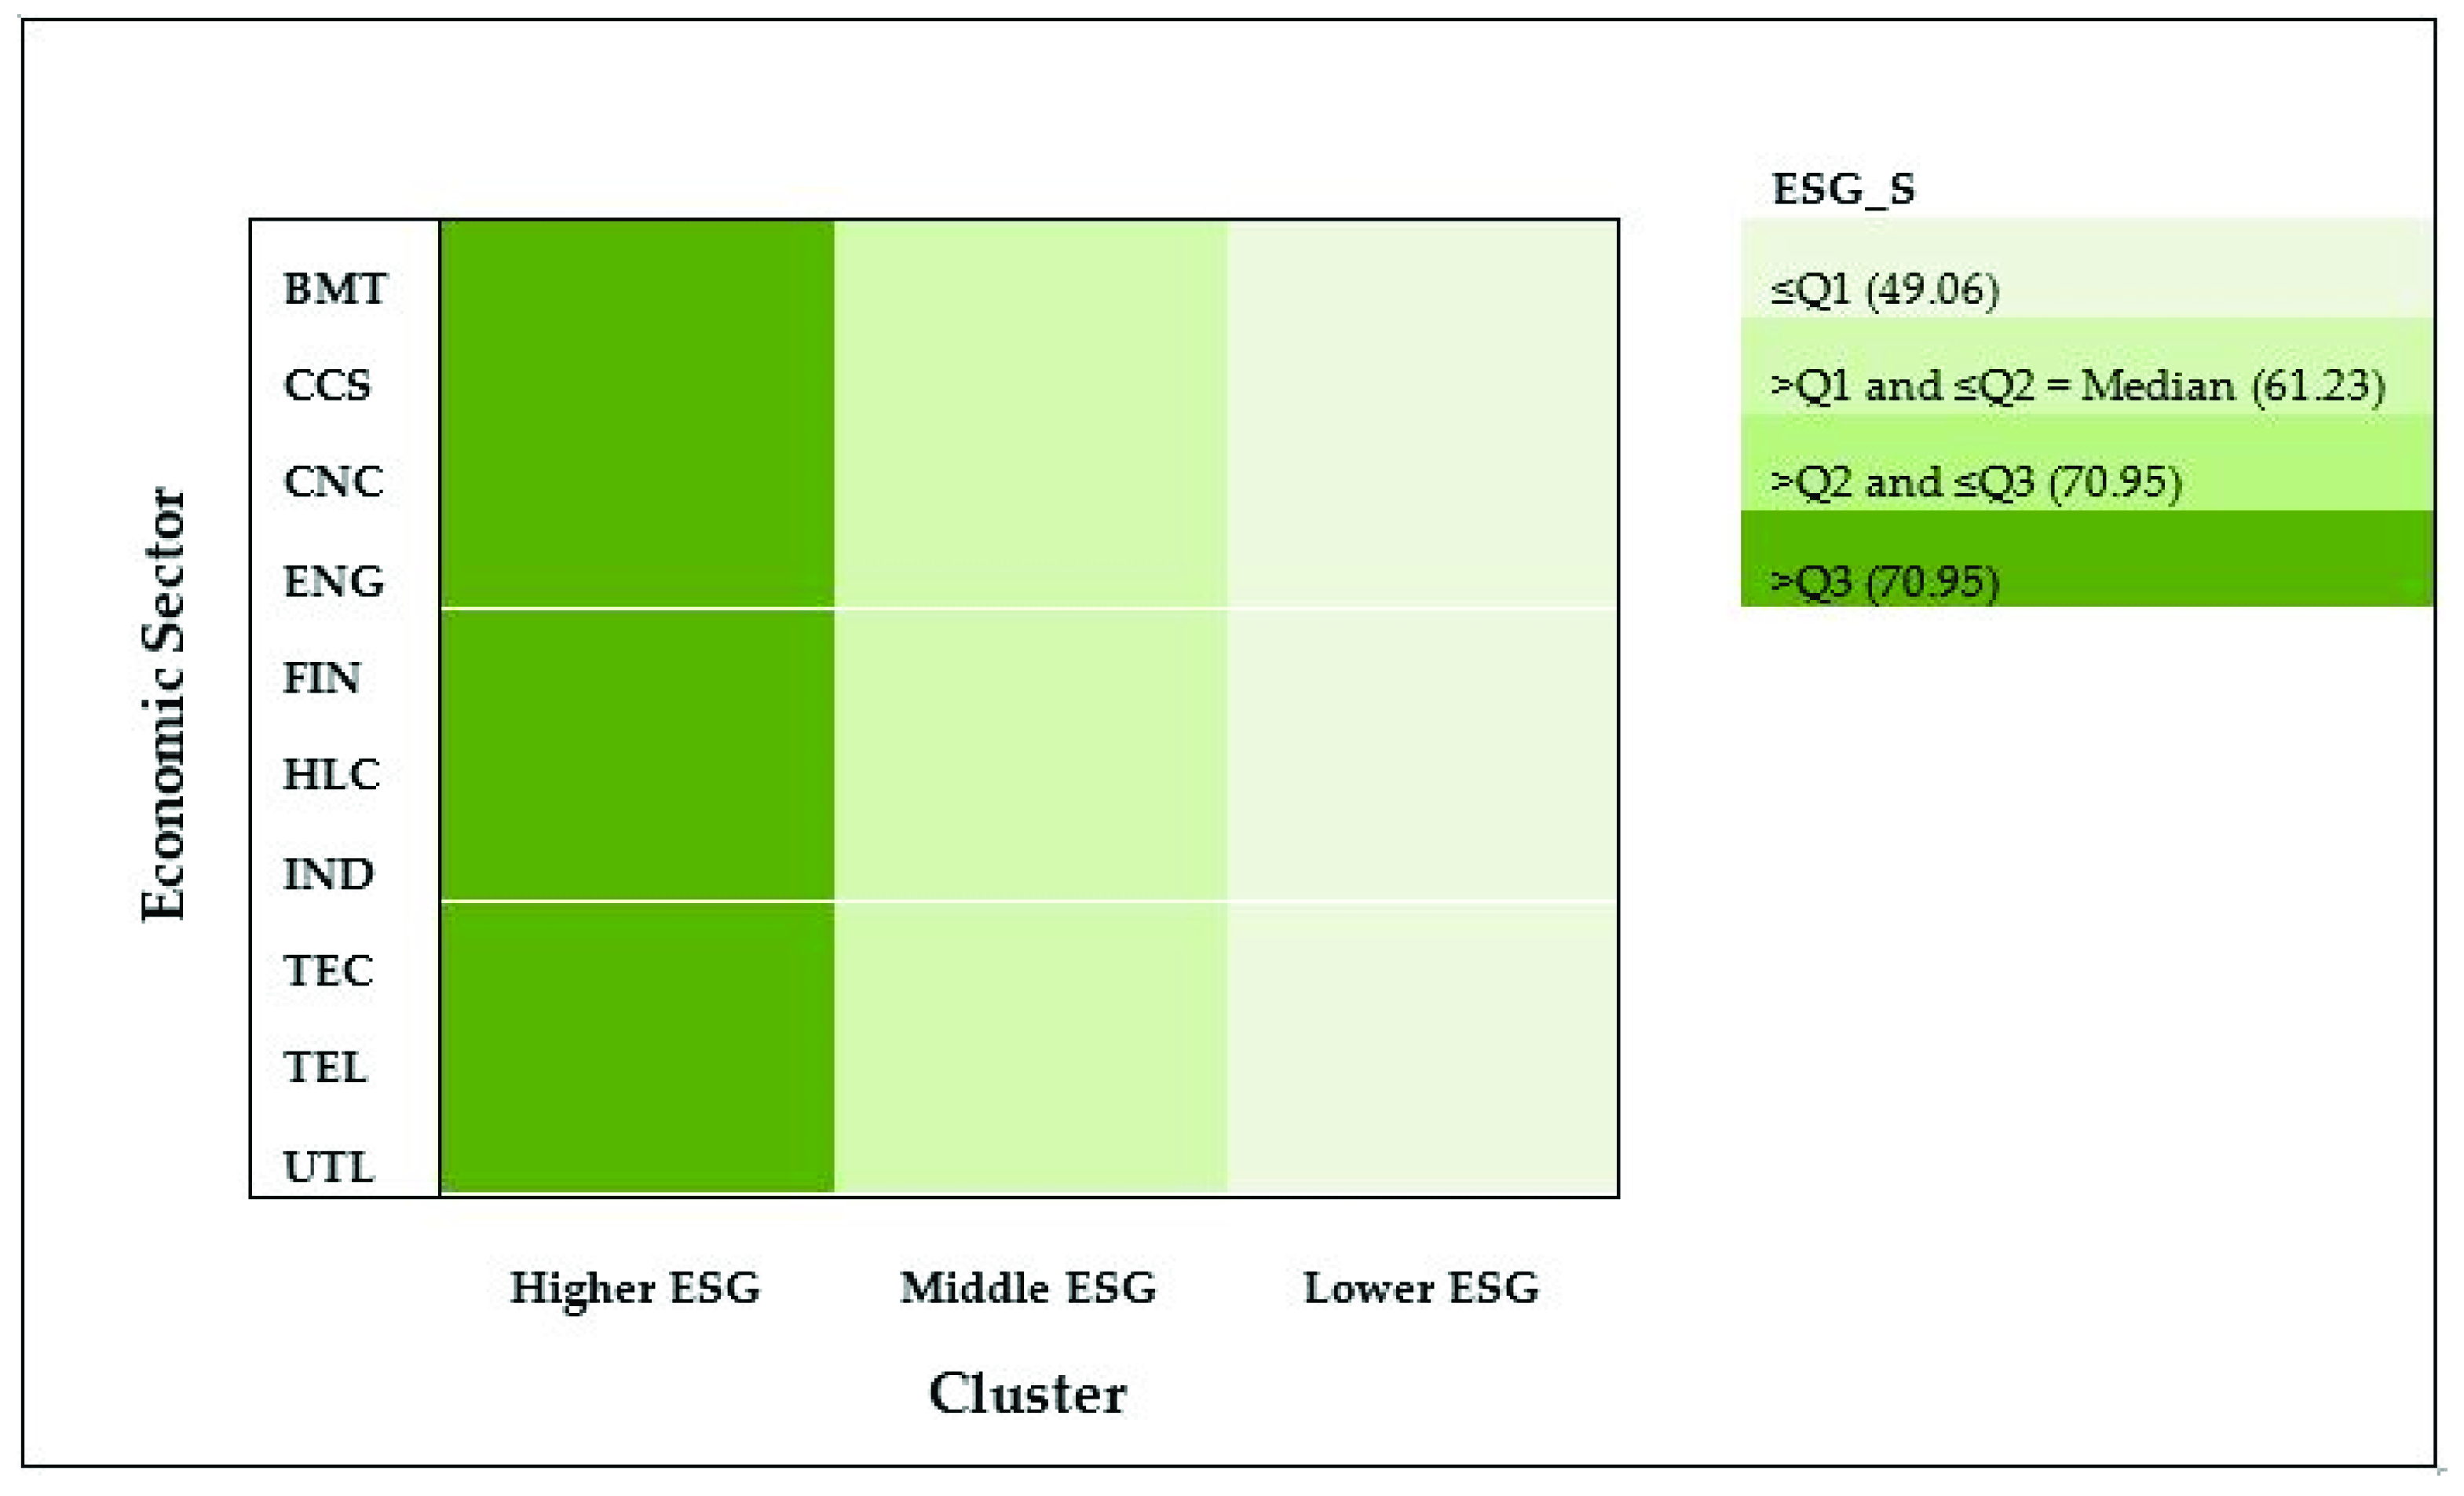
Figure 8.
The Kohonen model summary of thematic ESG performance for European companies.

Figure 9.
The Kohonen SOM of thematic ESG Performance for European Companies.

Figure 10.
The median thematic ESG performance for European companies by ESG clusters.

Figure 11.
Predictors’ importance for ESG clustering in different approaches.


Figure 12.
The median Stakeholder-related ESG performance for European companies by ESG clusters.

Figure 13.
The median Perspective-related ESG performance for European companies by ESG clusters.

Figure 14.
The median Management Level-related ESG performance for European companies by ESG clusters.
Figure 14.
The median Management Level-related ESG performance for European companies by ESG clusters.

Figure 15.
The median Focus-related ESG performance for European companies by ESG clusters.

Figure 16.
The map of innovative views-related ESG performance for European companies by ESG clusters.
Figure 16.
The map of innovative views-related ESG performance for European companies by ESG clusters.


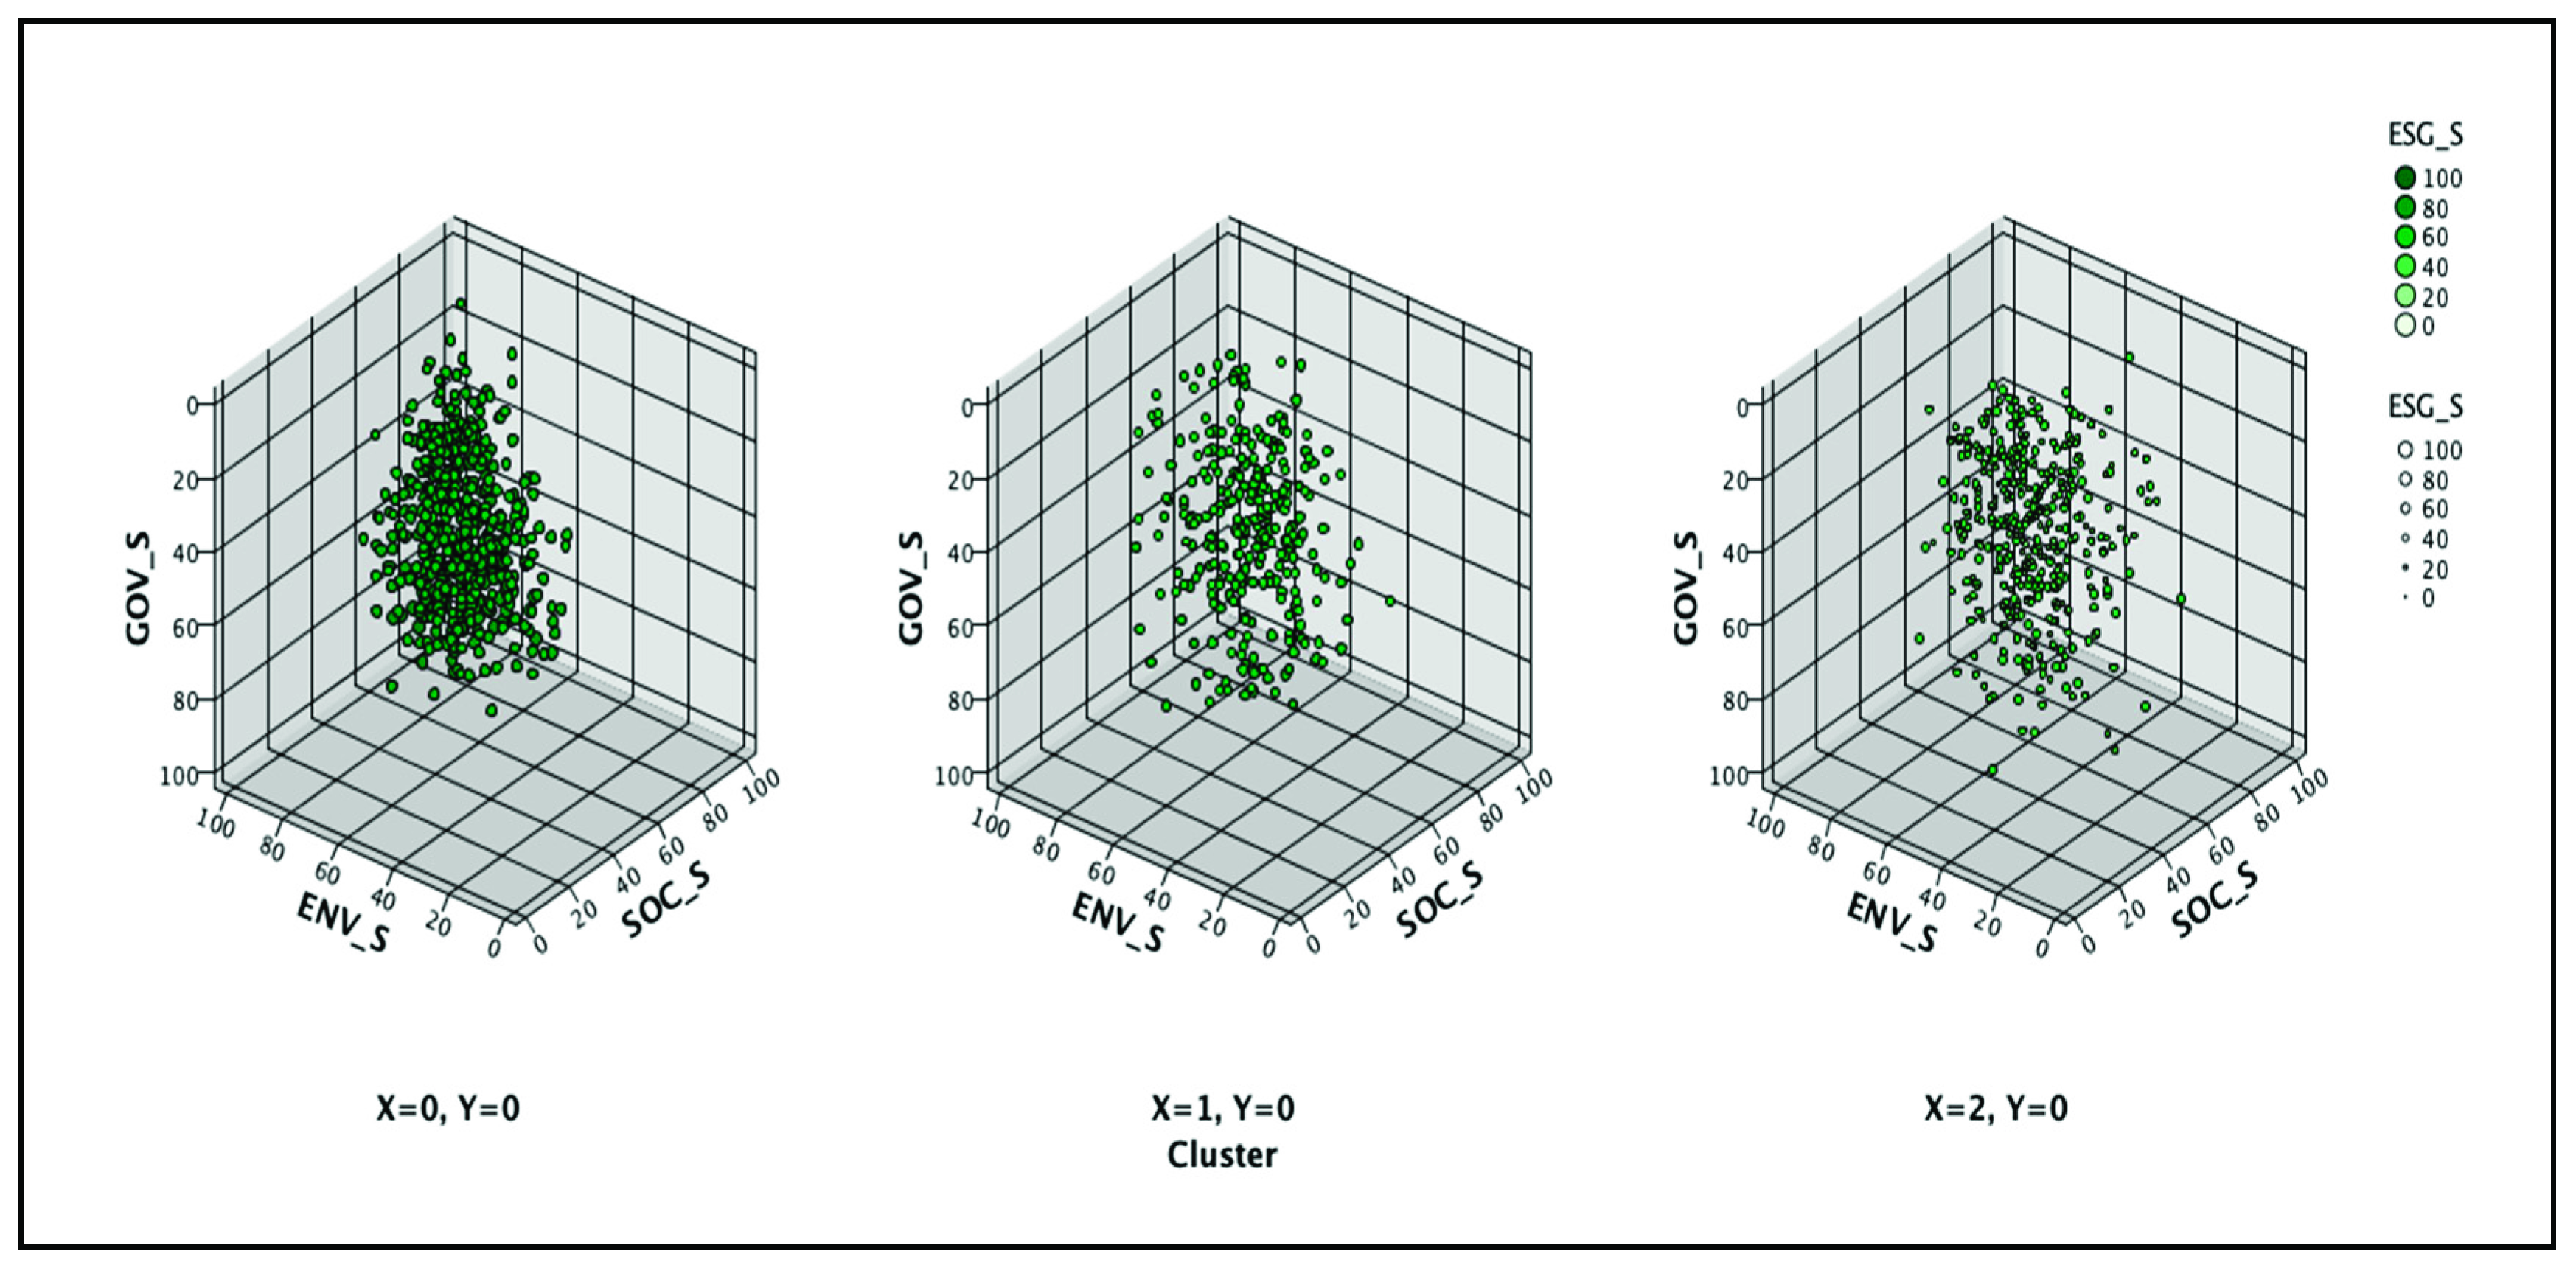
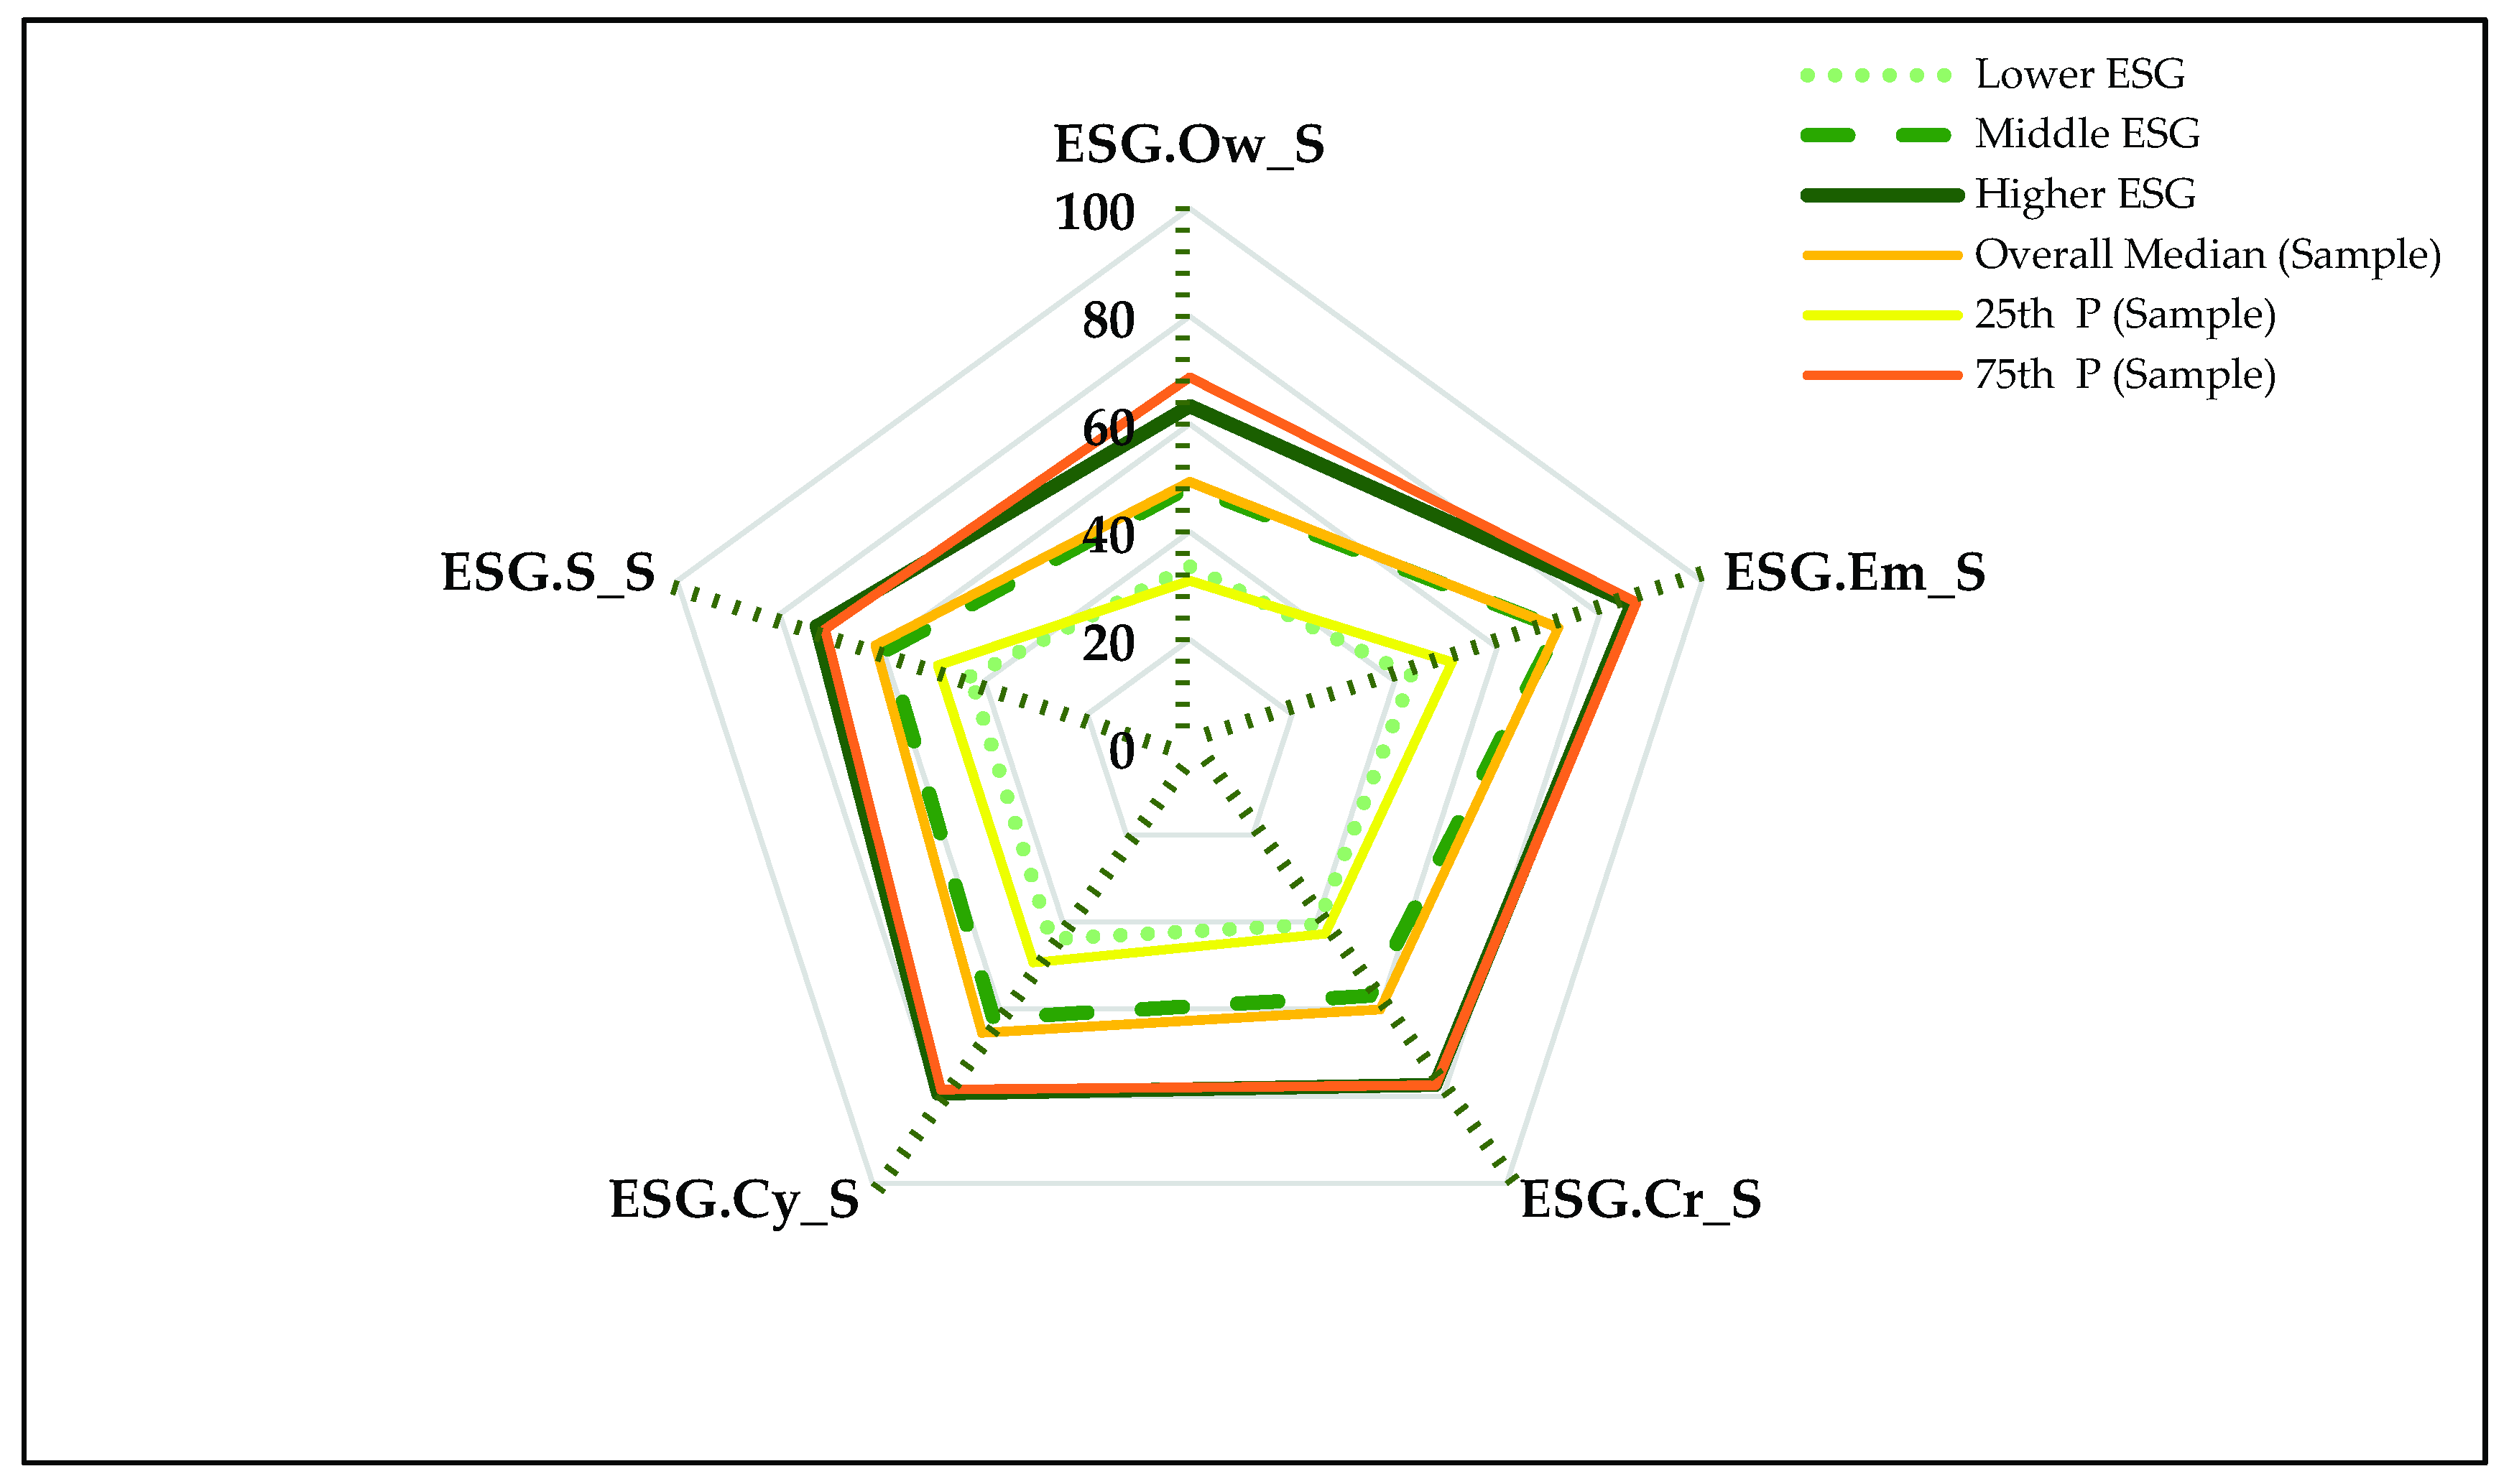
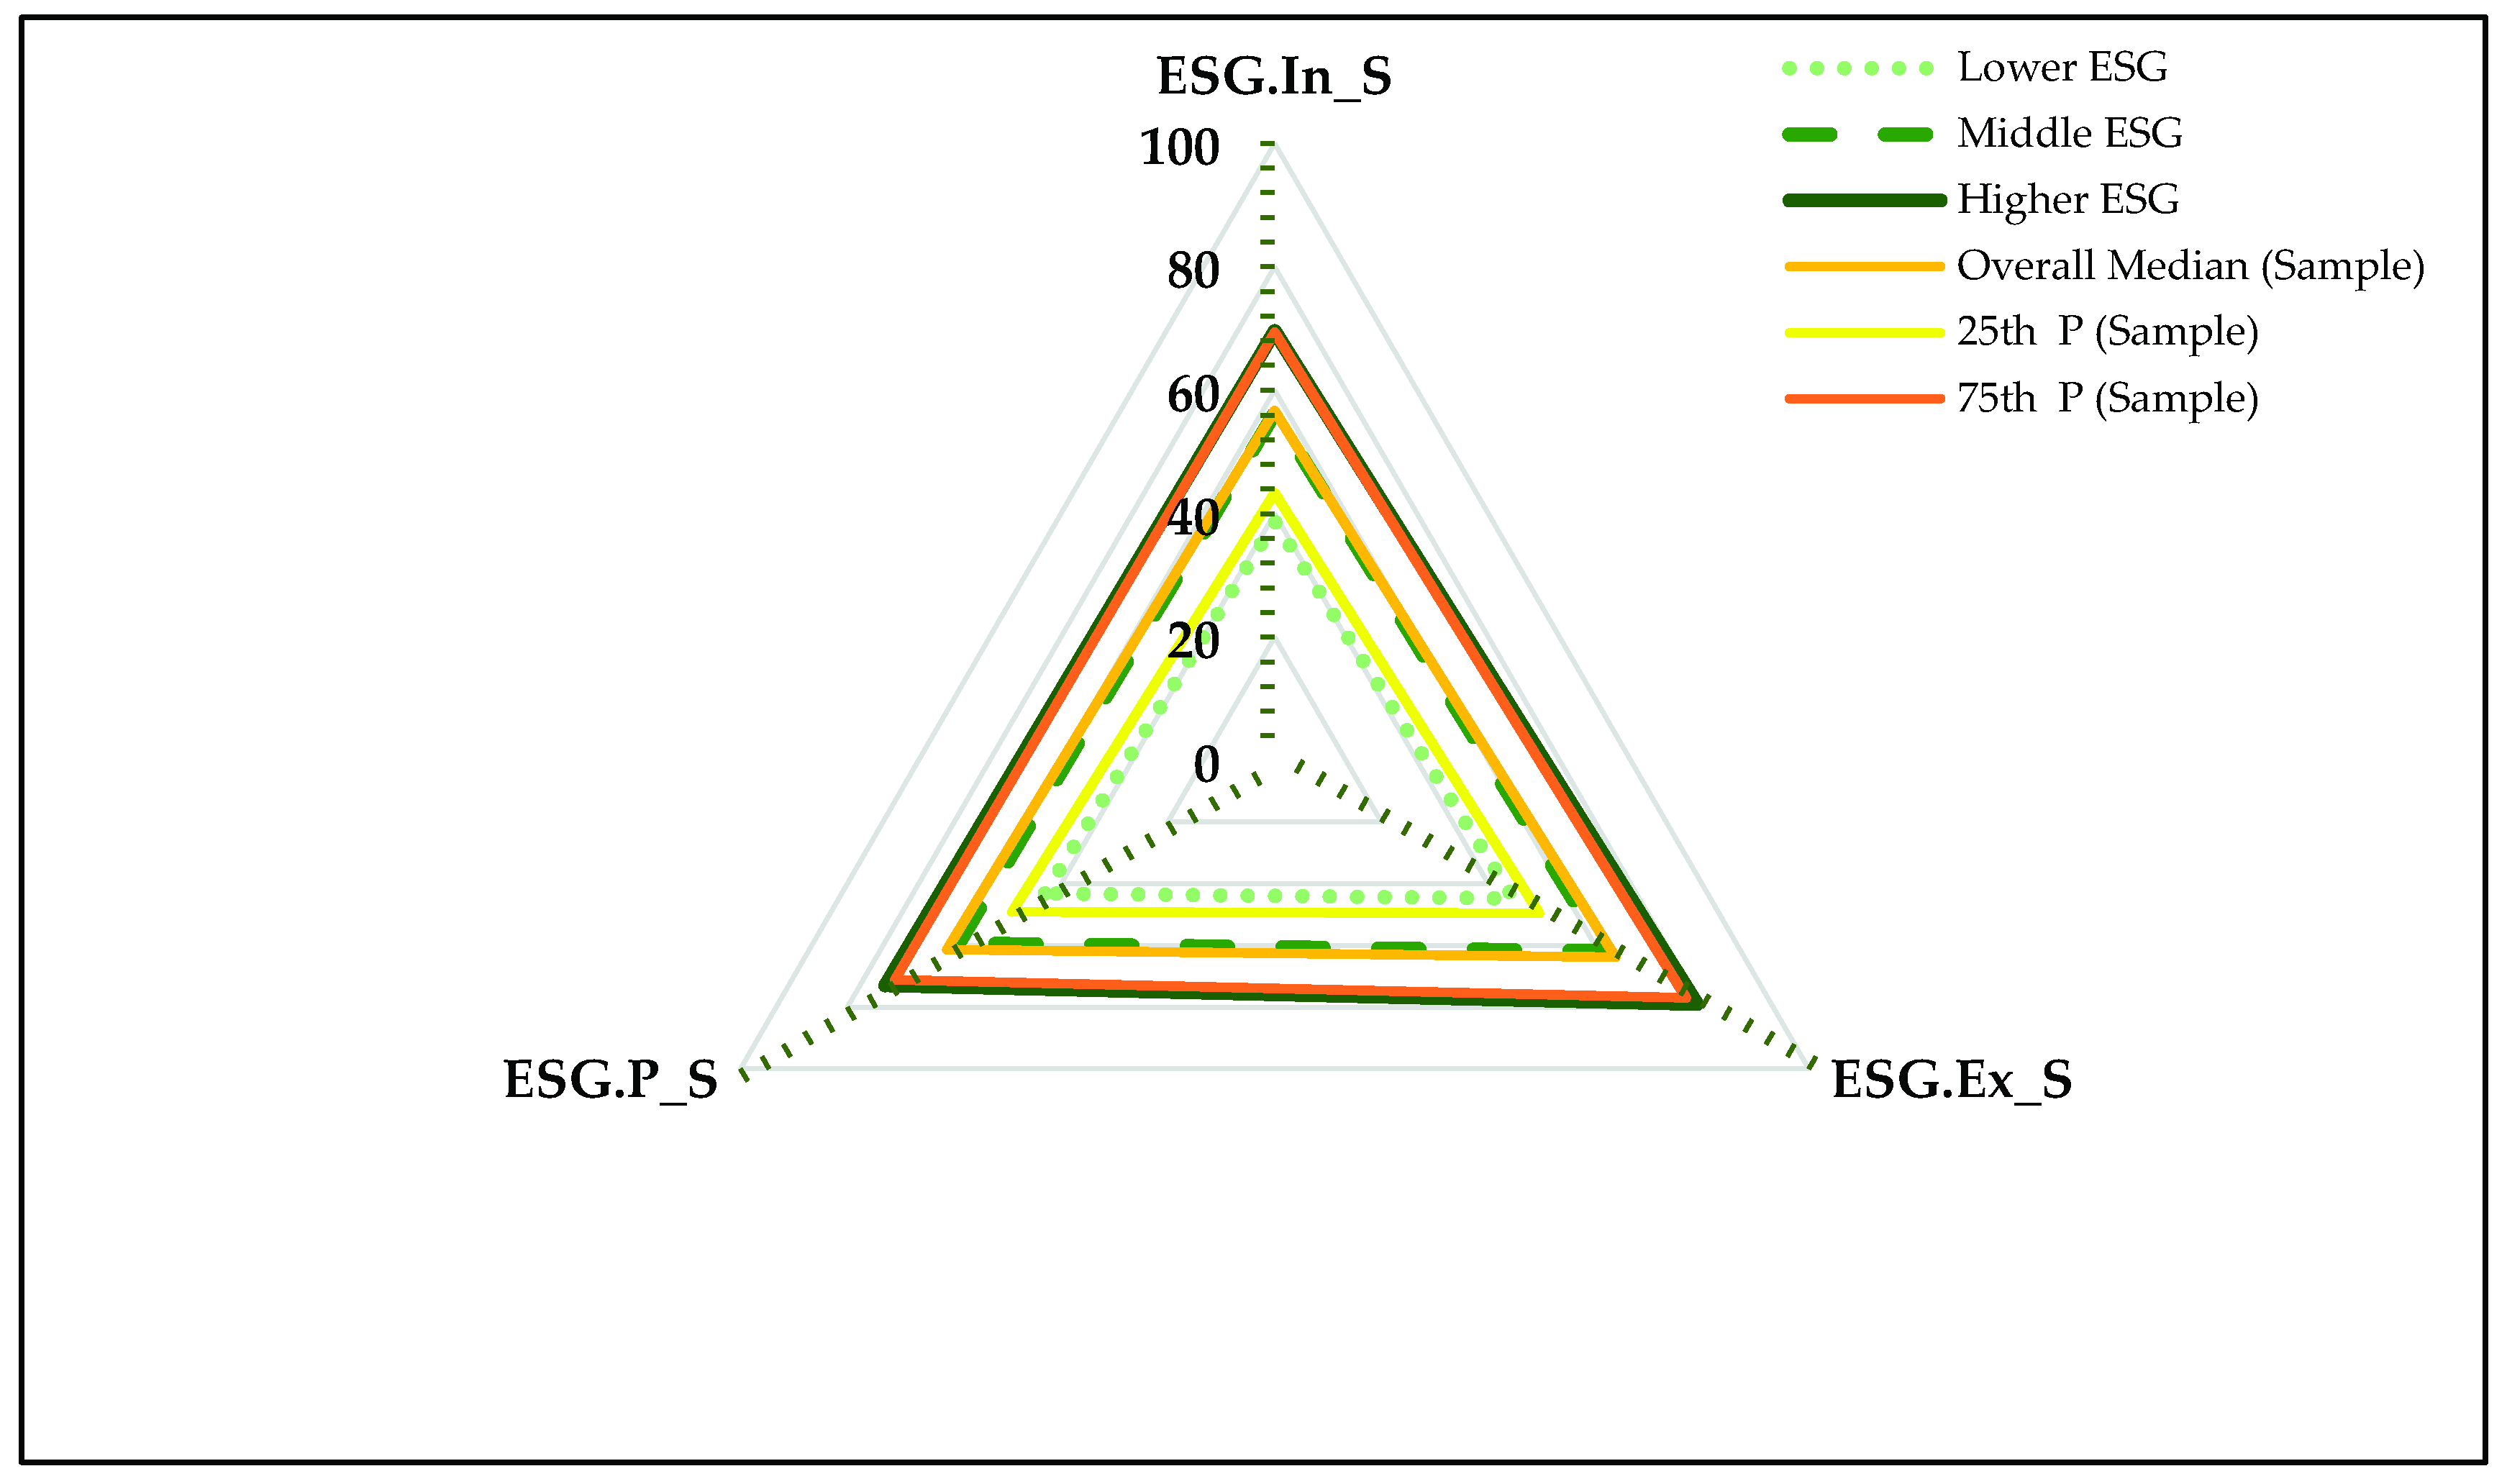
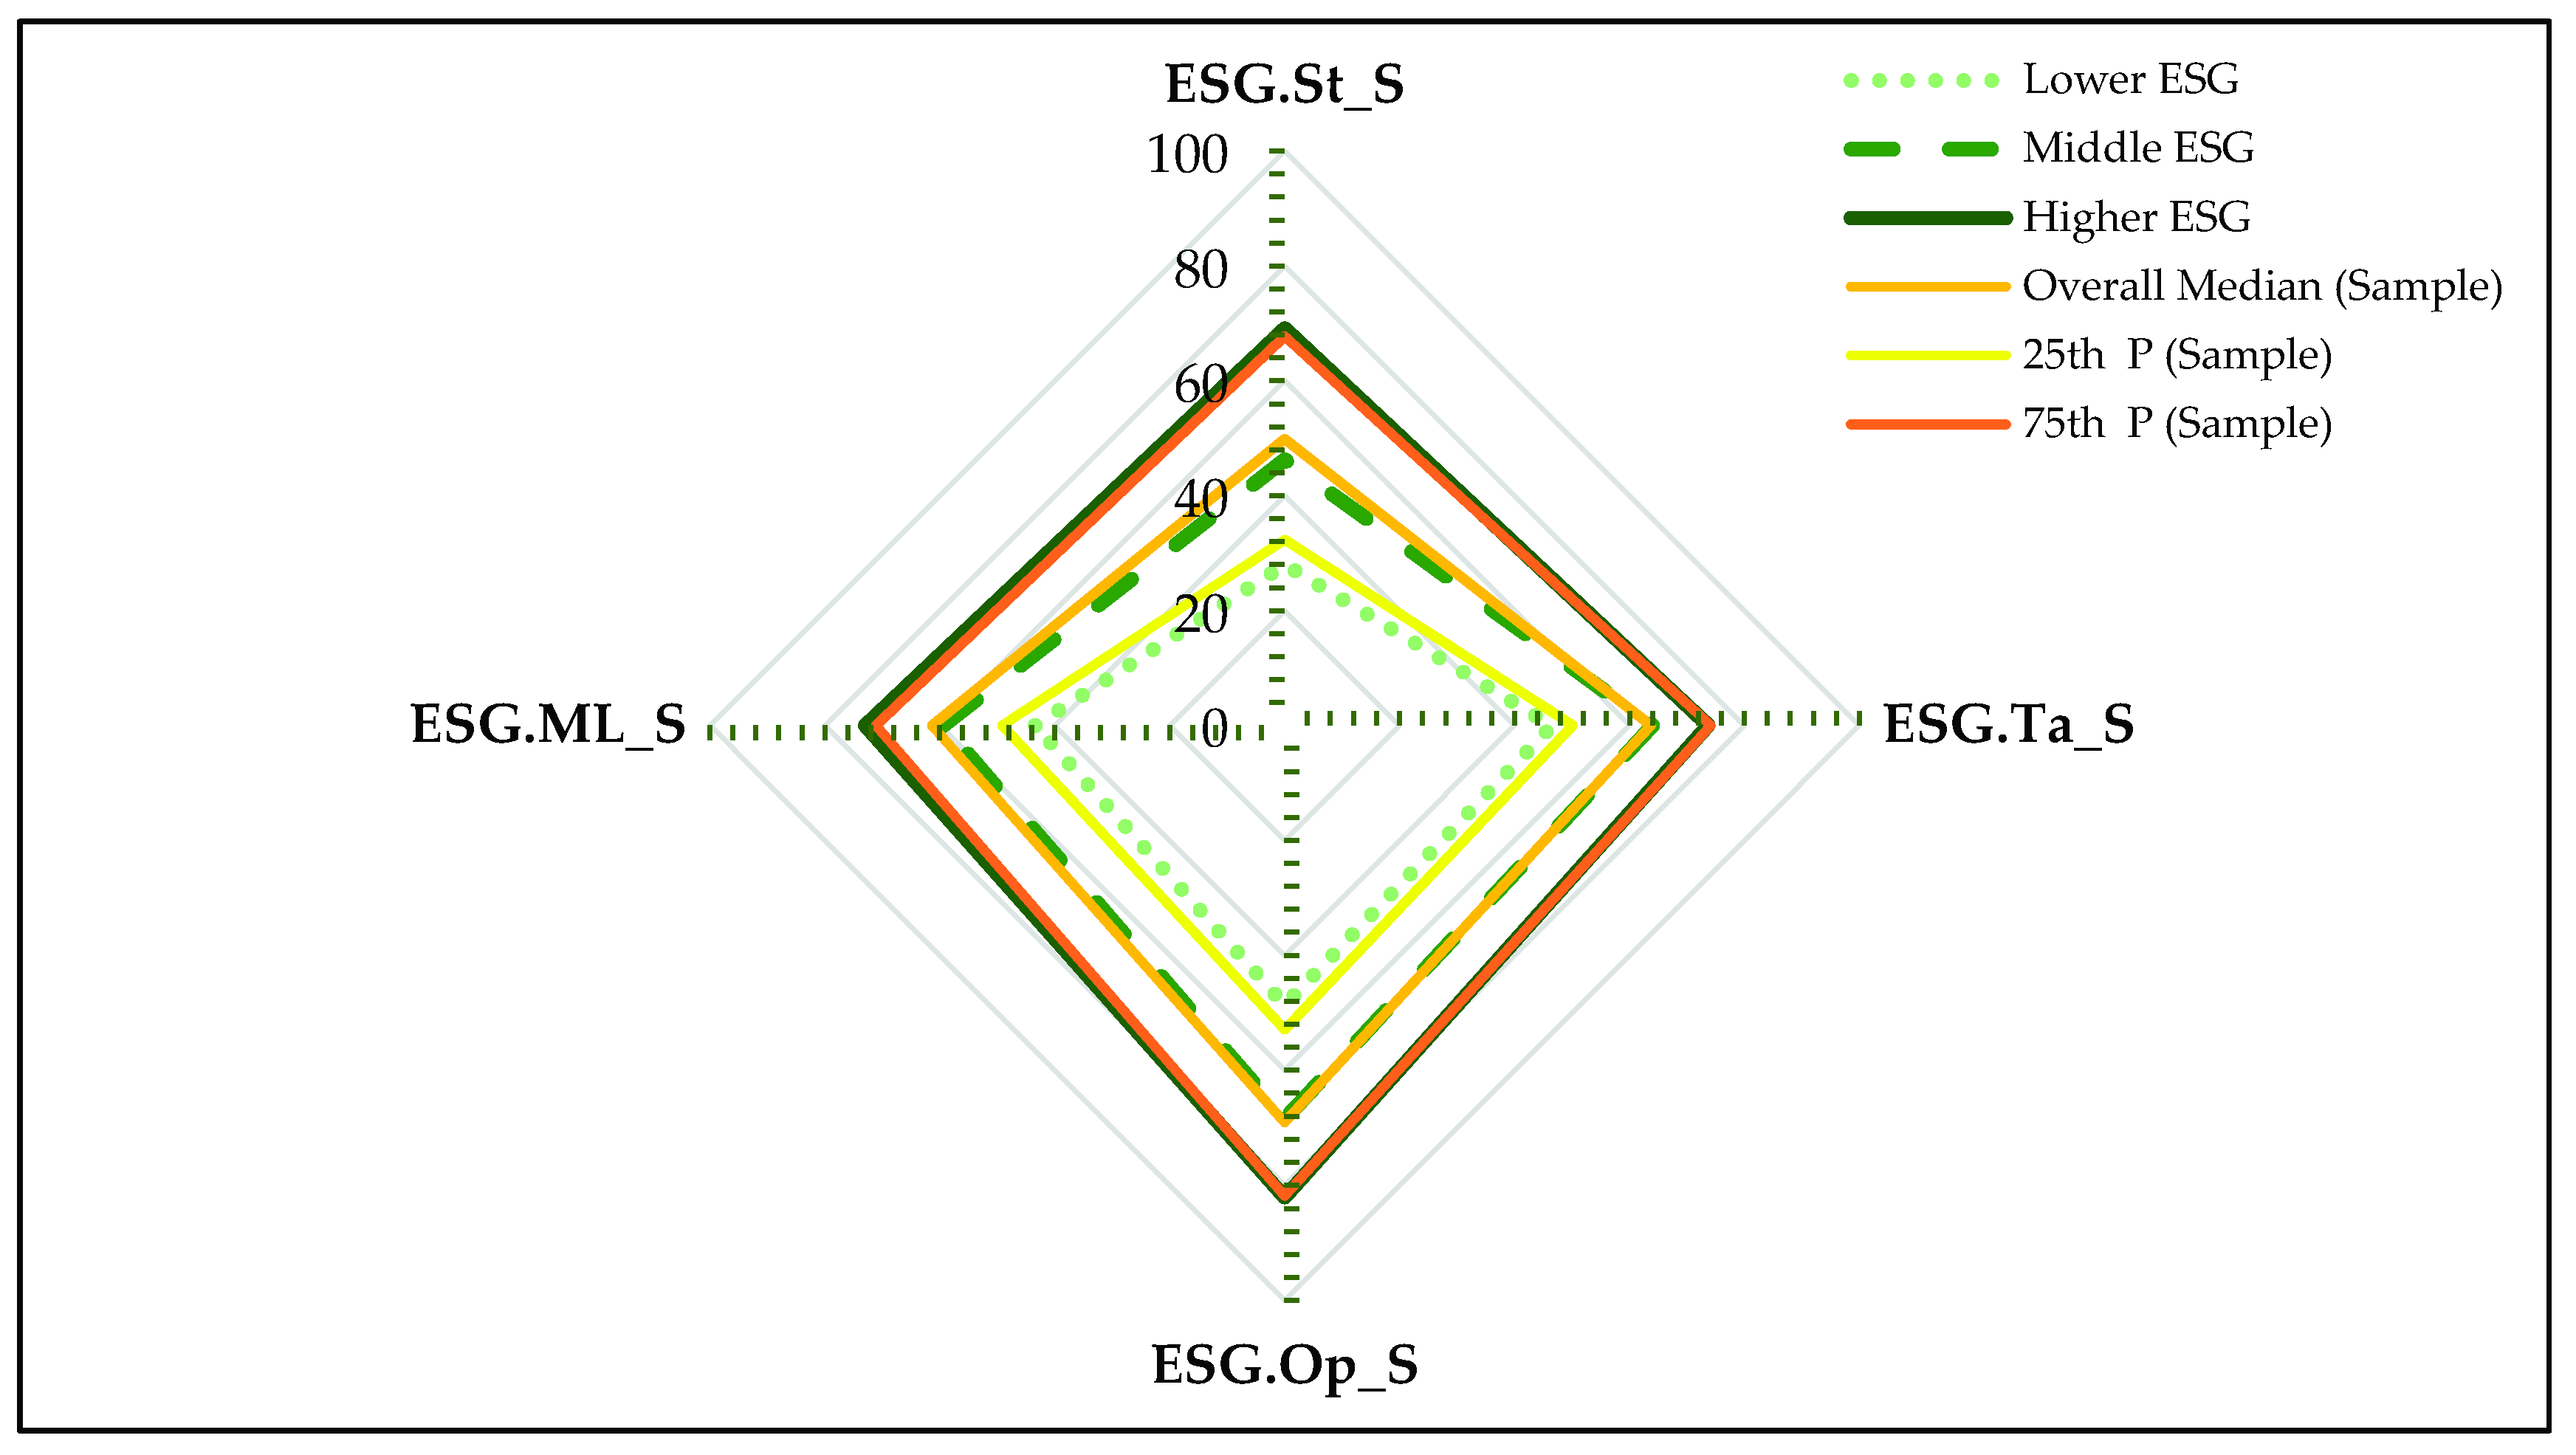
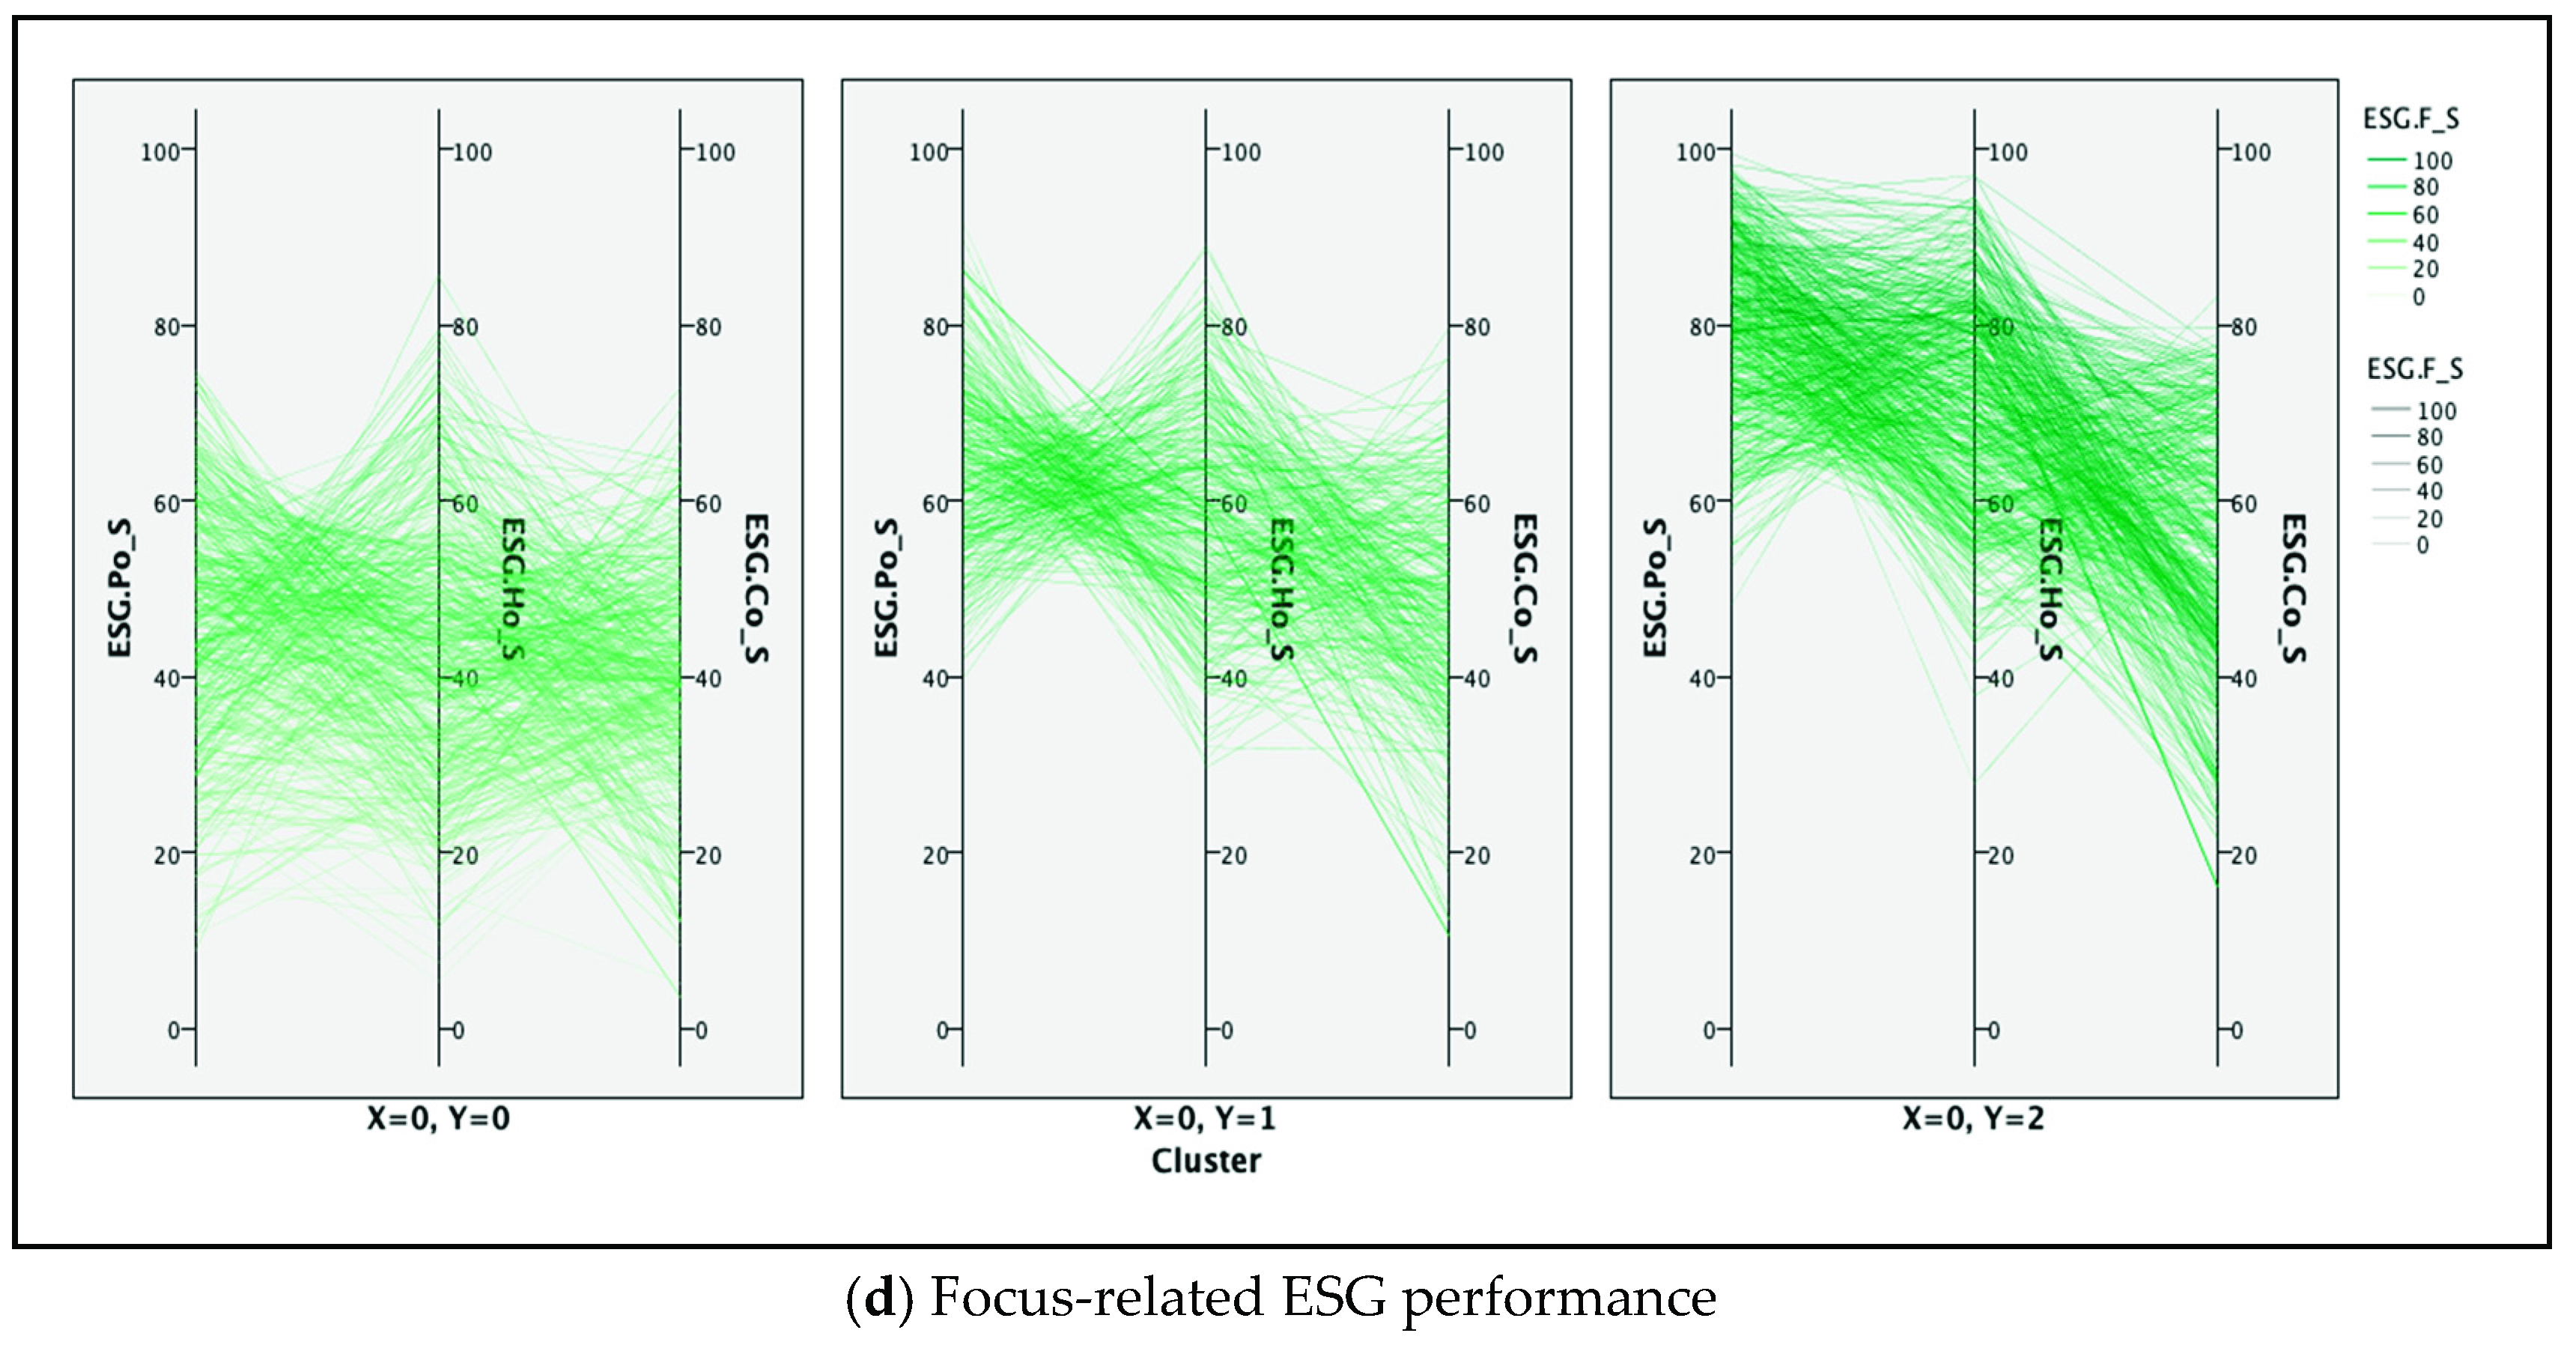
Table 1.
Share of environmental, social and governance (ESG) reporting companies in total companies headquartered in Europe listed by Thomson Reuters EIKON at the beginning of January 2019.
Table 1.
Share of environmental, social and governance (ESG) reporting companies in total companies headquartered in Europe listed by Thomson Reuters EIKON at the beginning of January 2019.
| Indicator | Economic Sector 1 | ||||||||||
|---|---|---|---|---|---|---|---|---|---|---|---|
| BMT | CCS | CNC | ENG | FIN | HLC | IND | TEC | TEL | UTL | TOTAL | |
| No. of ESG reporting companies in the economic sector | 118 | 191 | 78 | 85 | 311 | 84 | 217 | 67 | 46 | 47 | 1244 |
| No. of total listed companies in the economic sector | 1021 | 2004 | 1078 | 503 | 2900 | 772 | 2451 | 1034 | 146 | 390 | 12,299 |
| % of ESG reporting companies in total companies head-quartered in Europe | 11.56 | 9.53 | 7.24 | 16.90 | 10.72 | 10.88 | 8.85 | 6.48 | 31.51 | 12.05 | 10.11 |
1 Considering the Thomson Reuters EIKON database, the ten investigated economic sectors are: BMT = Basic Materials; CCS = Consumer Cyclicals; CNC = Consumer Non-Cyclicals; ENG = Energy; FIN = Financials; HLC = Healthcare; IND = Industrials; TEC = Technology; TEL = Telecommunication Services; UTL = Utilities.
Table 2.
Research sample. Number of investigated companies by economic sector and by country of headquarters.
Table 2.
Research sample. Number of investigated companies by economic sector and by country of headquarters.
| Country 1 | Economic Sector | ||||||||||
|---|---|---|---|---|---|---|---|---|---|---|---|
| BMT | CCS | CNC | ENG | FIN | HLC | IND | TEC | TEL | UTL | Total | |
| AT | 4 | 0 | 0 | 1 | 6 | 0 | 4 | 1 | 1 | 1 | 18 |
| BE | 2 | 1 | 3 | 1 | 7 | 4 | 4 | 2 | 3 | 1 | 28 |
| CH | 7 | 6 | 8 | 1 | 22 | 8 | 15 | 8 | 2 | 1 | 78 |
| CY | 1 | 0 | 0 | 1 | 1 | 0 | 0 | 0 | 0 | 0 | 3 |
| CZ | 0 | 0 | 0 | 0 | 2 | 0 | 0 | 0 | 1 | 1 | 4 |
| DE | 17 | 24 | 4 | 2 | 15 | 11 | 18 | 9 | 5 | 5 | 110 |
| DK | 1 | 2 | 2 | 1 | 6 | 7 | 8 | 1 | 0 | 1 | 29 |
| ES | 2 | 7 | 2 | 4 | 12 | 3 | 8 | 2 | 2 | 6 | 48 |
| FI | 7 | 4 | 2 | 1 | 2 | 1 | 6 | 2 | 2 | 1 | 28 |
| FR | 4 | 24 | 6 | 6 | 16 | 6 | 26 | 8 | 3 | 3 | 102 |
| GI | 0 | 1 | 0 | 0 | 0 | 0 | 0 | 0 | 0 | 0 | 1 |
| GR | 1 | 3 | 1 | 2 | 8 | 0 | 2 | 0 | 1 | 1 | 19 |
| GS | 0 | 0 | 0 | 0 | 13 | 0 | 0 | 0 | 0 | 0 | 13 |
| HU | 0 | 0 | 0 | 1 | 1 | 1 | 0 | 0 | 1 | 0 | 4 |
| IE | 4 | 3 | 4 | 1 | 3 | 1 | 2 | 0 | 0 | 0 | 18 |
| IM | 0 | 1 | 0 | 0 | 0 | 0 | 0 | 1 | 0 | 0 | 2 |
| IT | 1 | 11 | 2 | 4 | 18 | 3 | 5 | 1 | 3 | 7 | 55 |
| JS | 1 | 0 | 0 | 0 | 4 | 0 | 0 | 0 | 0 | 0 | 5 |
| LU | 2 | 2 | 0 | 1 | 3 | 0 | 1 | 0 | 3 | 0 | 12 |
| MT | 0 | 1 | 0 | 0 | 0 | 0 | 0 | 0 | 0 | 0 | 1 |
| NL | 5 | 3 | 4 | 5 | 9 | 2 | 7 | 5 | 3 | 0 | 43 |
| NO | 2 | 1 | 3 | 8 | 4 | 0 | 2 | 0 | 1 | 0 | 21 |
| PL | 2 | 4 | 2 | 4 | 12 | 0 | 2 | 1 | 1 | 4 | 32 |
| PT | 2 | 0 | 2 | 1 | 1 | 0 | 0 | 0 | 2 | 1 | 9 |
| RU | 10 | 0 | 2 | 10 | 5 | 0 | 0 | 0 | 4 | 5 | 36 |
| SE | 8 | 12 | 3 | 1 | 15 | 4 | 22 | 4 | 2 | 0 | 71 |
| UA | 0 | 0 | 1 | 0 | 0 | 0 | 0 | 0 | 0 | 0 | 1 |
| UK | 28 | 72 | 24 | 18 | 116 | 15 | 72 | 16 | 5 | 8 | 374 |
| Total | 111 | 182 | 75 | 74 | 301 | 66 | 204 | 61 | 45 | 46 | 1165 |
1 The countries (and * dependent territories) included in the analysis are: AT = Austria; BE = Belgium; CH = Switzerland; CY = Cyprus; CZ = Czech Republic; DE = Germany; DK = Denmark; ES = Spain; FI = Finland; FR = France; GI = Gibraltar *; GR = Greece; GS = Guernsey *; HU = Hungary; IE = Ireland; IM = Isle of Man *; IT = Italy; JS = Jersey *; LU = Luxembourg; MT = Malta; NL = Netherlands; NO = Norway; PL = Poland; PT = Portugal; RU = Russia; SE = Sweden; UA = Ukraine; UK = United Kingdom.
Table 3.
The innovative ESG approaches based on ESG scores of Thomson Reuters EIKON.
| ESG View | Description | Main Components | ESG Categories (No. of Indicators) 1 |
|---|---|---|---|
| ESG Stakeholder Score (ESG.S_S) | categories of stakeholders/beneficiaries that are mainly influenced by the sustainable actions of the organization | ESG Owner Score (ESG.Ow_S) | Management (34) Shareholders (12) |
| ESG Employee Score (ESG.Em_S) | Workforce (29) | ||
| ESG Consumer Score (ESG.Cr_S) | Environmental Innovation (19) Product Responsibility (12) | ||
| ESG Community Score (ESG.Cy_S) | Resource Use (20) Emissions (22) Human Rights (8) Community (14) CSR Strategy (8) | ||
| ESG Perspective Score (ESG.P_S) | direction of impacts exerted by the sustainable actions of the organization | ESG Internal Score (ESG.In_S) | Workforce (29) Management (34) Shareholders (12) CSR Strategy (8) |
| ESG External Score (ESG.Ex_S) | Resource Use (20) Emissions (22) Environmental Innovation (19) Human Rights (8) Community (14) Product Responsibility (12) | ||
| ESG Management Level Score (ESG.ML_S) | hierarchical levels mainly involved in or generating the sustainable actions of the organization | ESG Strategic Score (ESG.St_S) | Community (14) Management (34) CSR Strategy (8) |
| ESG Tactical Score (ESG.Ta_S) | Environmental Innovation (19) Workforce (29) Shareholders (12) | ||
| ESG Operational Score (ESG.Op_S) | Resource Use (20) Emissions (22) Human Rights (8) Product Responsibility (12) | ||
| ESG Focus Score (ESG.F_S) | corporate priorities mainly considered by the sustainable actions of the organization | ESG Process Oriented Score—ESG Technology-Innovation (ESG.Po_S) | Resource Use (20) Emissions (22) Environmental Innovation (19) Product Responsibility (12) |
| ESG Human Oriented Score—ESG Relationship (ESG.Ho_S) | Workforce (29) Human Rights (8) Management (34) Shareholders (12) | ||
| ESG Communication Oriented Score—ESG Image (ESG.Co_S) | Community (14) CSR Strategy (8) Controversies (23) |
1 The ESG categories, with their corresponding indicators, are the ones provided by TR EIKON.
Table 4.
Descriptive statistics—ESG scores.
| Variable | Min. | Max. | Mean | SD | 25th Q | Median | 75th Q | Skewness | Kurtosis | ||
|---|---|---|---|---|---|---|---|---|---|---|---|
| Stat. | Stat. | Stat. | Stat. | Stat. | Stat. | Stat. | Stat. | S.E. | Stat. | S.E. | |
| ENV_S | 8.91 | 99.43 | 64.89 | 19.69 | 51.79 | 66.19 | 80.79 | −0.41 | 0.07 | −0.50 | 0.14 |
| SOC_S | 4.33 | 98.59 | 62.44 | 19.70 | 48.80 | 64.88 | 77.44 | −0.5 | 0.07 | −0.27 | 0.14 |
| GOV_S | 1.02 | 95.77 | 50.19 | 21.45 | 33.53 | 50.20 | 67.91 | −0.01 | 0.07 | −0.89 | 0.14 |
| ESG_S | 12.85 | 95.75 | 59.53 | 15.98 | 49.06 | 61.23 | 70.95 | −0.39 | 0.07 | −0.28 | 0.14 |
| ESG.Combined_S | 10.24 | 90.56 | 51.05 | 16.05 | 38.76 | 49.07 | 63.68 | 0.21 | 0.07 | −0.74 | 0.14 |
| ESG.Combined_A | 10.24 | 75.86 | 51.96 | 11.86 | 42.57 | 53.55 | 61.62 | −0.30 | 0.07 | −0.72 | 0.14 |
| ESG.Controversies_S | 0.17 | 72.06 | 44.38 | 23.04 | 17.14 | 57.26 | 59.59 | −0.86 | 0.07 | −1.00 | 0.14 |
| Resource.Use_S | 0.08 | 99.83 | 68.01 | 23.08 | 52.06 | 71.83 | 87.44 | −0.58 | 0.07 | −0.56 | 0.14 |
| Emissions_S | 0.28 | 99.92 | 66.60 | 24.39 | 51.13 | 71.11 | 87.03 | −0.72 | 0.07 | −0.27 | 0.14 |
| Environmental.Innovation_S | 0.20 | 99.83 | 59.89 | 26.17 | 37.58 | 61.92 | 84.11 | −0.21 | 0.07 | −1.12 | 0.14 |
| Workforce_S | 0.98 | 99.84 | 67.34 | 23.86 | 51.19 | 71.94 | 87.13 | −0.70 | 0.07 | −0.31 | 0.14 |
| Human.Rights_S | 2.78 | 99.74 | 70.37 | 24.68 | 50.30 | 78.72 | 91.61 | −0.70 | 0.07 | −0.80 | 0.14 |
| Community_S | 0.22 | 99.83 | 50.69 | 30.84 | 23.16 | 49.68 | 79.51 | 0.05 | 0.07 | −1.33 | 0.14 |
| Product.Responsibility_S | 0.22 | 99.82 | 59.56 | 28.90 | 39.08 | 61.18 | 84.40 | −0.38 | 0.07 | −1.06 | 0.14 |
| Management_S | 0.13 | 99.62 | 49.47 | 28.92 | 24.66 | 49.23 | 74.20 | 0.02 | 0.07 | −1.20 | 0.14 |
| Shareholders_S | 0.13 | 99.54 | 51.42 | 29.10 | 25.88 | 51.94 | 77.15 | −0.04 | 0.07 | −1.22 | 0.14 |
| CSR.Strategy_S | 0.97 | 99.80 | 51.31 | 28.26 | 26.32 | 52.78 | 75.00 | −0.07 | 0.07 | −1.20 | 0.14 |
| ESG.Ow_S | 1.02 | 98.93 | 49.98 | 23.57 | 30.95 | 49.28 | 68.65 | 0.01 | 0.07 | −0.97 | 0.14 |
| ESG.Em_S | 0.98 | 99.84 | 67.34 | 23.86 | 51.19 | 71.94 | 87.13 | −0.70 | 0.07 | −0.31 | 0.14 |
| ESG.Cr_S | 4.04 | 99.23 | 59.76 | 21.90 | 42.78 | 60.11 | 77.54 | −0.17 | 0.07 | −0.83 | 0.14 |
| ESG.Cy_S | 7.00 | 97.88 | 62.62 | 19.62 | 49.32 | 65.51 | 78.53 | −0.45 | 0.07 | −0.52 | 0.14 |
| ESG.S_S | 12.72 | 95.77 | 59.62 | 16.02 | 49.14 | 61.35 | 71.12 | −0.40 | 0.07 | −0.28 | 0.14 |
| ESG.In_S | 3.39 | 96.78 | 56.17 | 18.17 | 43.39 | 56.69 | 69.37 | −0.25 | 0.07 | −0.51 | 0.14 |
| ESG.Ex_S | 10.72 | 98.99 | 62.64 | 18.54 | 49.53 | 63.80 | 77.03 | −0.36 | 0.07 | −0.53 | 0.14 |
| ESG.P_S | 12.72 | 95.77 | 59.62 | 16.02 | 49.14 | 61.35 | 71.12 | −0.40 | 0.07 | −0.28 | 0.14 |
| ESG.St_S | 1.11 | 97.74 | 50.04 | 22.60 | 32.31 | 49.91 | 67.77 | −0.01 | 0.07 | −0.86 | 0.14 |
| ESG.Ta_S | 7.46 | 96.78 | 61.80 | 17.14 | 50.14 | 63.74 | 74.14 | −0.43 | 0.07 | −0.21 | 0.14 |
| ESG.Op_S | 5.56 | 99.48 | 66.18 | 19.70 | 52.92 | 69.06 | 81.87 | −0.55 | 0.07 | −0.39 | 0.14 |
| ESG.ML_S | 12.72 | 95.77 | 59.62 | 16.02 | 49.14 | 61.35 | 71.12 | −0.40 | 0.07 | −0.28 | 0.14 |
| ESG.Po_S | 8.78 | 99.48 | 64.08 | 19.00 | 51.05 | 65.51 | 79.30 | −0.41 | 0.07 | −0.46 | 0.14 |
| ESG.Ho_S | 5.32 | 97.02 | 58.01 | 17.98 | 45.58 | 58.61 | 71.70 | −0.25 | 0.07 | −0.53 | 0.14 |
| ESG.Co_S | 3.41 | 83.19 | 47.58 | 14.33 | 38.22 | 46.92 | 57.73 | −0.05 | 0.07 | −0.28 | 0.14 |
| ESG.F_S | 12.75 | 87.05 | 57.88 | 13.61 | 48.84 | 59.38 | 67.59 | −0.41 | 0.07 | −0.28 | 0.14 |
Table 5.
Companies’ exposure to ESG risks—frequency counter.
| ESG Risks Exposure (ESG_RE) | No. of Companies | Percent |
|---|---|---|
| 1—Higher exposure to ESG risks (ESG Controversies Score ≤ 25) | 333 | 28.60 |
| 2—Lower exposure to ESG risks (25 < ESG Controversies Score ≤ 50) | 23 | 2.00 |
| 3—No exposure to ESG risks (ESG Controversies Score > 50) | 809 | 69.40 |
| Total | 1165 | 100.00% |
Table 6.
Distribution of companies across countries of headquarters between the ESG clusters.
| Country/Territory * of Headquarters | Cluster | |||||
|---|---|---|---|---|---|---|
| Higher ESG | Middle ESG | Lower ESG | ||||
| Count | % Within Country | Count | % Within Country | Count | % Within Country | |
| Austria (AT) | 5 | 27.8 | 10 | 55.6 | 3 | 16.7 |
| Belgium (BE) | 12 | 42.9 | 5 | 17.9 | 11 | 39.3 |
| Switzerland (CH) | 35 | 44.9 | 14 | 17.9 | 29 | 37.2 |
| Cyprus (CY) | 2 | 66.7 | 0 | 0.0 | 1 | 33.3 |
| Czech Republic (CZ) | 1 | 25.0 | 1 | 25.0 | 2 | 50.0 |
| Germany (DE) | 53 | 48.2 | 26 | 23.6 | 31 | 28.2 |
| Denmark (DK) | 11 | 37.9 | 8 | 27.6 | 10 | 34.5 |
| Spain (ES) | 29 | 60.4 | 7 | 14.6 | 12 | 25.0 |
| Finland (FI) | 13 | 46.4 | 13 | 46.4 | 2 | 7.1 |
| France (FR) | 68 | 66.7 | 24 | 23.5 | 10 | 9.8 |
| Gibraltar (GI) * | 0 | 0.0 | 0 | 0.0 | 1 | 100.0 |
| Greece (GR) | 9 | 47.4 | 1 | 5.3 | 9 | 47.4 |
| Guernsey (GS) * | 2 | 15.4 | 2 | 15.4 | 9 | 69.2 |
| Hungary (HU) | 3 | 75.0 | 0 | 0.0 | 1 | 25.0 |
| Ireland (IE) | 4 | 22.2 | 5 | 27.8 | 9 | 50.0 |
| Isle of Man (IM) * | 0 | 0.0 | 0 | 0.0 | 2 | 100.0 |
| Italy (IT) | 24 | 43.6 | 16 | 29.1 | 15 | 27.3 |
| Jersey (JS) * | 0 | 0.0 | 1 | 20.0 | 4 | 80.0 |
| Luxembourg (LU) | 4 | 33.3 | 2 | 16.7 | 6 | 50.0 |
| Malta (MT) | 0 | 0.0 | 0 | 0.0 | 1 | 100.0 |
| Netherlands (NL) | 25 | 58.1 | 5 | 11.6 | 13 | 30.2 |
| Norway (NO) | 9 | 42.9 | 6 | 28.6 | 6 | 28.6 |
| Poland (PL) | 8 | 25.0 | 8 | 25.0 | 16 | 50.0 |
| Portugal (PT) | 6 | 66.7 | 1 | 11.1 | 2 | 22.2 |
| Russia (RU) | 9 | 25.0 | 6 | 16.7 | 21 | 58.3 |
| Sweden (SE) | 37 | 52.1 | 13 | 18.3 | 21 | 29.6 |
| Ukraine (UA) | 0 | 0.0 | 0 | 0.0 | 1 | 100.0 |
| United Kingdom (UK) | 127 | 34.0 | 106 | 28.3 | 141 | 37.7 |
| TOTAL | 496 | 42.58 | 280 | 24.03 | 389 | 33.39 |
(*): Dependent territories.
Table 7.
Distribution of companies across economic sectors between the ESG performance clusters.
| Economic Sector 1 | ||||||||||||
|---|---|---|---|---|---|---|---|---|---|---|---|---|
| BMT | CCS | CNC | ENG | FIN | HLC | IND | TEC | TEL | UTL | TOTAL | ||
| High ESG Cluster | Count | 49 | 79 | 35 | 38 | 120 | 32 | 80 | 22 | 19 | 22 | 496 |
| % within cluster | 9.88 | 15.93 | 7.06 | 7.66 | 24.19 | 6.45 | 16.13 | 4.44 | 3.83 | 4.44 | 100.0 | |
| % within ec. sector | 44.14 | 43.41 | 46.67 | 51.35 | 39.87 | 48.48 | 39.22 | 36.07 | 42.22 | 47.83 | 42.58 | |
| % of total | 4.21 | 6.78 | 3.00 | 3.26 | 10.30 | 2.75 | 6.87 | 1.89 | 1.63 | 1.89 | 42.58 | |
| Middle ESG Cluster | Count | 31 | 45 | 15 | 17 | 52 | 16 | 61 | 21 | 10 | 12 | 280 |
| % within cluster | 11.07 | 16.07 | 5.36 | 6.07 | 18.57 | 5.71 | 21.79 | 7.50 | 3.57 | 4.29 | 100.0 | |
| % within ec. sector | 27.93 | 24.73 | 20.00 | 22.97 | 17.28 | 24.24 | 29.90 | 34.43 | 22.22 | 26.09 | 24.03 | |
| % of total | 2.66 | 3.86 | 1.29 | 1.46 | 4.46 | 1.37 | 5.24 | 1.80 | 0.86 | 1.03 | 24.03 | |
| Low ESG Cluster | Count | 31 | 58 | 25 | 19 | 129 | 18 | 63 | 18 | 16 | 12 | 389 |
| % within cluster | 7.97 | 14.91 | 6.43 | 4.88 | 33.16 | 4.63 | 16.20 | 4.63 | 4.11 | 3.08 | 100.0 | |
| % within ec. sector | 27.93 | 31.87 | 33.33 | 25.68 | 42.86 | 27.27 | 30.88 | 29.51 | 35.56 | 26.09 | 33.39 | |
| % of total | 2.66 | 4.98 | 2.15 | 1.63 | 11.07 | 1.55 | 5.41 | 1.55 | 1.37 | 1.03 | 33.39 | |
| TOTAL | Count | 111 | 182 | 75 | 74 | 301 | 66 | 204 | 61 | 45 | 46 | 1165 |
| % within cluster | 9.53 | 15.62 | 6.44 | 6.35 | 25.84 | 5.67 | 17.51 | 5.24 | 3.86 | 3.95 | 100.0 | |
| % within ec. sector | 100.0 | 100.0 | 100.0 | 100.0 | 100.0 | 100.0 | 100.0 | 100.0 | 100.0 | 100.0 | 100.0 | |
| % of total | 9.53 | 15.62 | 6.44 | 6.35 | 25.84 | 5.67 | 17.51 | 5.24 | 3.86 | 3.95 | 100.0 | |
1 The economic sectors are: BMT = Basic Materials; CCS = Consumer Cyclicals; CNC = Consumer Non-Cyclicals; ENG = Energy; FIN = Financials; HLC = Healthcare; IND = Industrials; TEC = Technology; TEL = Telecommunication Services; UTL = Utilities.
Table 8.
Comparative analysis of statistically significant lower-higher median thematic ESG performance for European companies within each ESG cluster.
Table 8.
Comparative analysis of statistically significant lower-higher median thematic ESG performance for European companies within each ESG cluster.
| Thematic ESG Medians | Lower ESG Cluster | Middle ESG Cluster | Higher ESG Cluster |
|---|---|---|---|
| Community_S | 21.43 | 42.91 | 81.14 |
| Resource.Use_S | 46.67 | 70.86 | 87.62 |
| Emissions_S | 47.12 | 69.69 | 85.63 |
| Environmental.Innovation_S | 41.04 | 58.52 | |
| Workforce_S | 49.14 | 71.83 | |
| Human.Rights_S | 45.37 | 75.81 | 91.55 |
| Product.Responsibility_S | 41.50 | 58.38 | |
| Management_S | 36.08 | ||
| CSR.Strategy_S | 25.60 | 51.44 | 73.53 |
| Resource.Use_S | 46.67 | 70.86 | 87.62 |
| Emissions_S | 47.12 | 69.69 | 85.63 |
| Environmental.Innovation_S | 41.04 | 58.52 | 81.40 |
| Workforce_S | 49.14 | 71.83 | 84.61 |
| Human.Rights_S | 45.37 | 75.81 | 91.55 |
| Product.Responsibility_S | 41.50 | 58.38 | 82.16 |
| Community_S | 81.14 | ||
| Management_S | 36.08 | ||
| Management_S | 36.08 | 48.57 | 60.60 |
| Resource.Use_S | 46.67 | 70.86 | 87.62 |
| Emissions_S | 47.12 | 69.69 | 85.63 |
| Environmental.Innovation_S | 58.52 | 81.40 | |
| Workforce_S | 49.14 | 71.83 | 84.61 |
| Human.Rights_S | 45.37 | 75.81 | 91.55 |
| Community_S | 81.14 | ||
| Product.Responsibility_S | 58.38 | 82.16 | |
| CSR.Strategy_S | 73.53 | ||
| Product.Responsibility_S | 41.50 | 58.38 | 82.16 |
| Resource.Use_S | 46.67 | 70.86 | 87.62 |
| Emissions_S | 47.12 | 69.69 | |
| Workforce_S | 49.14 | 71.83 | |
| Human.Rights_S | 45.37 | 75.81 | 91.55 |
| Environmental.Innovation_S | 41.04 | 58.52 | 81.40 |
| Resource.Use_S | 87.62 | ||
| Emissions_S | 85.63 | ||
| Human.Rights_S | 45.37 | 75.81 | 91.55 |
| Workforce_S | 71.83 | ||
| Workforce_S | 84.61 | ||
| Resource.Use_S | 87.62 | ||
| Human.Rights_S | 91.55 | ||
| Emissions_S | 85.63 | ||
| Human.Rights_S | 91.55 |
The ESG themes that have lower medians are highlighted with light green and bold font. The ESG themes that have higher medians are stressed with darker green.
Table 9.
The book of maps of median thematic ESG performance for European companies by economic sector.
Table 9.
The book of maps of median thematic ESG performance for European companies by economic sector.
| Economic Sector | Resource.Use_S | Emissions_S | Environmental.Innovation_S | Workforce_S | Human.Rights_S | Community_S | Product.Responsibility_S | Management_S | CSR.Strategy_S |
|---|---|---|---|---|---|---|---|---|---|
| Lower ESG Cluster | |||||||||
| BMT | |||||||||
| CCS | |||||||||
| CNC | |||||||||
| ENG | |||||||||
| FIN | |||||||||
| HLC | |||||||||
| IND | |||||||||
| TEC | |||||||||
| TEL | |||||||||
| UTL | |||||||||
| Middle ESG Cluster | |||||||||
| BMT | |||||||||
| CCS | |||||||||
| CNC | |||||||||
| ENG | |||||||||
| FIN | |||||||||
| HLC | |||||||||
| IND | |||||||||
| TEC | |||||||||
| TEL | |||||||||
| UTL | |||||||||
| Higher ESG Cluster | |||||||||
| BMT | |||||||||
| CCS | |||||||||
| CNC | |||||||||
| ENG | |||||||||
| FIN | |||||||||
| HLC | |||||||||
| IND | |||||||||
| TEC | |||||||||
| TEL | |||||||||
| UTL | |||||||||
| Legend | ≤Q1 | >Q1 and ≤Q2 | >Q2 and ≤Q3 | >Q3 | |||||
Table 10.
The share of companies in each ESG cluster according to different views.
| View | Cluster | ||
|---|---|---|---|
| Lower ESG | Middle ESG | Higher ESG | |
| Stakeholder View | 33% | 24% | 43% |
| Perspective View | 34% | 23% | 43% |
| Management Level View | 34% | 23% | 43% |
| Focus View | 35% | 24% | 41% |
© 2019 by the authors. Licensee MDPI, Basel, Switzerland. This article is an open access article distributed under the terms and conditions of the Creative Commons Attribution (CC BY) license (http://creativecommons.org/licenses/by/4.0/).
Share and Cite
MDPI and ACS Style
Iamandi, I.-E.; Constantin, L.-G.; Munteanu, S.M.; Cernat-Gruici, B. Mapping the ESG Behavior of European Companies. A Holistic Kohonen Approach. Sustainability 2019, 11, 3276. https://doi.org/10.3390/su11123276
AMA Style
Iamandi I-E, Constantin L-G, Munteanu SM, Cernat-Gruici B. Mapping the ESG Behavior of European Companies. A Holistic Kohonen Approach. Sustainability. 2019; 11(12):3276. https://doi.org/10.3390/su11123276
Chicago/Turabian StyleIamandi, Irina-Eugenia, Laura-Gabriela Constantin, Sebastian Madalin Munteanu, and Bogdan Cernat-Gruici. 2019. "Mapping the ESG Behavior of European Companies. A Holistic Kohonen Approach" Sustainability 11, no. 12: 3276. https://doi.org/10.3390/su11123276
Note that from the first issue of 2016, this journal uses article numbers instead of page numbers. See further details here.