Developing Fair Investment Plans to Enhance Supply Chain Visibility Using Cooperative Games


Graduate School of Logistics, Incheon National University, Incheon 22012, Korea
*
Author to whom correspondence should be addressed.
Sustainability 2019, 11(11), 3209; https://doi.org/10.3390/su11113209
Submission received: 9 May 2019
/
Revised: 30 May 2019
/
Accepted: 3 June 2019
/
Published: 10 June 2019
(This article belongs to the Special Issue Optimal Decisions and Risk Assessment in Sustainable Supply Chains)
Abstract
:As supply chains become more complex and globalized, the individual participants of the supply chains should invest in systems based on information communication technologies (ICT) such as the remote frequency identification device (RFID) with tags that secure the visibility of the entire supply chain. In addition, the level of visibility, such as the container, pallet, carton, and box, should be determined for each participant to optimize its own profit function. By using a collaborative game scheme, the present study illustrates the relationships among participants who invest to a certain level of visibility, and then how much value each participant gets. To find feasible solutions, a genetic algorithm-based mechanism is devised for modeling various fitness functions considering the total profit and benefit to cost (B/C) ratio. The proposed framework considers the relationship among participants, as well as the impact from the enhanced visibility, and it may be possible to make fair and rational decisions for all participants based on the quantitative metrics such as the B/C ratio. In this paper, we propose a novel method based on the game-theoretic approach where the enhanced visibility prevents a certain participant from taking most of the benefit. It seems possible to establish a long-term sustainable supply chain visibility by distributing profit fairly to all participants in the supply chain.
1. Introduction
With the growth of the complexity and globalization of the supply chain, all participants should develop more elaborate plans and execute these plans in a more agile and flexible way. Many supply chain participants hope to maintain a sustainable and resilient structure. If companies are putting more effort into effectively implementing information sharing practices, especially small companies, they can gain a competitive advantage [1]. From an innovation culture and sustainability perspective, strategically leveraging assets to share information for supply chain integration can lead to more innovative results [2]. Therefore, in order to meet the challenges of the current global supply chain environment and the requirements of the participants, it is necessary to accurately secure the information about the entire supply chain and make timely and appropriate decisions. Every step in the layers of the supply chain requires more accurate data collection functions to build a sustainable and a durable supply chain, and therefore automated techniques such as Internet of Thing (IoT) are widely adopted. This automated technology helps ensure accurate and rapid collection and processing of information in the supply chain while minimizing intervention of operation. Among these automation technologies, the remote frequency identification device (RFID) is a universal technology which enables real-time processing and rapid supply chain information collection. Therefore, RFID is adopted by many companies. The level of supply chain visibility depends on the unit of recognized cargo or stock keeping unit (SKU). Since the RFID tag has the characteristic of being recognized as the unique identification of the attached object, the level of visibility of the supply network is determined according to the attachment such as item, box, pallet, and container. However, it requires a great deal of investment to install the RFID systems. Therefore, companies must approach this accepting the long-term mindset that there are short-term costs which have the potential to deliver significant long-term benefits. When decision makers begin to focus on the long term, their operations will show early improvements. Companies with long-term, centralized, and sustainable minds will benefit most from the improved operational performance [3].
In this context, the decision makers should determine if the initial investment can be recovered by the use of the RFID tags, sensors, and operating systems. In addition, it is necessary to determine what participants (manufacturer, carrier, wholesaler or retailer) will attach the RFID tags, because each participant wants to maximize their own profit and enjoy the profit from the enhanced visibility without the cost from attaching the tags. Previous researchers have proposed estimating the improvement in profit from the visualization of the entire supply chain, the profit from the attachment of the RFID tags, and investment cost sharing among participants. However, none of previous studies have proposed a way to simultaneously develop the investment plan in order to enhance the visibility and to evaluate the profit from the enhanced visibility. The present study suggests a novel approach to make a reasonable investment decision for establishing optimum visibility at the supply chain level and to build a sustainable supply chain through cooperation among participants.
The remainder of this paper is organized as follows. Section 2 reviews relevant literature on the integrated RFID investment plans and the cost and benefit sharing rule. In Section 3, we explain the background and basic concepts of the proposed method based on the cooperative game scheme. In Section 4, the basic assumptions and game theoretic model for supply chain visibility are introduced. In Section 5, the effectiveness of the proposed framework is compared using a simple numerical example and sensitivity analysis. Finally, conclusions are drawn, and limitations of the present study are discussed in Section 6.
2. Literature Review
As outsourcing and globalization strategies are widely adopted, it makes the current supply chains more complicated and the visibility for the internal and external operations reduced [4]. In order to cope with these changes, most companies are continuously trying to enhance the supply chain visibility using bar codes, RFID, and IoT. If a participant or whole supply chain secure a certain level of visibility, it is possible to improve their performance through accurate understanding of the current situation and to minimize the negative impacts caused by the risk factors that may arise in the future. Eventually, the strategy of enhanced visibility is regarded as the opportunity to identify and secure the critical success factors that guarantee more sustainable competitive advantages [4,5].
Generally, RFID systems are known to help in terms of reducing costs and securing competitiveness by enhancing visibility, traceability, and reliability of a supply chain, and therefore reduce the gap between the flow of physical items and information [6,7]. Gaining information visibility using RFID systems solves chronic problems caused by supply chain uncertainties and help achieve environmental sustainability and economic benefits [8]. Many industries have waste costs due to the inaccuracy of inventory, and therefore they apply RFID technology, one of the IoT technologies, to make supply chain decisions. In addition, when the costs for applying RFID technology are shared among supply chain manufacturers, retailers respond more sensitively to the costs than manufacturers [9]. By sharing process quality data based on the RFID sensors within the supply chain of the automotive industry, monitoring supply chain quality helps improve supply chain performance by reducing production losses and emergency transit [10]. In particular, it is possible to create additional value by simplifying tasks, reducing labor cost, improving service level, preventing loss and damage, and increasing sales. However, some issues remain, such as the relationship among the companies which have a stake in the viewpoint of the execution of investment plan [11]. On the basis of an RFID system, local residents of an apartment complex have a positive view of the local policy to pay a fair waste disposal cost in order that sustainable innovation is adopted [12]. Previous studies proposed a quantitative model for evaluating the effectiveness of RFID systems, such as the return on investment (ROI) model of a RFID system [13]. Furthermore, another study demonstrated that it may be possible to expect 160 percent of ROI by using an automating process [14]. The collaborative game theoretic model is a quantitative model for evaluating the value of the 4PL(Fourth Party Logistics) collaboration [15], pricing the port service based on the cost-sharing rule [16], allocating cost of container quay service [17], and sharing inventory cost savings through cooperative games [18].
However, although it is possible to reduce costs and create more value using a visibility-based tracing system, a very critical issue still remains among various stakeholders who participate in the supply chain related to the investment plan with respect to the equipment, the facility, the ICT system and the infrastructure for implementing supply chain visibility [11]. Most previous studies have focused on evaluating the additional benefit from the enhanced supply chain visibility by attaching RFID tags and developing a sharing rule for the cost. Nevertheless, it is not easy to develop a clear rule for sharing cost and benefit when various corporates take part in the supply chain. A sophisticated framework needs to be developed for making the decision with regard to which participants should invest in which level of visibility. Table 1 summarizes the difference that this study has comparing with the existing literatures.
In the present study, we propose a novel approach to develop a more rational investment plan for enhancing supply chain visibility. In addition, we use the collaborative game theoretic model and propose a method for evaluating the benefit participants receive by installing RFID tags and sharing information among participants. The proposed approach promotes fair sharing of the additional benefit from enhancing supply chain visibility and building long-term sustainable strategies for supply chain visibility.
3. Background of the Proposed Method
Many previous studies have focused on supply chain visibility and information collection through RFID. Most of these studies, however, have focused on measuring and improving performance by assuming a single enterprise or entire supply chain as a single node. The present study seeks to improve the performance of a company by recognizing the RFID tags used by other collaborators when a company attaches tags in the supply chain. However, in this case, since the tags are attached and owned by the company that purchased the tags, disputes may arise due to the distribution of the tags and the costs incurred, and the profit of the entire supply chain may change depending on where and at which level the tags are attached. Therefore, it is not easy for the supply chain participants to cooperate with each other, because the game situation occurs among the supply chain participants. In this incomplete competitive environment, there is a need for a method that helps maintain a stable cooperative relationship while optimizing the profit of the supply chain when distributing the profits generated by the performance improvement of each company according to the tag attachment.
The game theoretic approach suggests an optimal decision-making procedure based on a mathematical model that considers the competitive relationships among participants. Cooperative games reflect the positive impact of cooperation by analyzing the structure and using complementarity of competition. In order to measure the profit from collaboration, the Shapley value has been devised. This value distributes surplus profits from one participant to others according to the marginal contributions. Cooperative games assume that a coalition is created among all participants, and that synergies of coalition are amplified from the complementarity.
In this study, we propose a new approach to improve the cost efficiency of visibility among participations using a cooperative game scheme to find the optimal solution. To this end, we devise a method to quantify the profit generated from attaching tags and distributing the profits from shared information using the attached RFID tags according to the cooperative game scheme. In general, genetic algorithms (GA) are utilized to obtain a near optimal solution for a very complicated mathematical problem where finding a global optimal solution is not guaranteed in practical time. In addition, GA are well-known as very fast and relatively more accurate for searching the near-optimal solution as compared with various other heuristics.
Research problems for optimizing operations in supply chains such as process designing, task scheduling, resource allocation, and job assignment are well-known as the NP-Complete. Therefore, the development and application of meta-heuristic algorithms are needed to find near-optimal solutions such as tabu search, simulated annealing, and ant colony. Particularly, the GA are widely adopted in process management and scheduling [19], production and distribution planning [20], supplier selection [21], and optimal sales planning for multiple buyers under vendor managed inventory (VMI) [22]. The GA are known to be useful for finding near-optimal solutions for nonlinear integer programming problems similar to the proposed problem [23]. Therefore, in this study, we adopt GA, which have been used in previous studies, for optimal decision making among various members whose benefits vary according to different visibility levels.
The optimal solution is obtained by the GA, which find the optimal solution to maximize the fitness function by mutating and crossing over the possible solutions. The fitness function is devised based on the B/C ratios, whereby benefit represents profit from information sharing and cost represents the investment for attaching the RFID tags. The solution should explain at which level of visibility the tags should be attached, and who, among the participants, should assume the role. Figure 1 shows the start point and status of tagging in the supply chain, where, Xij represents the start point of attaching the tag, and Kij represents the tag attached state and a detailed description is presented in Table 2. Furthermore, the solution should be sustainable and fair to all participants in the supply chain. In order to meet these requirements, the Shapley value is used to quantify the profit by sharing information through the enhanced visibility using the RFID tags. In addition, by using the cooperative game scheme, we propose a new approach which enhances the profit of the entire supply chain as well as that of each participant.
4. Model for Supply Chain Visibility Using the Collaborative Game Theoretical Model
4.1. Notations and Assumptions
In this section, the basic assumptions, variables, and parameters for designing the game theoretical model are explained. Table 2 shows the notations and short descriptions.
In the present study, we assume that all participants share the information from RFID tags, collaborate to avoid the overlapped investment by installing RFID tags on each visibility level such as a container, pallet, box, and item at a single stage in the supply chain.
4.2. Definition of Cost and Benefit and Allocation Rule
Benefit and cost functions: The total cost is computed using the cost for attaching and scanning RFID tags, as well as the cost for operating and maintaining the systems (see Equation (1)).
Cij = CFij + CTij * Xij,
The additional benefit from attaching RFID tags relates to two different concepts: (1) the direct benefit from installed RFID tags and (2) the indirect benefit from shared information by other participants (see Equation (2)). We assume that the participant located in the stage prior to where the RFID tags are attached does not have a direct benefit. However, the participant receives an indirect benefit from information sharing, both a backward and a forward flow.
Bij = BSij + BTij * Kij,
Defining benefit sharing rule: The additional benefit from enhanced visibility is categorized into available shared benefit and not available shared benefit. In Equation (2), the benefit from information sharing is the first one, and the direct benefit that is not shareable is the second one. Figure 2 shows the benefit when manufacturer attaches the RFID tags. In order to rationally share the benefit, we use the Shapley value where the sharing rule of the benefit is derived by collaboration. The Shapley Value is defined as shown in Equation (3), where, n is the number of participants, |S| refers to a set of certain participants, and S-i means the subset of participants excluding participant i.
SVi = ∑S⊂N, i∈S (fc(S) − fc(S − i)) * (|S| − 1)!(n − |S|)!/n!,
With these notations, the characteristic function of each participant is defined by considering the level of visibility (see Equation (4)).
fcij(k) = (n − k) ∑i=k, n VFij + (i − 1) ∑i=k, n VBij,
The allocated cost of each participant is defined based on the allocated benefit as shown in Equation (5).
CSij = (Bij * CTij)/∑j=0, m Bij,
Finally, the net profit of each participant is defined as shown in Equation (6).
BAij = BSij + BTij * Kij − CSij * (Kij − Xij) + CTij * Xij,
5. Illustrative Numerical Experiments
5.1. Design for the Experiment
To simplify the experiment without loss of generality, we assume that the supply chain consists of a manufacturer, carrier, and buyer. Along the supply chain, 100,000 items are supplied to the buyer and the items are packed and unpacked as 10,000 boxes, 500 pallets, and 50 containers. The value of the shared information is defined as VF1 = 1, VF2 = 1.5, VB2 = 1.5, VB3 = 2, and the fixed cost of all participants is equal to 100. Overall, 20% of the total additional benefit is shared. Table 3 shows the cost and direct benefit of each participant.
In the first experiment, in order to find the optimal investment plan, a mechanism based on a genetic algorithm was applied using the product of the B/C ratio of all participants (ΠiΠjBAij/Cij) as the fitness function. Table 4 shows the parameter values for the genetic algorithms. To verify the effectiveness of the proposed approach, we compared the different fitness functions, such as the net profit of the entire supply chain (ΣiΣj (Bij − Cij)), and the B/C ratio of the entire supply chain (ΣiΣjBij/ΣiΣjCij). In addition, the results of two different fitness functions are compared with the B/C ratio by considering sharing costs incurred among participants as a result of installing the RFID systems and attaching tags to the B/C ratio, and considering distributing profit measured by the Shapley value. The genetic algorithm does not always find the same level of optimal solution, as it randomly performed mutation and crossover between genes showing a high fitness-function value. In our experiment, the same gene combination was selected as the optimal solution even if the experiment was repeated several times under the same conditions. The results are shown in Figure 3.
In the second experiment, the results of repeated experiments under the same conditions of the first experiment are compared in order to check the stability of optimal solutions. Because the optimal solution is obtained using a genetic algorithm that belong to a heuristic approach, the experiments should be repeated to check the consistency and stability of the procedure to find an optimal solution. Table 5 shows the pseudo-codes of the genetic algorithms proposed in this study.
5.2. Results and Discussion
Table 6 and Figure 3 show the results of the comparative analysis of the first experiment. The Y-axis represents the value obtained by leveling the B/C ratio value of each participant observed when the fitness function proposed in the present study and the control group have the highest value. Considering the net profit of the entire supply chain, it seems more beneficial when the manufacturer attaches tags on all levels of visibility, however, in order to increase the profit of all participants, the manufacture and carrier should attach tags on different levels. On the basis of the results of the proposed approach, the profit of all participants is enhanced by sharing the benefit concentrated on the buyer.
By applying the method proposed in this study, it is possible to measure the profit from enhanced visibility from the point of view of every participant. In addition, to accomplish the long-term sustainable supply chain, it is possible to motivate collaboration among participants for the installment of the IoT system which requires a great deal of initial investment. The measured profit and results of the various criteria are regarded as the criteria for making decisions regarding who should invest on each level.
5.3. Sensitivity Analysis
In this section, the experimental design and result of sensitivity analysis are described. For repeated experiments under the different sets of parameters, sensitivity analysis is used to apply the Shapley value and visibility level in order to verify the change in the optimal solution. On the basis of the results of the sensitivity analysis, a better approach is suggested which has stable results and is more sustainable.
Figure 4, Figure 5, Figure 6, Figure 7, Figure 8, Figure 9, Figure 10 and Figure 11 show the results of the repeated experiments under the same conditions. The experiment was repeated 100 times under a set of parameters that were identical to those in the first experiment to analyze sensitivity and to find the optimal solutions using a genetic algorithm. For the profit sharing case, we conducted ten sets of tests ten times, with different contributions of manufacturer, distributor, and retailer among the total profit distribution, according to the Shapley value. A grey box in Figure 4, Figure 5, Figure 6, Figure 7, Figure 8, Figure 9, Figure 10 and Figure 11 represents which level the tags should be attached on for visibility, and by whom among the participants.
The results of the experiment using the Shapley value (see Figure 4) show a consistent solution with the patterns. We concluded that more consistent and predictable plans to invest in the visibility of the supply chain are secured when profit sharing is considered. Therefore, the sustainability of the supply chain is secured by the enhanced transparency and the collaboration among participants such as profit sharing.
Figure 6, Figure 8 and Figure 10 show the results of repeated experiments considering cost sharing, B/C ratio of the whole supply chain, and net profit of the entire supply chain, respectively. Since Figure 6, Figure 8 and Figure 10 are less regular than the results of using the Shapley value, it is difficult to find a clear pattern as compared with the one shown in Figure 4. Figure 5, Figure 7, Figure 9 and Figure 11 show the results of the normalized fitness-function value for each experiment.
The results of the comparative experiment group show that the stability and consistency are much lower than in the case of using profit sharing. Therefore, a greater number of various combinations show similar values of the fitness functions. This means that there are several alternatives for achieving a similar level of enhanced visibility, which makes the collaboration among participants unstable.
As shown in Figure 4, using the proposed profit sharing method, several genes are repeatedly selected, and the difference between the lowest and highest values of the fitness-function value is a maximum of 20%. In the comparative experiments used, more genes are selected than those proposed in this study, but all genes have the same level of fitness function, which leads to conflicts in solution selection among the supply chain members. Therefore, in terms of solution consistency, the proposed method is the most feasible.
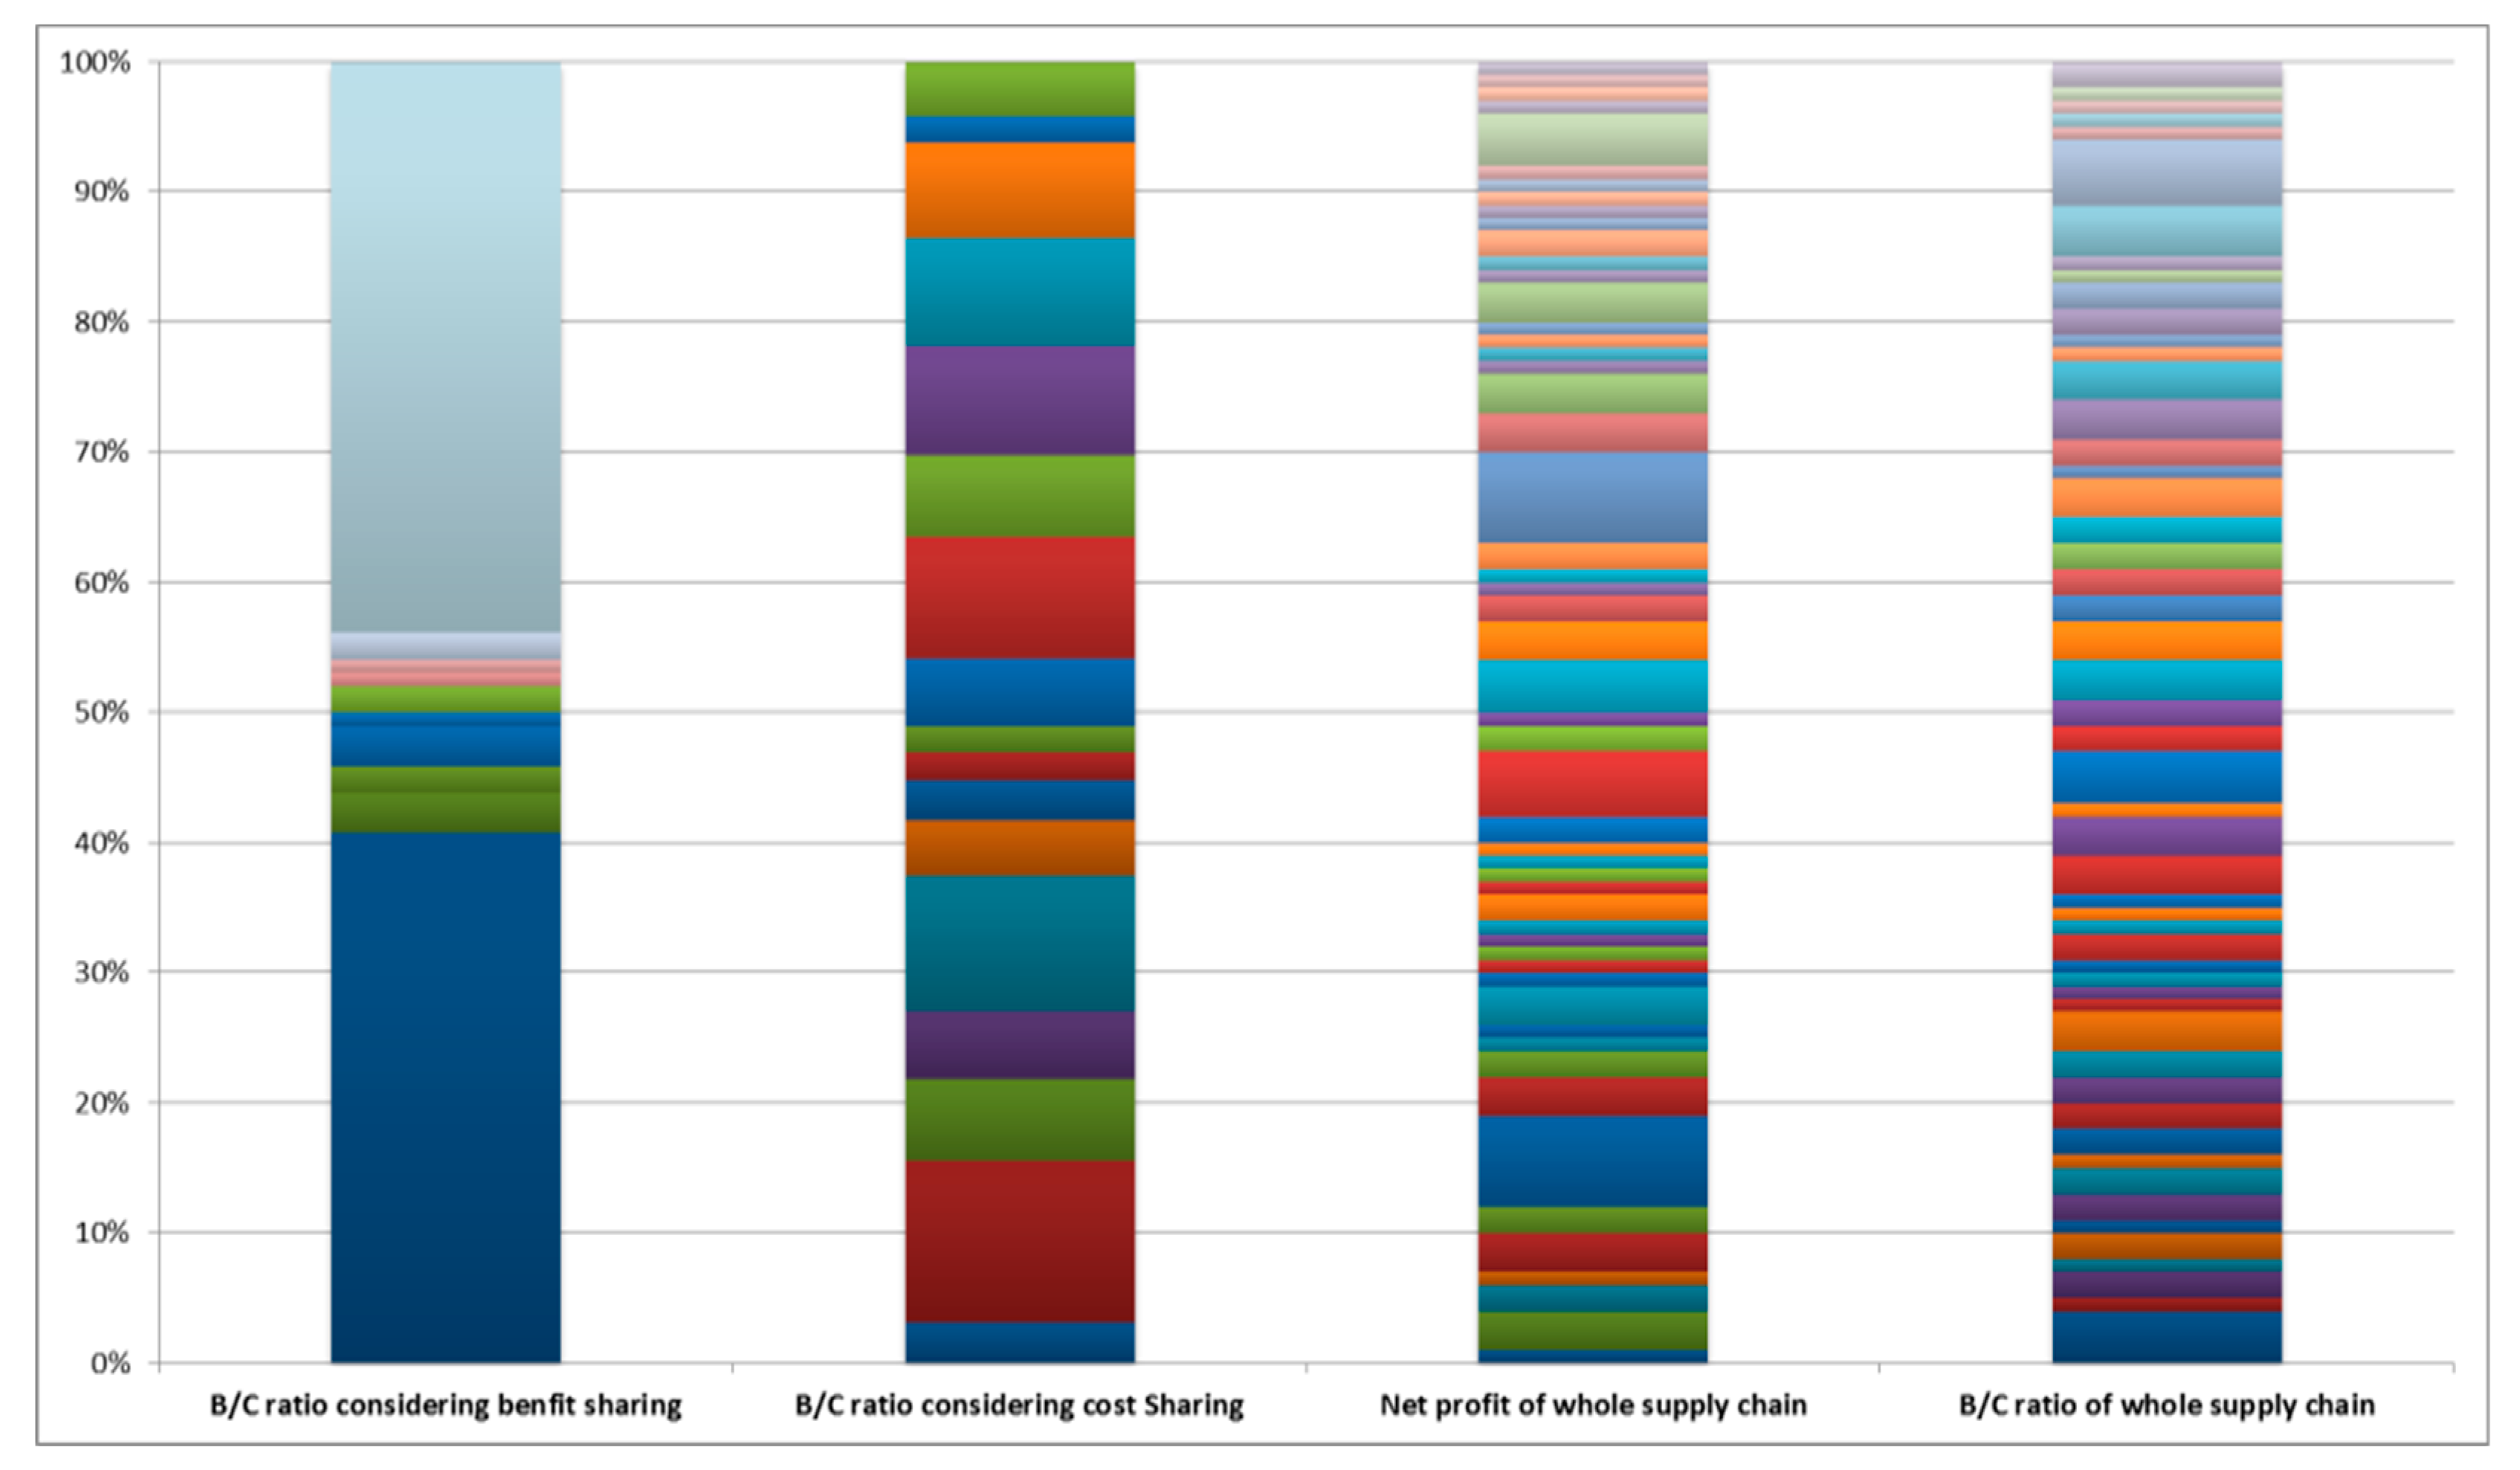
Figure 12 shows the consistency of the solution proposed in the present study with regard to sharing benefit using the Shapley value. The X-axis represents the comparative solutions, while the Y-axis is the cumulative percentage of the decision arrays. The cumulative percentage graph shows how many decision arrays appeared in an experiment repeatedly simulated 100 times with sets of parameters. Table 7 shows the set of parameters for repeated simulated experiments. Generally, the retailer has sales-related information from the attached RFID tags, and therefore if this information is shared in real time, there will be no wasteful game situations such as bullwhip effects. It is common to have a higher Shapley value than a manufacturer or a distributor because higher profits are likely to occur through the sales information. Therefore, the Shapley value for the retailers is set as the largest one, and then, the Shapley value of the distributor is set to be smaller or equal to that of the manufacturer's Shapley value. With this combination of parameters, it is possible to identify the highest case, lowest case, and equal case of the Shapley values assigned to all supply chain members.
The result of sensitivity analysis resulted in 81 decision genetic arrays, however the maximum was 77 in the experiments of net profit for the entire supply chain and the B/C ratio of the entire supply chain. The highest percentage was 43%, followed by 40% at the B/C ratio that considered benefit sharing. The first decision array values with a noticeably large cumulative percentage were “100100100100” for the first, and “001001001001” for the second, in the B/C ratio that considered benefit sharing. The first decision array result was also the optimal value in all other experiments. Except for the experiments described above, the highest percentage was 12%, while most other experiments were less than 5%. This means that all other decisions of the participants are more predictable solutions, and therefore the Shapley value solution has more consistency.
6. Conclusions
In the present study, we devised a new approach to quantify the value of shared information using the RFID system in order to fairly distribute the profit and promote collaboration among participants for a sustainable supply chain. The proposed approach was developed based on the collaborative game theoretic approach and suggests a way to find the optimal solution based ona genetic algorithm to determine the plan for attaching RFID tags using the fitness function and considering the B/C ratios.
Using the proposed approach, it may be possible to maximize the benefit of all participants from the enhanced visibility of the supply chain and reduce the costs due to the lack of information sharing. By redistributing the additional benefits through collaboration, our results confirmed that we can develop a sustainable and reasonable investment plan that guarantees more benefits for all participants. In addition, based on the results of repeated experiments, we verified the possibility that the proposed solution provides consistency in the construction of predictable and sustainable supply chain visibility.
However, the present study has several limitations in terms of applying the proposed approach to the practical supply chain. First of all, we considered a limited number of participants, although the current global supply chain has a great number of participants. In addition, the proposed approach required capturing the consistency of optimal solutions by the extension of experiments with sensitivity analysis in terms of rules for sharing profit. We did not assume the minimum required level of visibility at each stage of supply chain. The proposed game theoretic model was revised and compared with the proposed one in terms of cost and benefits. Although we presented and proved how to measure profit from the visibility and the way to share it among participants, we need more systematic analysis to apply the proposed approach to practical supply chains. For example, how to interpret the Shapley value in terms of monetary value needs to be considered. In addition, in order to motivate or persuade the leaders among participants or others, the design of supporting public policy including incentives and penalties are required at the same time. Finally, future studies may improve the performance of the proposed approach based on GA by customizing the properties of GA or comparing them with other meta-heuristics algorithms.
Author Contributions
Conceptualization, C.K.; Methodology, C.K.; Software, C.K.; Validation, C.K. and K.S.; Formal Analysis, K.S.; Investigation, C.K.; Resources, C.K.; Data Curation, C.K.; Writing-Original Draft Preparation, C.K.; Writing-Review & Editing, K.S.; Visualization, C.K.; Supervision, K.S.
Funding
This work was supported by the Incheon National University Research Grant in 2015.
Conflicts of Interest
The authors declare no conflict of interest.
References
- Kashav, S.; Cerchione, R.; Centobelli, P.; Shabani, A. Sustainability Orientation, Supply Chain Integration, and SMEs Performance: A Causal Analysis. Benchmarking Int. J. 2018, 25, 3679–3701. [Google Scholar]
- Jin, Z.; Navare, J.; Lynch, R. The Relationship between Innovation Culture and Innovation Outcomes: Exploring the Effects of Sustainability Orientation and Firm Size. R D Manag. 2018. [Google Scholar] [CrossRef]
- Croom, S.; Vidal, N.; Spetic, W.; Marshall, D.; McCarthy, L. Impact of Social Sustainability Orientation and Supply Chain Practices on Operational Performance. Int. J. Oper. Prod. Manag. 2018, 38, 2344–2366. [Google Scholar] [CrossRef]
- Barratt, M.; Oke, A. Antecedents of Supply Chain Visibility in Retail Supply Chains: A Resource-Based Theory Perspective. J. Oper. Manag. 2007, 25, 1217–1233. [Google Scholar] [CrossRef]
- Tse, Y.K.; Tan, K.H. Managing Product Quality Risk and Visibility in Multi-Layer Supply Chain. Int. J. Prod. Econ. 2012, 139, 49–57. [Google Scholar] [CrossRef]
- Kang, Y.; Son, K.; Lee, Y.; Rhee, J. A Model-Based Performance Study of the EPCglobal Network. IE Interfaces 2011, 24, 139–150. [Google Scholar] [CrossRef]
- Ustundag, A. Evaluating RFID Investment on a Supply Chain using Tagging Cost Sharing Factor. Int. J. Prod. Res. 2010, 48, 2549–2562. [Google Scholar] [CrossRef]
- Kim, Y.; Chang, T.; Park, J. Gen2 RFID-Based System Framework for Resource Circulation in Closed-Loop Supply Chains. Sustainability 2017, 9, 1995. [Google Scholar] [CrossRef]
- Fan, T.; Tao, F.; Deng, S.; Li, S. Impact of RFID Technology on Supply Chain Decisions with Inventory Inaccuracies. Int. J. Prod. Econ. 2015, 159, 117–125. [Google Scholar] [CrossRef]
- Teucke, M.; Sommerfeld, D.; Freitag, M. Sharing Sensor Based Quality Data in Automotive Supply Chain Processes. IFAC-PapersOnLine 2018, 51, 770–775. [Google Scholar] [CrossRef]
- Joung, S.-I.; Kim, D.S. Case Study for RFID Applications from Business Model Perspective. J. Inf. Technol. Appl. Manag. 2013, 20, 197–216. [Google Scholar]
- Lee, S.; Jung, K. The Role of Community-Led Governance in Innovation Diffusion: The Case of RFID Waste Pricing System in the Republic of Korea. Sustainability 2018, 10, 3125. [Google Scholar] [CrossRef]
- Kim, J. ROI Model for the Adoption of RFID Technology in SCM. In Proceedings of the Korean Operations and Management Science Society Conference, Seoul, Korea, 13 May 2005; pp. 36–43. [Google Scholar]
- Melski, A.; Mueller, J.; Zeier, A.; Schumann, M. Assessing the Effects of Enhanced Supply Chain Visibility through Rfid. In AMCIS 2008 Proceedings; Association for Information Systems: New York, NY, USA, 2008; Volume 51. [Google Scholar]
- Xu, N. Improved Weighted Shapley Value Model for the Fourth Party Logistics Supply Chain Coalition. J. Control. Sci. Eng. 2013, 2013, 1. [Google Scholar] [CrossRef]
- Park, B.; Sung, S. Pricing the Seaport Service According to the Cost Allocation Rule of Game Theory. J. Korea Port. Econ. Assoc. 2012, 28, 257–274. [Google Scholar]
- Seong, S. A Game Theoretic Approach to the Container Quay Construction in Busan. J. Korea Port. Econ. Assoc. 2008, 24, 23–35. [Google Scholar]
- Otero, C.; Amaya, R. A Cost-Effective Collaborative Inventory Management Strategy between Non-Competitor Companies-A Case Study. In Proceedings of the International Conference on Industrial Engineering and Operations Management, Bogota, Colombia, 25–26 October 2017; pp. 948–960. [Google Scholar]
- Hyun, C.L.; Ha, C. Sustainable Integrated Process Planning and Scheduling Optimization using a Genetic Algorithm with an Integrated Chromosome Representation. Sustainability 2019, 11, 502. [Google Scholar]
- Seok-jin, L. A Study on the Production and Distribution Problem in a Supply Chain Network using Algorithm. J. Korean Inst. Ind. Eng. 2003, 5, 263–270. [Google Scholar]
- Yeh, W.; Chuang, M. Using Multi-Objective Genetic Algorithm for Partner Selection in Green Supply Chain Problems. Expert Syst. Appl. 2011, 38, 4244–4253. [Google Scholar] [CrossRef]
- Nachiappan, S.P.; Jawahar, N. A Genetic Algorithm for Optimal Operating Parameters of VMI System in a Two-Echelon Supply Chain. Eur. J. Oper. Res. 2007, 182, 1433–1452. [Google Scholar] [CrossRef]
- Yokota, T.; Gen, M.; Li, Y. Genetic Algorithm for Non-Linear Mixed Integer Programming Problems and its Applications. Comput. Ind. Eng. 1996, 30, 905–917. [Google Scholar] [CrossRef]
Figure 1.
RFID tags attaching model.
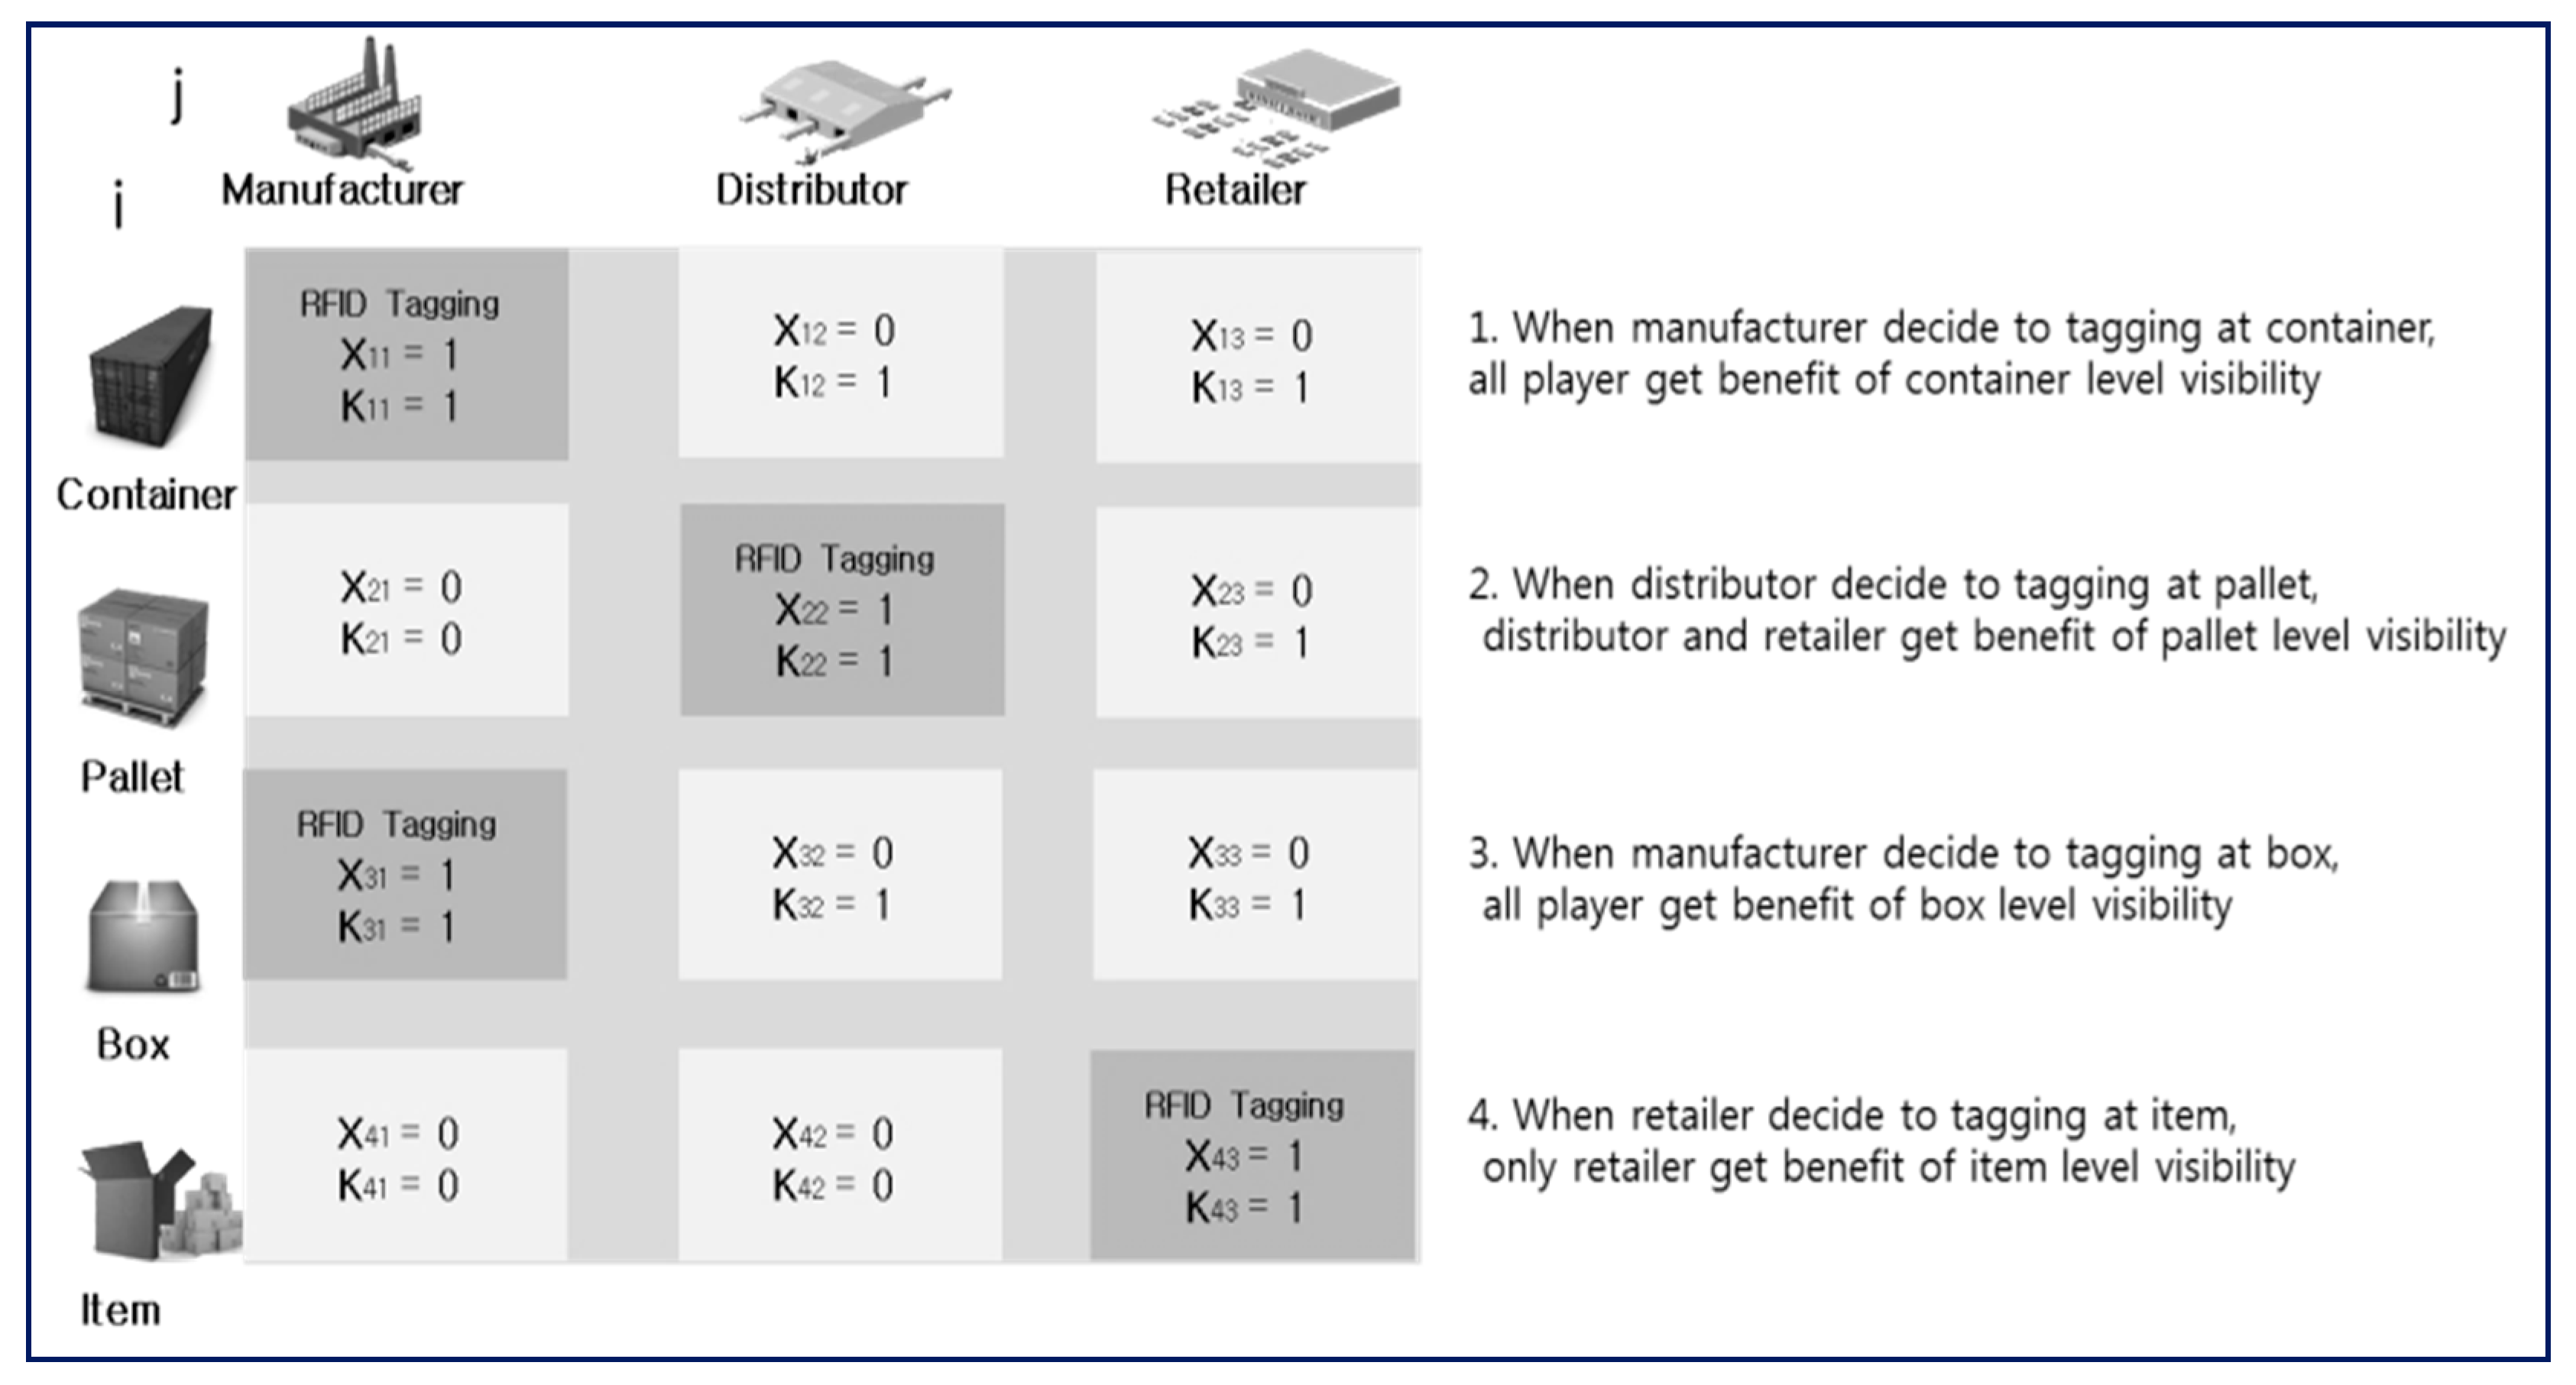
Figure 2.
Shapley value when attaching the RFID tag at the manufacturer.
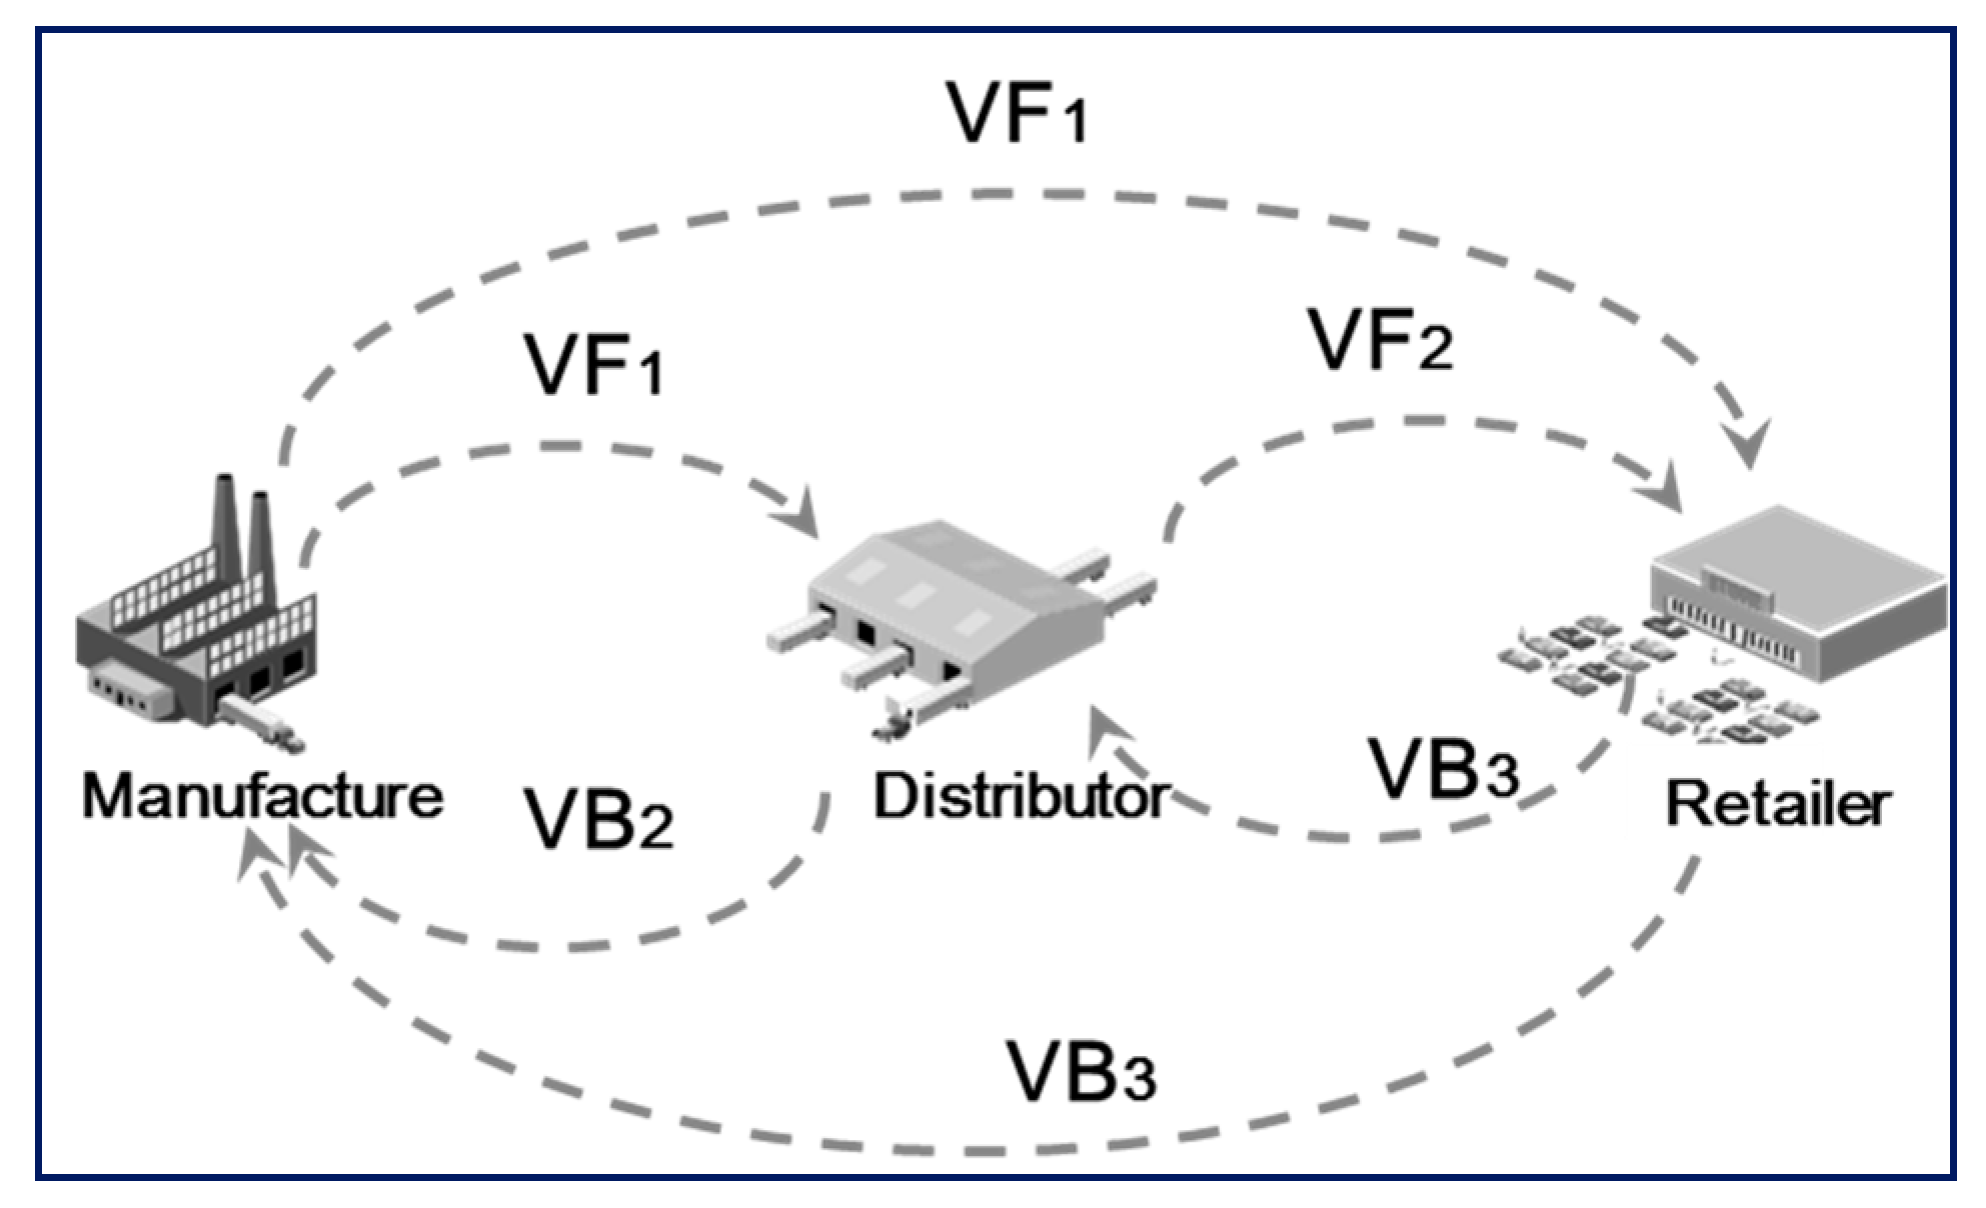
Figure 3.
Results of the comparative analysis.
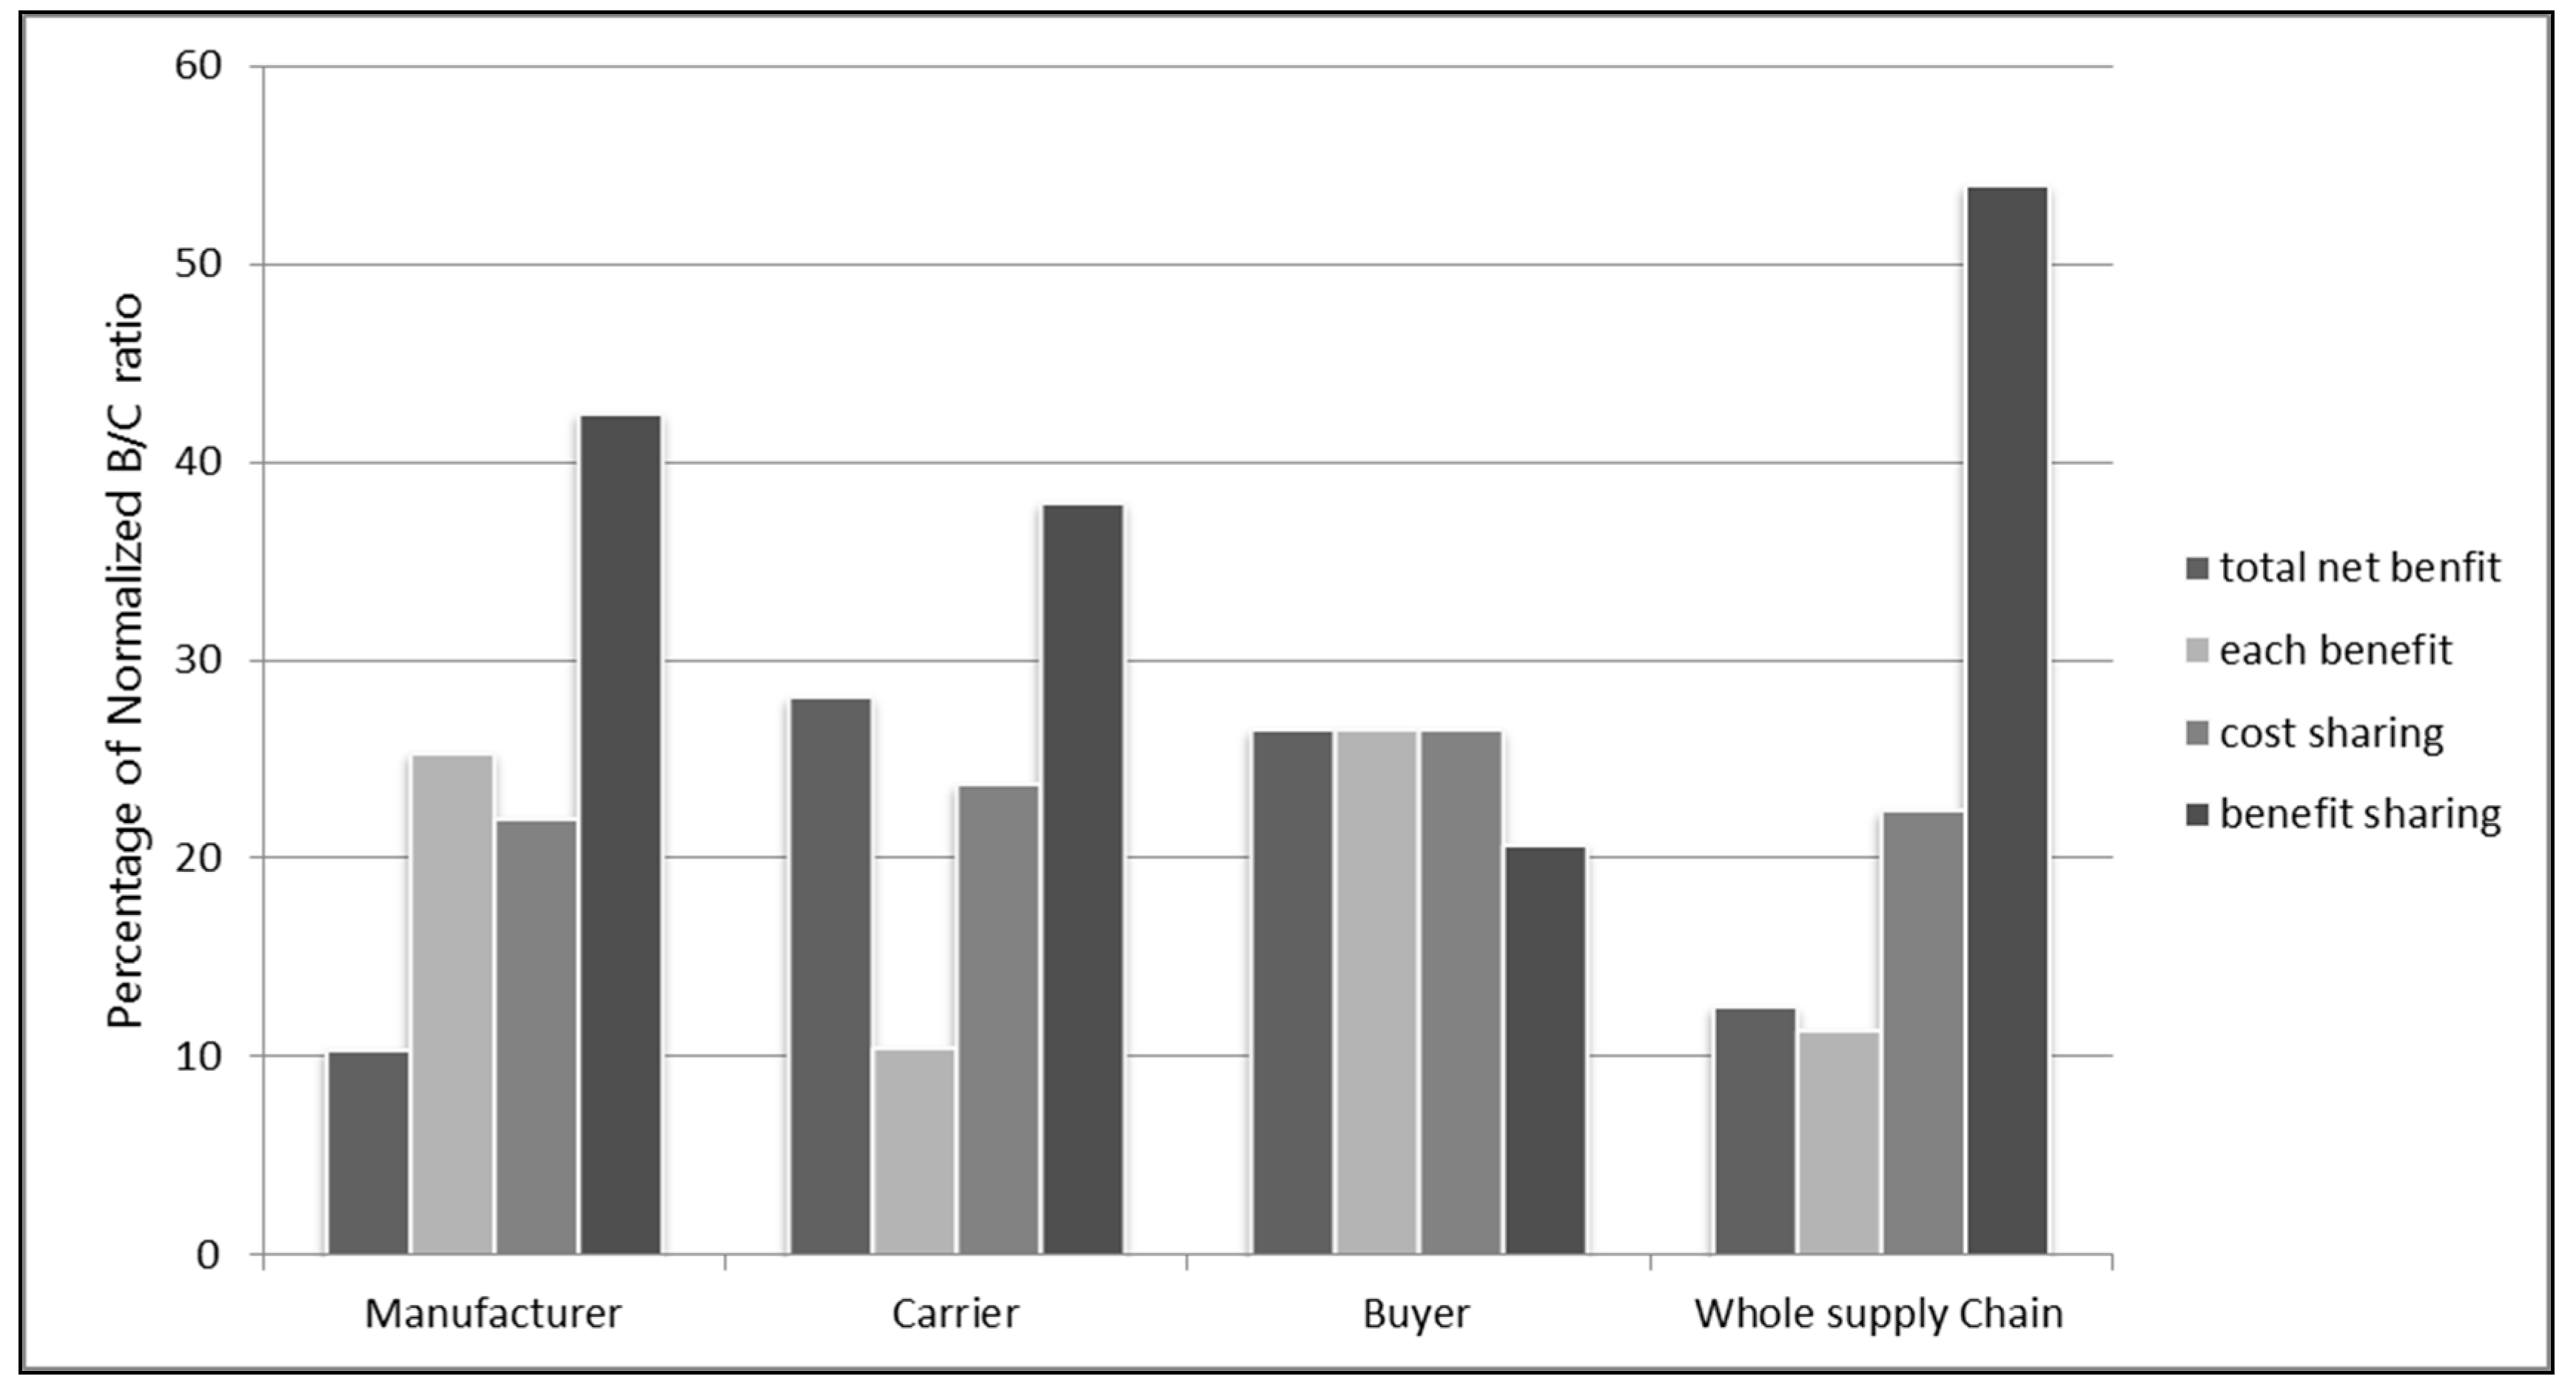
Figure 4.
Optimal solution considering profit sharing based on the Shapley value.

Figure 5.
Normalized fitness-function value considering profit sharing.
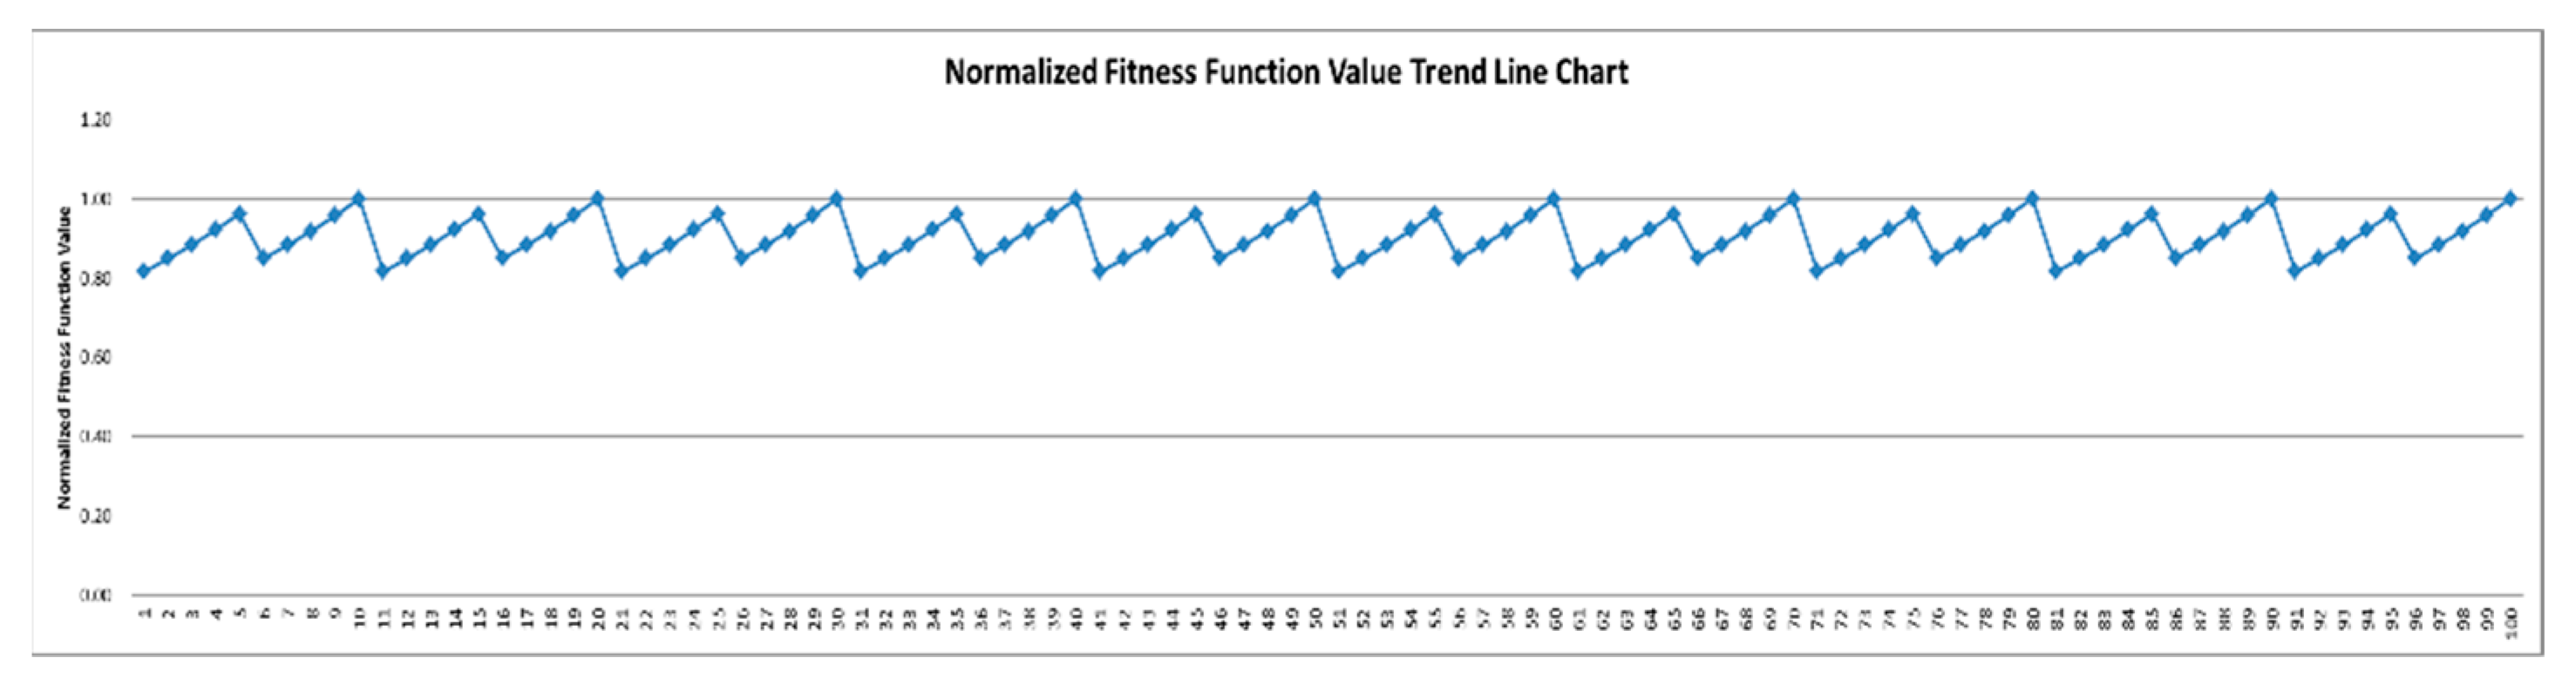
Figure 6.
Optimal solutions considering cost sharing.
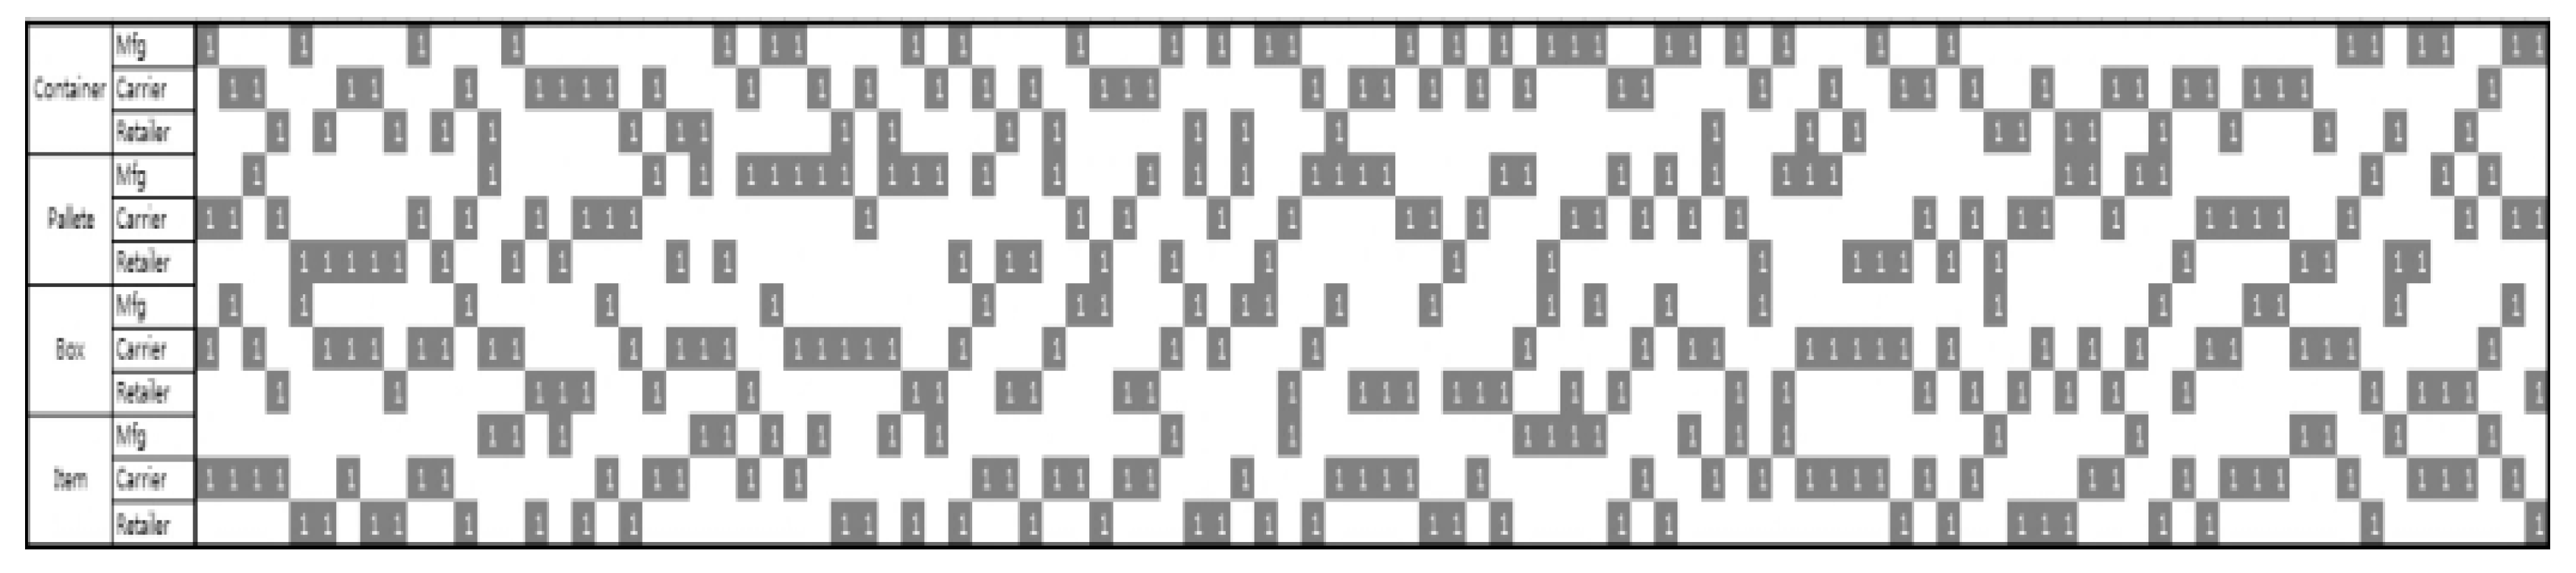
Figure 7.
Normalized fitness-function value considering cost sharing.

Figure 8.
Optimal solutions considering the total B/C ratio.
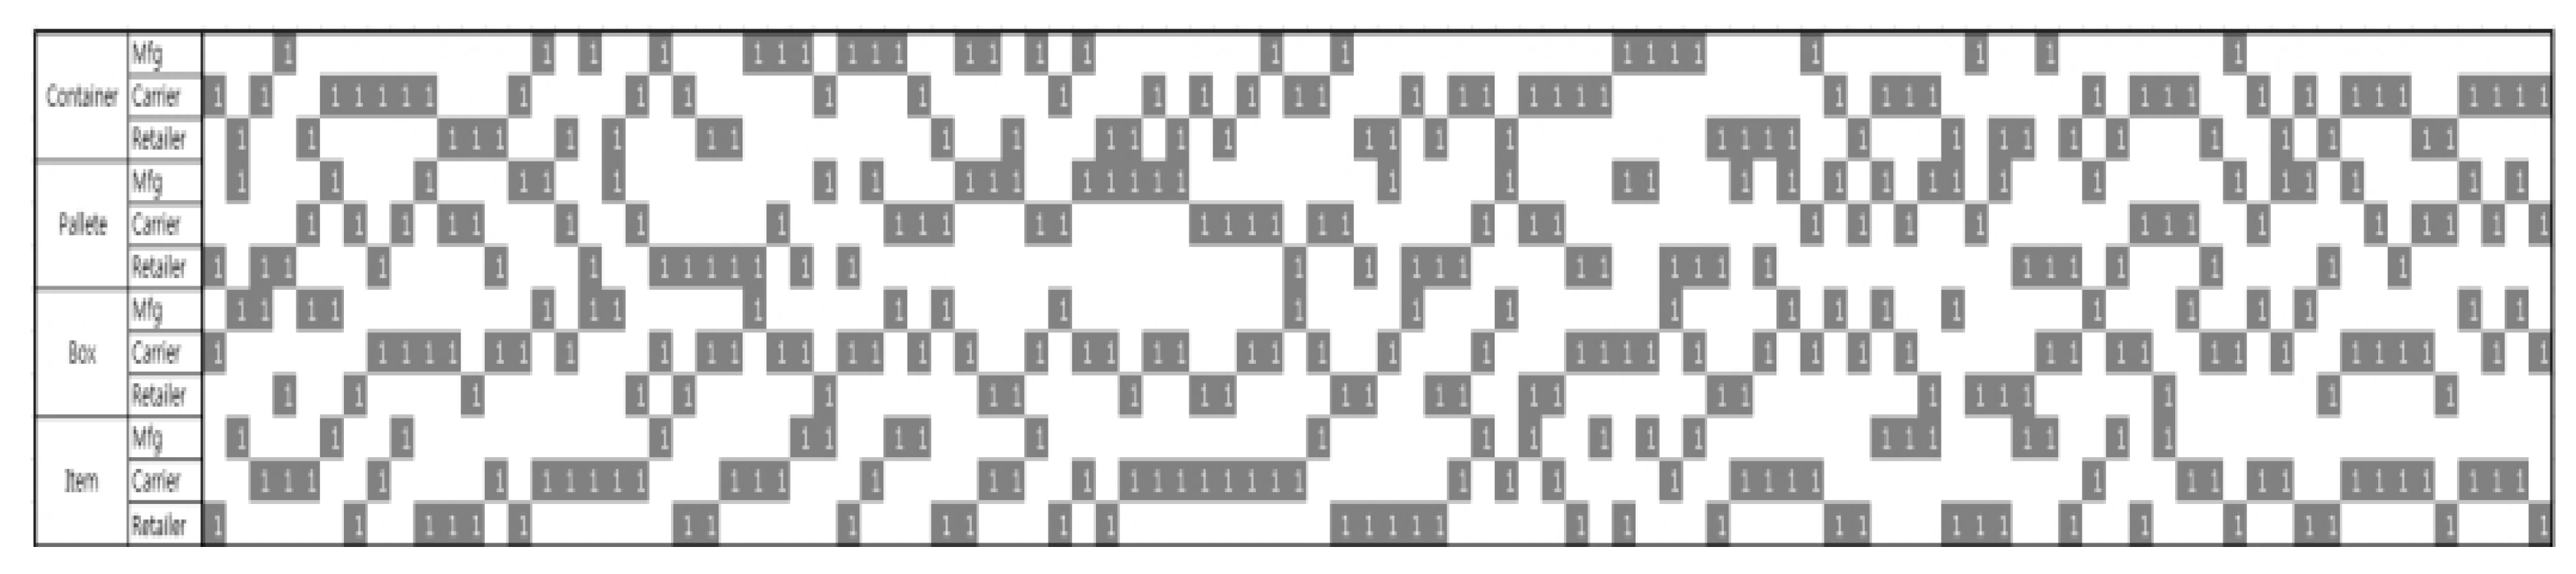
Figure 9.
Normalized fitness-function value considering the total B/C ratio.

Figure 10.
Optimal solutions considering total net benefit.
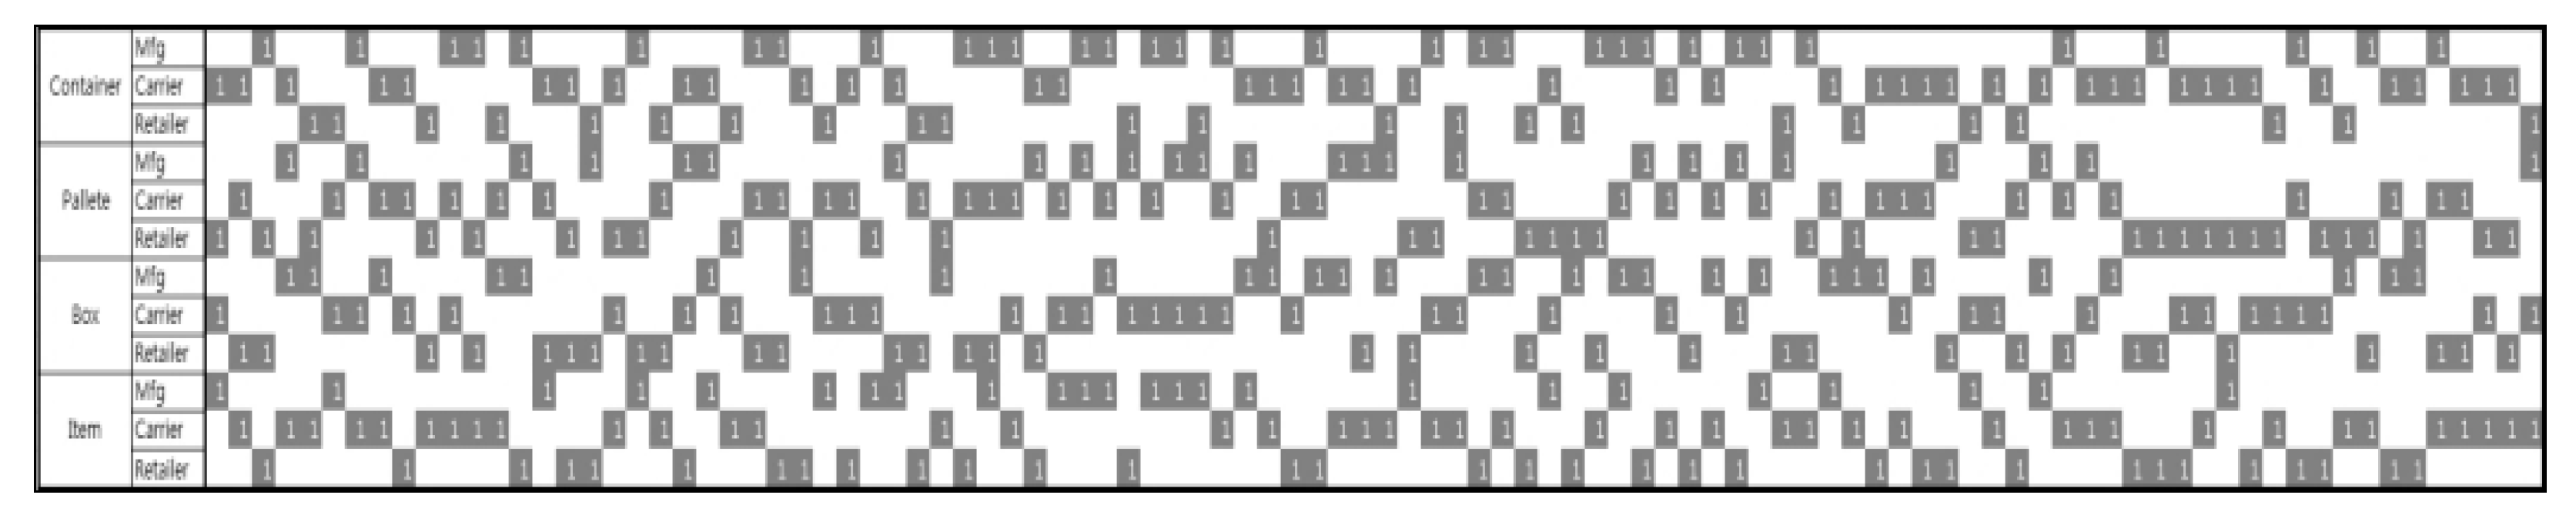
Figure 11.
Normalized fitness-function value considering total net benefit.

Figure 12.
Cumulative percentage of the decision arrays.

Table 1.
Comparing the contributions.
| Contribution | RFID System | SCVisibility | Sharing Cost | Sharing Profit | Optimization SC Visibility |
|---|---|---|---|---|---|
| Kang, Y [6] Kim, Y [8] Joung, S [11] Lee, S [12] | O | ||||
| Fan, T. [9] Teucke [10] | O | ||||
| Ustundag [7] | O | ||||
| Kim, J [13] Melski, A [14] Xu, N [15] | O | ||||
| This study | O | O | O | O | O |
Table 2.
Notations and short descriptions.
| Notations | Description |
|---|---|
| M | The set of visibility level, i ∈ M |
| N | The set of participants of the supply chain, j ∈ N |
| Xij | Decision variable which means the participant j install tags on the level i, Xij ∈ {0,1} |
| Kij | Binary variable which means the participant j may receive the benefit when tag is installed on visibility level i |
| CFij | Cost for operating and maintaining a RFID system |
| CTij | Cost for installing RFID tags |
| Cij | Total cost for installing and operating RFID systems |
| BSij | Benefit shared when participant j installs tags on level i |
| BTij | Benefit that only the participant j may have when installing RFID tags on level i |
| Bij | Total benefit that the participant j may have when installing RFID tags on level i |
| CSij | Cost when participant j installs RFID Tags on the visibility level i, which is shared by all participants |
| SVij | Sharing ratio of surplus benefit the participants j may receive surplus benefit from information sharing at the visibility level i. Σj VSij = 1. |
| fci | Characteristic function of participant i who installs RFID tag |
| VFij | The value of forward information flow |
| VBij | The value of backward information flow |
| BCOij | Net benefit of participant j which is adjusted by SVij |
Table 3.
Cost and benefit for attaching RFID tags.
| Level of Visibility | Manufacturer | Carrier | Buyer | |||
|---|---|---|---|---|---|---|
| Var. Cost | Benefit | Var. Cost | Benefit | Var. Cost | Benefit | |
| Container | 700 | 1875 | 500 | 3750 | 700 | 12,500 |
| Pallet | 336 | 5625 | 168 | 2500 | 336 | 25,000 |
| Box | 120 | 5625 | 181 | 2500 | 181 | 25,000 |
| Item | 2419 | 1875 | 3628 | 1250 | 2419 | 37,500 |
Table 4.
Parameter values for the genetic algorithms.
| Property Name | Value |
|---|---|
| Natural selector | Original rate: 0.9 |
| Crossover operator | Rate: 35% |
| Mutation operator | Desired rate: 12 |
| Stop condition | 200 executions |
| Population size | 200 |
Table 5.
Pseudo-code of proposed optimization using a genetic algorithm.
| Algorithm: Optimization supply chain visibility using a cooperative game |
| Input: Set-up cost, surplus benefit, Shapley values, evolution limit, parameters of GA |
| create randomized initial chromosomes in the population pool |
| Define fitness function for GA: Production of the B/C ratio for each participant |
| Repeat |
| 1) Get parental chromosomes in the population pool |
| 2) Crossover chromosomes |
| 3) Mutate chromosomes |
| 4) Evaluate fitness-function value |
| 5) Replace survivor chromosomes in the population pool |
| Until evolution limit |
| Get the optimized chromosomes by repeated evolution limit |
| Print: all parameters, fitness-function value, optimized chromosomes, |
| B/C ratio of all participants |
Table 6.
Optimal solutions for each fitness function.
| Level of Visibility | Net Profit of Whole Supply Chain | B/C Ratio of Whole Supply Chain | B/C Ratio Considering Cost Sharing | B/C Ratio Considering Benefit Sharing |
|---|---|---|---|---|
| Container | Manufacturer | Carrier | Manufacturer | Buyer |
| Pallet | Manufacturer | Carrier | Carrier | Carrier |
| Box | Manufacturer | Carrier | Manufacturer | Manufacturer |
| Item | Manufacturer | Manufacturer | Buyer | Manufacturer |
Table 7.
Parameter values for repeatedly simulated experiment.
| Manufacturer’s Shapley Value | Distributor’s Shapley Value | Retailer’s Shapley Value | Number of Repetitions |
|---|---|---|---|
| 2 | 2 | 5 | 10 |
| 2 | 2 | 4 | 10 |
| 2 | 2 | 3 | 10 |
| 2 | 2 | 2 | 10 |
| 2 | 2 | 1 | 10 |
| 2 | 1 | 5 | 10 |
| 2 | 1 | 4 | 10 |
| 2 | 1 | 3 | 10 |
| 2 | 1 | 2 | 10 |
| 2 | 1 | 1 | 10 |
© 2019 by the authors. Licensee MDPI, Basel, Switzerland. This article is an open access article distributed under the terms and conditions of the Creative Commons Attribution (CC BY) license (http://creativecommons.org/licenses/by/4.0/).
Share and Cite
MDPI and ACS Style
Kim, C.; Shin, K. Developing Fair Investment Plans to Enhance Supply Chain Visibility Using Cooperative Games. Sustainability 2019, 11, 3209. https://doi.org/10.3390/su11113209
AMA Style
Kim C, Shin K. Developing Fair Investment Plans to Enhance Supply Chain Visibility Using Cooperative Games. Sustainability. 2019; 11(11):3209. https://doi.org/10.3390/su11113209
Chicago/Turabian StyleKim, Changhyun, and KwangSup Shin. 2019. "Developing Fair Investment Plans to Enhance Supply Chain Visibility Using Cooperative Games" Sustainability 11, no. 11: 3209. https://doi.org/10.3390/su11113209
Note that from the first issue of 2016, this journal uses article numbers instead of page numbers. See further details here.