Green Infrastructure in the Urban Environment: A Systematic Quantitative Review


School of Design and the Build Environment, Curtin University, Perth, WA 6102, Australia
*
Author to whom correspondence should be addressed.
Sustainability 2019, 11(11), 3182; https://doi.org/10.3390/su11113182
Submission received: 19 April 2019
/
Revised: 3 June 2019
/
Accepted: 3 June 2019
/
Published: 6 June 2019
Abstract
:Increased levels of greenhouse gases released into the atmosphere, a legacy of the industrial revolution, population growth pressures, and consumerist lifestyle choices, are the main contributors to human-induced climate change. Climate change is commensurate of warming temperatures, reductions in rainfall, increased frequency of extreme weather events, and contributions toward declining public health trends. Green Infrastructure (GI) presents diverse opportunities to mediate adverse effects, while simultaneously delivering human health, well-being, environmental, economic, and social benefits to contemporary urban dwellers. To identify the current state of GI knowledge, a systematic quantitative literature review of peer-reviewed articles (n = 171) was undertaken using the Preferred Reporting Items for Systematic Reviews and Meta-Analysis (PRISMA) method. Temporal publication trends, geographical and geological information of research efforts, as well as research focus areas were recorded and reported against each article. The findings of this review confirm the research area to be in a state of development in most parts of the world, with the vast majority of the research emerging from the United States, Australia, and the United Kingdom. Cooler climates produced the majority of research, which were found largely to be of a traditional research article format. The GI research area is firmly dominated by foci comprising planning and policy, environmental and ecological, and social content, although modest attempts have also appeared in health and wellbeing, economic, and quality/performance of green infrastructure areas. Knowledge gaps identified by this review as requiring attention for research growth were identified as: (i) the ambiguity of terminology and the limited broad understanding of GI, and (ii) the absence of research produced in the continents of Asia and South America, as well as in regions with warmer climates, which are arguably equally valuable research locations as cooler climate bands.
1. Introduction
The Industrial Revolution, occurring circa 1760–1820, marked a change in human life as it was formerly known. Human civilization transitioned from predominantly farming- and agriculture-based lifestyles to warehouse- and manufacturing-based lifestyles. The resultant environmental consequences were significant, and have driven the need for intervention and careful consideration.
Greenhouse gases, occurring naturally in certain concentrations, include carbon dioxide, methane, nitrous oxide and ozone. A steady balance of greenhouse gases assists in the regulation of temperature on earth; however, an imbalance can result in detrimental outcomes [1]. Coal, being the main source of energy of large factories between 1760–1820, emitted large volumes of toxins and pollutants (namely carbon dioxide) into the atmosphere. Today, coal is still a leading global energy source, making up around 27% of the global energy source share [1]. In 2014, it was estimated that nearly 10,000 million metric tons of carbon dioxide were released into the atmosphere as a result of fossil fuel burning [2,3], an amount far surpassing the safe operating space of carbon dioxide emissions into the atmosphere.
By 1960, approximately 200 million vehicles were in use, a number which is rapidly increasing, alongside the resultant carbon dioxide emissions. In 2015, it was estimated that 1.2 billion vehicles were in use based on data collected on number of vehicle registrations [4,5,6]. While emission volumes have been reduced by technological advances, vehicle pollution rates are still a significant contributor to the global total volume of carbon dioxide produced and released into the atmosphere. Trends of vehicle ownership appear to indicate a continued upward trend.
Factors including the conclusion of World War II, public health and medicine advancements, increased life expectancy, and reductions in child mortality rates, saw exponential population growth from the mid-20th century. In 1960, the world’s population sat comfortably at around three billion. Today, it exceeds 7.63 billion [7]. Although by a varying amount based on geographical location and other lifestyle factors, an increase in population imposes a negative impact on many environmental health markers [8]. A higher population requires a larger volume of resources, and often the clearing of land, both of which contribute to the increasing presence of carbon dioxide in the atmosphere, both by way of emissions, and by the reduced ability for carbon sequestration and air purification made possible by trees and vegetation [8,9].
Prior to 1960, global effort toward environmental protection and environmental stewardship appeared to be largely overshadowed by rapid growth and development, which was seen to provide tangible opportunities and improvements to modern life [10]. Edging towards a tipping point, this slowly begun to change. The period between the 1960s and 1970s was known as the ‘Environmental Revolution’ [11]. The environmental revolution saw a flurry of activity which was mainly focused on new policy and environmental protection measures [12,13]. In the United States, significant regulation and policy began to emerge, comprising the National Environmental Policy Act 1970, the Clean Air Act 1970, significant amendments to the Federal Water Pollution Control Act in 1972, and the introduction of the Endangered Species Act 1973. [14]. Australia closely following suit during the 1970s and 1980s, with significant policy progression as well as on-ground ensuing progressive action. Pressure increased on Australian government departments to increase measures of environmental protection, continuing well into the 1990s, with Prime Minister Bob Hawke declaring the 1990s the ‘Decade of Landcare’. Results during this time were capricious.
Best Management Practices (BMP) and Green Infrastructure (GI) began emerging simultaneously as concepts, and were somewhat interchange in the 1980s [15]. Laying somewhat dormant, widespread use and acceptance only begun materializing around the year 2012. Since this time, interest has increased among academics, transecting multiple disciplines. Naumann et al. [15] articulate GI as being human made (or human influenced) infrastructure that is designed and installed with the purpose of easing environmental pressures, such as flooding and extreme temperature fluctuations. GI, as a concept, is broad ranging and flexible in nature, and comprises assets such as networks of public open space, urban tree canopies, wetlands (natural or constructed), biofiltration systems, green walls, and green roofs [16,17,18]. Naumann et al. [15] and Tzoulas et al. [19] emphasize that the key component delineating GI from other types of infrastructure (i.e., blue or grey) is the simultaneous and harmonious delivery of both human and ecological services.
Greenhouse gases are essential for sustaining life on earth. Greenhouse gases, in certain proportions in the atmosphere, allow the planet to sustain and maintain livable temperatures [20]. With higher proportions of greenhouse gases being produced and released into the atmosphere, a general warming of the climate, among other changes, is being experienced [20]. Changes to the climate have resulted in the increased frequency of localized flooding events in some locations due to the intensity and unseasonable timing of rainfall. As changes to the climate and seasons have occurred rapidly, traditional infrastructure may be lacking and/or easily stressed during rainfall events. Changes in climate have also seen an increase in heat-related hospitalizations, particularly across older and vulnerable populations. With the harsh interface of modern city designs, urban centers can experience significant localized temperature increases. This phenomenon is known as the ‘Heat Island Effect’. This effect can cause artificial temperature increases based on reflective and embodied heat of between 2 and 6 degrees Celsius in some Australian cities [9]. With predictions that Australia may experience general net temperature increases of around 4 degrees Celsius by the year 2090, the combined effects are disconcerting [9]. Patient hospital care for heat-related illnesses is a costly by-product of a warming climate and the increased frequency of extreme weather events, as well as the social impact that diminished public health can result in.
In addition to changes in local temperatures and seasonal patterns, previously unprecedented environmental effects are becoming apparent. At never before seen rates, global warming is accelerating global sea level rises through large volumes of ice melt as well as thermal expansion of ocean waters, resulting in net higher water temperatures [10]. This effect is increasing in pace due to a negative feedback loop; as more ice melts the local temperature increases, thereby accelerating the rate of ice melt. Based on current predictions and trending data, expectations show sea level rises to be in the vicinity of 4mm annually [10]. Within a short few years, this may result in costly and devastating infrastructure and natural resource loss, along with large costs for mitigation/rectification efforts.
Wide Scale Benefits of GI
Green infrastructure has been proven to deliver an array of health and wellbeing, environmental, economic, and social benefits. These benefits provide service in many ways which include climate adaptation, urban resilience, and sustainable urban development. A summary of the benefits within each remit is provided within Table 1, Table 2, Table 3 and Table 4 below.
Green infrastructure is proving suitable in the plight against emerging and existing challenges ranging from localized flooding, urban heat island effect, and extreme weather events such as rain surges and heat waves. The increased utilization of GI within urban centers (UC) has been noted by recent researchers in the field as providing opportunities for supporting UC life, as well as facilitating and supporting positive sustainable urban growth. The ways in which GI can achieve this are varied, but include providing shade to hard surfaces reducing reflective and embedded heat, by slowing down rainfall and water surges through vegetation installations, by increased permeable surfaces or ‘spongey’ surfaces which may be considered as parks, green roofs, and green walls, and providing spaces of refuge for people and animals in spaces that can be harsh and unforgiving. GI, being a malleable categorization of infrastructure, can be assessed and utilized on a best-fit basis which may not be as easily accommodated by other solution bases.
In addition to the opportunities of GI in climate adaptation, it can also serve to increase urban resilience. This is made possible because many GI examples and installations increase biodiversity through species pallet selection, increase habitat opportunities in support of fauna, improve social and human health outcomes which contribute to a more cohesive social base, and provide opportunities for environmental and social research, all leading to more resilient UC’s in support of sustainable and resilient urban development.
There is significant value in undertaking a systematic quantitative literature review to succinctly identify the current state of GI knowledge, and, equally as important, to identify the gaps in GI knowledge and application to better direct future GI research.
2. Materials and Methods
2.1. Systematic Quantitative Literature Review
This systematic quantitative literature review follows the approach of a growing number of authors (Pickering and Byrne [46], Parker and Simpson [22]; Parker [23]) and the Preferred Reporting Items for Systematic Reviews and Meta-Analysis (PRISMA) guidelines [46]. Supplementary information pertaining to this approach can be accessed via http://prisma-statement.org/).
An exhaustive literature search was undertaken in late December 2018, utilizing over 10,000 databases to identify peer-reviewed articles with the sole and explicit term ‘Green Infrastructure’ found within the title with no restriction on publication year applied.
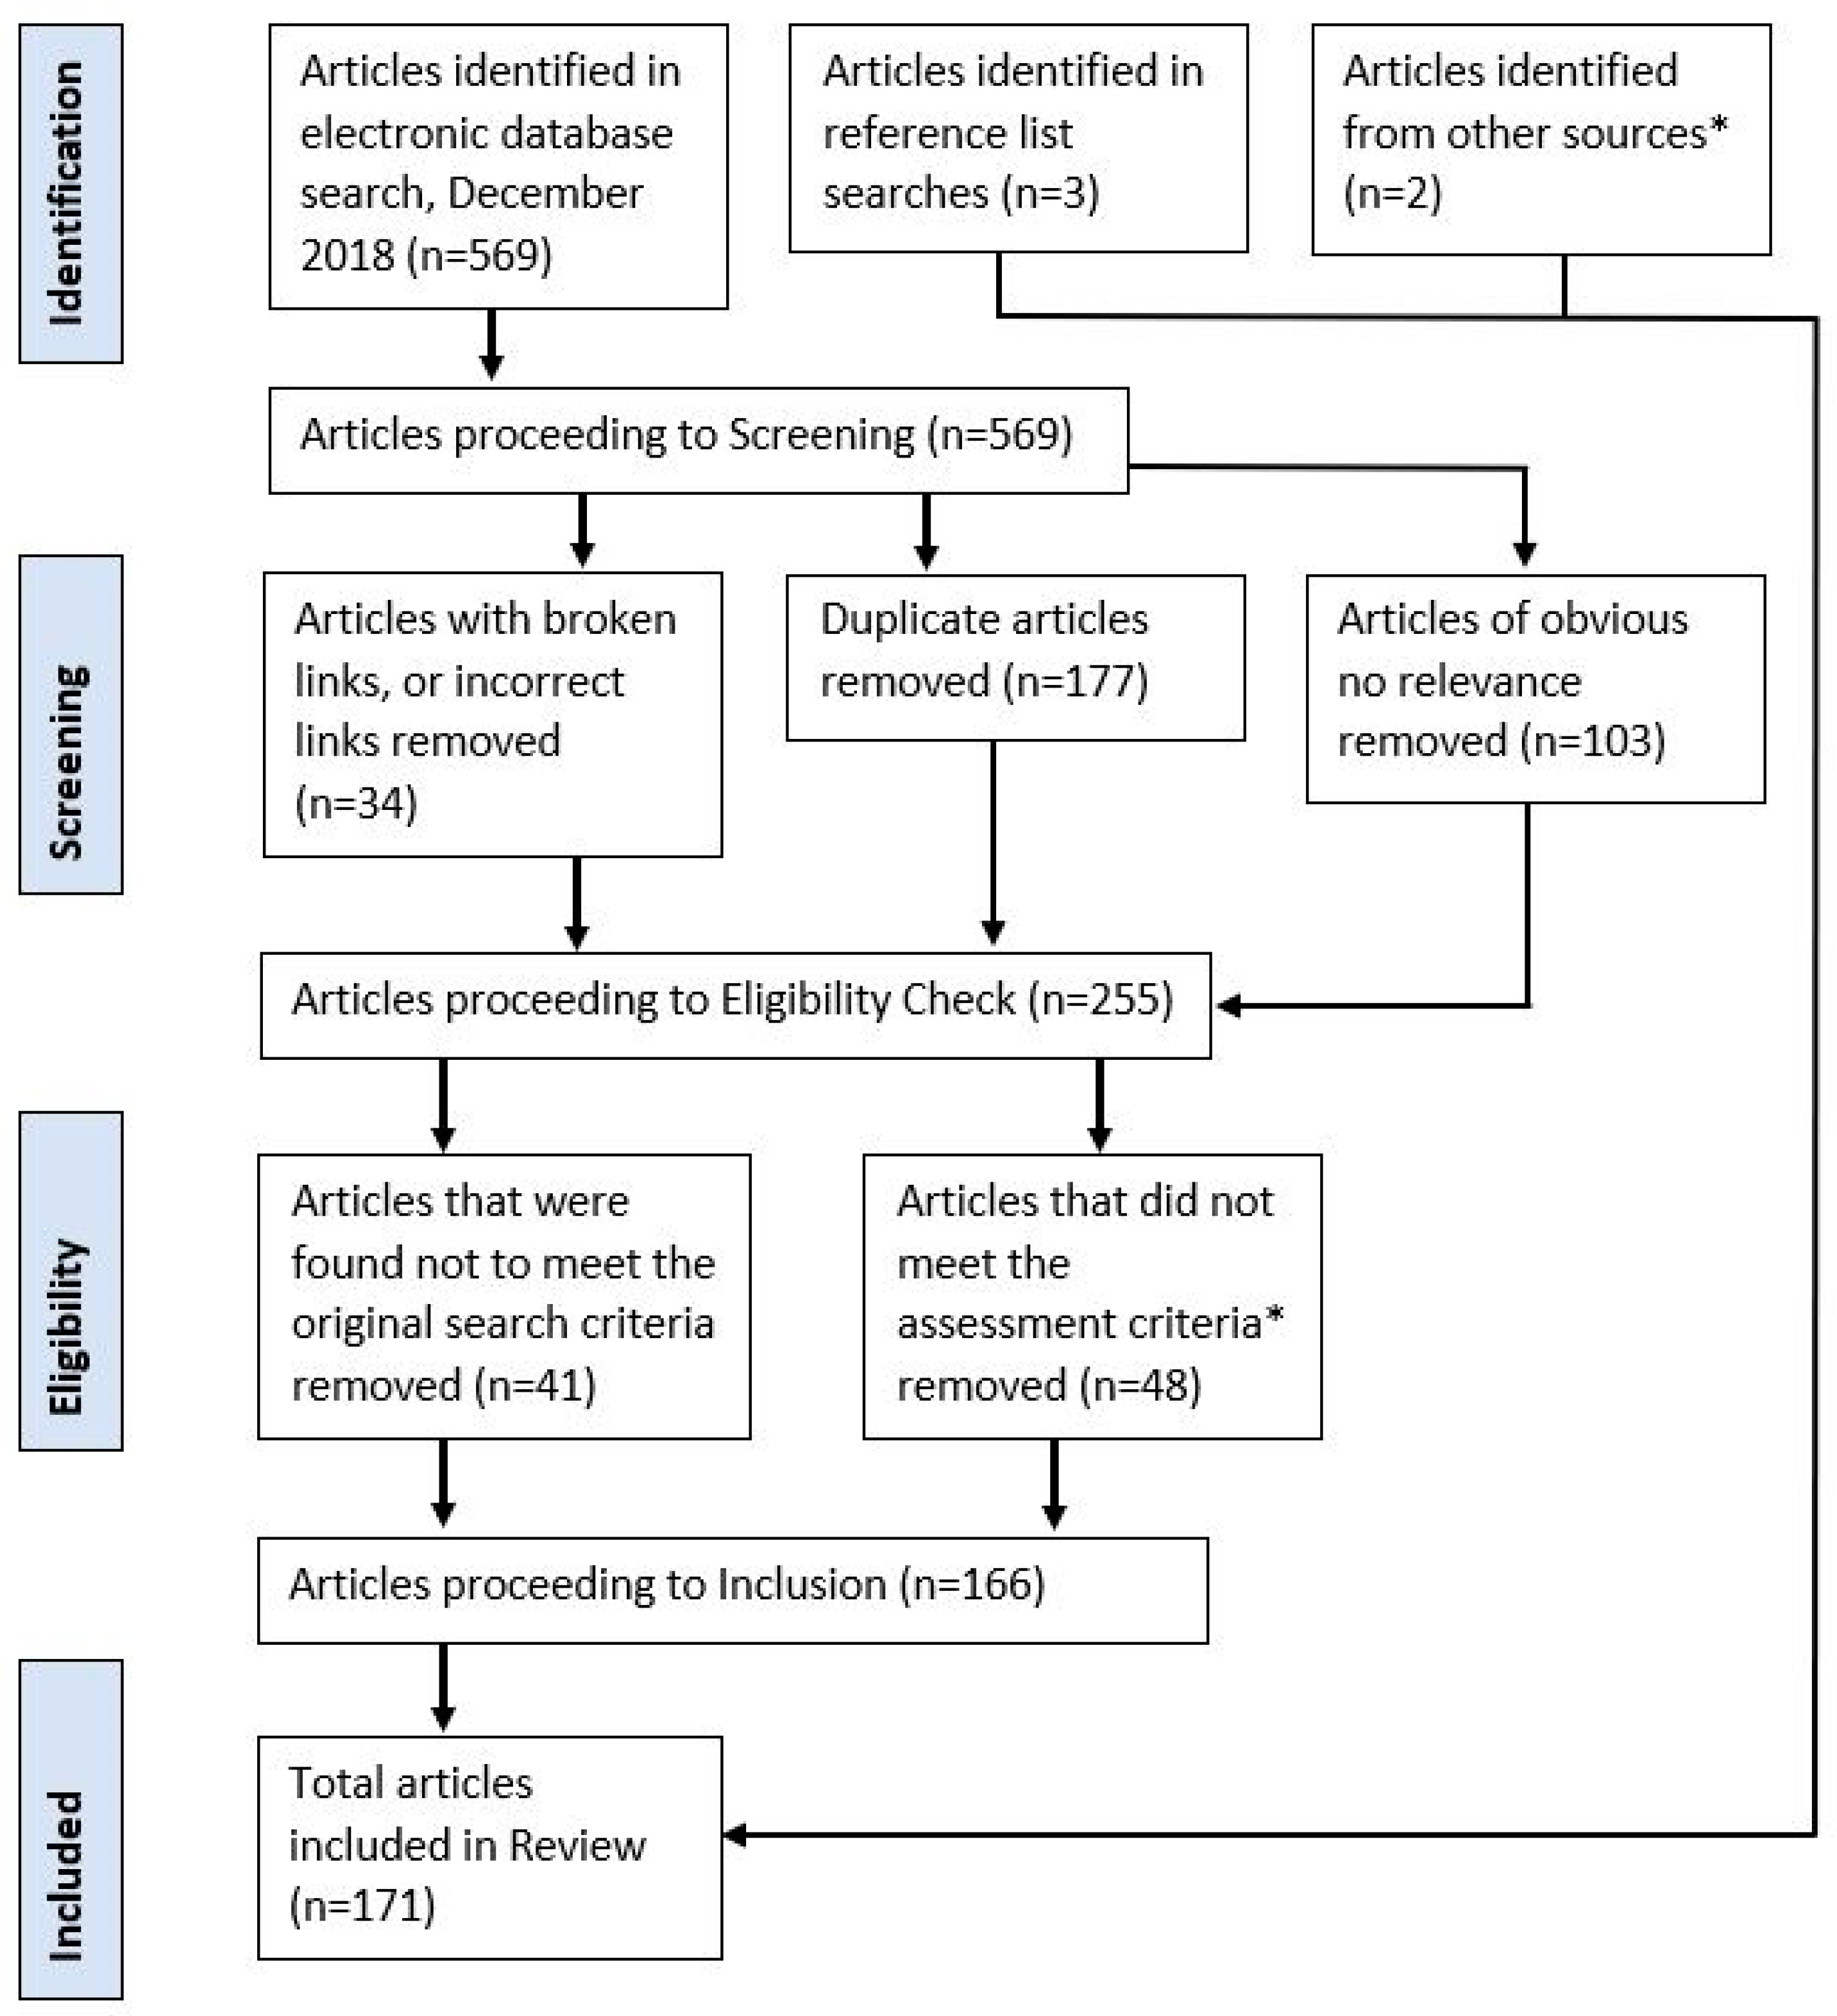
By following the PRISMA method, a total of 171 articles were deemed suitable for inclusion in this review. The PRISMA expression is included here as Figure 1, adding detail to the inclusion and exclusion process.
Information pertaining to the articles was recorded under all applicable categories in which they were deemed relevant, and expanded upon in Section 2.2 Meta-Data.
2.2. Meta-Data
The meta-data, collected from the 171 peer-reviewed articles through the review and transcribed into Microsoft Excel, is provided below. The meta-data collected was separated into four data set areas; article descriptors (Table 5), geographical data (Table 6), paper type (Table 7), and focus areas (Table 8). Abstracts were entered and assessed separately. A tabulated list of the data markers, data collection techniques, and a description of the intention is included in Table 5, Table 6, Table 7 and Table 8.
The article descriptors (Table 5) are fairly straight forward; they extracted information from the individual articles, then directly transposed it into the Microsoft Excel workbook.
The geographical data (Table 6) was dependent on the information which had been made available by the article authors. Where the information was not applicable or was not specified, this was indicated using the code NA = Not Applicable and NS = Not Specified. With respect to the geographical data, countries and cities were entered as text, when available, which allowed for clustering analysis. Climate banding information was undertaken utilizing the Köppen climate classification model [47]. Again, if the information was not present to confirm a climate band, this was indicated using the code NA = Not Applicable and NS = Not Specified.
The article type (Table 7) was categorized into four main categories; review articles, research articles, technical articles and/or case studies. Articles that crossed multiple categories were recorded as such.
Focus areas (Table 8) identified among the articles were recorded across 10 possible categories; health and wellbeing, environmental and ecological, climate, stormwater and drainage, planning and policy, public open space, economic, social, quality and performance of green infrastructure, and other. Articles that crossed multiple focus areas were recorded as such.
Abstracts were recorded for each of the articles and used for further analysis; however, they are not reproduced within this Review Paper due to copyright restrictions.
As a quality assessment undertaking, the 2017/2018 journal impact factor was recorded, some of which is reported on within this review.
2.3. Data Analyses
Several techniques were employed within this review when analyzing the data collected from the articles; these included visual, graphical, and numerical techniques. Figures reporting data points on proportions also include the associated 95% confidence error bars to assist in interpreting the variance of results. As all sample sizes exceed the minimum threshold of 10, meaning that if the error bars of the 95% confidence interval ranges did not overlap, or were seen to overlap by less than half of the total error bar, this was used as evidence that there was a statistically significant difference between these data points. As a secondary measure, a Chi-Squared test (χ2) was employed to test the goodness of fit for all proportion data sets. As a final measure, Pearson’s Coefficient of Correlation was used to analyze all binary data. The significance of all correlations was then checked using the t-Test.
R, the statistical computing and analysis program, was used to generate Heat Maps to visually display the geographical spread of research production. Finally, NVivo, a qualitative data analysis computer software package was used to generate a Word Cloud image showing the prominence of words appearing in the abstracts of the articles within this review.
3. Results
3.1. Research Effort
As outlined in the Methods section, an electronic literature search was undertaken in December 2018. After the screening and eligibility checking phases were completed, 171 articles were deemed to have met the criteria, and therefore, were included in this review. The articles analyzed revealed the emergence of several trends, inciting further interrogation.
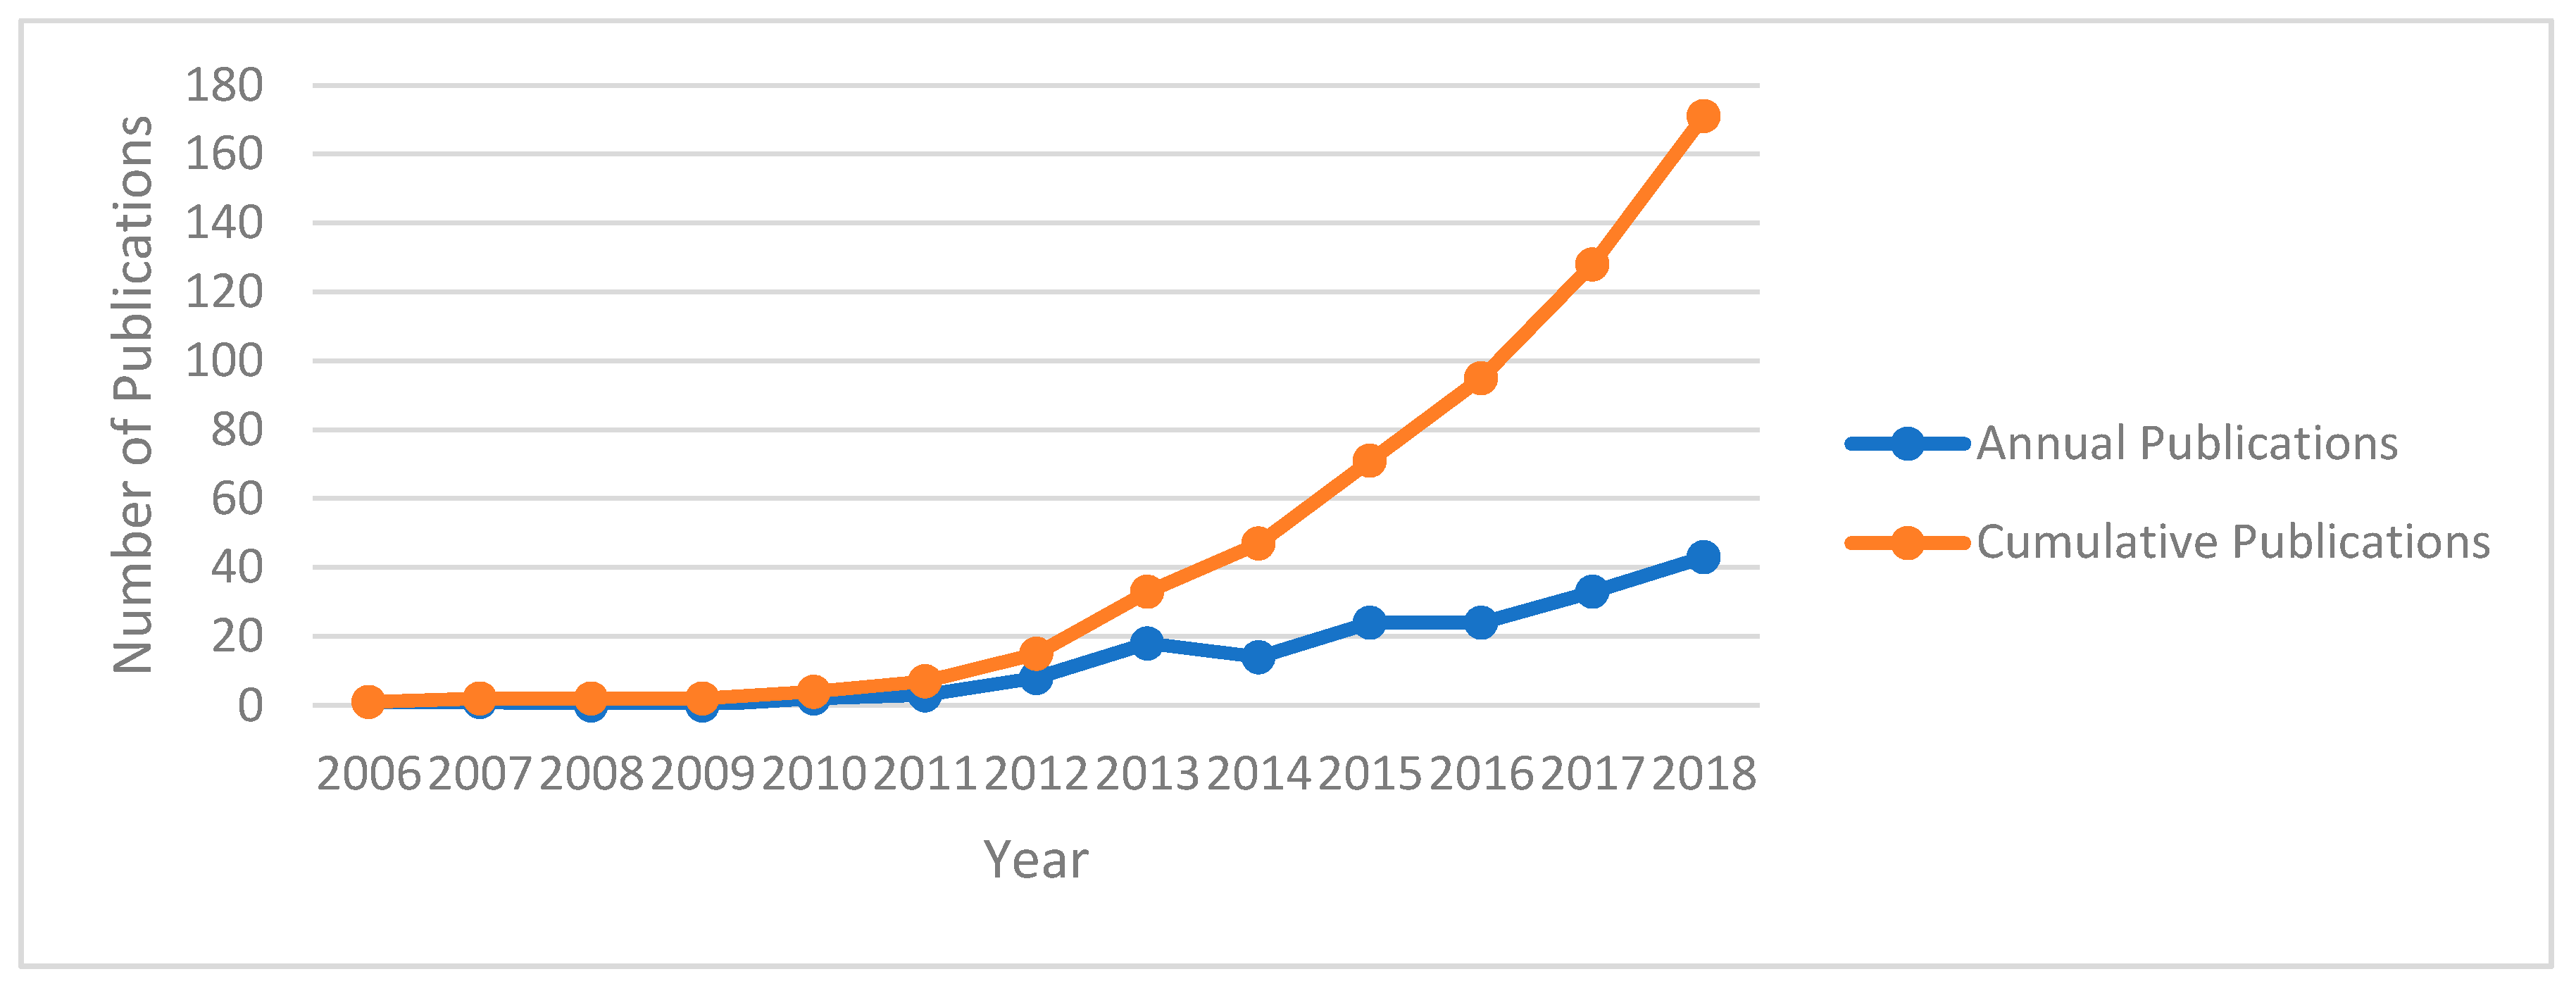
The temporal research effort and changes in publication rates of articles featuring the term ‘Green Infrastructure’ are worthy of comment. The search methodology did not impose a restriction on publication year, with the first article appearing in 2006. Between 2006 and 2012, the rate of annual publications was modest, with no year exceeding eight. In 2013, the rate of annual publications began to increase, and tended to continue doing so (with the exception of 2014). Within the last three years, more articles have been published with Green Infrastructure in the title than all previous publications discoverable through the electronic database literature search. This does not take into account a portion of newly-published articles within the later part of 2018, as they would not yet be discoverable via an electronic database search. Both the annual publications by year, as well as the cumulative total of publications, are shown below in Figure 2.
The 171 articles included in the review at the completion of the screening and eligibility checking phases came from 84 different journals. The five most common Journals made up 27.5% (n = 47): Science of the Total Environment (n = 6), Journal of Environmental Management (n = 10), Sustainability (n = 10), and Urban Forestry and Urban Greening (n = 11).
3.2. Geographical Distribution of Research
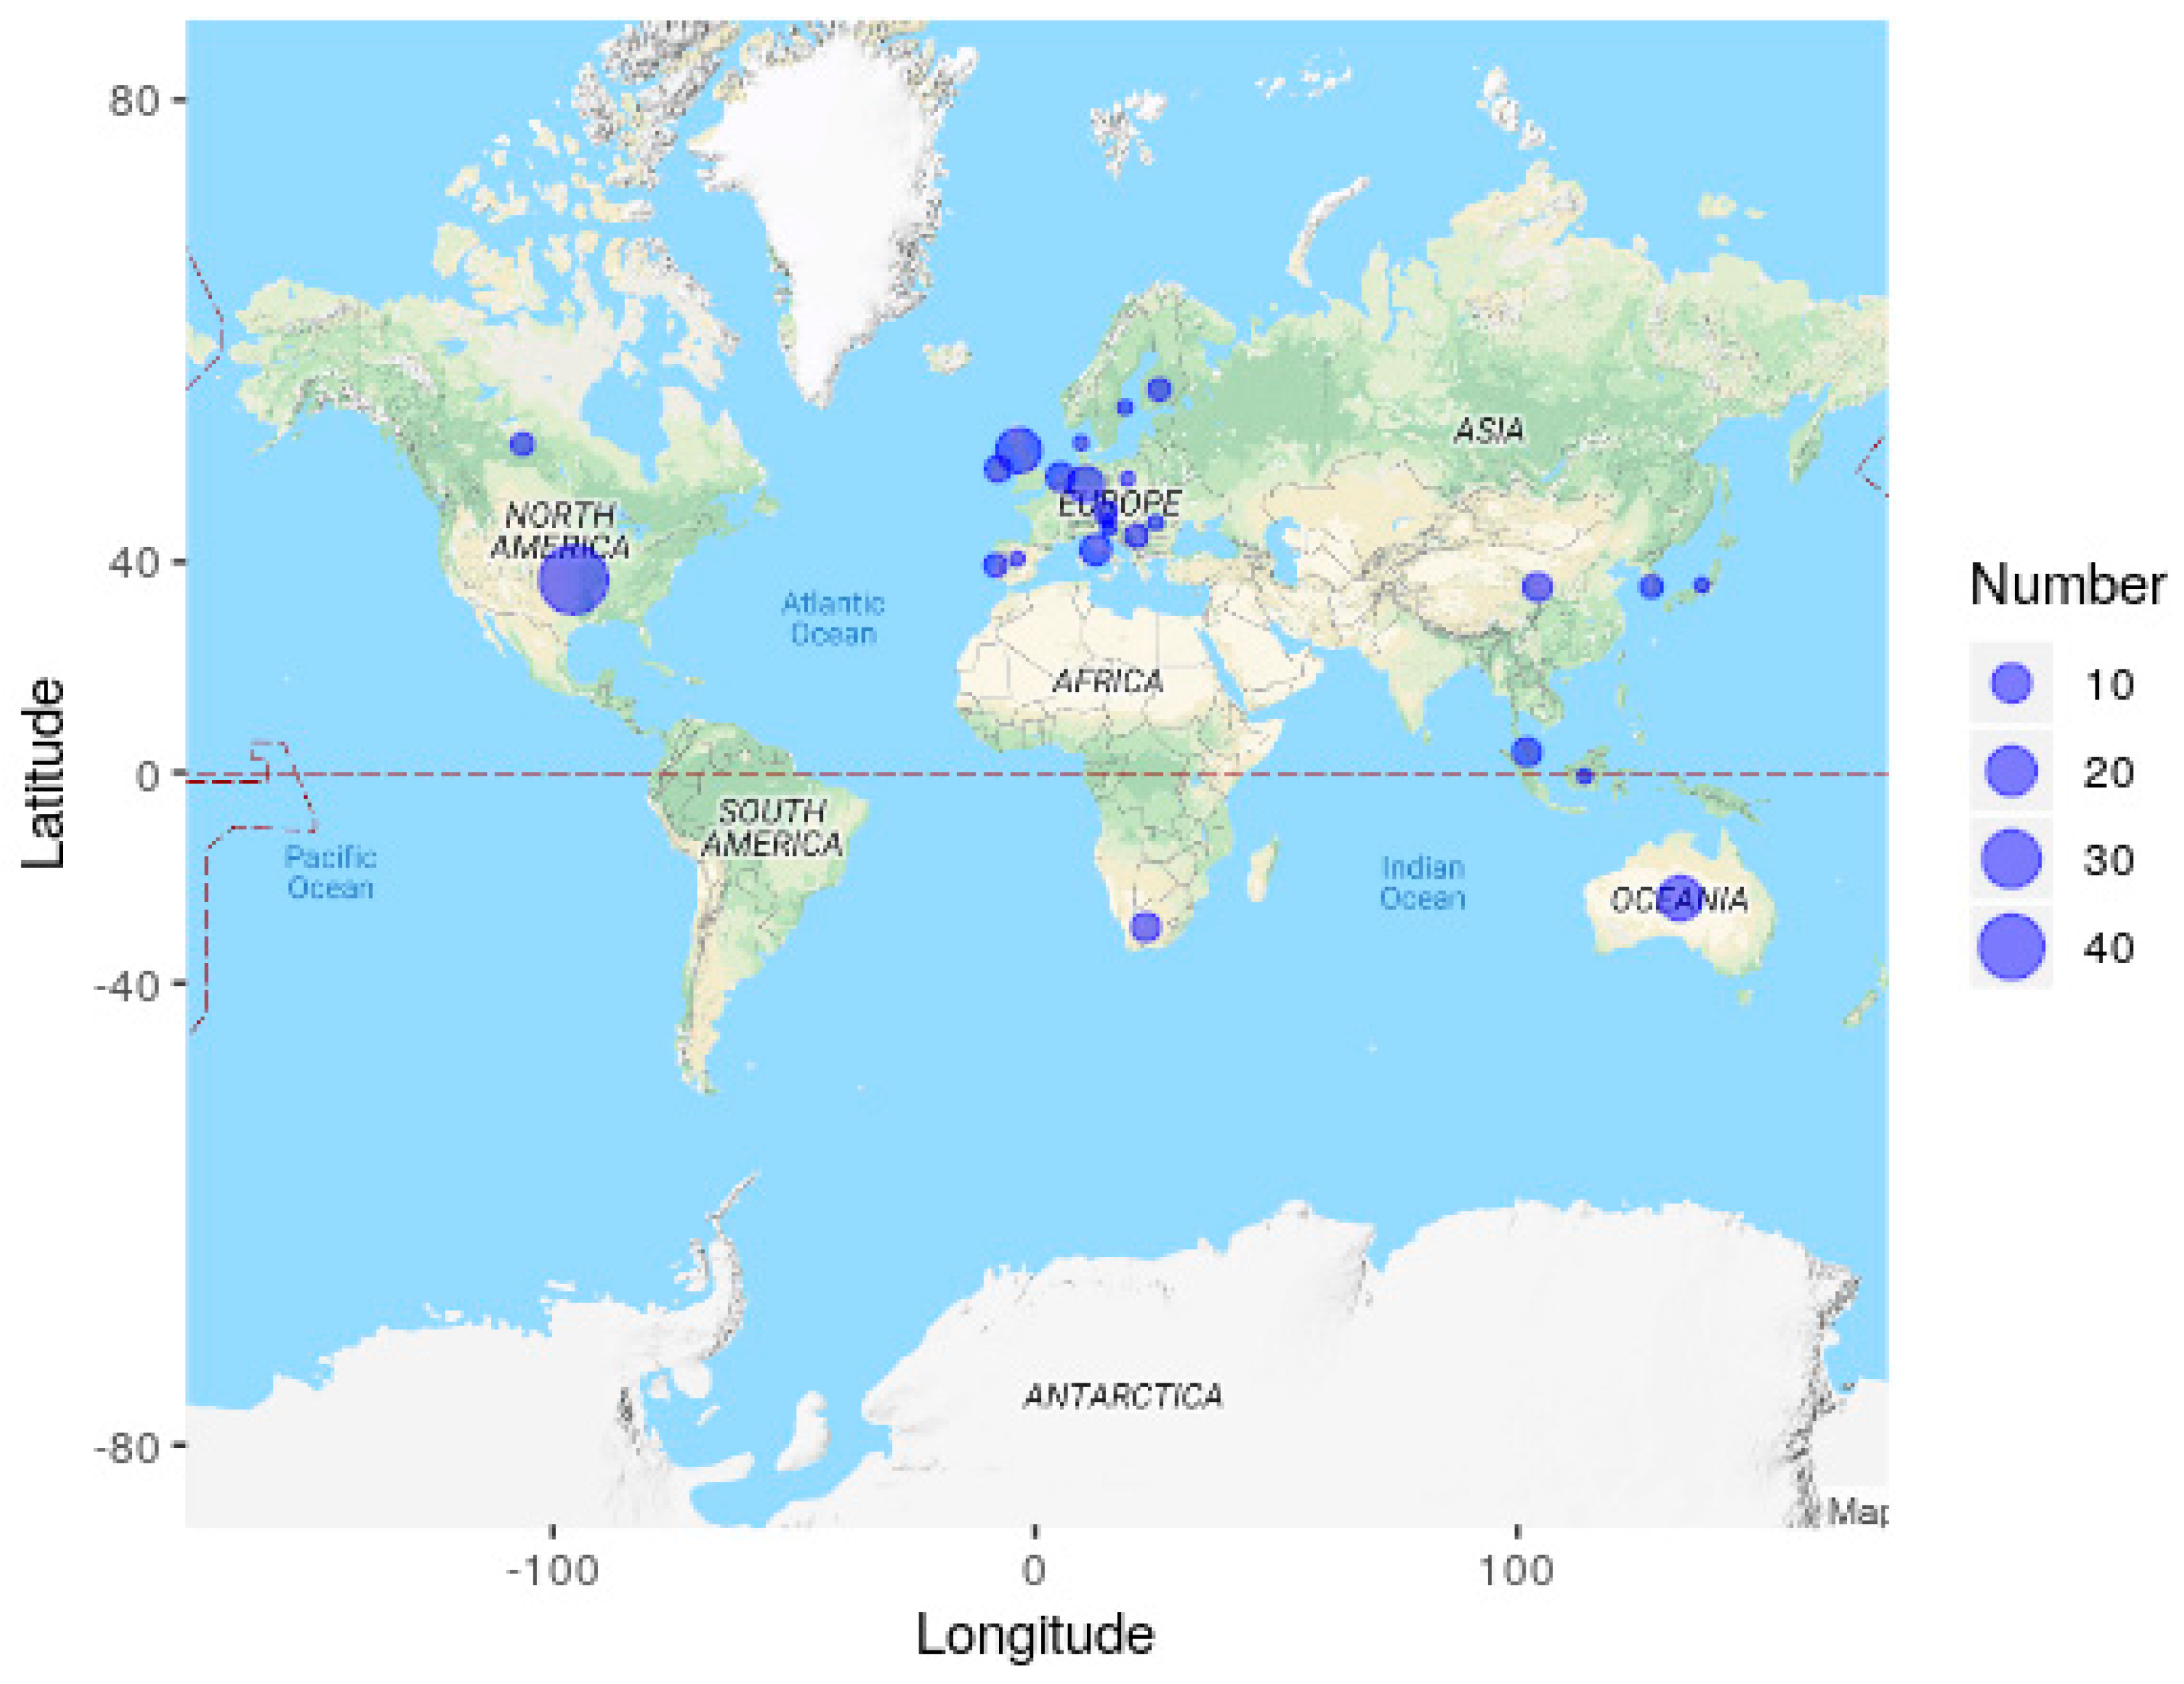
The country, region, and city were recorded for each peer-reviewed article where the information was made available in the article meta-data or within the article itself (n = 130). The United States strongly dominated research efforts, with a total of 46 (35.4%) publications. Australia and the United Kingdom followed with 15 (11.5%) publications each. A number of articles (n = 32) were produced by authors from two or more countries, and a further nine articles did not disclose a publishing location; as such, these articles are not included in Figure 3.
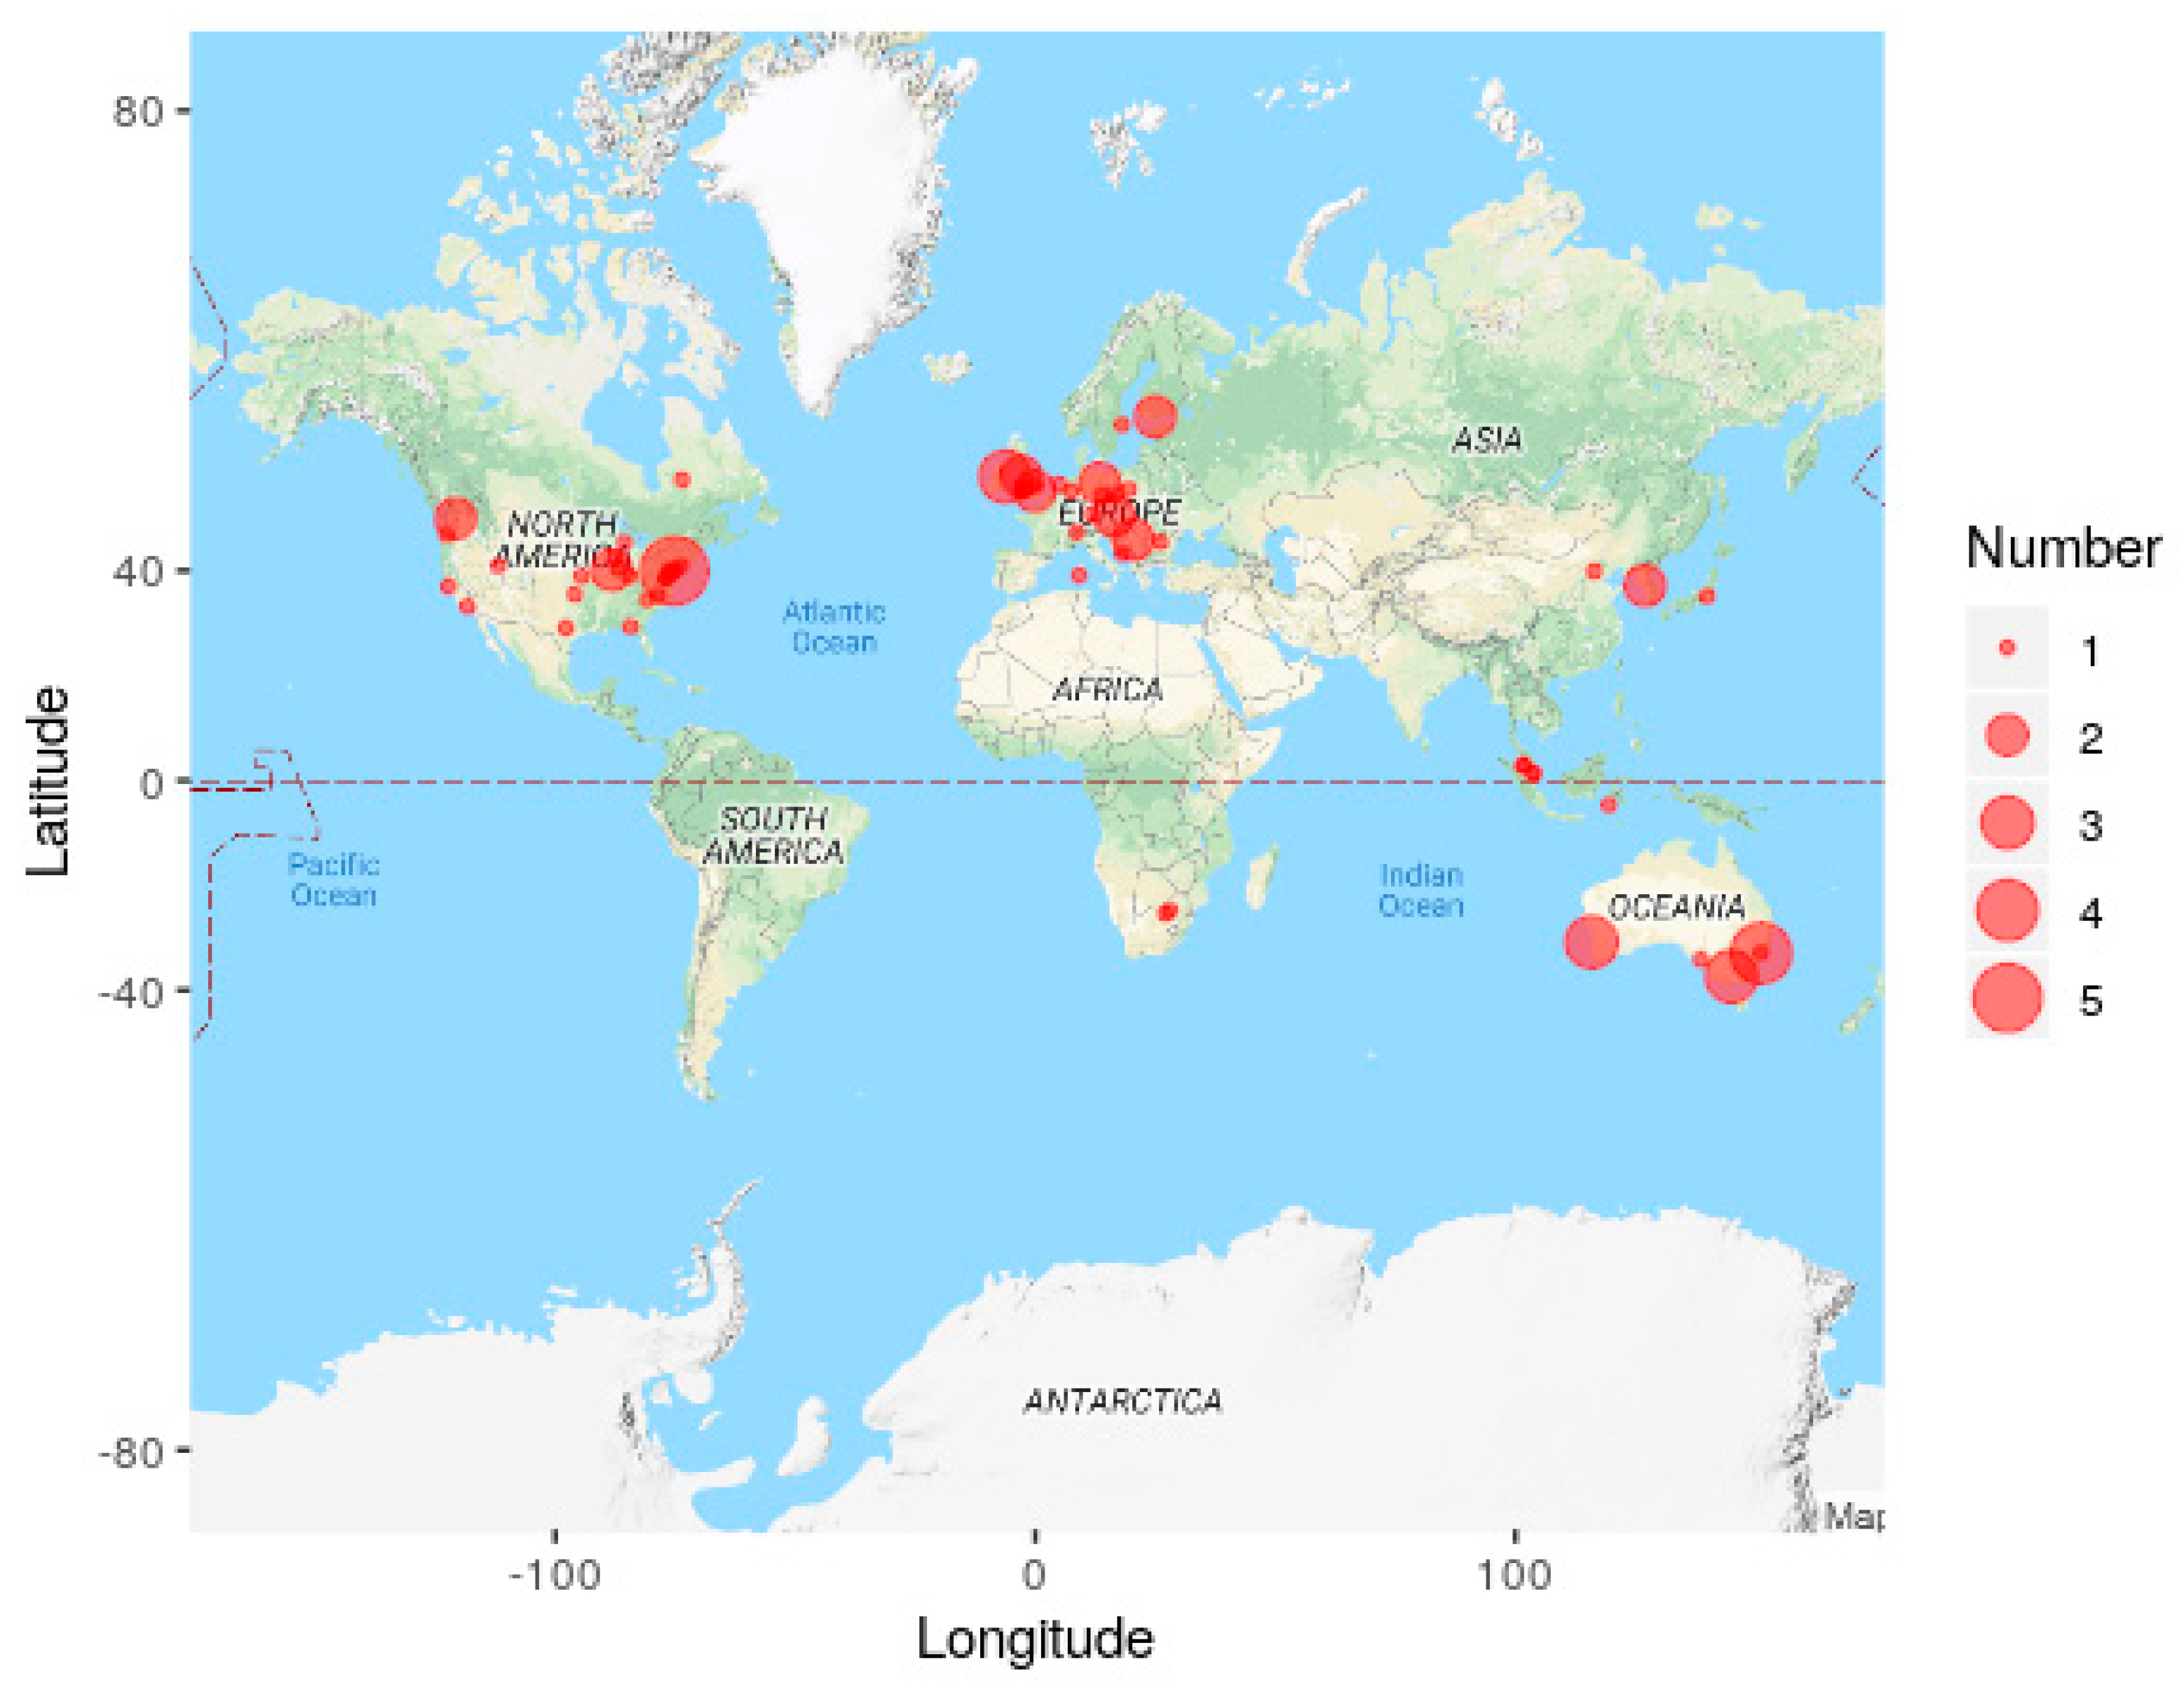
With respect to cities in which articles were published, the distribution was widely spread. Philadelphia, US, was the city with the highest publication rate of five (6.0%), followed by Sydney, Australia, with four (4.8%), and Perth, Australia, Melbourne, Australia, and Dublin, Ireland, each with three (3.6%). Figure 4 indicates the spread of publications; articles with authors from two or more countries, or those who did not disclose a publication city were not included, leaving a total of 83 articles.
3.3. Climate Zone of Publication Location
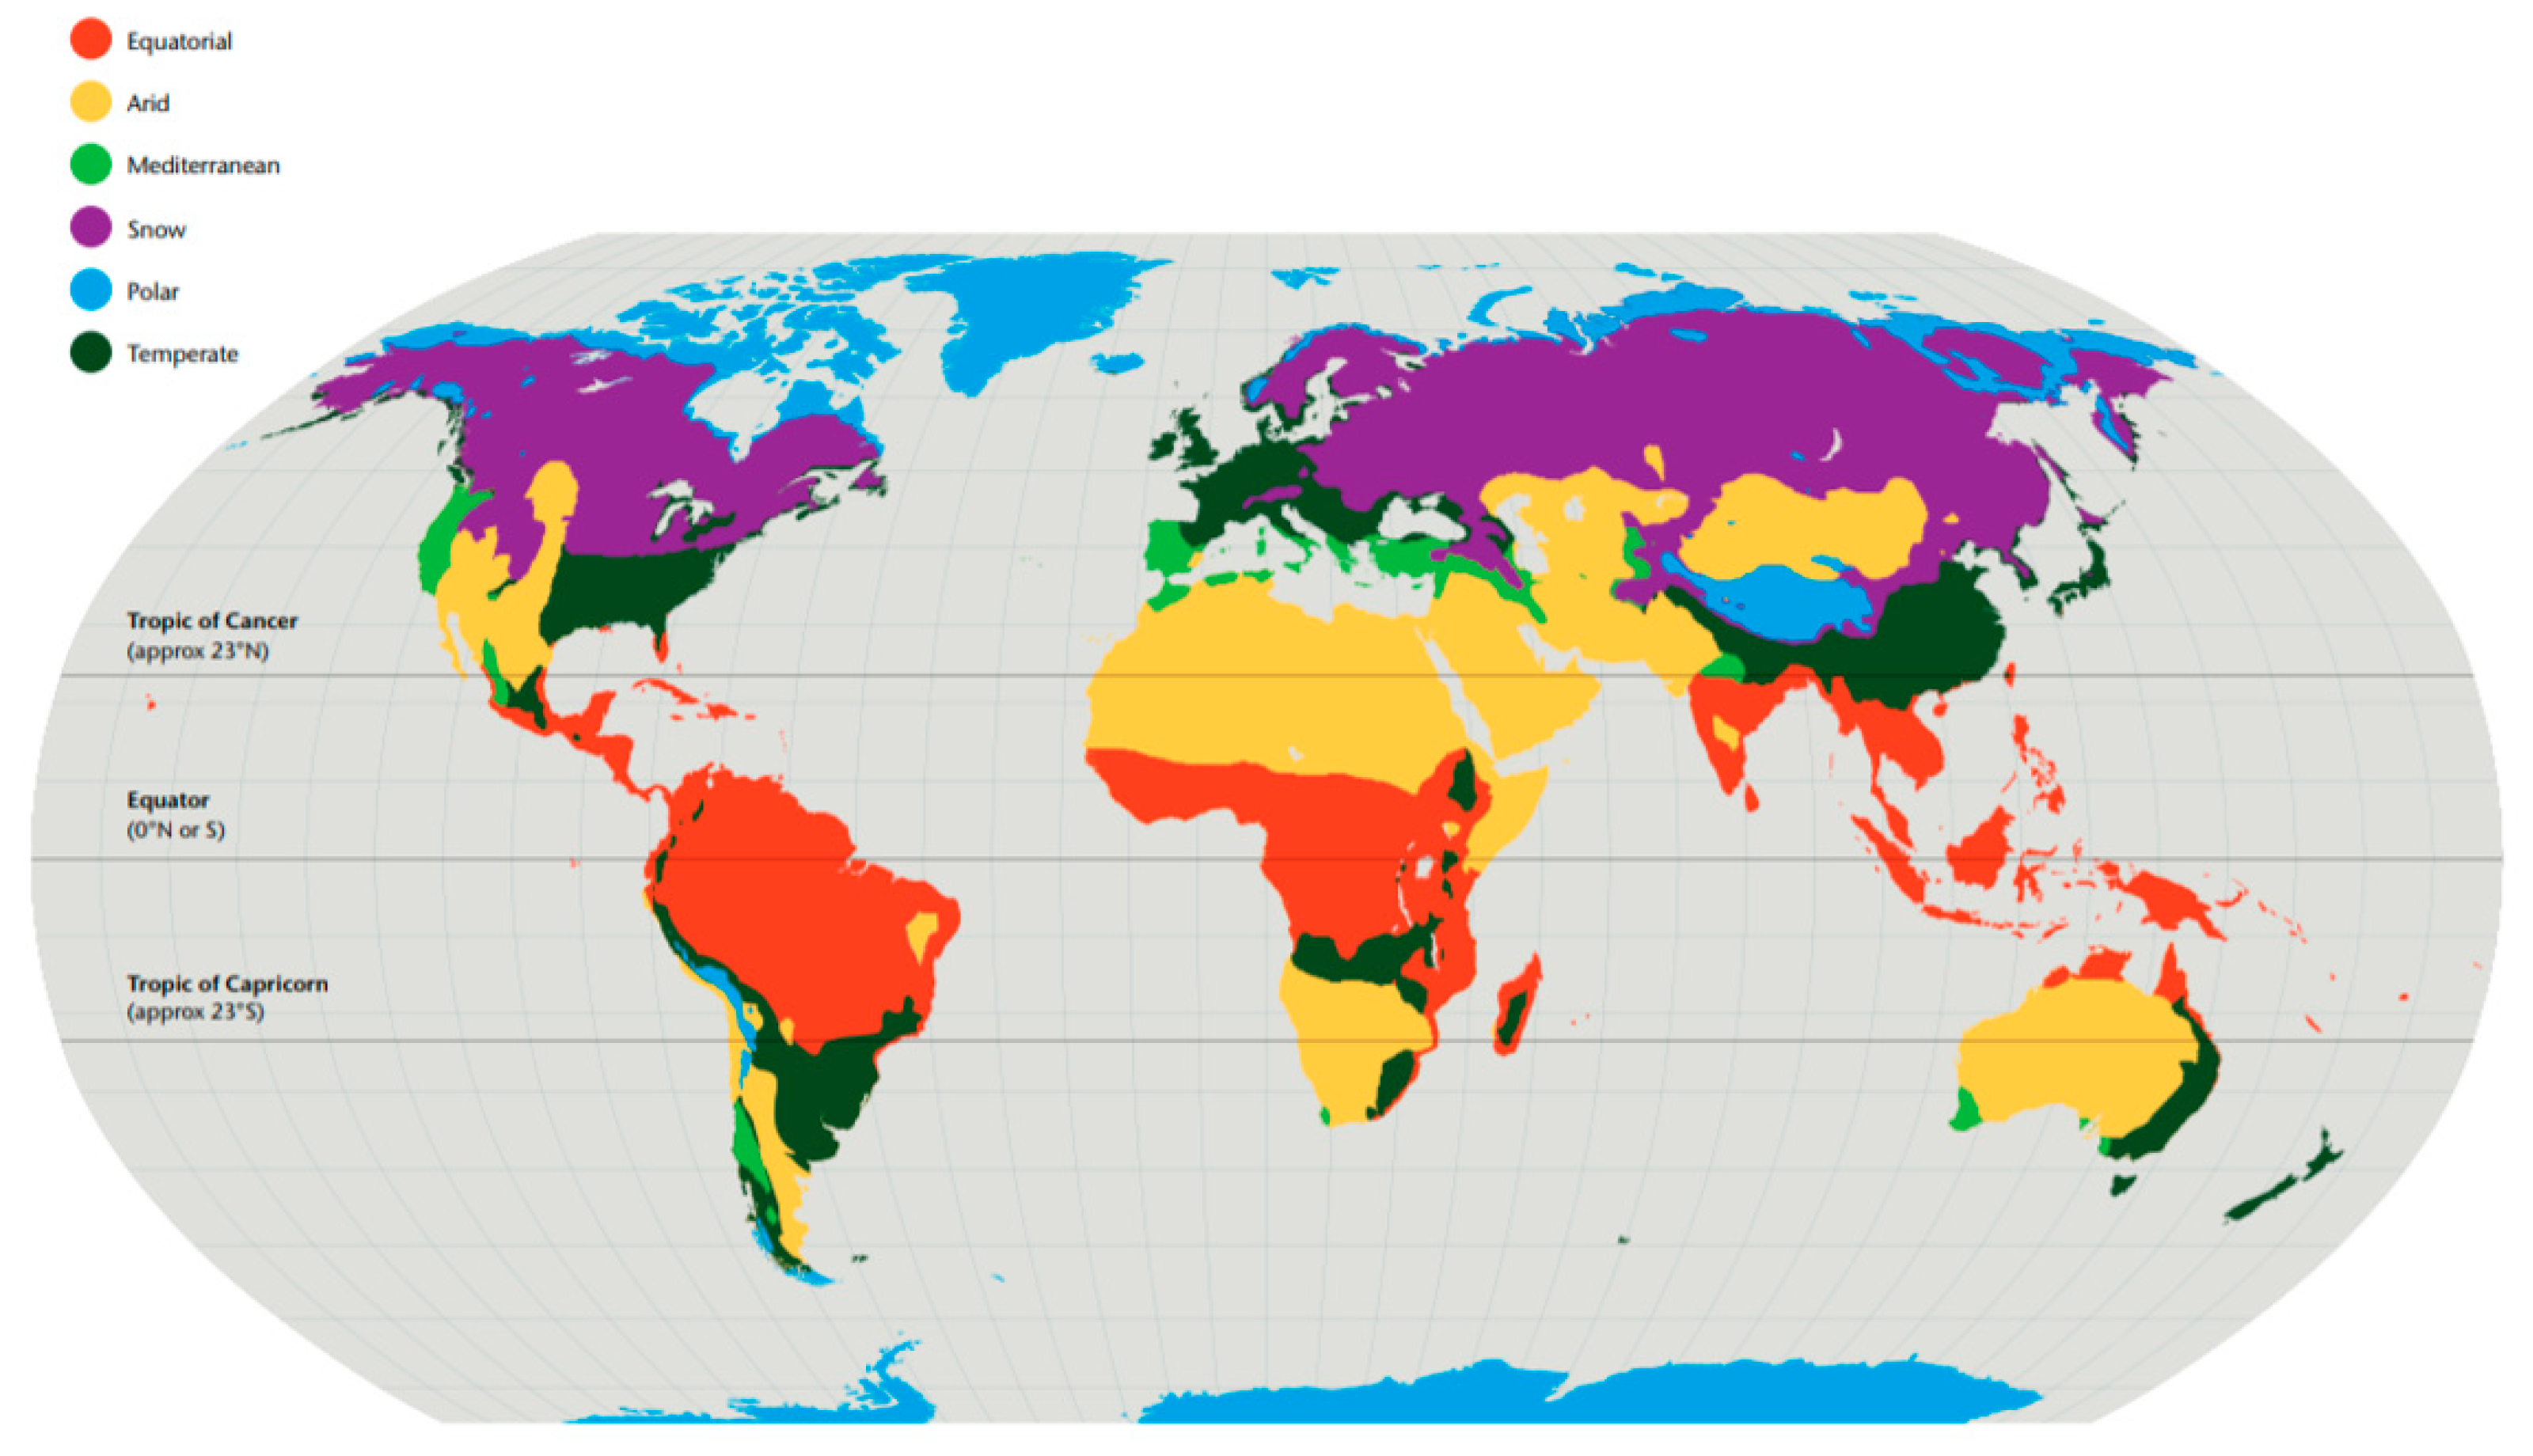
The climate zone of articles that specified a publication location was recorded utilizing the categorization system of William Köppen in 1936, which remains one of the most utilized classification models [47]. The model employs six classification bands; Equatorial, Arid, Mediterranean, Snow, Polar, and Temperate, as shown in Figure 5.
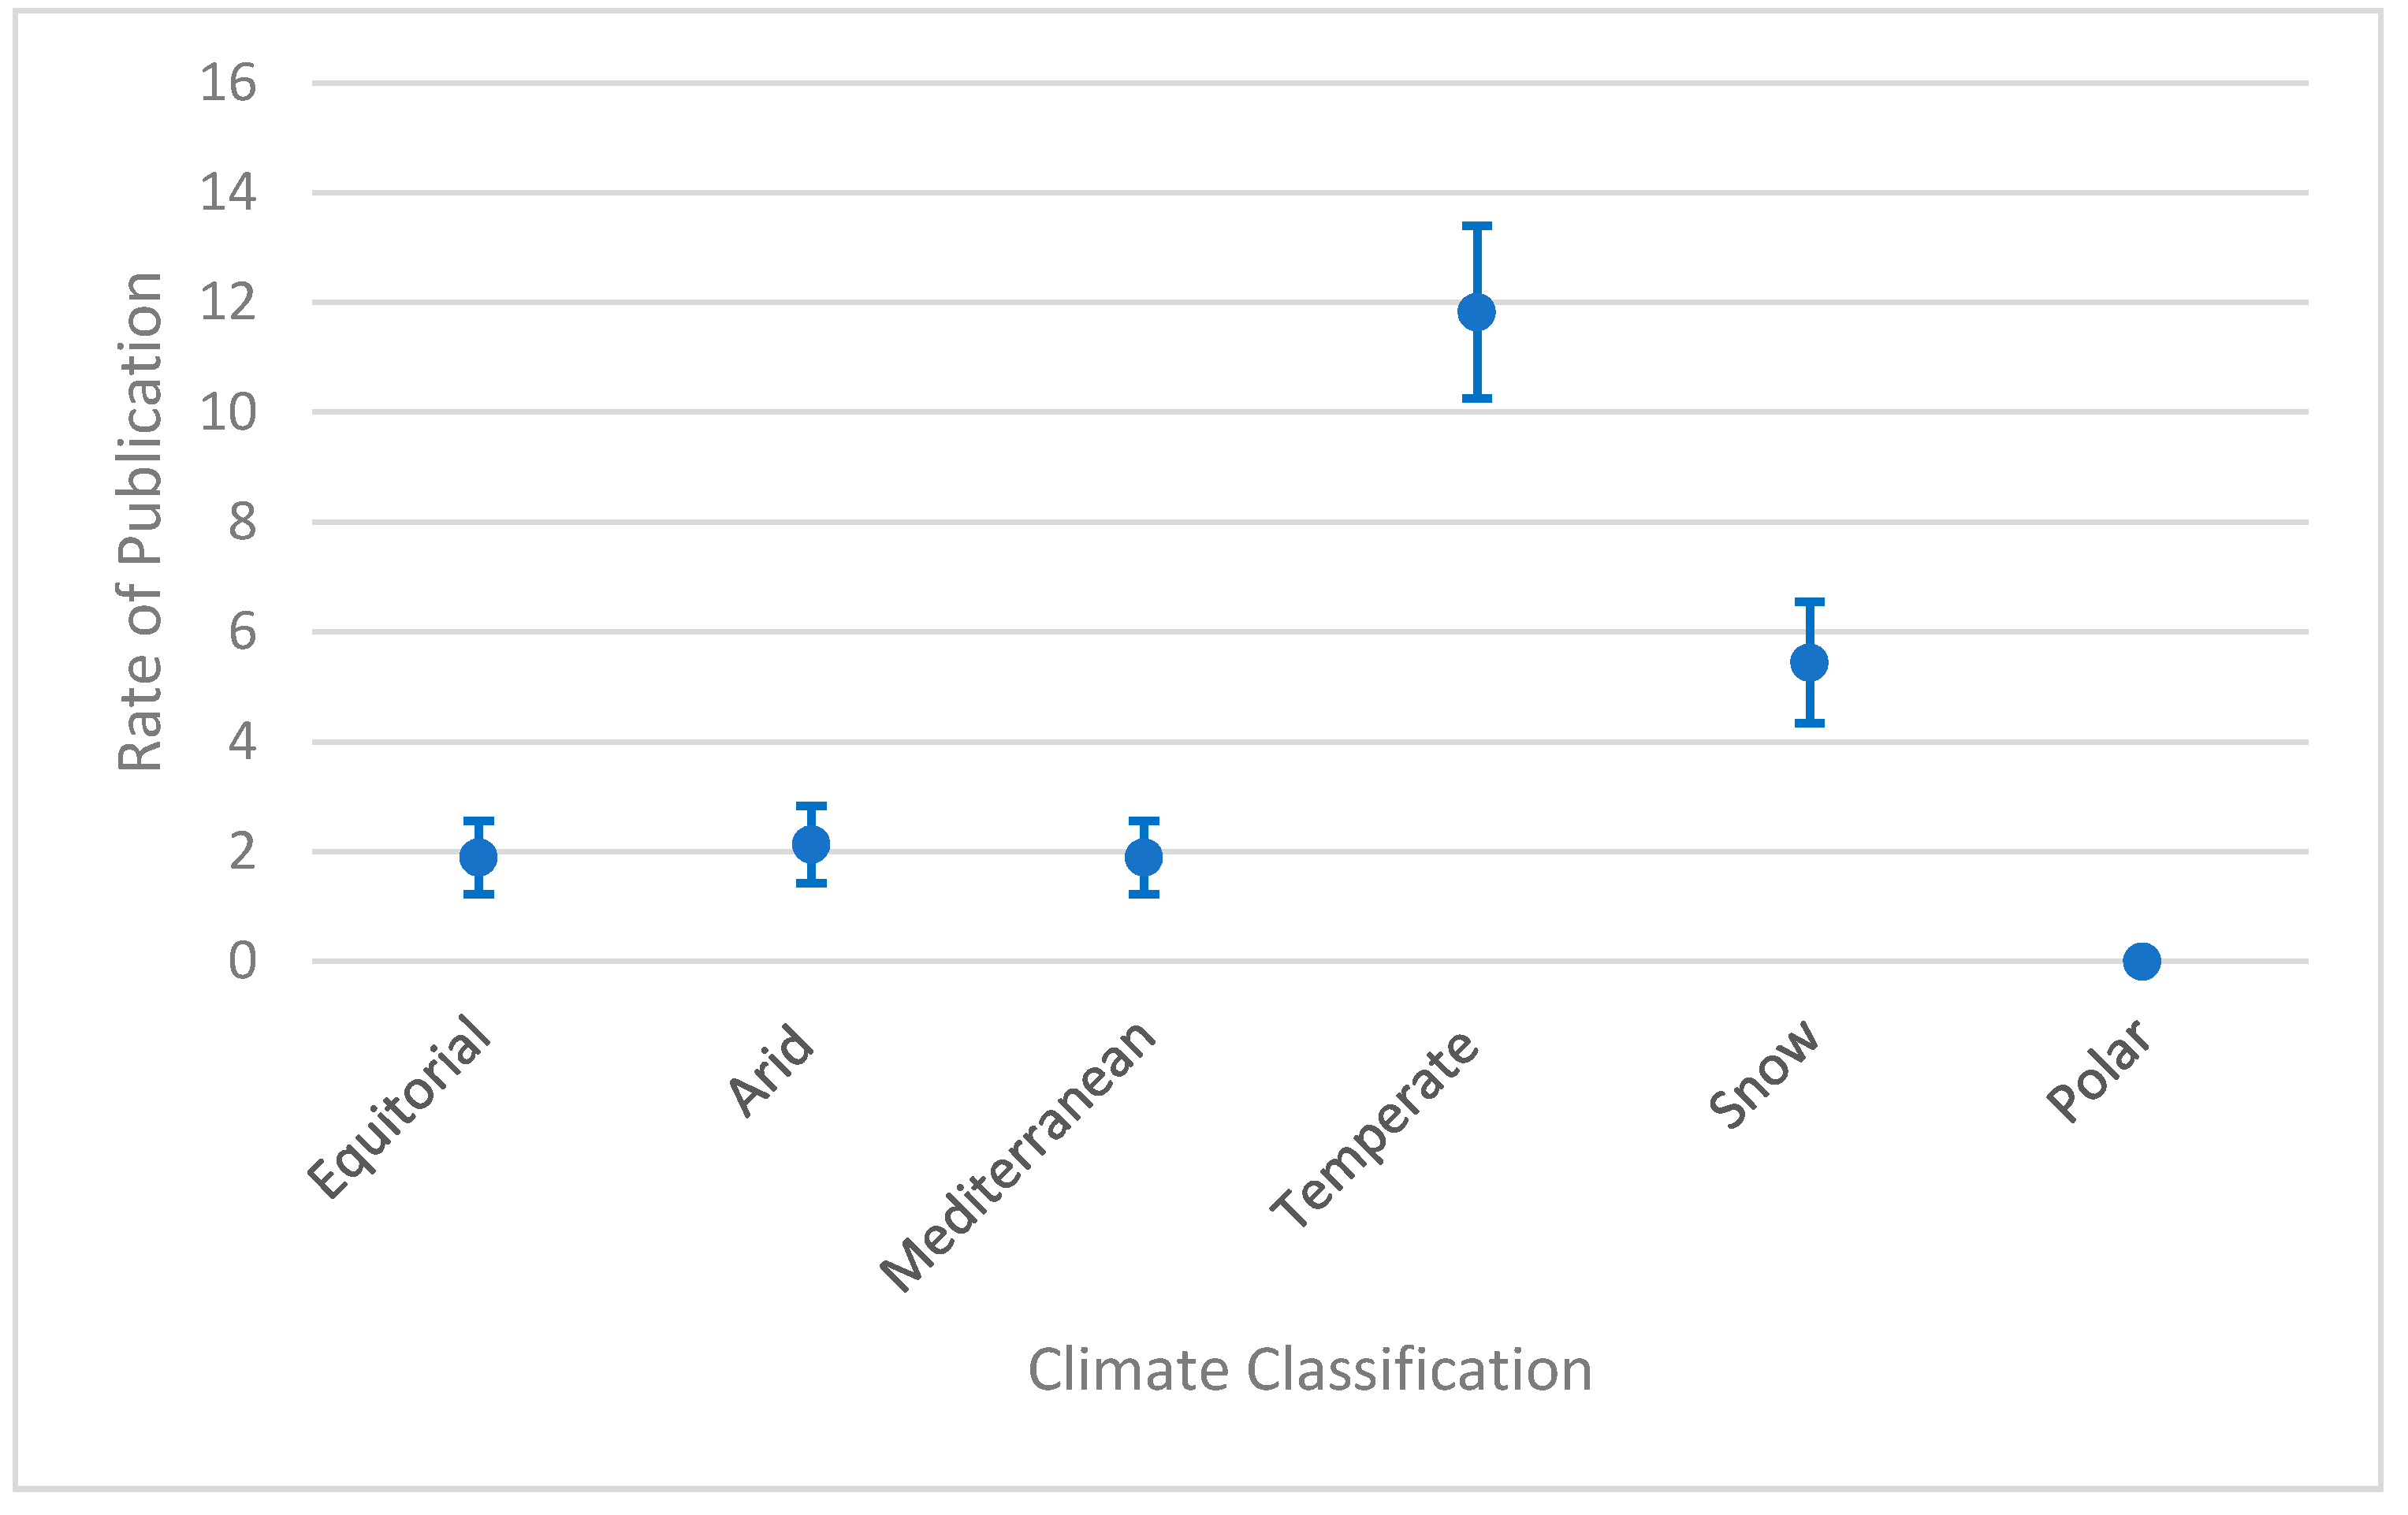
The articles analyzed within this review (n = 171) were produced all around the world, transecting many climate classification bands. It was found that there was a statistically significant difference (χ2 = 11.79; p = 0.003; df = 5) in the publication rates between climate classifications. The most prominent research climate categories were Temperate (51.02%) and Snow (23.47%). All other climate categories had publication rates of less than 10%. The recordings of publication climate zones are expressed below in Table 9.
The data recorded on climate category publication rates is shown in Figure 6, which show the relationship between climate categories, as well as errors bars indicating the ±95% confidence intervals across the examined articles (n = 171).
3.4. Article Classification
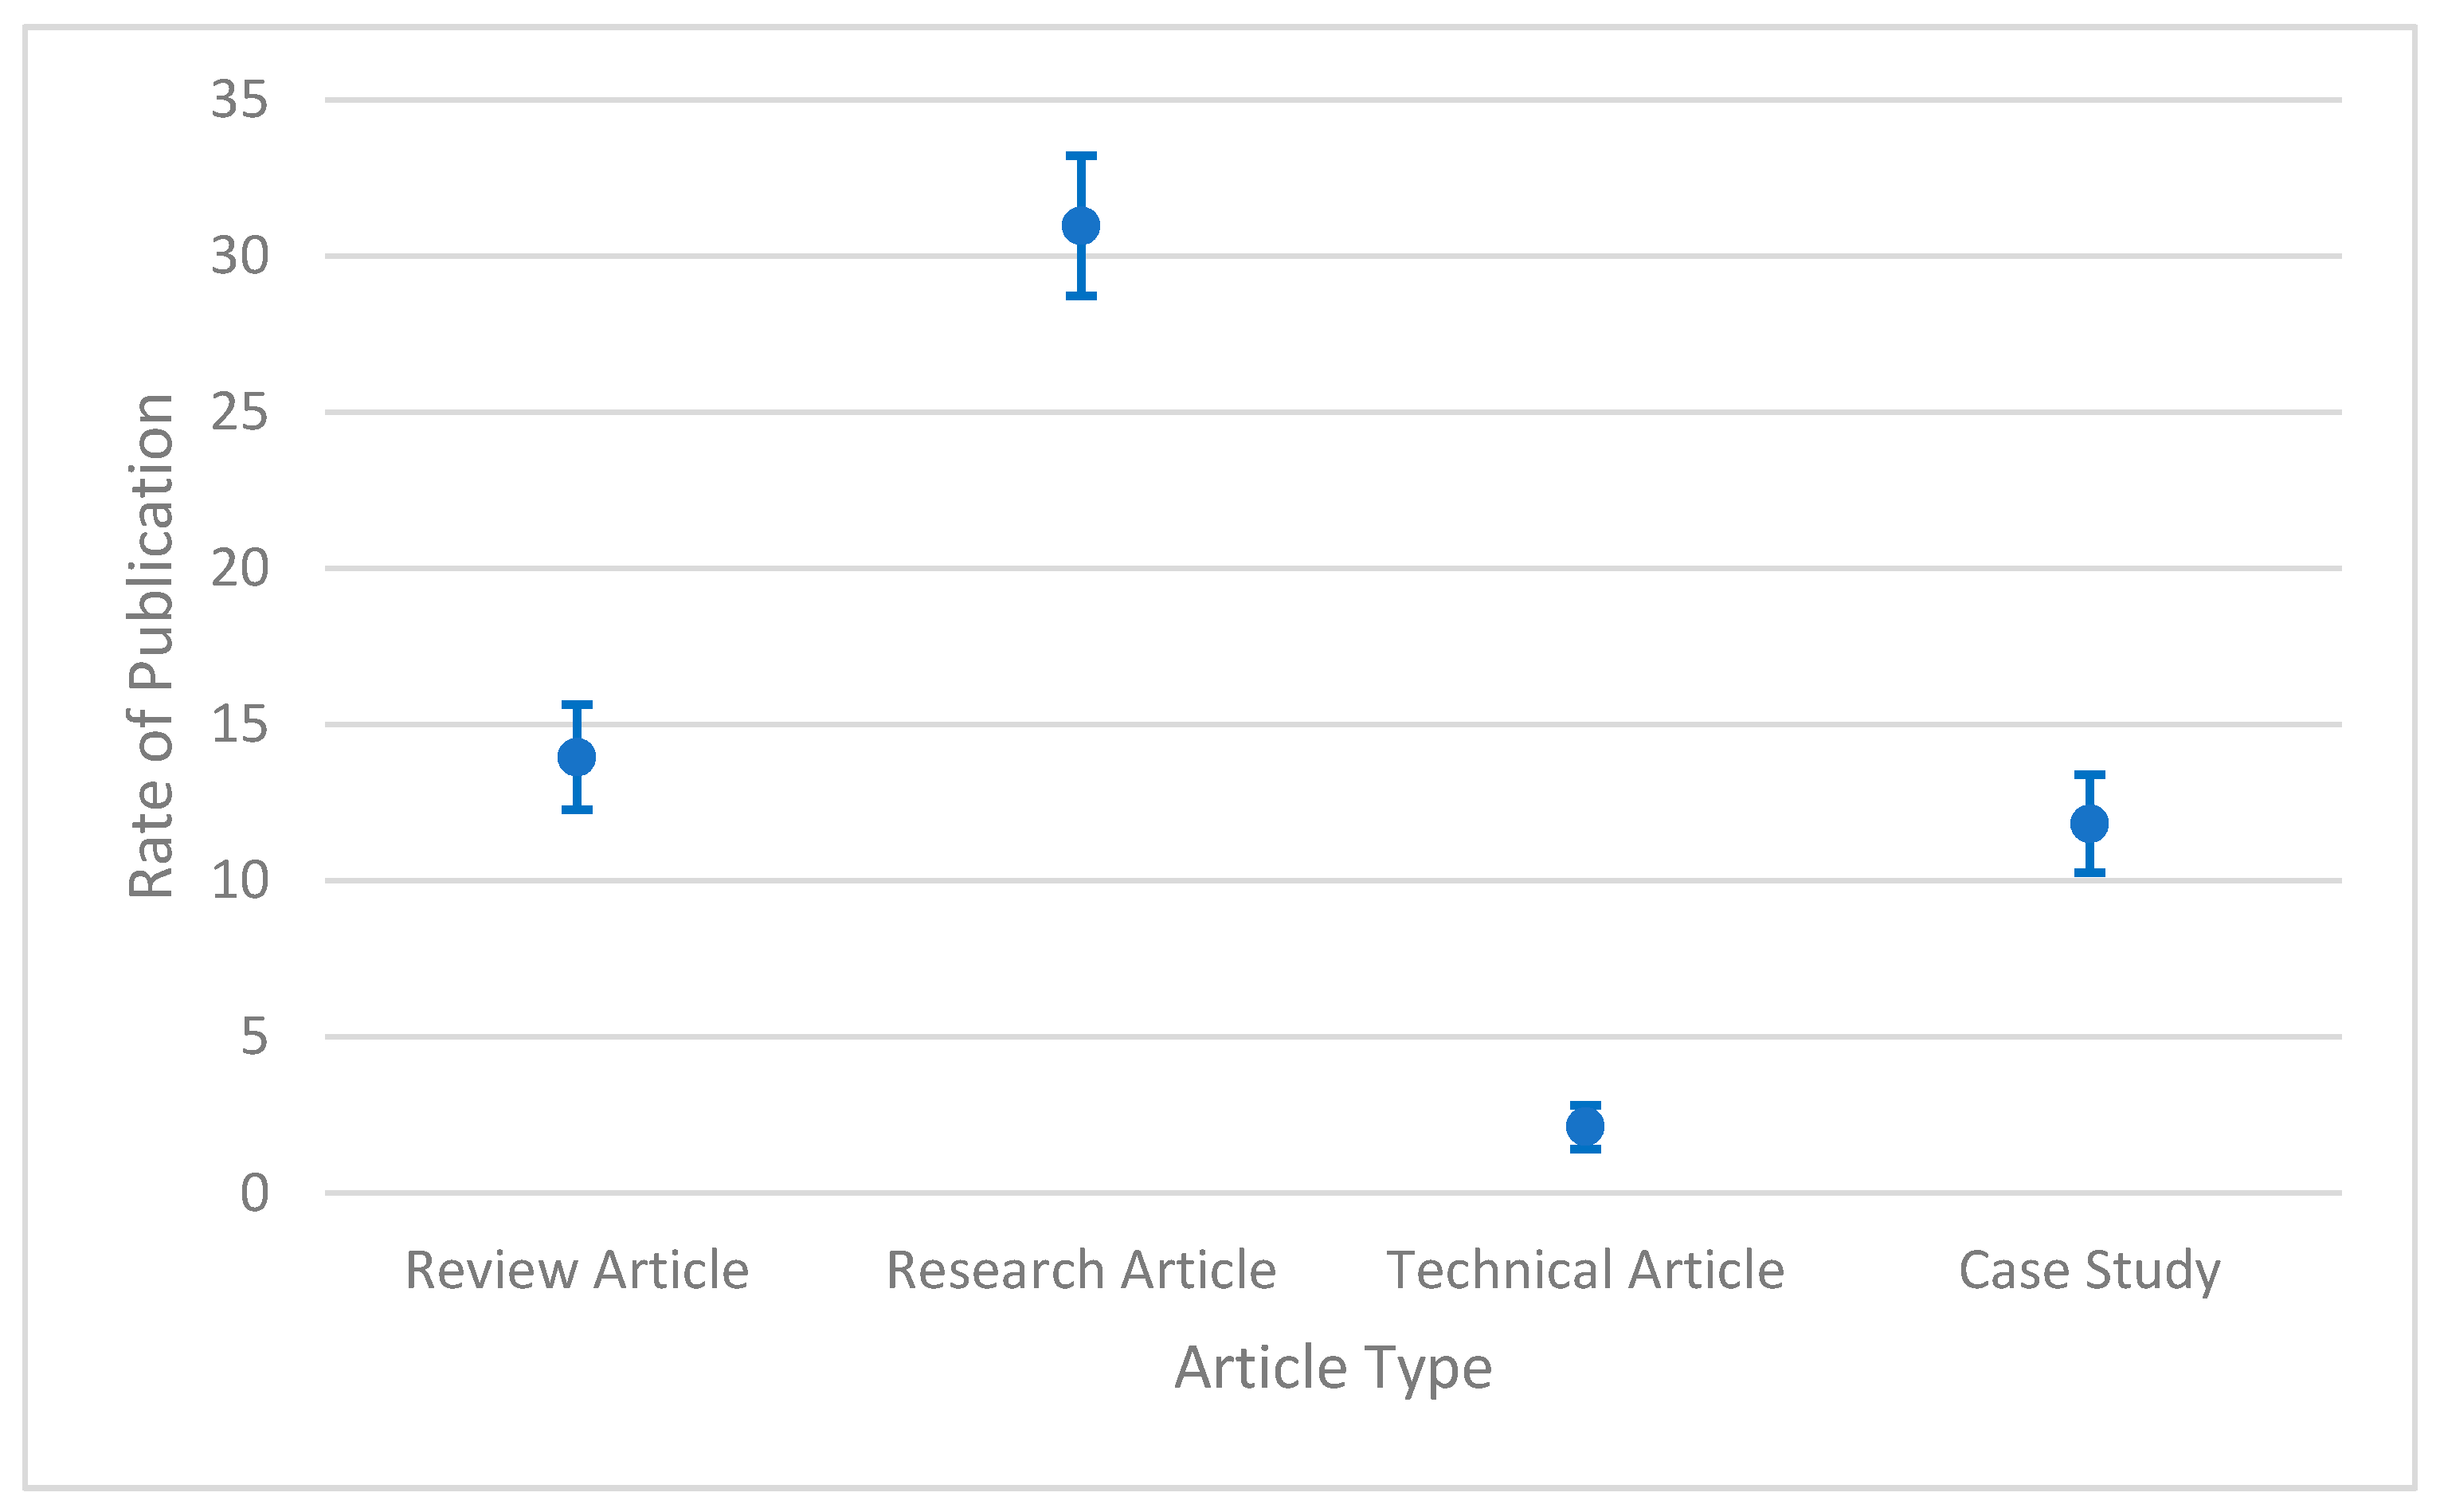
The classification of articles was noted for each publication, using the following categories: review article, research article, technical article, and/or case study. If an article was found to cross multiple categories, it was recorded as such and is expressed in Table S1 (Supplementary Materials). There is a statistically significant difference (χ2 = 121.65; p < 0.001; df = 3) in the reporting approaches, as calculated over the four different categories (Figure 7). A strong majority of articles (n = 131, 76.6%) was considered to be research-based. Review articles (n = 59, 34.5%) and case studies (n = 50, 29.2%) were considerably prevalent, with a remaining small number (n = 9, 5.2%) being technical in nature.
Table S1. Article classification reporting with authors of papers, available in the Supplementary Material.
3.5. Article Focus Area
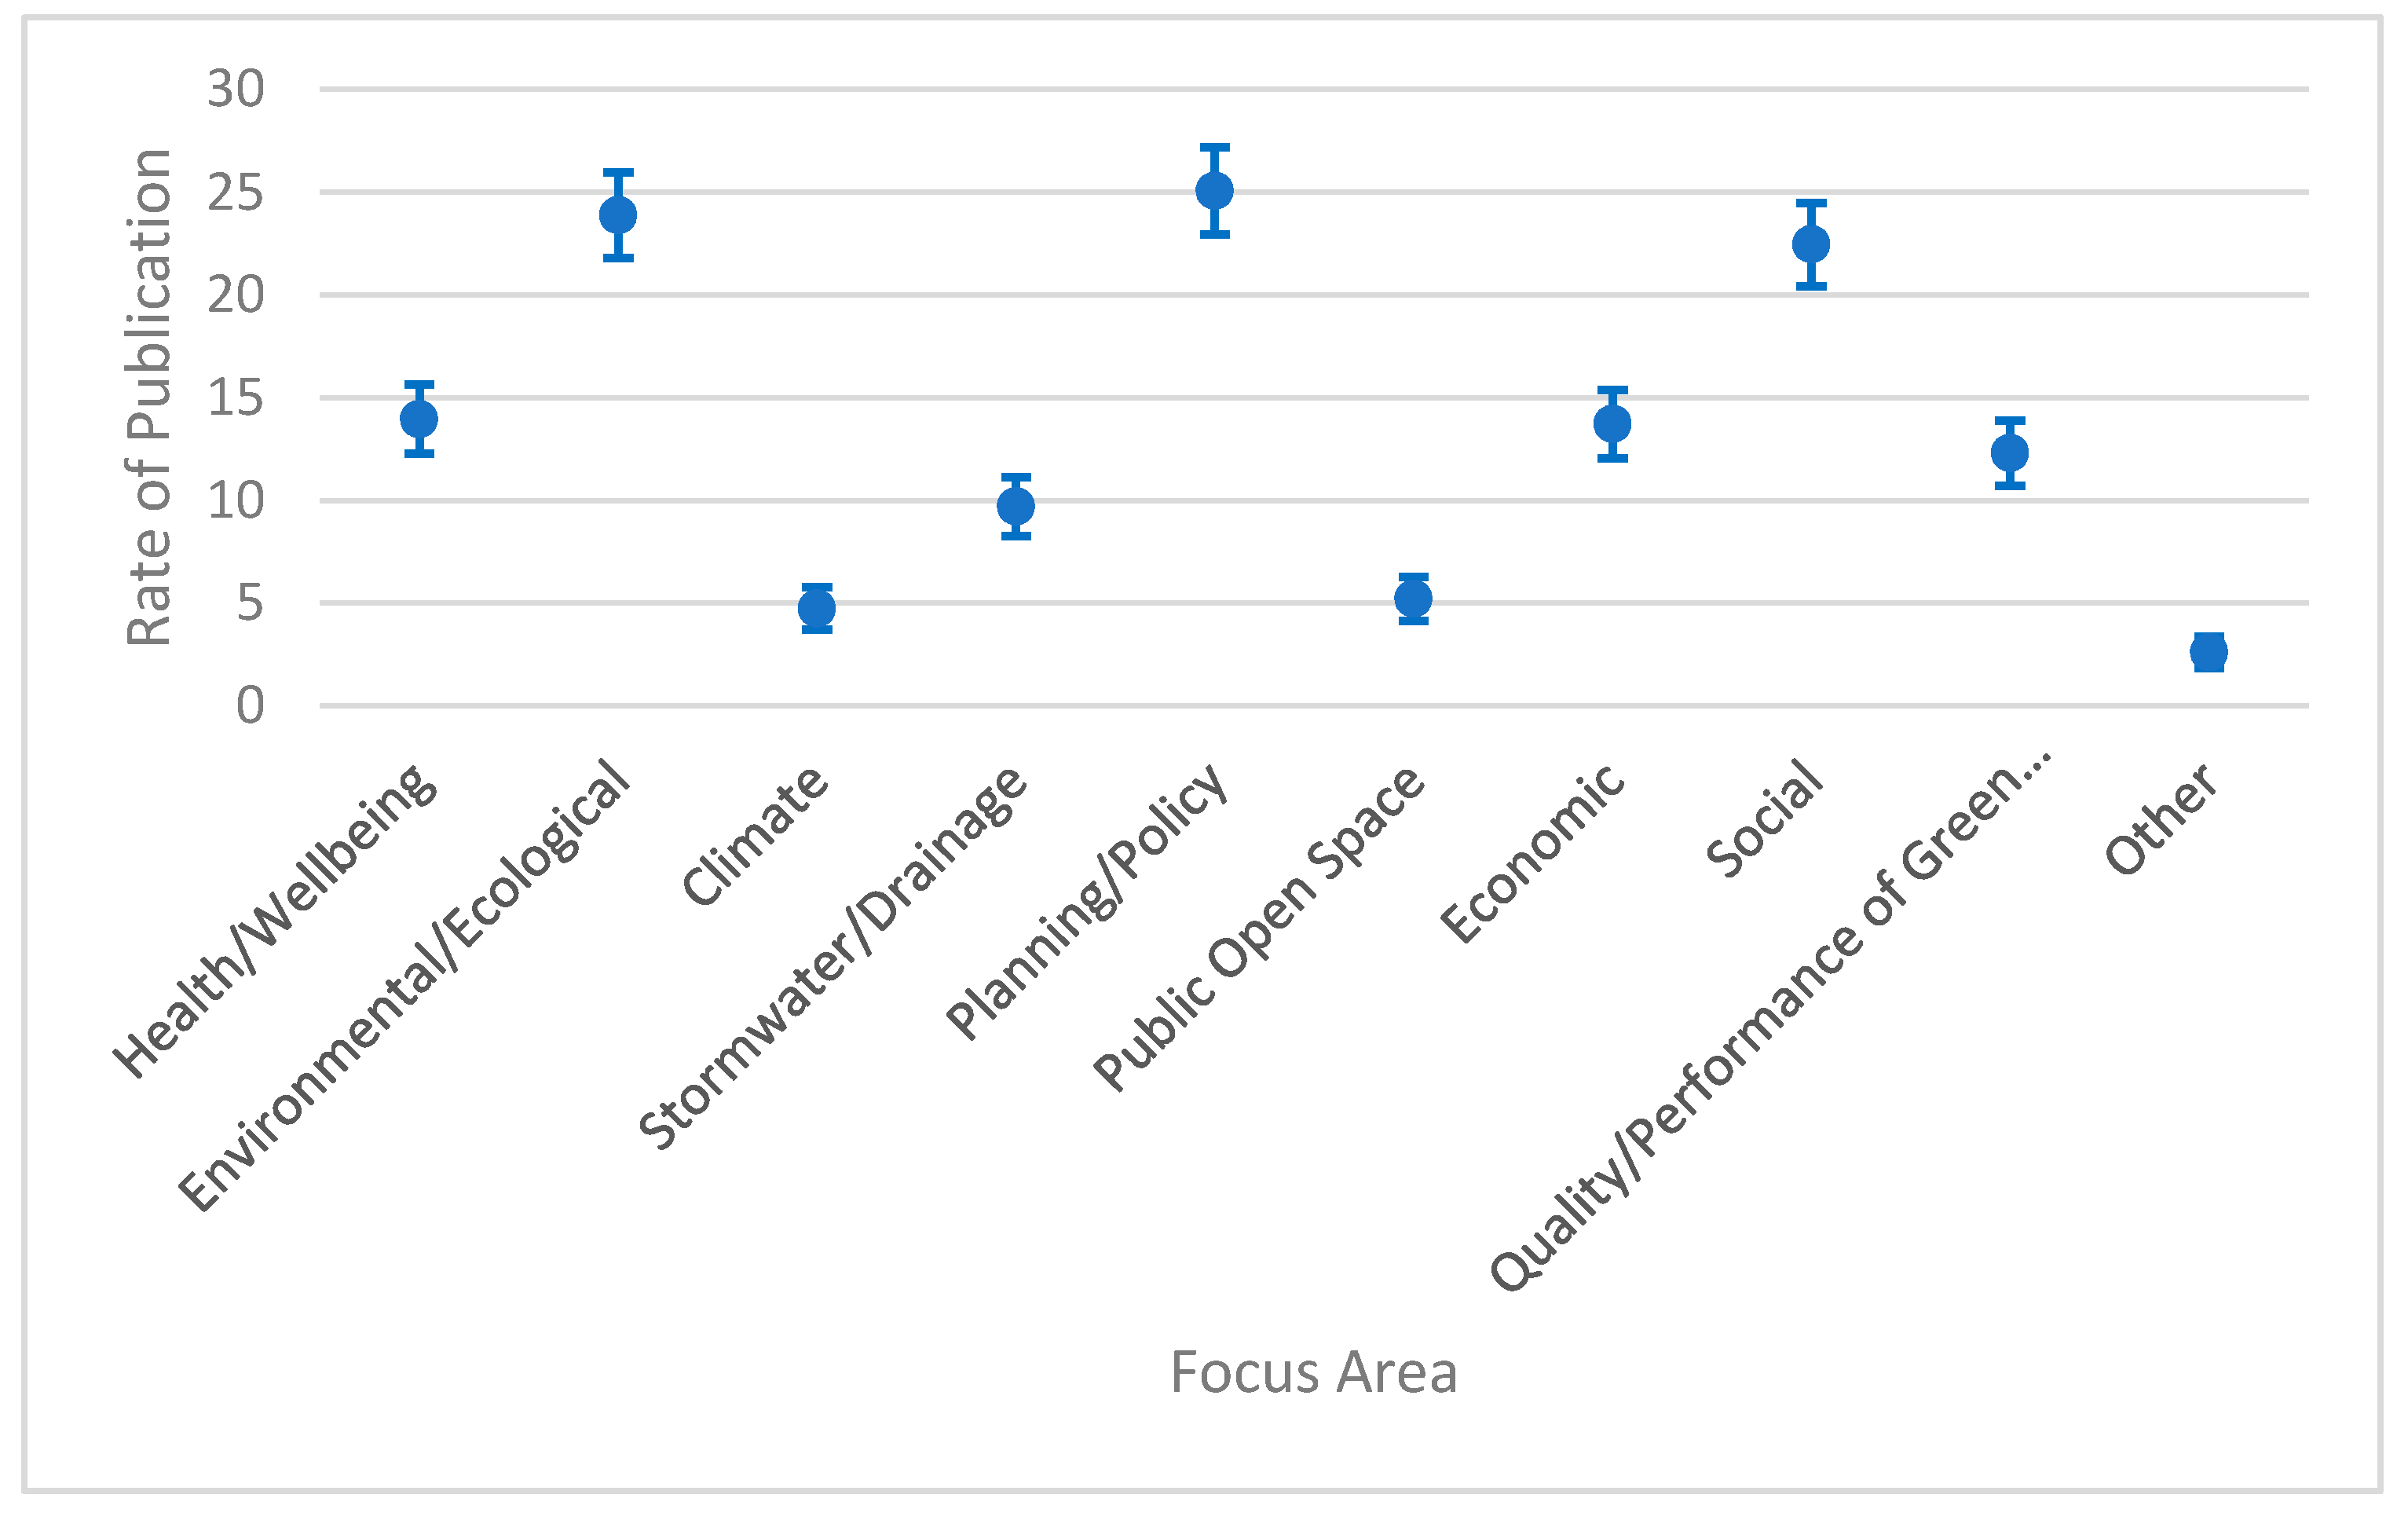
Similar to the recording of article classifications, the focus area/s were noted for each article. The nominated categories were Health/wellbeing, Environmental/ecological, Climate, Stormwater/drainage, Planning/policy, Public open space, Economic, Social, Quality/performance of green infrastructure, and Other. If the article was found to have multiple foci, it was recorded as such, as shown in Figure 8.
For ease of reporting, each focus area was assigned a numerical value;
- Health/wellbeing = 1
- Environmental/ecological = 2
- Climate = 3
- Stormwater/drainage = 4
- Planning/policy = 5
- Public open space = 6
- Economic = 7
- Social = 8
- Quality/performance of green infrastructure = 9
- Other = 10
There was a high variability in the focus areas covered by the articles within the review. It was found that there was a statistically significant difference (χ2 = 58.74; p < 0.001; df = 9) between focus areas recorded. Focus areas 5, Planning/policy (n = 106, 61.2%), 2, Environment/ecological (n = 101, 59.1%), and 8, Social (n = 95, 55.6%) were clearly dominant in the analyzed papers (n = 171). Focus areas 1, Health/wellbeing (n = 59, 34.5%), 7, Economic (n = 58, 33.9%), and 9, Quality/performance of green infrastructure (n = 52, 30.4%) were relatively close in their prevalence. The remaining three focus areas reported less than 41 occurrences each. The category of Other reported a prevalence of 11 (6.4%).
Table S2. Article focus area/s reporting information by author is available in the Supplementary Materials.
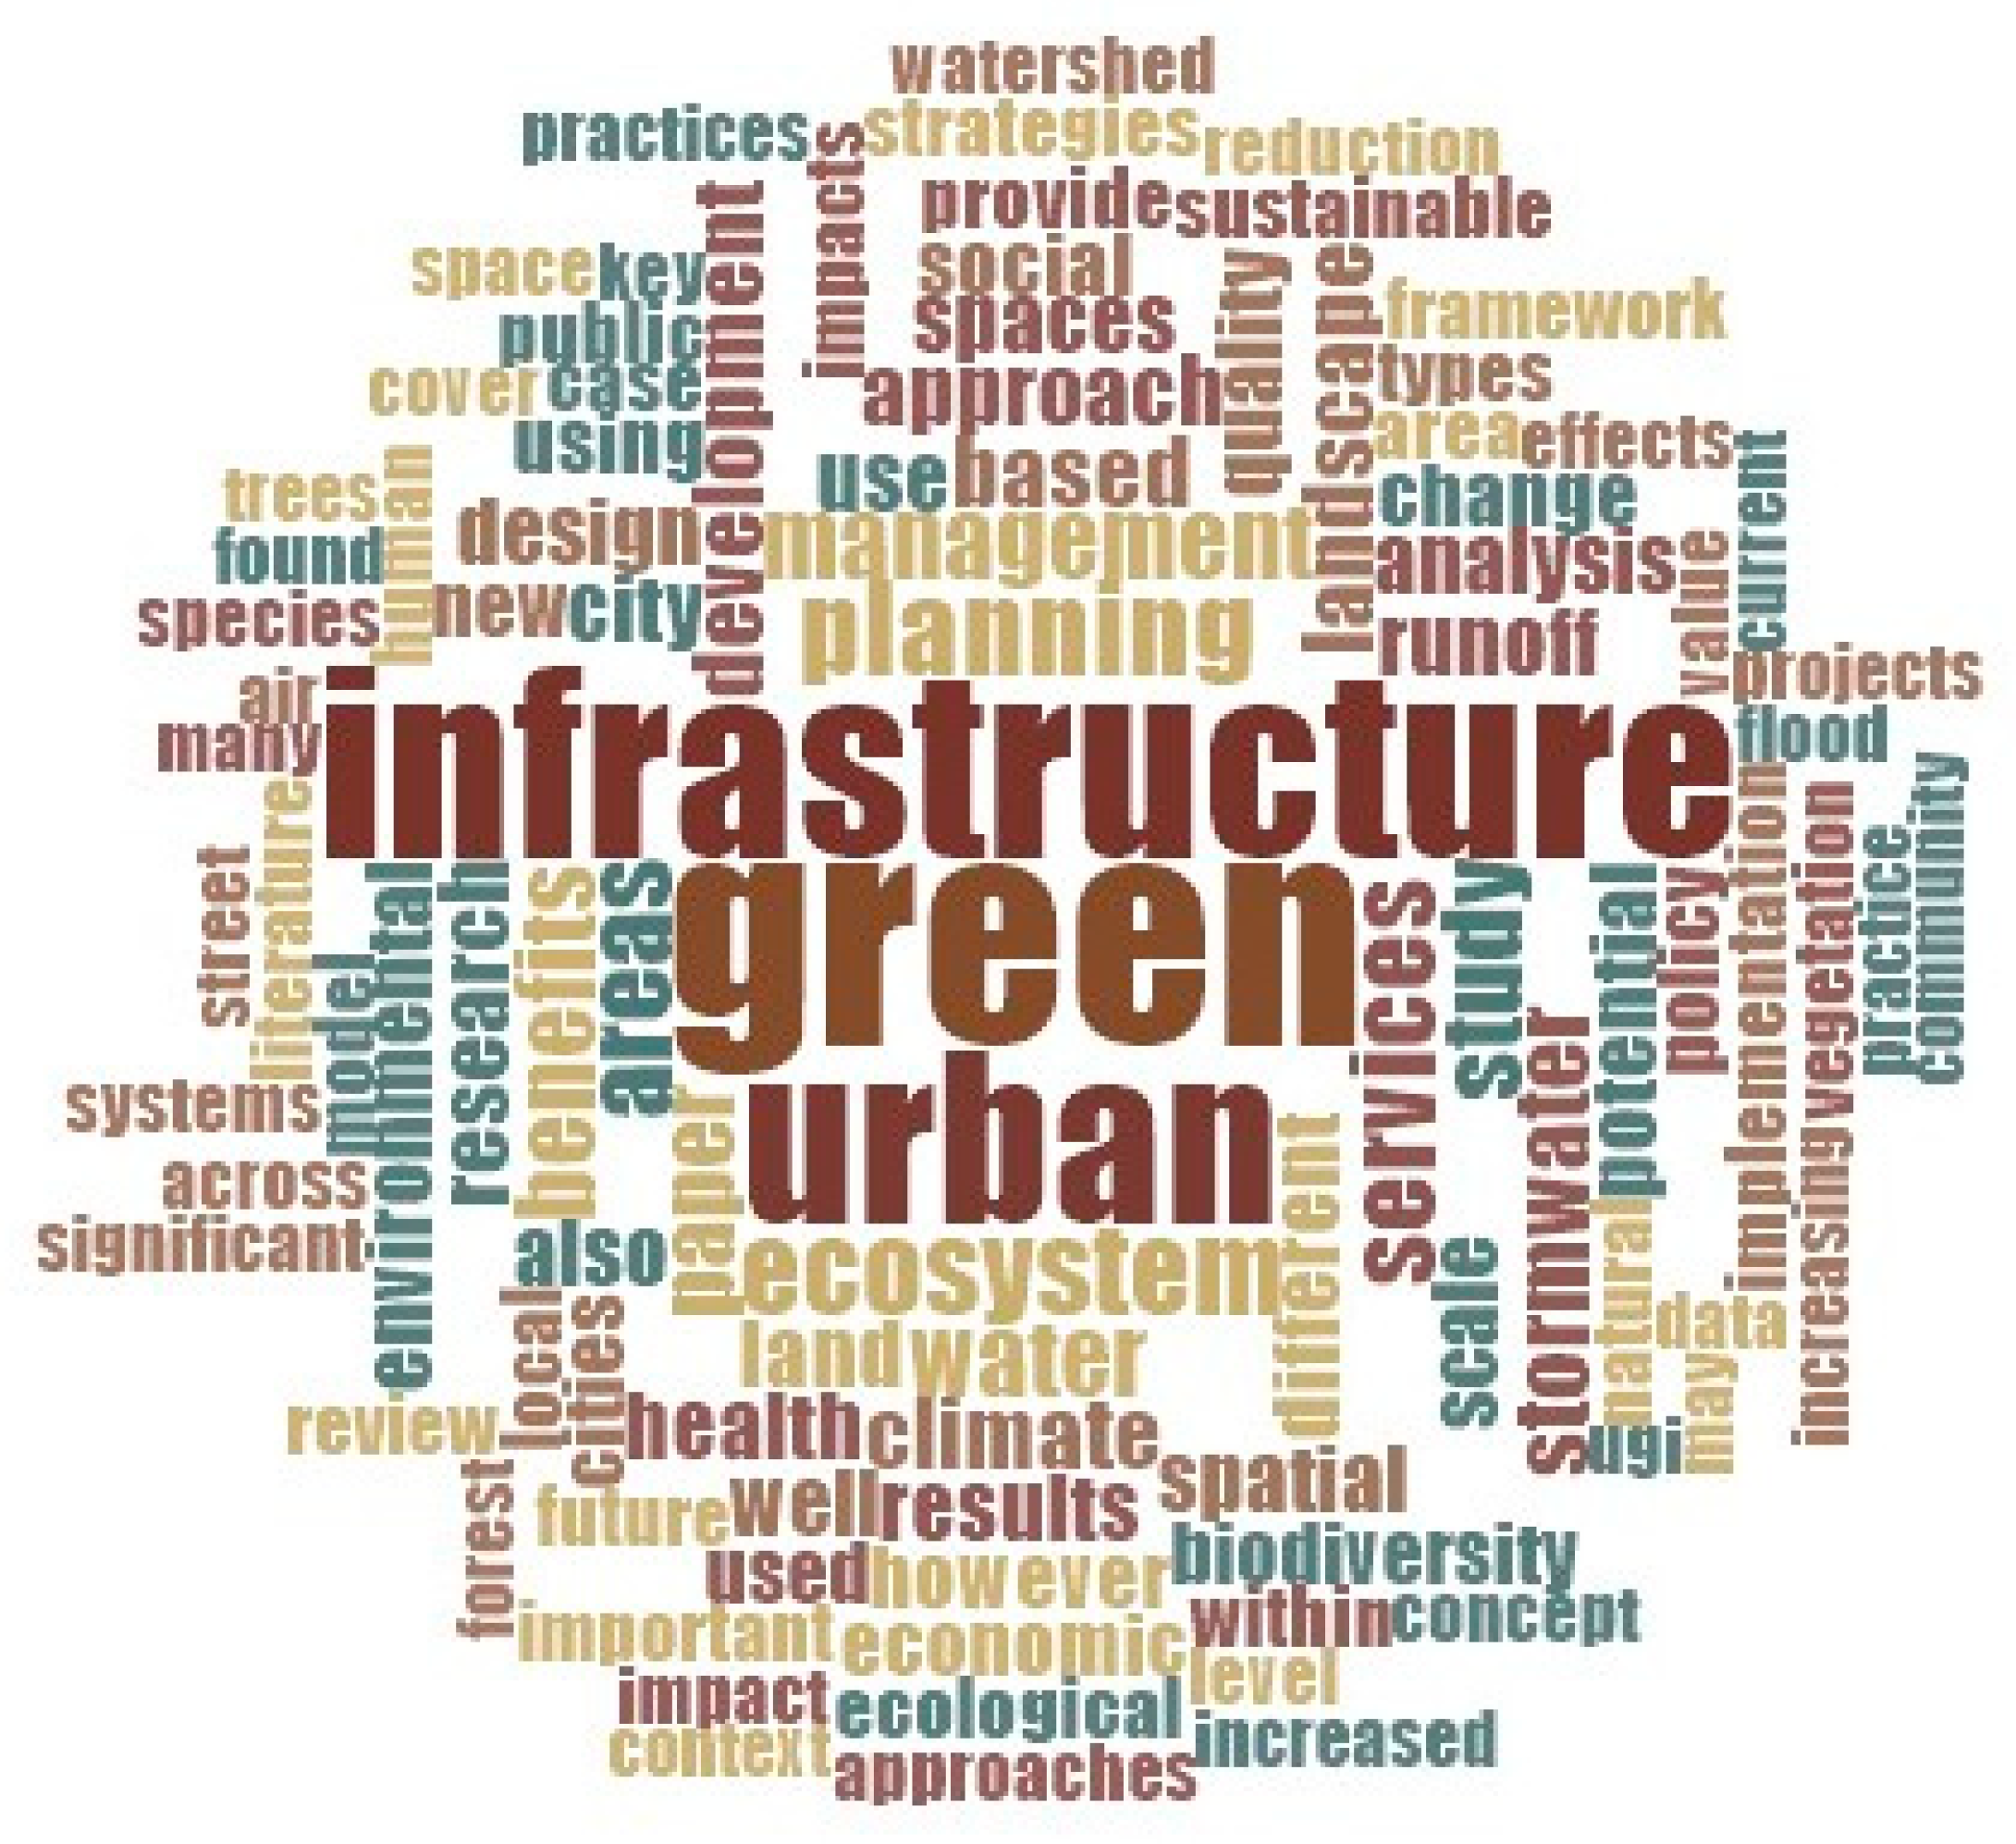
In addition to the manual identification of focus areas, a data visualization technique known as a ‘Word Cloud’ was produced using the text contained within abstracts from each of the 171 peer-reviewed articles. The word cloud shows the frequency in which words were detected by their size and visual prominence. Variations of the same meaning term were merged; for example, environment and environmental would be considered one and the same. The word cloud is included below (Figure 9). Words shown to occur at the greatest frequencies comprised green, infrastructure, urban, planning, ecosystem, services, management, land, and water.
3.6. Analysis of Focus Area Trends
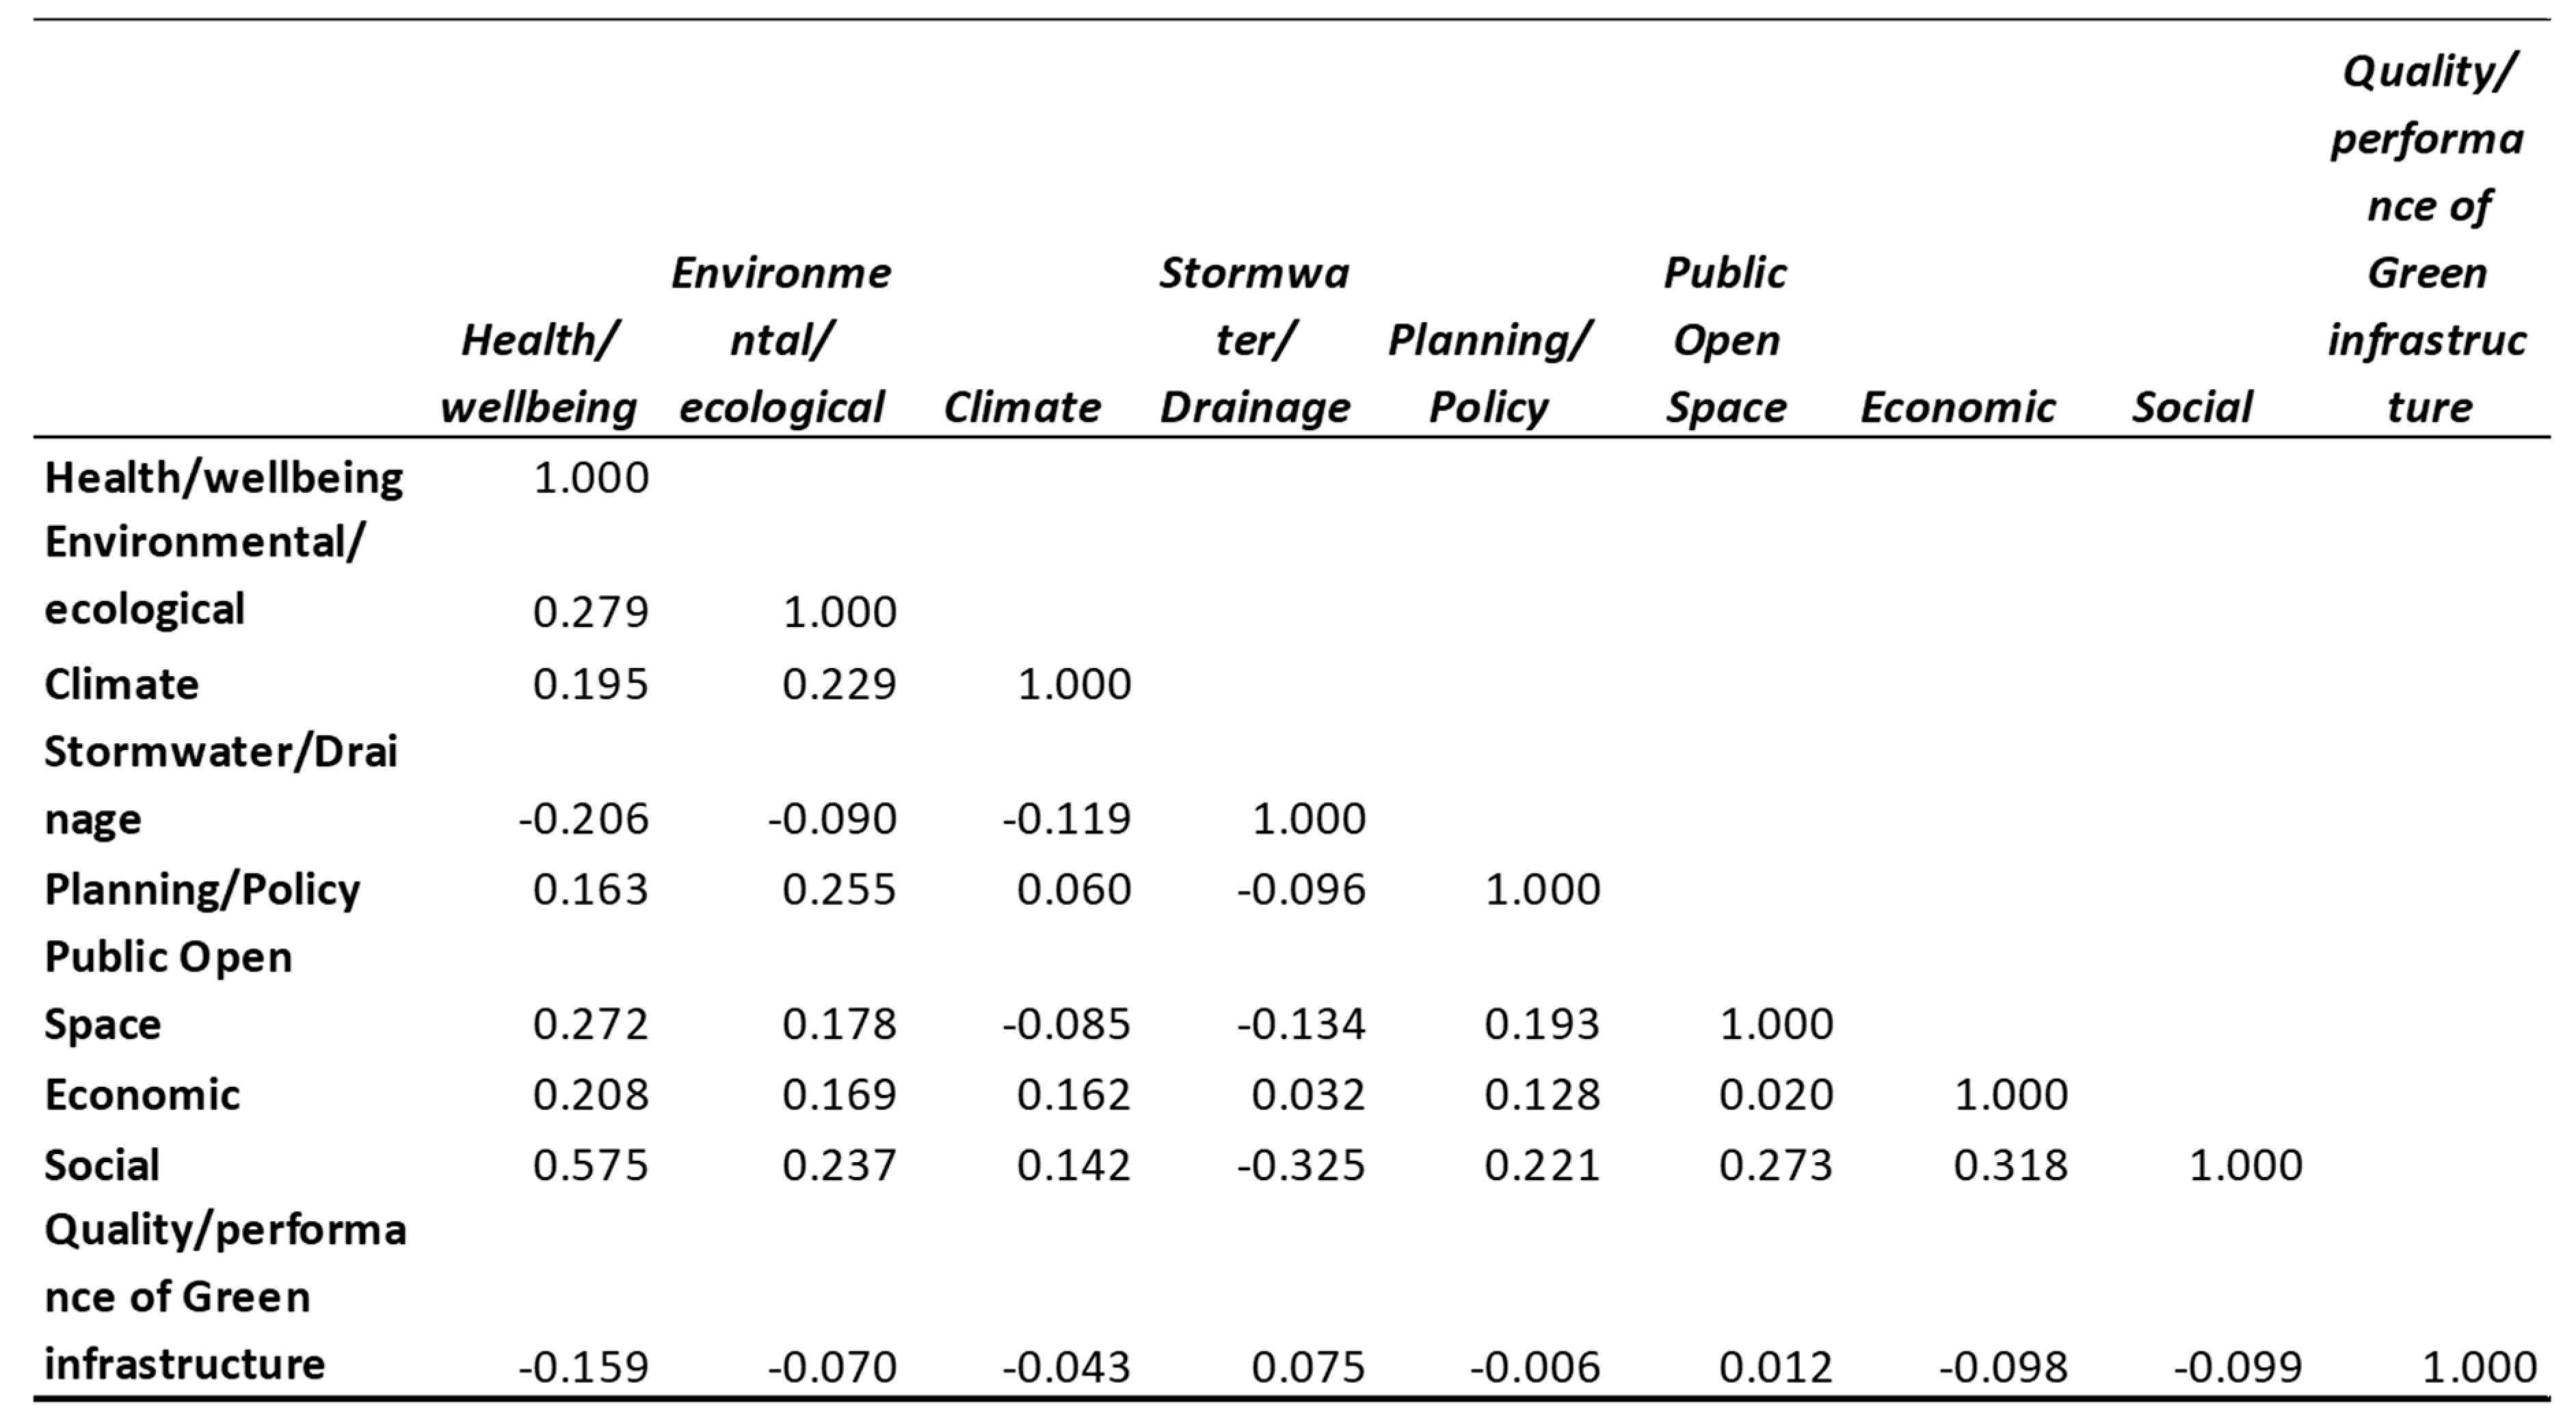
Outside the direct focus areas recorded, as outlined in Section 3.4, an analysis was carried out to identify deeper trends within the focus area recordings (Figure 10). The possibility of elevated correlations due to a double negative being recognized in the same way as a double positive, will be expanded upon in the Discussion section. Five statistically significant (<0.005, and verified via t-Test) correlations were discovered between focus areas: Climate and Infrastructure (p = −0.043), Stormwater/Drainage and Economic (p = 0.032), Planning/Policy and Quality/Performance of Green Infrastructure (p = −0.006), Public Open Space and Economic (p = 0.020), and Public Open Space and Quality/Performance of Green Infrastructure (p = 0.012).
4. Discussion
4.1. Research Effort
The first article with GI appearing in the electronic database search, without a publication year restriction having been applied, was in 2006. Publication rates since that year have been relatively modest; however, trends indicate that GI publication rates are growing steadily, particularly over the last three years. If this growth in research interest and publication rate continue to follow current trends, this will be assumed to increase the understanding and robust nature of GI research and implementation, and may assist in increasing the overall perceived value, and thus GI implementation. Future temporal trends would require monitoring in order for claims to be made regarding the disciplines sustained progress.
Mell [21] and others suggest that consideration must be made of the interchangeable terminologies surrounding GI, in different contexts of use, as well as intentional meanings by which the term is used, to be sure that true research efforts are not masked. This idea may partially explain the overall low number of publications on GI. Additionally, Green Infrastructure had to appear explicitly in the title of the article for inclusion in the review using the employed search methodology. This may mean that a larger volume of research may exist, as well as different publication rates and trends for research pertaining to GI that did not include the words Green Infrastructure explicitly in the title.
As outlined in the Results section, the 171 articles included in this review came from a large number of journals (n = 84), although over a quarter came from just four journals. The top four journals were Science of the Total Environment (n = 6, impact factor of 4.160), Journal of Environmental Management (n = 10, impact factor of 4.005), Sustainability (n = 10, impact factor of 2.075), and Urban Forestry and Urban Greening (n = 11, impact factor of 2.782); this strongly affirms an environmental perspective among those publications. It also suggests that while GI research transects a number of disciplines, based on publication discipline and journal choice, it predominantly occurs most frequently in the environmental domain.
The large number of journals having published articles with GI in the title confirms that GI research has a wide research reach, with, presumably, wide research implications.
4.2. Distribution of Research
With the exclusion of publications that did not list a publishing country, as well as those in which authors were listed from multiple countries, publication origin (city and country), as well as associated climate information, were analyzed. Publication hotspots by country comprised the United States, the United Kingdom, and Australia. While statistics on annual publication rates by country can differ across disciplines, in 2015, the total publication rates were greatest in the United States (310,206), China (142,645), United Kingdom (90,018), and Germany (82,550). Australia ranked lower (11th), with 38,607 publications.
It was unsurprising that the United States was the highest publishing country (n = 46). With some surprise, Australian publication rates were equal second with the United Kingdom (n = 15). This potentially reveals that GI is of greater interest and/or consequence to Australian researchers than other research topics. This may be partly due to the climate characteristics experienced by Australia, i.e., extreme temperatures, heat waves, drought, and localized flooding, all of which may be remediated by GI. These conditions can be similarly true for parts of the United States, which may also explain the high levels of research interest. Further research is required to confirm this suggestion.
By way of publication rates within each associated climate zone, the results partially support the assumption made above. It was shown that 51.02% of the research effort emerged from countries within a ‘Temperate’ climate, i.e., with characteristics of a temperate climate including wide temperature variations, distinctive ‘seasons’ generally with the ‘winter’ season having a mean minimum temperature of above −3 degrees Celsius and below 18 degrees Celsius. This statistically significant difference of publication rates between Temperate climate zones and any other climate type region gives support to the idea that GI holds the greatest significance for authors working in the former. Interestingly, a relatively high percentage of publications came from countries within the ‘Snow’ climate zone (23.47%).
4.3. Article Type
Research is developed and published for a number of reasons, and serves an array of purposes. Four main article types, which were deemed as being particularly relevant to this review based on their ability to better shed light upon research trends, are identified and described as follows:
- Review Article; an article designed which seeks to critically analyze the existing literature within a discipline or a pre-determined search criterion. Review articles are generally presented as literature reviews, systematic reviews, or a meta-analyses.
- Case Study; an article that focuses on a specific location or subject. Generally, case studies present new found data on a case study topic.
- Research Article; sometimes interchangeably known as an original research article, which generally includes the pursuit of a research question, hypothesis or aim.
- Technical Article; generally dominated by science- and medicine-based fields, technical articles tend to focus heavily on documenting methodologies and data, rather than discussing opinions, hypotheses and philosophy.
Different disciplines may record differing trends when it comes to proportions of article types being published. These trends may be affected by factors such as the orientation of the research field, the current demand for article types, and the level of maturity of the research field.
Within this review, as displayed in the results, a strong majority of articles were identified as Research Articles. This may be suitably representative for an emerging discipline. For a relatively new and emerging field of research, there are a significant number of articles that were predominantly, or at least included, a review of some type. This may be partially due to the breadth of the concept, as well as to interchanging attempts at defining the concept, and the individual aspects of the GI concept in general. Additionally, the low number of technical articles that were recorded, considering the breadth of the concept and the many technically specific areas contained within, is worthy of note.
4.4. Article Focus Areas
Planning and/or policy, Environmental and/or ecological, as well as Social aspects of GI were recorded as the highest areas of focus. Planning and/or policy focus by the authors involved things such as suggestions for additions to existing guidelines, policies and frameworks, as well as proposing/advocating for the development of new policy and policy positions. This was a broad category, and thus, not surprisingly, it attracts a high frequency of reporting. GI installations transcend many aspects of environmental and ecological existence. GI examples and installations still include environmental solutions and mitigation techniques. Again, the recorded frequency of this was unsurprising. Of potentially more surprise was the frequency a Social focus that was recorded. All in all, the frequency of GI focus areas was largely as expected.
4.5. Article Focus Area Correlations
Five correlations were discovered between focus areas recorded across the reviewed articles. As reported in the Results section, it was necessary to note that the absence of reporting (double negative) was considered in the same way as the presence of reporting (double positive). While this has the potential to skew the strength of the reported correlations, with the application of critical thinking, it is thought that this problem may be overcome.
4.5.1. Climate and Infrastructure
In a twofold sense, climate affects infrastructure. Firstly, new or modified installations are required due to the harsh characteristics of the climate, or changes in the climate requiring additional measures or remediation. Secondly, as climate change occurs, (i.e., warming temperatures, sea level rise), a significant amount of infrastructure will become vulnerable to damage or destruction. With this in mind, it would be expected that in areas where the climate is particularly harsh, or highly variable, the level of dependence on infrastructure would be higher. Further research is required to confirm whether this is the case, and how strong the correlation is between individual climate characteristics and infrastructure requirements. This information would be helpful in assisting cities to prioritize and emphasize key future research.
4.5.2. Storm Water and Economic
Similar to the relationship between Climate and Infrastructure, Storm Water and Economic focus areas share a cause-impact based relationship. Where storm water and storm surge events take place, economic implications are often dominant. The economic implications may include capital costs of infrastructure installations, such as drainage components, upgrades, and specific engineering solutions. Ongoing costs may also include those relating to infrastructure maintenance, servicing costs, and so on. An assumption may be made towards storm water and economic areas having a moderately positive lineal relationship; the more storm water presents as an issue in a city, the higher the economic impacts would be. This is expected to explain the correlation/relationship that was detected among the reviewed articles.
4.5.3. Planning/Policy and Quality/Performance of Green Infrastructure
Robust discussions that lead to quality outcomes seldom occur be chance. Quality decisions, progression, and improvements are largely at the behest of planning and policy development, as well as the professional execution. With this in mind, it may come as no surprise that Planning/Policy and Quality/Performance of Green Infrastructure showed a strong correlation. It may be considered that the higher the positive correlation, the more advanced the research field, and the more advanced the on-ground impact may be; however, this would require verification and further research to verify.
4.5.4. Public Open Space and Economic
Public open spaces, in their various forms, are considered to be GI assets constructed for many purposes spanning mental and physical heath improvements, an increased quality of life, provision of educational opportunities, contribution to amenity, providing an array of environmental outcomes, and more. These spaces, at great expense, are owned, managed and/or maintained by various authorities; local, state, and federal government agencies, as well as private entities. Land, infrastructure, servicing, maintenance, upgrades, and insurances all contribute to the high cost associated with acquiring and maintain public open spaces. Consideration to this, it is no surprise that these two focus areas are significantly correlated. Further research that may be of value is to better define this relationship in terms of which aspects of public open space and which aspects of the economic area are correlated. This may reveal interesting and valuable trends in what researchers are interested in as well as what the industry is demanding. Further research may also include the differing social value on specific spa es and how this may or may not be aligned with economic value and financial investment.
4.5.5. Public Open Space and Quality/Performance of Green Infrastructure
Public open spaces may be one of the most commonly referred to forms of GI. Public open spaces range significantly in both form and function, each with the ability to significantly impact upon the quality and performance of such spaces. The statistically significant relationship between Public Open Space and Quality/Performance of Green Infrastructure indicates shows that public opens spaces feature prominently in the GI research space, particularly with respect to how these spaces are performing and how they are meeting quality markers. This relationship indicates that attempts have been made in assessments (or potentially increase) in the quality and performance of GI assets, with particular emphasis here on public open spaces. To draw further conclusions from this relationship, further interrogation of this data, as well as further broad research enquiry, would be required.
4.6. Visual Representation
The word cloud produced and displayed in the Results is a visual representation of key words used within the abstracts of all analyzed articles (n = 171). The purpose of the word cloud is to show the most prominent words chosen in an easily understandable and relatable way. This technique is employed in a range of fields and for a variety of reasons. Most noteworthy with this representation are the prominent use of the words urban, planning, ecosystem, services, study, management, area, and water. These key words go some way towards painting a picture of where the research area sits around GI, and reinforce the results seen within the focus area analysis. The replication of results using different techniques must be acknowledged, with respect to increasing the confidence level of findings.
5. Conclusions
Green infrastructure plays many roles in highly urbanized settings. Increasing the wide understanding and acceptance of these roles is paramount for assigning appropriate GI values, as well as appropriate GI implementation rates. This systematic review is believed to be the first to have been undertaken specifically on GI, and has provided an overview of current GI knowledge, gaps in GI knowledge, and some developing research trends within what is as fairly new discipline.
Vagueness and ambiguity around GI research terms and concepts can significantly impact upon the progress and efficacy of a particular research area. It is clear that the vagueness and ambiguity of the term ‘Green Infrastructure’ has contributed to its humble beginnings, and may still contribute to its modest research presence, prominence, and implementation rates. Concerted efforts should be made by GI researchers to remain clear and consistent among publications for the betterment of the research discipline.
Research rates of publication are increasing exponentially. This is expected to continue, with the benefit of this trend being a wider breadth and depth of findings and content being made available to decision makers and planners, leading to an increase in the utilization of GI assets in response to the various social, environmental, and economic challenges both at present and in future.
Specifically, within this review, the majority of GI research emerged from the United States, Australia, and the United Kingdom (approximately 60%). The majority of research was also produced from cities within the Temperate and Snow climate classification band. This being the case, there is a biasing element which limits the assumptions and learnings that could otherwise be applied globally. This is likely one of the largest research gaps of the discipline, as climate plays a large role in the influence and/or exacerbation of social, environment, and economic challenges. It is recommended that researchers based in the Asian and South American continents consider how GI is applicable, relevant, and viable in their respective local contexts. This research would serve to close the gap of uneven geographical distribution (and the associated knowledge restrictions).
While the GI research discipline is firmly dominated by the foci of planning, policy, environmental and social aspects, its focus could be expanded to consider broader contexts which may be associated with GI. As an expansive network of assets, much of GI’s value is believed to remain uncovered. It is thought that in the joint plight against increasing social, economic, and environmental pressures, GI may be a cost-effective solution in a wide range of applications.
Supplementary Materials
The following are available online at https://www.mdpi.com/2071-1050/11/11/3182/s1, Table S1. Article classification reporting with authors of papers, Table S2. Article focus area/s reporting information by author, Reference list of all authors with papers included in the review but not used within the text.
Author Contributions
Conceptualization, J.P.; methodology, J.P.; formal analysis, J.P; writing—original draft preparation, J.P.; writing—review and editing, J.P. and M.E.Z.d.B.; supervision, M.E.Z.d.B.
Funding
This research received no external funding.
Acknowledgments
Conflicts of Interest
The authors declare no conflict of interest.
References
- Beyond Petroleum. BP Statistical Review of World Energy, 67th ed. June 2018. Available online: https://www.bp.com/content/dam/bp/business-sites/en/global/corporate/pdfs/energy-economics/statistical-review/bp-stats-review-2018-full-report.pdf (accessed on 9 February 2019).
- United States Environmental Protection Agency. Global Greenhouse Gas Emissions Data. Available online: https://www.epa.gov/ghgemissions/global-greenhouse-gas-emissions-data (accessed on 9 February 2019).
- Global Carbon Atlas. CO2 Emissions. Available online: http://www.globalcarbonatlas.org/en/CO2-emissions (accessed on 9 February 2019).
- Sperling, D.; Gordon, D. Two Billion Cars: Driving Toward Sustainability; Oxford University Press: New York, NY, USA, 2009. [Google Scholar]
- Statista. Number of Passenger Cars and Commercial Vehicles in Use Worldwide from 2006 to 2015 in (1000 units). Available online: https://www.statista.com/statistics/281134/number-of-vehicles-in-use-worldwide/ (accessed on 9 February 2019).
- World Health Organization. Registered Vehicles Data by County. Available online: http://apps.who.int/gho/data/node.main.A995 (accessed on 9 February 2019).
- World Population Review. 2019 World Population by Country. Available online: http://worldpopulationreview.com/ (accessed on 9 February 2019).
- NASA. NASA Scientists Relate Urban Population to Air Pollution. Available online: https://www.nasa.gov/content/goddard/nasa-scientists-relate-urban-population-to-air-pollution (accessed on 9 February 2019).
- Soltani, A.; Sharifi, E. Daily variation of urban heat island effect and its correlations to urban greenery: A case study of Adelaide. Front. Archit. Res. 2017, 6, 529–538. [Google Scholar] [CrossRef]
- Khan, A.A. Why would sea-level rise for global warming and polar ice-melt? Geosci. Front. 2019, 10, 481–494. [Google Scholar] [CrossRef]
- Pickering, C.M.; Byrne, J. The benefits of publishing systematic quantitative literature reviews for PhD. candidates and other early career researchers. High Educ. Res. Dev. 2013, 33, 534–548. [Google Scholar] [CrossRef]
- Met Office. Weather and Climate Guide. Available online: https://www.metoffice.gov.uk/binaries/content/assets/mohippo/pdf/4/d/weather_and_climate_guide.pdf (accessed on 9 February 2019).
- Blais, L. The legitimate reach of the environmental revolution. Harv. J. Lawn Public Policy 2014, 37, 13–22. [Google Scholar]
- Scheuler, T. Controlling Urban Runoff: A Practical Manual for Planning and Designing Urban BMPs; Metropolitan Washington Council of Governments: Washington, DC, USA, 1987.
- Naumann, S.; McKenna, D.; Kaphengst, T.; Pieterse, M.; Rayment, M. Design, Implementation and Cost Elements of Green Infrastructure Projects; Final Report to the European Commission; Ecologic Institute and GHK Consulting: Overland Park, KS, USA, 2011; Available online: http://ec.europa.eu/environment/enveco/biodiversity/pdf/GI_DICE_FinalReport.pdf (accessed on 9 February 2019).
- Ashley, R.M.; Nowell, R.; Gersonius, B.; Walker, L. Surface Water Management and Urban Green Infrastructure: A Review of Potential Benefits and UK and International Practices; Foundation for Water Research: Buckinghamshire, UK, 2011. [Google Scholar]
- Foster, J.; Lowe, A.; Winkelman, S. The Value of Green Infrastructure for Urban Climate Adaptation; Centre for Clean Air Policy: Washington, DC, USA, 2011; Available online: http://ccap.org/assets/The-Value-of-Green-Infrastructure-for-Urban-Climate-Adaptation_CCAP-Feb2011.pdf (accessed on 9 February 2019).
- Norton, B.A.; Coutts, A.M.; Livesley, S.J.; Harris, R.J.; Hunter, A.M.; Williams, N.S. Planning for cooler cities: A framework to prioritise green infrastructure to mitigate high temperatures in urban landscapes. Landsc. Urban Plan. 2015, 134, 127–138. [Google Scholar] [CrossRef]
- Ramstien, G. Climates of the earth and cryosphere evolution. Surv. Geophys. 2011, 30, 329–350. [Google Scholar] [CrossRef]
- Mell, I.C. Green infrastructure: Reflections on past, present and future praxis. Landsc. Res. 2017, 42, 135–145. [Google Scholar] [CrossRef]
- Tzoulas, K.; Korpela, K.; Venn, S.; Yli-Pelkonen, V.; Kaźmierczak, A.; Niemela, J.; James, P. Promoting ecosystem and human health in urban areas using green infrastructure: A literature review. Landsc. Urban Plan. 2007, 81, 167–178. [Google Scholar] [CrossRef]
- Burley, B.A. Green infrastructure and violence: Do new street trees mitigate violent crime? Health Place 2018, 54, 43–49. [Google Scholar] [CrossRef]
- Suppakittpaisarn, P.; Jiang, X.; Sullivan, W.C. Green infrastructure, green stormwater infrastructure, and human health: A review. Curr. Landsc. Ecol. Rep. 2017, 2, 96–110. [Google Scholar] [CrossRef]
- Parker, J.; Simpson, G.D. Visitor satisfaction with a public green infrastructure and urban nature space in Perth, Western Australia. Land 2018, 7, 159. [Google Scholar] [CrossRef]
- Parker, J. A Survey of Park User Perception in the Context of Green Space and City Liveability: Lake. Claremont, Western Australia. Master’s Thesis, Murdoch University, Perth, Australia, 2017. [Google Scholar]
- Cameron, R.W.F.; Blanuˇsa, T.; Taylor, J.E.; Salisbury, A.; Halstead, A.J.; Henricot, B.; Thompson, K. The domestic garden—Its contribution to urban green infrastructure. Urban For. Urban Green. 2012, 11, 129–137. [Google Scholar] [CrossRef]
- Mekala, G.D.; Jones, R.N.; MacDonald, D.H. Valuing the benefits of creek rehabilitation: Building a business case for public investments in urban green infrastructure. J. Environ. Manag. 2014, 55, 1354–1365. [Google Scholar] [CrossRef] [PubMed]
- Mathey, J.; Rößler, S.; Banse, J.; Lehmann, I.; Bräuer, A. Brownfields as an element of green infrastructure for implementing ecosystem services into urban areas. J. Urban Plan. Dev. 2015, 141, 1–13. [Google Scholar] [CrossRef]
- Heckert, M.; Rosan, C.D. Creating GIS-based planning tools to promote equity through green Infrastructure. Front. Built Environ. 2018, 4, 1–5. [Google Scholar] [CrossRef]
- Lovell, S.T.; Taylor, J.R. Supplying urban ecosystem services through multifunctional green infrastructure in the United States. Landsc. Ecol. 2013, 28, 1447–1463. [Google Scholar] [CrossRef]
- Tiwary, A.; Williams, I.D.; Heidrich, O.; Namdeo, A.; Bandaru, V.; Calfapietra, C. Development of multi-functional streetscape green infrastructure using a performance index approach. Environ. Pollut. 2016, 208, 209–220. [Google Scholar] [CrossRef] [Green Version]
- Sarkara, S.; Butcher, J.B.; Johnson, T.E.; Clark, C.M. Simulated sensitivity of urban green infrastructure practices to climate change. Earth Interact. 2018, 22, 1–37. [Google Scholar] [CrossRef]
- Wang, Y.; Bakker, F.; de Groot, R.; Wörtche, H. Effect of ecosystem services provided by urban green infrastructure on indoor environment: A literature review. Build. Environ. 2014, 77, 88–100. [Google Scholar] [CrossRef]
- Pugh, T.A.M.; MacKenzie, R.; Whyatt, J.D.; Hewitt, N. Effectiveness of green infrastructure for improvement of air quality in urban street canyons. Environ. Sci. Technol. 2012, 46, 7692–7699. [Google Scholar] [CrossRef]
- Jayasooriya, V.M.; Ng, A.W.M.; Muthukumaran, S.; Perera, B.J.C. Green infrastructure practices for improvement of urban air quality. Urban For. Urban Green. 2017, 21, 34–47. [Google Scholar] [CrossRef]
- Chen, Y.; Whalley, A. Green infrastructure: The effects of urban rail transit on air quality. Am. Econ. J. Econ. Policy 2012, 4, 58–97. [Google Scholar] [CrossRef]
- Meerow, S.; Newell, J.P. Spatial planning for multifunctional green infrastructure: Growing resilience in Detroit. Landsc. Urban Plan. 2017, 159, 62–75. [Google Scholar] [CrossRef]
- Li, C.; Peng, C.; Chiang, P.; Cai, Y.; Wang, X.; Yang, Z. Mechanisms and applications of green infrastructure practices for stormwater control: A review. J. Hydrol. 2018, 568, 626–637. [Google Scholar] [CrossRef]
- Roe, M.; Mell, I. Negotiating value and priorities: Evaluating the demands of green infrastructure development. J. Environ. Plan. Manag. 2013, 56, 650–673. [Google Scholar] [CrossRef]
- Kousky, C.; Olmstead, S.M.; Walls, M.A.; Macauley, M. Strategically placing green infrastructure: Cost-effective land conservation in the floodplain. Environ. Sci. Technol. 2013, 47, 3563–3570. [Google Scholar] [CrossRef] [PubMed]
- Jayasooriya, V.M.; Ng, A.W.M. Tools for modeling of stormwater management and economics of green infrastructure practices: A review. Water Air Soil Pollut. 2014, 225, 2055–2246. [Google Scholar] [CrossRef]
- Zidar, K.; Belliveau-Nance, M.; Cucchi, M.; Denk, D.; Kricun, A.; O’Rourke, S.; Rahman, S.; Rangarajan, S.; Rothstein, E.; Shih, J.; et al. A Framework for Multifunctional Green Infrastructure Investment in Camden, NJ. Urban Plan. 2017, 2, 56–73. [Google Scholar] [CrossRef] [Green Version]
- Law, E.P.; Diemont, S.; Toland, T.R. A sustainability comparison of green infrastructure interventions using emergy evaluation. J. Clean. Prod. 2017, 145, 374–385. [Google Scholar] [CrossRef]
- Spatari, S.; Yu, Z.; Montalto, F.A. Life cycle implications of urban green infrastructure. Environ. Pollut. 2011, 159, 2174–2179. [Google Scholar] [CrossRef]
- Semeraro, T.; Pomes, A.; Del Giudice, C.; Negro, D.; Aretano, R. Planning ground based utility scale solar energy as green infrastructure to enhance ecosystem services. Energy Policy 2018, 117, 218–227. [Google Scholar] [CrossRef]
- Marušić, B.G. Social behaviour as a basis for the design and development of green infrastructure. Urbani Izziv 2015, 26, 130–149. [Google Scholar]
- Shafer, C.S.; Scott, D.; Baker, J.; Winemiller, K. Recreation and amenity values of urban stream corridors: Implications for green infrastructure. J. Urban Des. 2013, 18, 478–493. [Google Scholar] [CrossRef]
Figure 1.
Preferred Reporting Items for Systematic Reviews (PRISMA) expression of the systematic literature review. * denotes two articles deemed relevant but were not available on the search date due to recent publication.
Figure 1.
Preferred Reporting Items for Systematic Reviews (PRISMA) expression of the systematic literature review. * denotes two articles deemed relevant but were not available on the search date due to recent publication.

Figure 2.
Annual publication rates of peer-reviewed articles with Green Infrastructure included in the title without a year restriction (n = 171).
Figure 2.
Annual publication rates of peer-reviewed articles with Green Infrastructure included in the title without a year restriction (n = 171).

Figure 3.
Geographical distribution by country of peer-reviewed articles with Green Infrastructure in the title, excluding those with authors from two or more countries and those that did not disclose a publication location (n = 130).
Figure 3.
Geographical distribution by country of peer-reviewed articles with Green Infrastructure in the title, excluding those with authors from two or more countries and those that did not disclose a publication location (n = 130).

Figure 4.
Geographical distribution by city of peer-reviewed articles with Green Infrastructure in the title, excluding those that with authors from two or more countries and those that did not disclose a publication location (n = 83).
Figure 4.
Geographical distribution by city of peer-reviewed articles with Green Infrastructure in the title, excluding those that with authors from two or more countries and those that did not disclose a publication location (n = 83).

Figure 5.
Köppen climate zone map employed to record climate zone of publications. Image courtesy of The Sustainability Council.
Figure 5.
Köppen climate zone map employed to record climate zone of publications. Image courtesy of The Sustainability Council.

Figure 6.
Rate of reporting (± 95% confidence intervals of the proportions) of climate category publications.
Figure 6.
Rate of reporting (± 95% confidence intervals of the proportions) of climate category publications.

Figure 7.
Rate of reporting (± 95% confidence intervals of the proportions) of article type category publications. Percentages add to greater than 100% because articles transecting multiple categories were recorded in all applicable categories.
Figure 7.
Rate of reporting (± 95% confidence intervals of the proportions) of article type category publications. Percentages add to greater than 100% because articles transecting multiple categories were recorded in all applicable categories.

Figure 8.
Rate of reporting (± 95% confidence intervals of the proportions) of focus area among publications. Percentages add to greater than 100% because articles transecting multiple categories were recorded in all applicable categories.
Figure 8.
Rate of reporting (± 95% confidence intervals of the proportions) of focus area among publications. Percentages add to greater than 100% because articles transecting multiple categories were recorded in all applicable categories.

Figure 9.
Word cloud produced from the 171 peer-reviewed articles’ abstract text.

Figure 10.
Correlation values for testing group trends between article focus areas.


Table 1.
Health and wellbeing benefits provided by green infrastructure and example references.
| Benefit | Example References |
|---|---|
| Improved mental health | Burley, 2018 [20]; Suppakittpaisarn et al. 2017 [21]; Parker & Simpson 2018 [22]; Parker, 2017 [23]; Camerona et al. 2012 [24]; Mekala et al. 2014 [25]; Tzoulas et al. 2007 [19]; Mathey et al. 2015 [26]; Heckert & Rosan, 2018 [27]. |
| Improved physical health | Suppakittpaisarn et al. 2017 [21]; Camerona et al. 2012 [24]; Mekala et al. 2014 [25]; Tzoulas et al. 2007 [19]; Mathey et al. 2015 [26]; Heckert & Rosan, 2018 [27]. |
| Improved cognitive recovery | Suppakittpaisarn et al. 2017 [21]; Tzoulas et al. 2007 [19]. |
| Increased productivity | Suppakittpaisarn et al. 2017 [21]; Tzoulas et al. 2007 [19]. |
| Reduction in stress | Suppakittpaisarn et al. 2017 [21]; Camerona et al. 2012 [24]; Tzoulas et al. 2007 [19]. |
Table 2.
Environmental benefits provided by green infrastructure and example references.
| Benefit | Example References |
|---|---|
| Carbon sequestration | Lovell & Taylor, 2013 [28]; Heckert & Rosan, 2018 [27]; Tiwary et al. 2016 [29]; Sarkara et al. 2018 [30]; Mekala et al. 2014 [25]. |
| Increase in biodiversity | Lovell & Taylor, 2013 [28]; Camerona et al. 2012 [24]; Tzoulas et al. 2007 [19]; Mathey et al. 2015 [26]; Norton et al. 2015 [16]. |
| Improved air quality | Camerona et al. 2012 [24]; Norton et al. 2015 [16]; Wang et al. 2014 [31]; Pugh et al. 2012 [32]; Jayasooriya et al. 2017 [33]; Chen & Whalley, 2012 [34]. |
| Habitat opportunities | Camerona et al. 2012 [24]; Tzoulas et al. 2007 [19]; Mathey et al. 2015 [26]; Norton et al. 2015 [16]; Meerow & Newell, 2017 [35]. |
| Food source | Camerona et al. 2012 [24]; Tzoulas et al. 2007 [19]; Mathey et al. 2015 [26]; Norton et al. 2015 [16]; Meerow & Newell, 2017 [35]. |
| Climate mediation | Lovell & Taylor, 2013 [28]; Li et al. 2018 [36]; Roe & Mell, 2013 [37]; Norton et al. 2015 [16]; Mathey et al. 2015 [26]. |
Table 3.
Economic benefits provided by green infrastructure and example references.
| Benefit | Example References |
|---|---|
| Cheaper than alternatives in capital cost | Kousky et al. 2013 [38]; Jayasooriya & Ng, 2014 [39]; Mekala et al. 2014 [25]; Zidar et al. 2017 [40]; Law et al. 2017 [41]. |
| Cheaper than alternatives in operational cost | Kousky et al. 2013 [38]; Jayasooriya & Ng, 2014 [39]; Mekala et al. 2014 [25]; Law et al. 2017 [41]. |
| Reduced energy usage | Law et al. 2017 [41]; Tiwary et al. 2016 [29]; Wang et al. 2014 [31]; Spatari et al. 2011 [42]; Semeraro et al. 2018 [43]. |
Table 4.
Social benefits provided by green infrastructure and example references.
| Benefit | Example References |
|---|---|
| Increased social cohesion | Marušić, 2015 [44]. |
| Increased amenity | Shafer et al. 2013 [45]; Parker & Simpson 2018 [22]; Parker, 2017 [23]. |
| Reduced crime | Burley, 2018 [20]; Suppakittpaisarn et al. 2017 [21]. |
Table 5.
Article descriptors for peer-reviewed articles.
| Data Marker | Data Type | Description |
|---|---|---|
| Paper ID | Numeric | Identification numbers assigned 1–171 to catalogue research throughout the review process. |
| Author/s | Text | Names of authors as they appear on the article |
| First In-text Reference | Text | In-text reference as it appeared in the associated Review Article |
| Subsequent In-text Reference | Text | Subsequent in-text reference as it appeared in the Review Article |
| End-text Reference | Text | End-text reference as it appeared in the Review Article |
| Year | Date | Year of publication |
| Title | Text | Title of article |
| Journal Title | Text | Title of publishing journal |
| Volume, Issue, Pages | Numeric | Volume, issue and page numbers of articles as they appeared on the article |
Table 6.
Geographical data for peer-reviewed articles.
| Data Marker | Data Type | Description |
|---|---|---|
| Macro Publication Location | Categorical | 1 = Australia 2 = International (countries other than Australia) 3 = Global (broadly focused where specific countries are not indicated) |
| Country | Text | Publication country as it appeared on the article |
| Region/State | Text | Publication region/state as it appeared on the article NA = Not application NS = Not specified |
| City/Town | Text | Publication city/town as it appeared on the article NA = Not application NS = Not specified |
| Climate Category | Categorical | 1 = Equatorial |
| 2 = Arid | ||
| 3 = Mediterranean | ||
| 4 = Temperate | ||
| 5 = Snow | ||
| 6 = Polar NA = Not application NS = Not specified |
Table 7.
Article type for peer-reviewed articles.
| Article Type | Data Type | Description |
|---|---|---|
| Review Article | Categorical | 1 = Yes 0 = No |
| Research Article | Categorical | 1 = Yes 0 = No |
| Technical Article | Categorical | 1 = Yes 0 = No |
| Case Study | Categorical | 1 = Yes 0 = No |
Table 8.
Focus areas for peer-reviewed articles.
| Focus Area/s | Data Type | Description |
|---|---|---|
| Health and Wellbeing | Categorical | 1 = Yes 0 = No |
| Environmental and Ecological | Categorical | 1 = Yes 0 = No |
| Climate | Categorical | 1 = Yes 0 = No |
| Stormwater and Drainage | Categorical | 1 = Yes 0 = No |
| Planning and Policy | Categorical | 1 = Yes 0 = No |
| Public Open Space | Categorical | 1 = Yes 0 = No |
| Economic | Categorical | 1 = Yes 0 = No |
| Social | Categorical | 1 = Yes 0 = No |
| Quality and Performance of Green Infrastructure | Categorical | 1 = Yes 0 = No |
| Other | Text | Manually entered focus area that does not feature in the list above. |
Table 9.
Climate zone reporting number of papers and relative percentages contained within brackets.
Table 9.
Climate zone reporting number of papers and relative percentages contained within brackets.
| Equatorial | Arid | Mediterranean | Snow | Polar | Temperate | Total |
|---|---|---|---|---|---|---|
| 8 (8.16%) | 9 (9.18%) | 8 (8.16%) | 23 (23.47%) | Nil Nil | 50 (51.02%) | 98 (100.00%) |
© 2019 by the authors. Licensee MDPI, Basel, Switzerland. This article is an open access article distributed under the terms and conditions of the Creative Commons Attribution (CC BY) license (http://creativecommons.org/licenses/by/4.0/).
Share and Cite
MDPI and ACS Style
Parker, J.; Zingoni de Baro, M.E. Green Infrastructure in the Urban Environment: A Systematic Quantitative Review. Sustainability 2019, 11, 3182. https://doi.org/10.3390/su11113182
AMA Style
Parker J, Zingoni de Baro ME. Green Infrastructure in the Urban Environment: A Systematic Quantitative Review. Sustainability. 2019; 11(11):3182. https://doi.org/10.3390/su11113182
Chicago/Turabian StyleParker, Jackie, and Maria Elena Zingoni de Baro. 2019. "Green Infrastructure in the Urban Environment: A Systematic Quantitative Review" Sustainability 11, no. 11: 3182. https://doi.org/10.3390/su11113182
Note that from the first issue of 2016, this journal uses article numbers instead of page numbers. See further details here.