Environmental Impacts of Reusable Transport Items: A Case Study of Pallet Pooling in a Retailer Supply Chain


Department of Industrial Engineering, Alma Mater Studiorum–University of Bologna, 40136 Bologna, Italy
*
Author to whom correspondence should be addressed.
Sustainability 2019, 11(11), 3147; https://doi.org/10.3390/su11113147
Submission received: 23 April 2019
/
Revised: 23 May 2019
/
Accepted: 30 May 2019
/
Published: 4 June 2019
(This article belongs to the Special Issue Tools, Methodologies and Techniques Applied to Sustainable Supply Chains)
Abstract
:Manufacturing, storage, and transportation processes are typically facilitated by pallets, containers, and other reusable transport items (RTIs) designed to guarantee many cycles along a lifespan of several years. As a consequence, both supply and reverse transportation of RTIs need to be managed to avoid stockout along the supply chain and the unsustainable production of new tools from virgin materials. This paper focuses on the business of pallet management by analyzing the transport operations of a pallet pooling network serving a large-scale nationwide retailer. The pooler is responsible for supplying, collecting, and refurbishing pallets. The combination of the pooler’s management strategies with different retailer network configurations results in different pooling scenarios, which are assessed and compared in this paper through a what-if analysis. The logistical and environmental impacts generated by the pallet distribution activities are quantified per each scenario through a tailored software incorporating Geographic Information System (GIS) and routing functionalities. Findings from this analysis suggest how to reduce vehicle distance traveled (vehicles-km) by 65% and pollutant emissions by 60% by combining network infrastructures and pooling management strategies—identifying an empirical best practice for managers of pallet businesses.
1. Introduction
Manufacturing, storage, and transportation processes are typically facilitated by pallets, containers, and other reusable transport items (RTIs), which permeate supply chain operations [1]. As a standardized platform for unit loads, pallets are widely diffused in manufacturing facilities, warehouses and distribution centers, and stores and are thereby considered to be company assets. As they aid manufacturing and logistical operations, the number of pallets in circulation grows as countrywide economic and trade indicators (e.g., GDP) increase [2].
The management of pallets entails several processes along their life cycle and throughout logistics networks, such as production, distribution, and refurbishing. Pallets are therefore typically designed to guarantee many cycles over a lifespan of several years. According to the circular economy paradigm, the reuse of packaging and RTIs is justified to reduce waste, raw materials exploitation, associated costs, and environmental impacts [3,4]. Nevertheless, the use of RTIs is far more complex than more traditional disposable package management due to the increase of reverse logistics [5].
For this reason, managers of supply chains more often opt for the implementation of closed-loop networks (CLNs) that integrate forward distribution operations with reverse logistics, including handling, storage, and collection of reusable items [6]. In such networks, the trade-off between the emissions released by transportation and the reduction in the use of virgin materials has to be identified in order to achieve environmental sustainability targets [7,8,9]. This aim requires a deep understanding of the observed network, highlighting the crucial role of the data collection process in order to enhance the accuracy of the obtained result [10].
Scholars have already pointed out how alternative pallet management strategies across the CLNs can generate different environmental impacts associated with the whole pallet life cycle, as well as different logistical costs [11]. Among the most diffused strategies, this paper focuses on two, both based on pallet re-circulation. The first is the buy–sell program, in which an equal number of pallets received by a node of the supply chain is shipped back to the previous node through a back-haul trip. The entire pallet supply and collection process is hence assigned to the carriers or the truck fleet owners, who are implicitly responsible for balancing the overall pallet population throughout the supply chain. An improved version of this program consists of consolidating pallets and arranging full-loaded back-trips.
A second strategy, namely the pooling program, involves a new actor, the pooler, who is responsible for supplying ready-to-use pallets to vendors, manufacturers, and other logistic nodes; collecting pallets from customers or downstream; refurbishing damaged pallets; and holding inventory within its facilities until new pallet orders are placed. While the pooling program typically guarantees more efficiency than the buy–sell program (e.g., fewer pallets lost, reduction of stockout risk), it compels advanced decision-making on where to locate pooler facilities, how to set facilities’ capacities, and how to distribute transport flows (i.e., collection, inventory balancing, and supply) across the network [12]. Such decisions contribute to establishing a new reverse network able to provide pallet management services to multiple forward supply chains. Nevertheless, the way forward and pooling networks interact with each other may affect the logistical and environmental performance of a pallet management service.
These statements motivate this paper, which focuses on the assessment and comparison of the environmental impact and logistical performance caused by alternative pallet management strategies combined with different configurations of CLNs. Specifically, the two aforementioned strategies are evaluated with respect to different configurations of a retailer network operating countrywide in Italy. The combination of strategies and networks generates several logistical scenarios whose impacts are calculated through a developed GIS-driven decision support tool for the punctual calculation of the carbon footprint (CO2eq) from transportation and the vehicles-km within the network.
The outline of this paper is as follows. Section 2 briefly summarizes the literature on pallet management services to which this paper provides a novel contribution. Section 3 describes the methodology, the area of analysis, and the characteristics of the pallet management scenarios. Section 4 and Section 5 illustrate and discuss the results and summarize the findings through a multi-scenario comparison. Finally, Section 6 concludes the paper, proposing guidelines to practitioners as well as suggestions for future research.
2. Literature Review
Although pallets are widely distributed worldwide in many industrial sectors, relatively few scientific papers focus on the economic and environmental performance of pallet management services, and these are provided by a narrow group of scholars. According to Glock [1], who provided an exhaustive survey of the field, the decision support models and methods for managing RTI networks belong to four different categories (i.e., packaging system comparison, RTI return forecast, RTI inventory management, and operations management and optimization). This paper falls within the first category, which compares the performance of alternative RTI systems/scenarios. Examples of these are provided by Ray et al. [13], who compared the cost per pallet trip generated by purchasing or rental, and Carrano et al. [14], who compared the environmental impacts of three pallet management strategies, namely single-use, reusable buy–sell, and pooling strategies, over the entire pallet life cycle. They accounted for the carbon emissions released by the production, usage, refurbishing, and disposal phases and used optimization to find the optimal environmental strategy.
With respect to RTIs, Hassanzadeh Amin et al. [15] explored barriers and benefits of the reverse logistics of plastic pallets in Canada, whereas Bengtsson and Logie [16] and Carrano et al. [17] focused on wood pallets. Specifically, the latter were the first to estimate the carbon footprint of a wood pallet life cycle. Elia and Gnoni [18] used discrete-event simulation to aid in the design of a CLN for pallet management in order to meet cost and time efficiency targets. The environmental impact and the cost of pallets were measured by Bilbao et al. [11], who supported the selection of pallet management systems and of the materials composing pallets. Katephap and Limnararat [19] developed a mathematical model to calculate the cost of alternative reverse logistics arrangements and used the Life Cycle Assessment (LCA) methodology to estimate the resulting impacts on the environment.
Others have focused on optimizing pallet management operations within a CLN for pallet pooling [12]. Ren et al. [20] dealt with uncertainty while optimizing the whole pallet allocation process, including buying (leasing), distribution, repositioning, and recovery. Assuming the pooler’s perspective, Zhou et al. [21] optimized the delivery and collection routes from the pooler’s facility to the clients of the pallet management service. Tornese et al. [22] quantified the effects of repair facility location and pallet service conditions (i.e., pallet handling and loading conditions) on a pooling system in accordance with economic and environmental performance.
As underlined by Glock [1], although several analytical approaches to studying RTI systems and networks can be found in the literature, few applications of such approaches and methods in real-world scenarios have been exemplified. Among the few who have discussed the adoption of RTI in specific industrial realities, Palsson et al. [23] reported a case study of the company Volvo, assessing the cost and environmental impacts of alternative packaging systems. The reason behind this lack of real-world examples is due to the high complexity of some industrial applications, which results in a great amount of data and parameters to collect and variables to formulate. For example, the management of the transport flows in both analytical models and discrete-event simulation methods is indeed complicated by the number of arcs between the nodes of the reverse network, as well as the total number of shipments observed over a planning horizon (e.g., a year). Therefore, the impacts of transportation flows are often neglected and estimated instead of calculated.
Based on these statements, this paper exploits a tailored GIS-driven decision support tool to calculate the logistical and environmental impacts caused by the pallet usage and transportation phases in real-world integrated retailer and pallet pooling networks. A multi-scenario analysis conducted on a significant real-world case study is used to assess and identify the most sustainable network configuration and pallet management strategy. Findings from this work provide guidelines to the managers of both retailers and poolers.
3. Methods and Materials
The methodology of this study included the following steps. First, we selected a significant countrywide case study consisting of two integrated networks of a large-scale retailer and a pooler, respectively. The observed networks included more than 1500 nodes located all over Italy, where more than half of goods are transported by truck [24]. The case study was approached by drawing arcs (i.e., physical connections) between logistic nodes and by examining how these were affected by the choice of the pallet management strategy. As the analysis combined the perspectives of both the pooler and the retailer, different retailer network configurations were assessed. The combination of a pallet management strategy and a network configuration generated a scenario.
Second, an extensive data collection campaign was conducted by interfacing with the companies’ Enterprise Requirement Planning Systems (ERPs) and other data repositories of the logistic nodes of both networks. A significant horizon of analysis (i.e., 1 year) was considered. Within this, the involved network nodes’ locations, shipping documents, and loading truck records were collected. This step allowed us to build a SQL database with the aim of supporting the accounting of the transport impacts and the Key Performance Indicators (KPIs) evaluation for the scenarios.
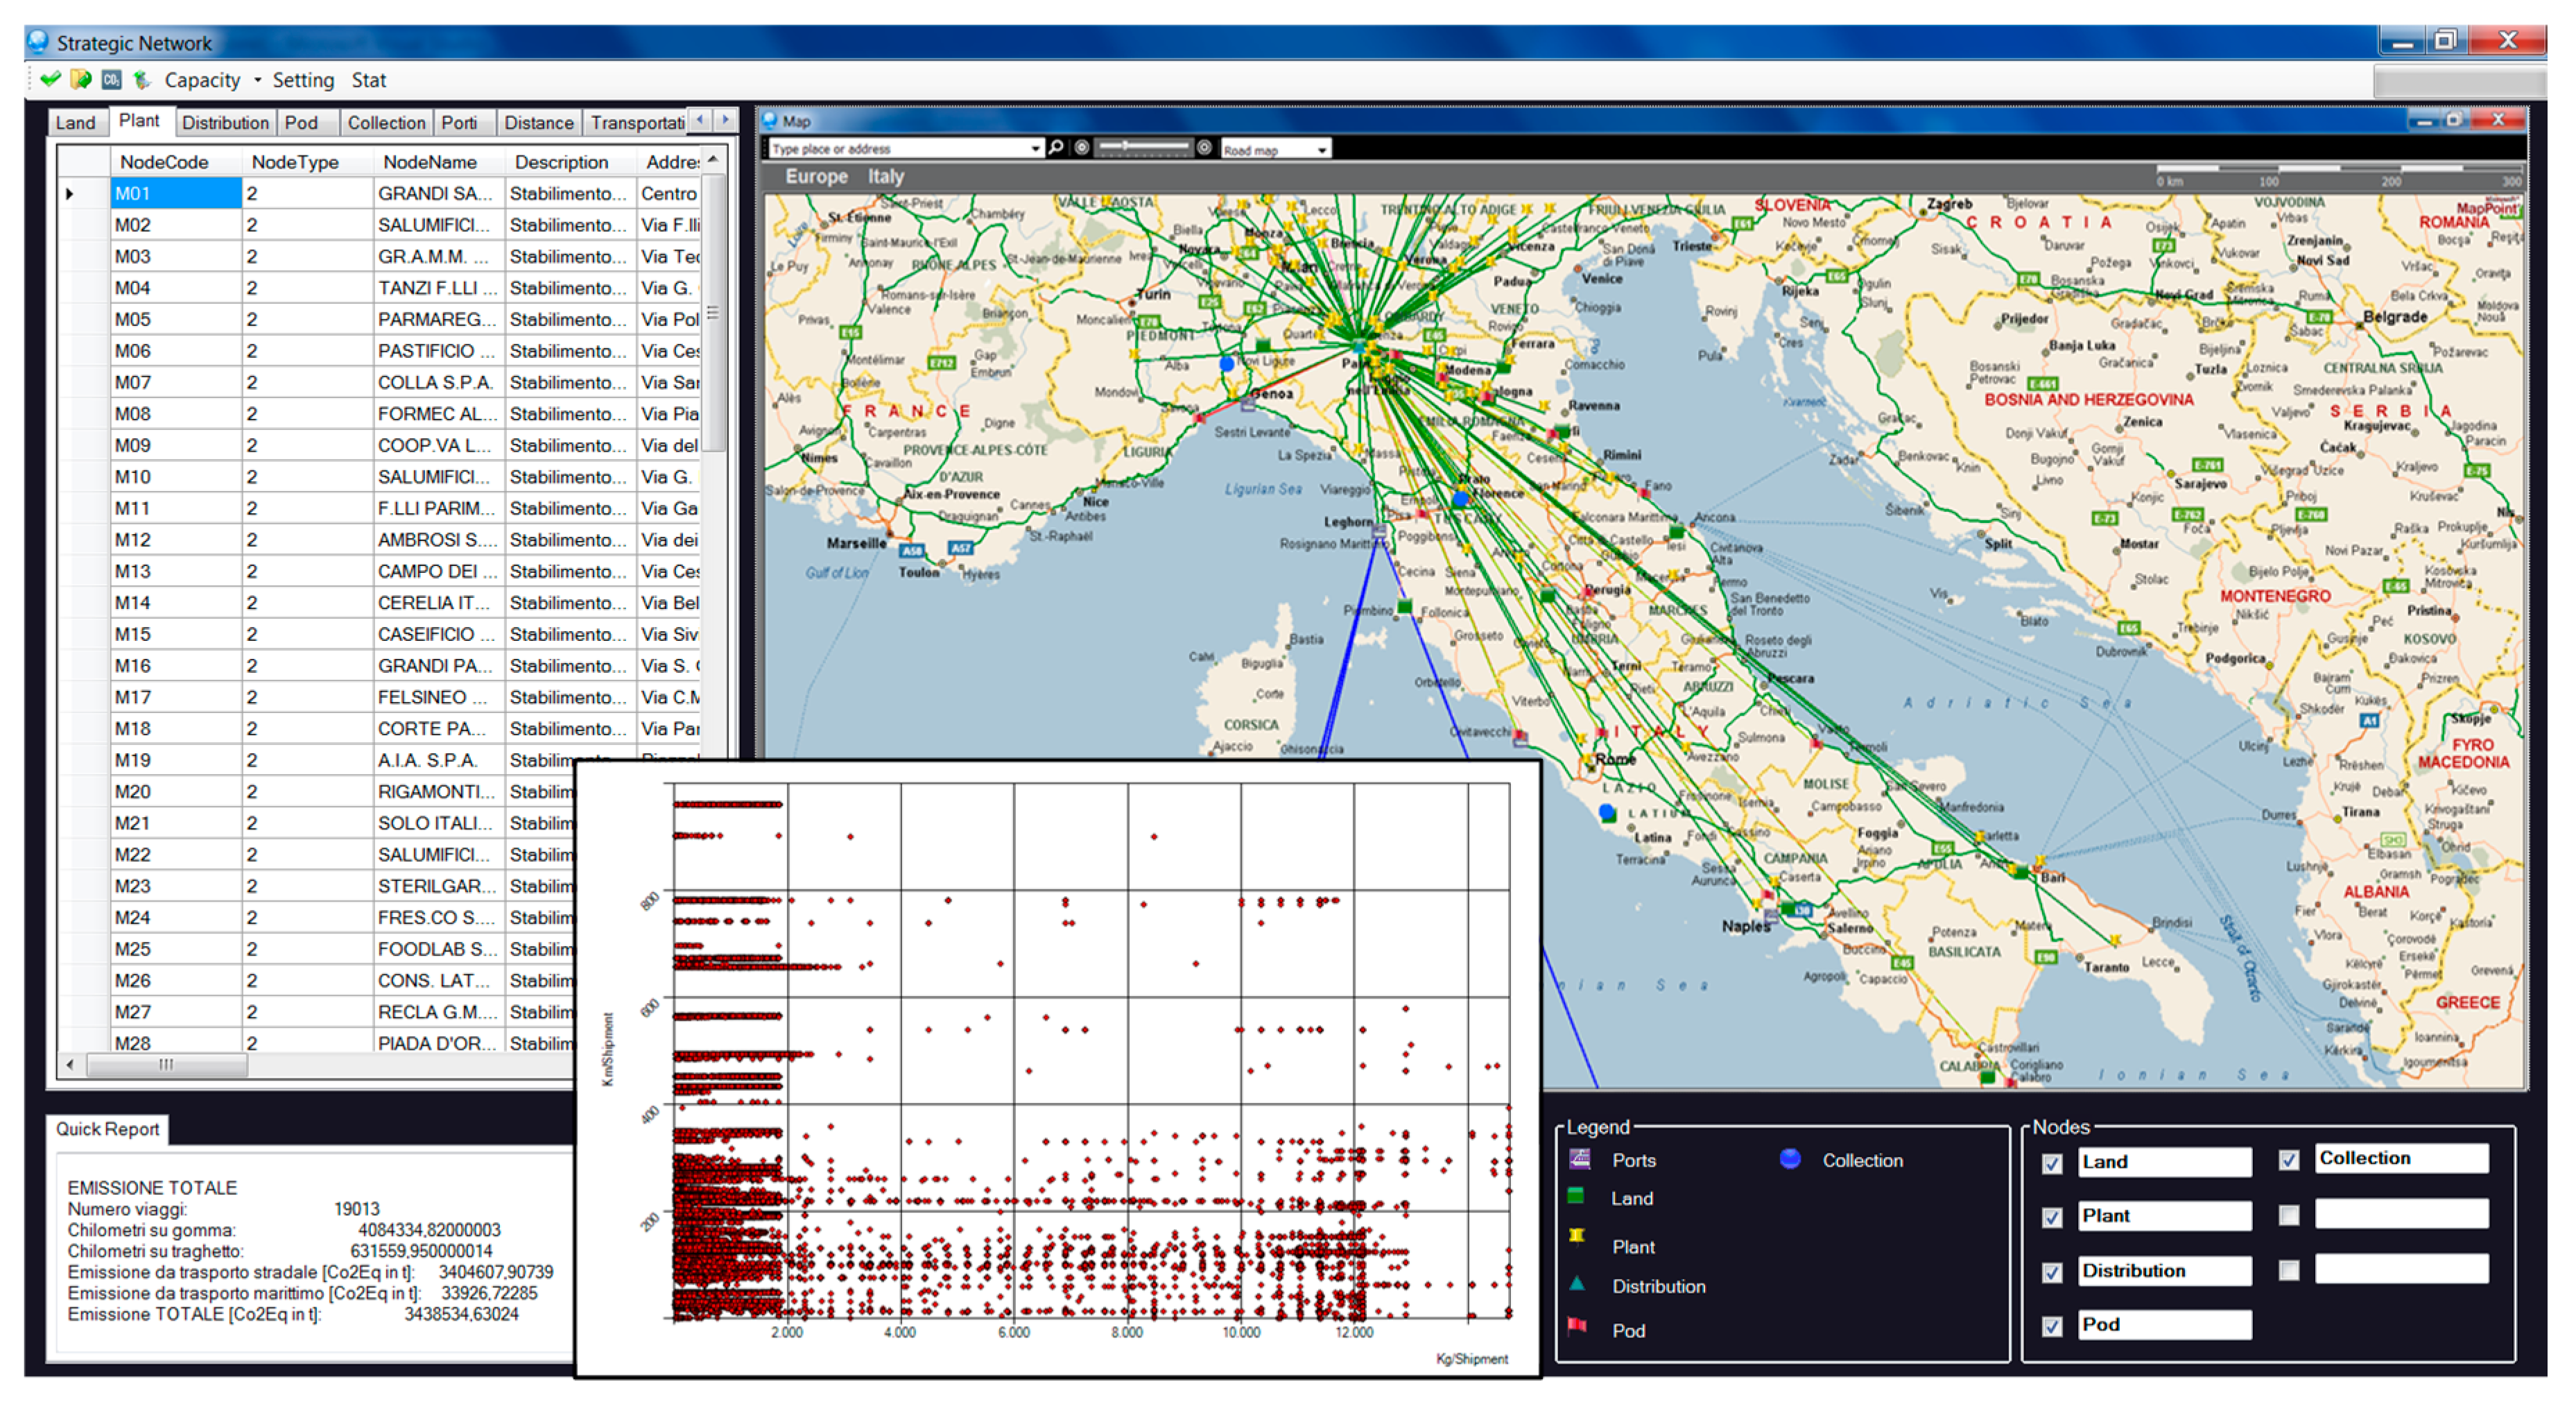
The calculation of logistical and environmental KPIs [25] was carried out through a tailored GIS-driven decision support tool developed for the scope of this study. The logistical tasks performed within the observed network were formalized and coded as ‘methods’ of the software application. This was able to interface with the SQL database and with a GIS plug-in to quantify the routing distance from each couple of nodes. The tool, written in C# .NET, was then used to virtualize the goods transport and pallet handling tasks and quantify the logistical and environmental performance of each shipment and scenario in agreement with a what-if analysis. The graphical user interface (GUI) tool is exemplified in Figure 1, whilst more details on how it was designed and the input data required are given in the work of Accorsi et al. [26]. The dot plot in the GUI of Figure 1 reports the carried load and the vehicle-km per route necessary to quantify the released greenhouse gases (GHGs) and air pollutants for each shipment.
The reminder of this section goes into detail on the generation of the scenarios and provides an overview of the data architecture.
3.1. Pallet Management Strategies and Network Configuration
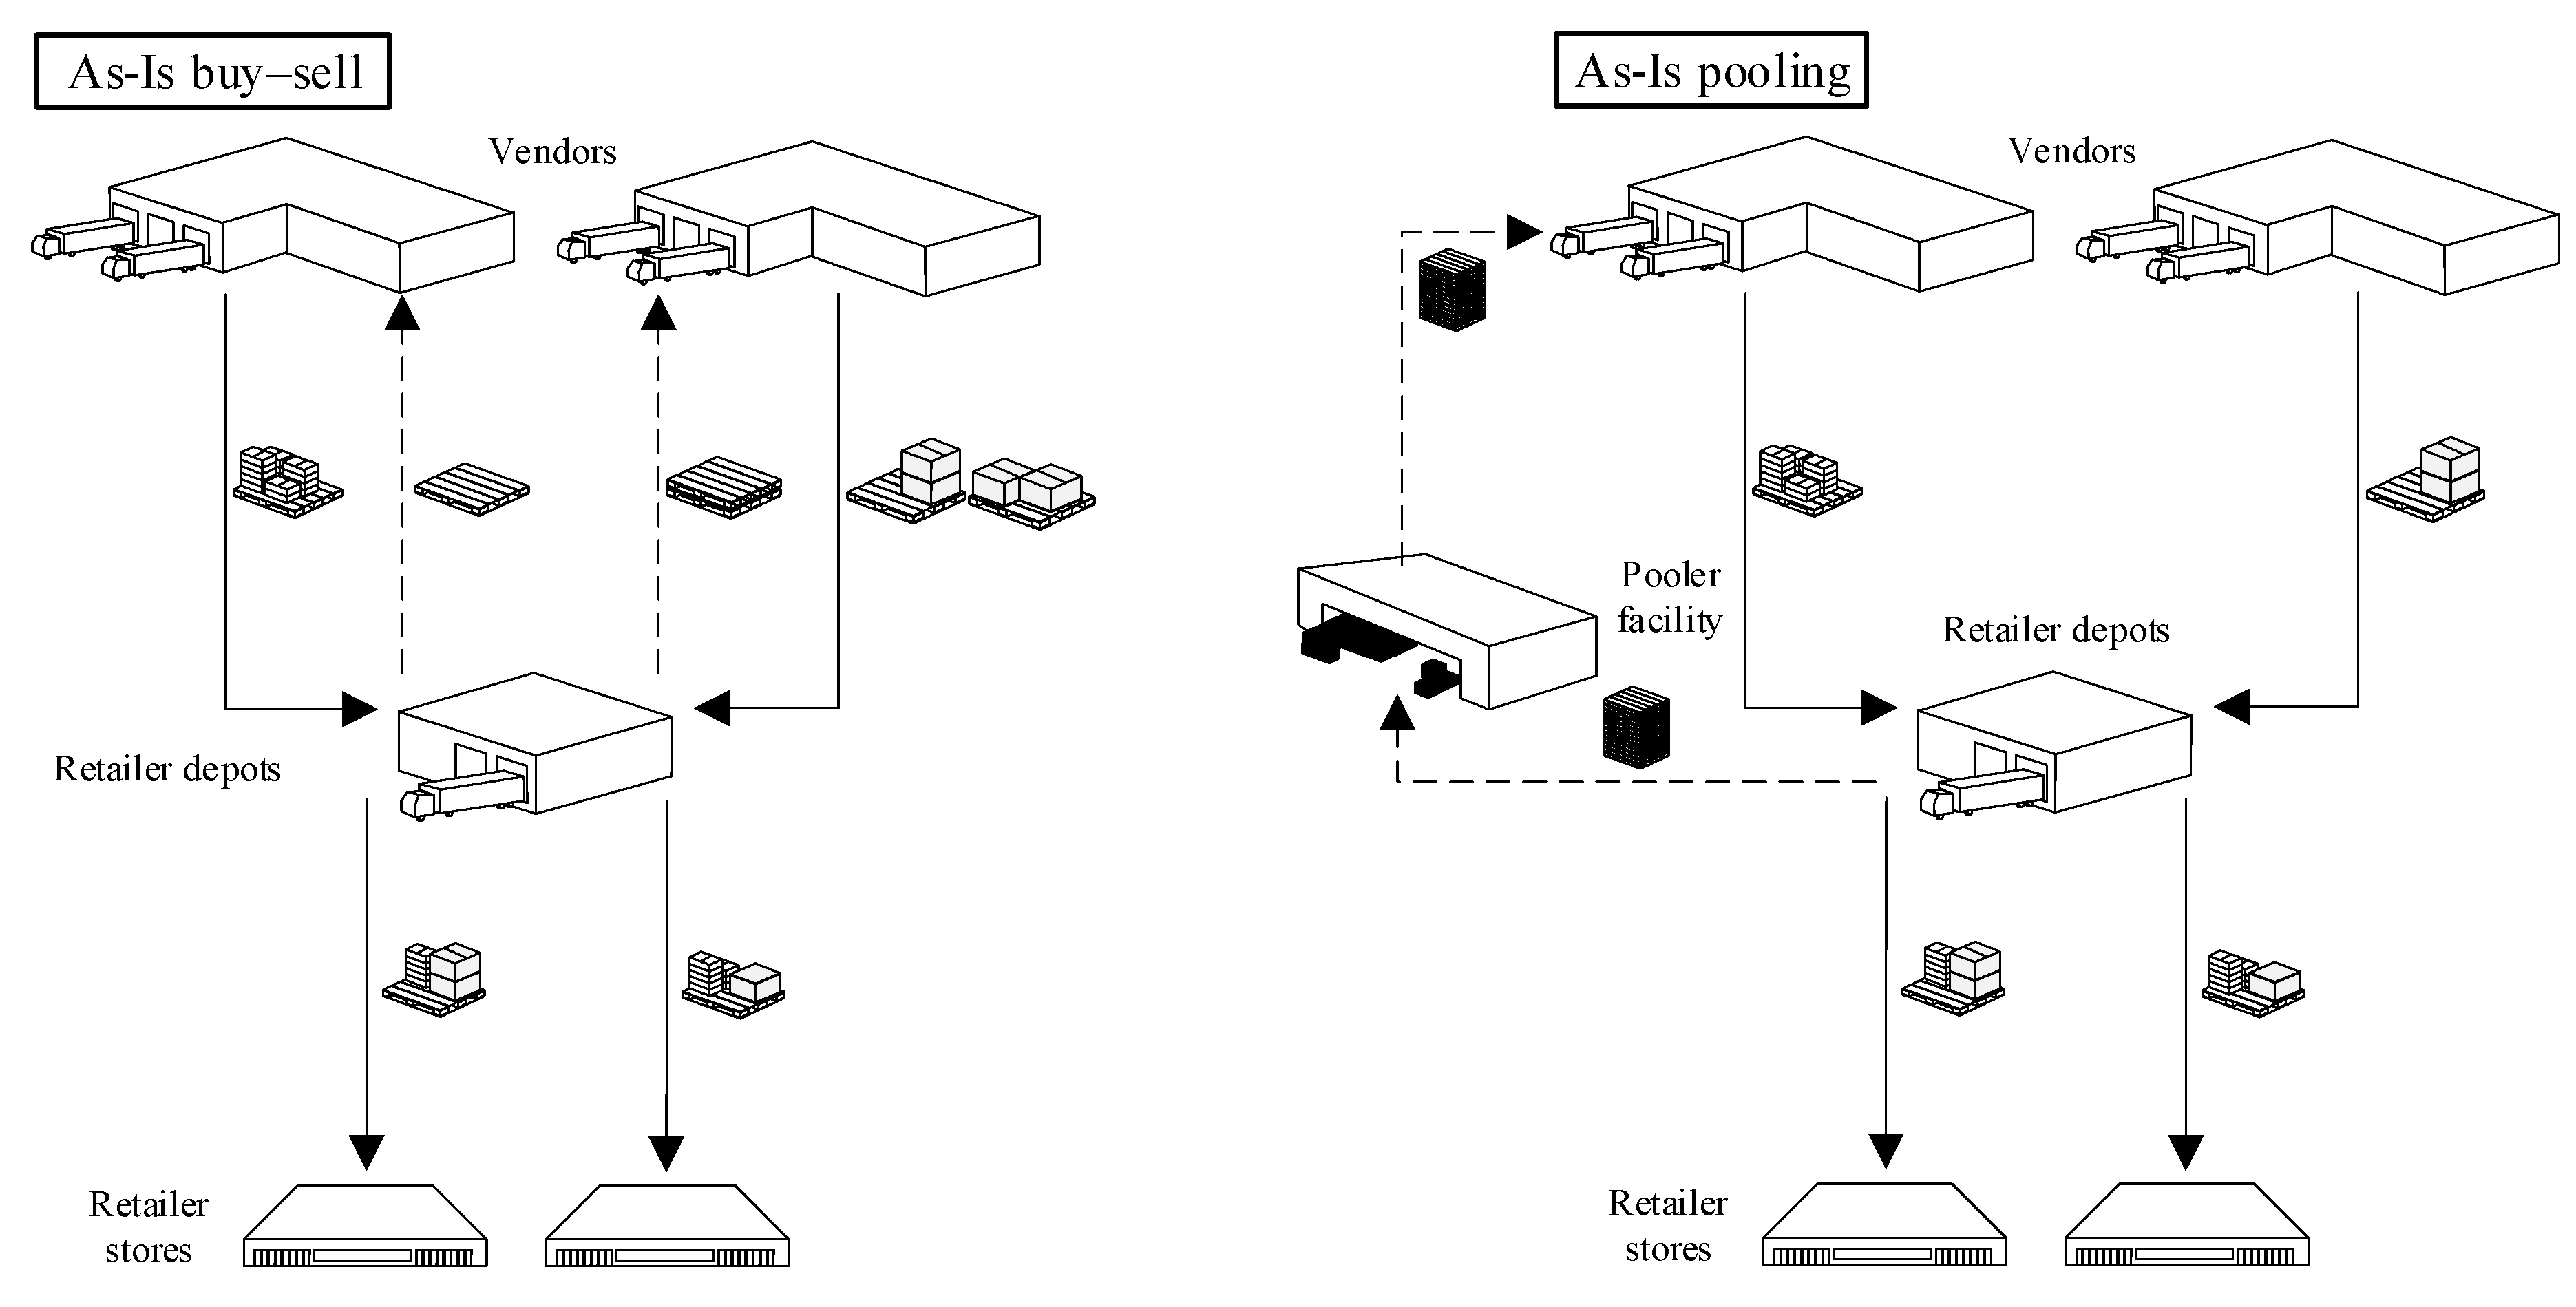
The observed retailer supply chain includes three different type of actors, as illustrated in Figure 2: the vendors (1), which supply the regional retailer depots (2) that, in turn, directly serve the retailer stores (3). The as-is pallet management strategy adopted to provide the network with the required number of pallets is the so-called extended-use or buy–sell program. This outsourced pallet management strategy makes the carriers responsible for collecting empty pallets and using back-haul trips to replenish the vendors’ stocks. According to this policy, the pallets received by a regional depot equal those shipped back to the vendors exploiting the carrier backhaul trips (see the as-is buy–sell scenario in Figure 2). As the perspective undertaken is that of the retailer, we set the boundaries of the analysis to those processes that directly affect the logistical and environmental impacts of the retailers and the vendors. We, therefore, did not include the pallet facilities owned by the carriers.
In the few last years, an alternative pallet management strategy, namely the leased pallet pooling or pooling program [20], has been adopted by the retailer supply chain (see the as-is pooling scenario in Figure 2). This develops around a pooler, who is responsible for collecting empty pallets from the retailer depots and serving the retailer supply chain. The main benefit generated by pallet pooling is the consolidation of shipments for pallet collection, which enhances truck capacity utilization. It is worth noting that, although Figure 2 and Figure 3 do not show pallets flows to and from remanufacturing facilities [27], these movements were accounted for in the analysis.
Based on these two initial pallet management strategies, beyond the vendors, retailer depots, and retailer stores, several potential actors and logistics nodes can contribute to pallet circulation throughout a retailer supply chain. These are, for instance, centralized retailer distribution centers (i.e., hubs), carriers, and pooler facilities. For this reason, the analyzed supply chain has become interested in the evaluation and benchmarking of the economic and environmental performance of alternative scenarios, which combine different pallet management strategies and network configurations.
3.2. Simulated Scenarios
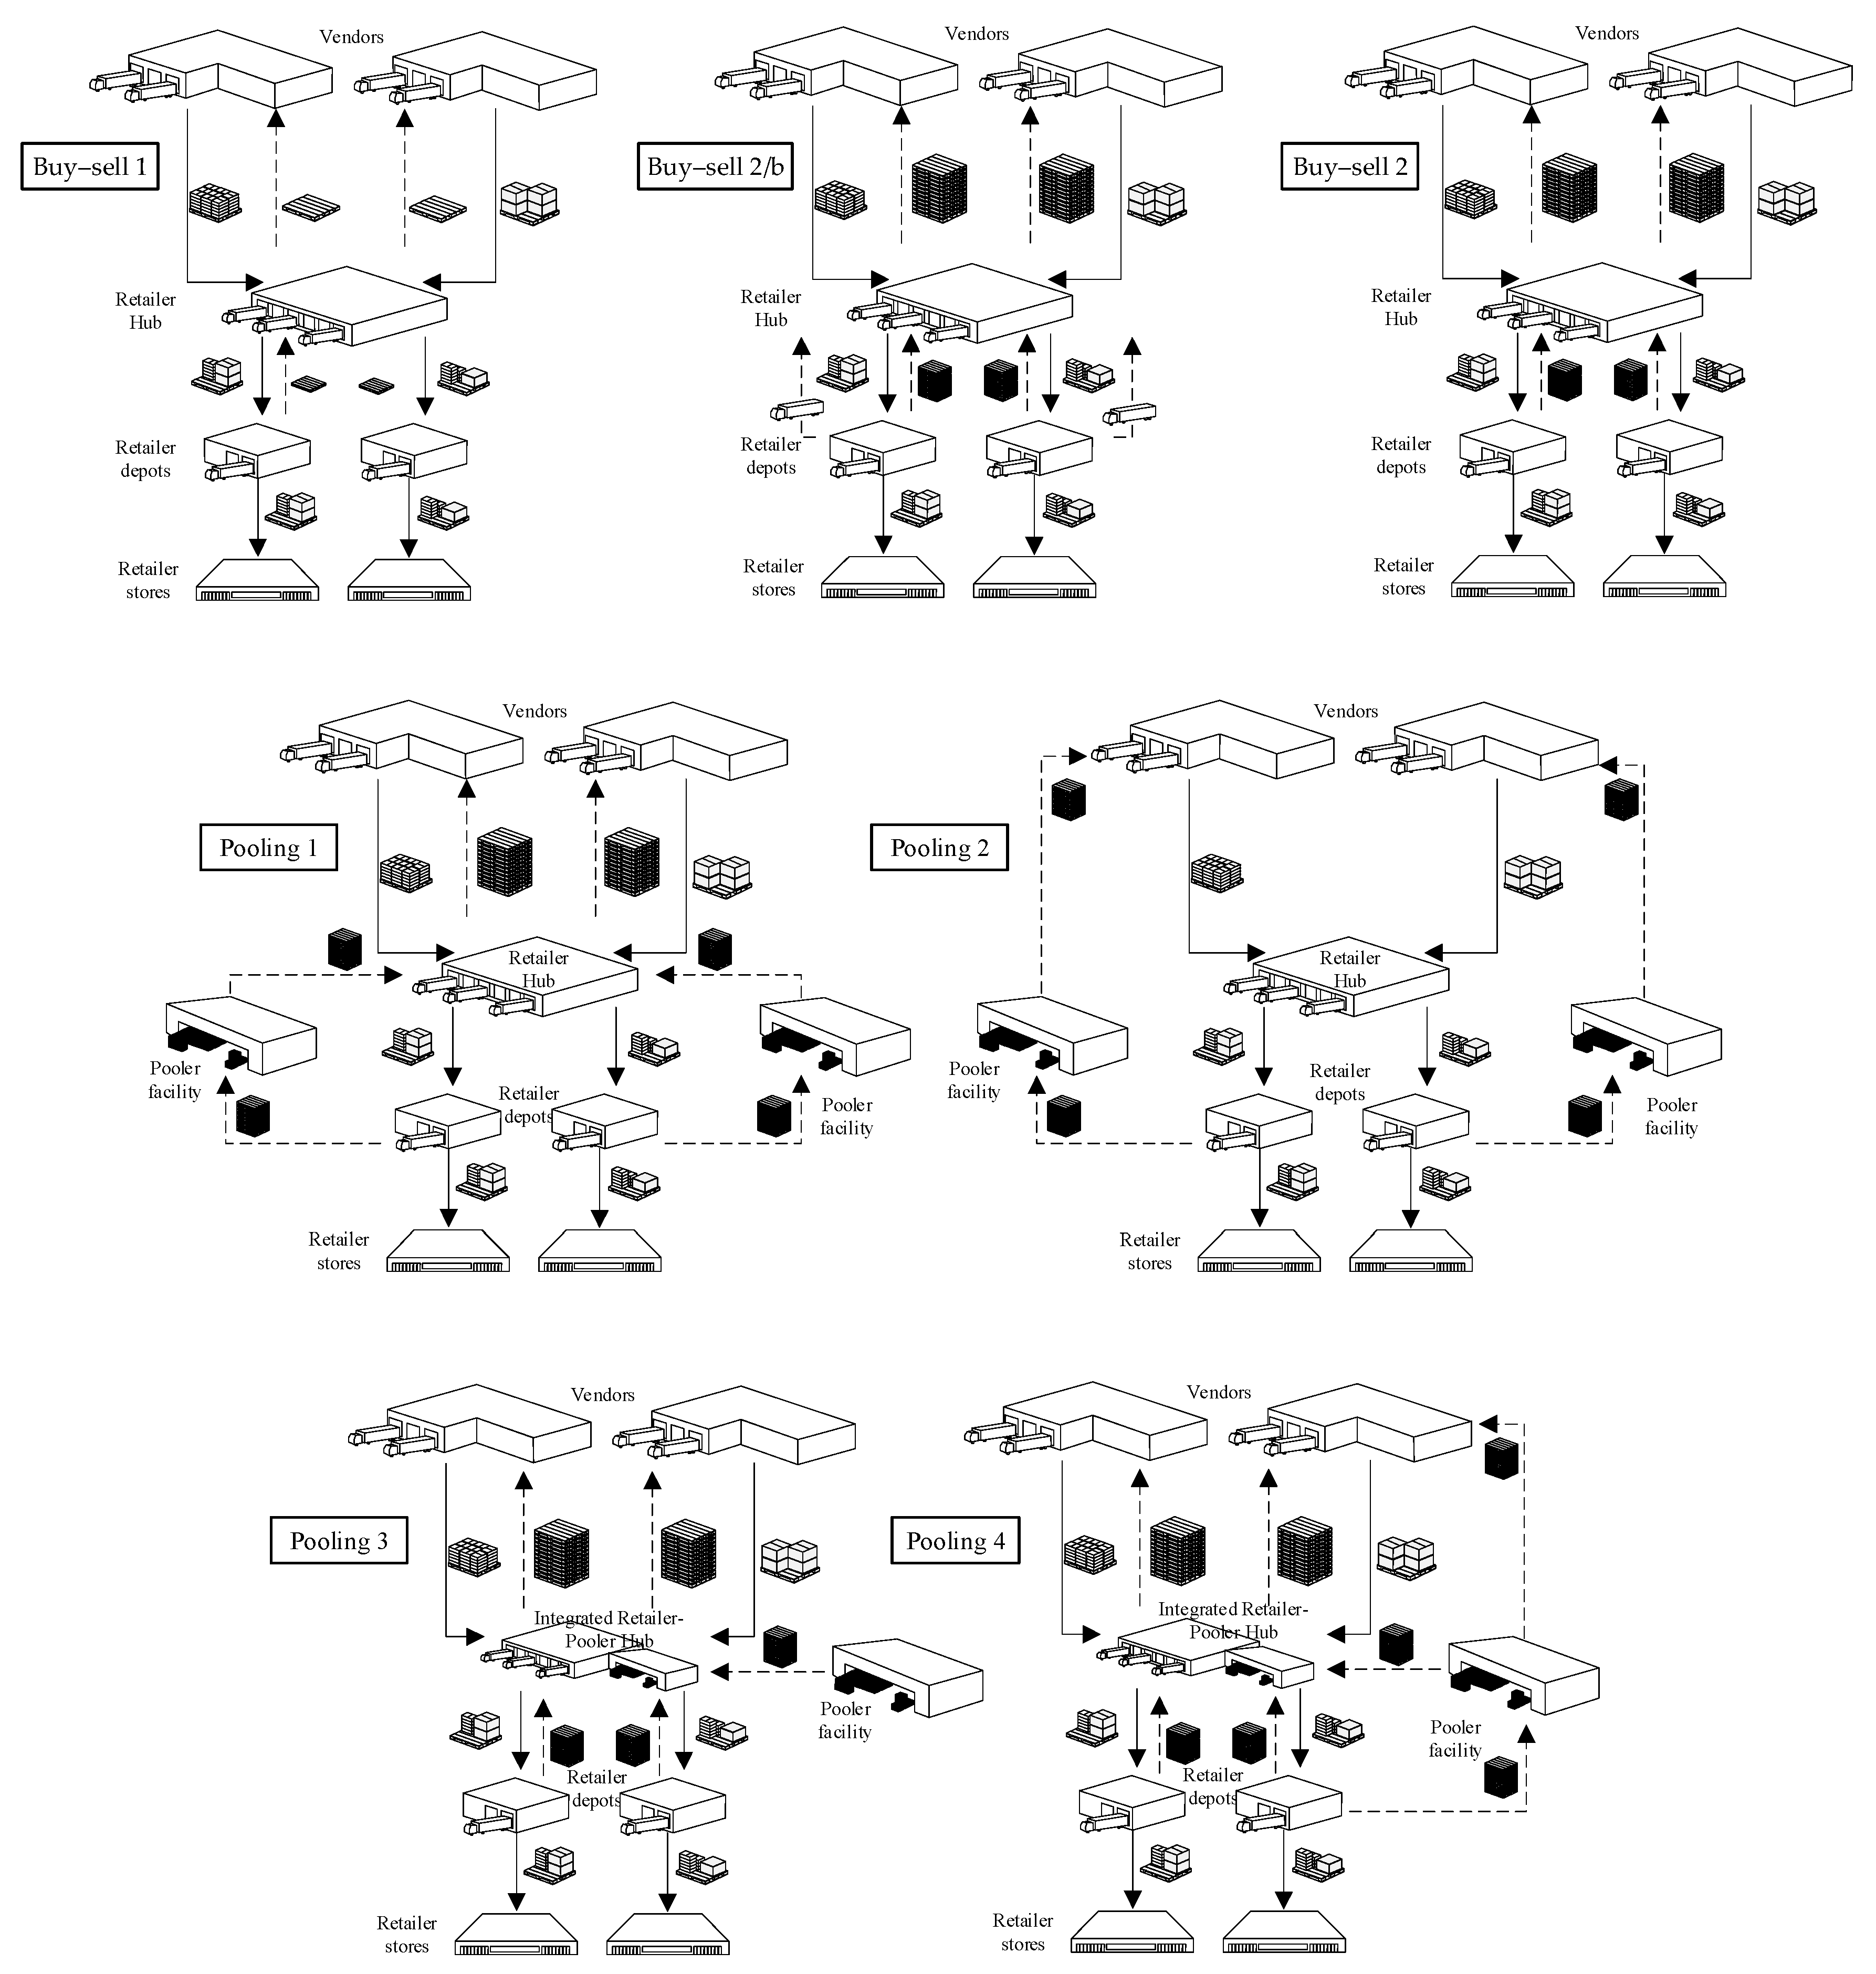
By combining alternative pallet management strategies and different network configurations, seven what-if scenarios were generated and assessed. These resulted from adopting buy–sell or pooling programs and redesigning the network according to two aims: (1) the establishment of a new retailer hub between vendors and depots and (2) integration with the pooler’s network. Each scenario accounted for the forward distribution of loaded pallets and for reverse flows of empty pallets in different ways. Characteristics of the what-if scenarios, in comparison with the ones introduced in Figure 2, are summarized in Table 1 and Figure 3.
3.3. Input Data
As the retailer network is distributed countrywide, estimating the average traveling distances to describe the pallet distribution process could be misleading. In order to investigate the impacts of the pallet management service, a tailored database was filled by actual transport records and to–from routing charts. The dataset, illustrated and exemplified in Table 2, was collected from the companies’ ERPs and organized through a relation SQL database. This database included information regarding nodes; distances; the to–from chart of the routing distances; trips, including all the shipment records throughout the network within the observed horizon; unit loads, describing the size of the pallets; and transport, including mean performance in terms of loading capacity and pollutant emissions.
Emissions parameters were obtained from the Lipasto emission factor database [28] and scaled per loaded ton and vehicle-km. As the proposed analysis focused on the comparison between different scenarios and not on pure accounting for the specific network’s impact, the adoption of such an emission factor database was therefore acceptable.
Furthermore, this source is more complete than others (e.g., Keller and de Haan [29]), as it provides records for different transport modes (e.g., roadways, seaways). Some relevant inputs and parameters of the proposed case study are reported in Table 3.
The dataset fueled a tailored decision support tool that allowed us to assess and quantify the logistical and environmental performance of the current CLN and to further manipulate shipment records to virtualize and generate several what-if pallet management service and network scenarios. For a detailed description of the tool, its functionalities, and GUIs refer to other papers [26].
4. Results
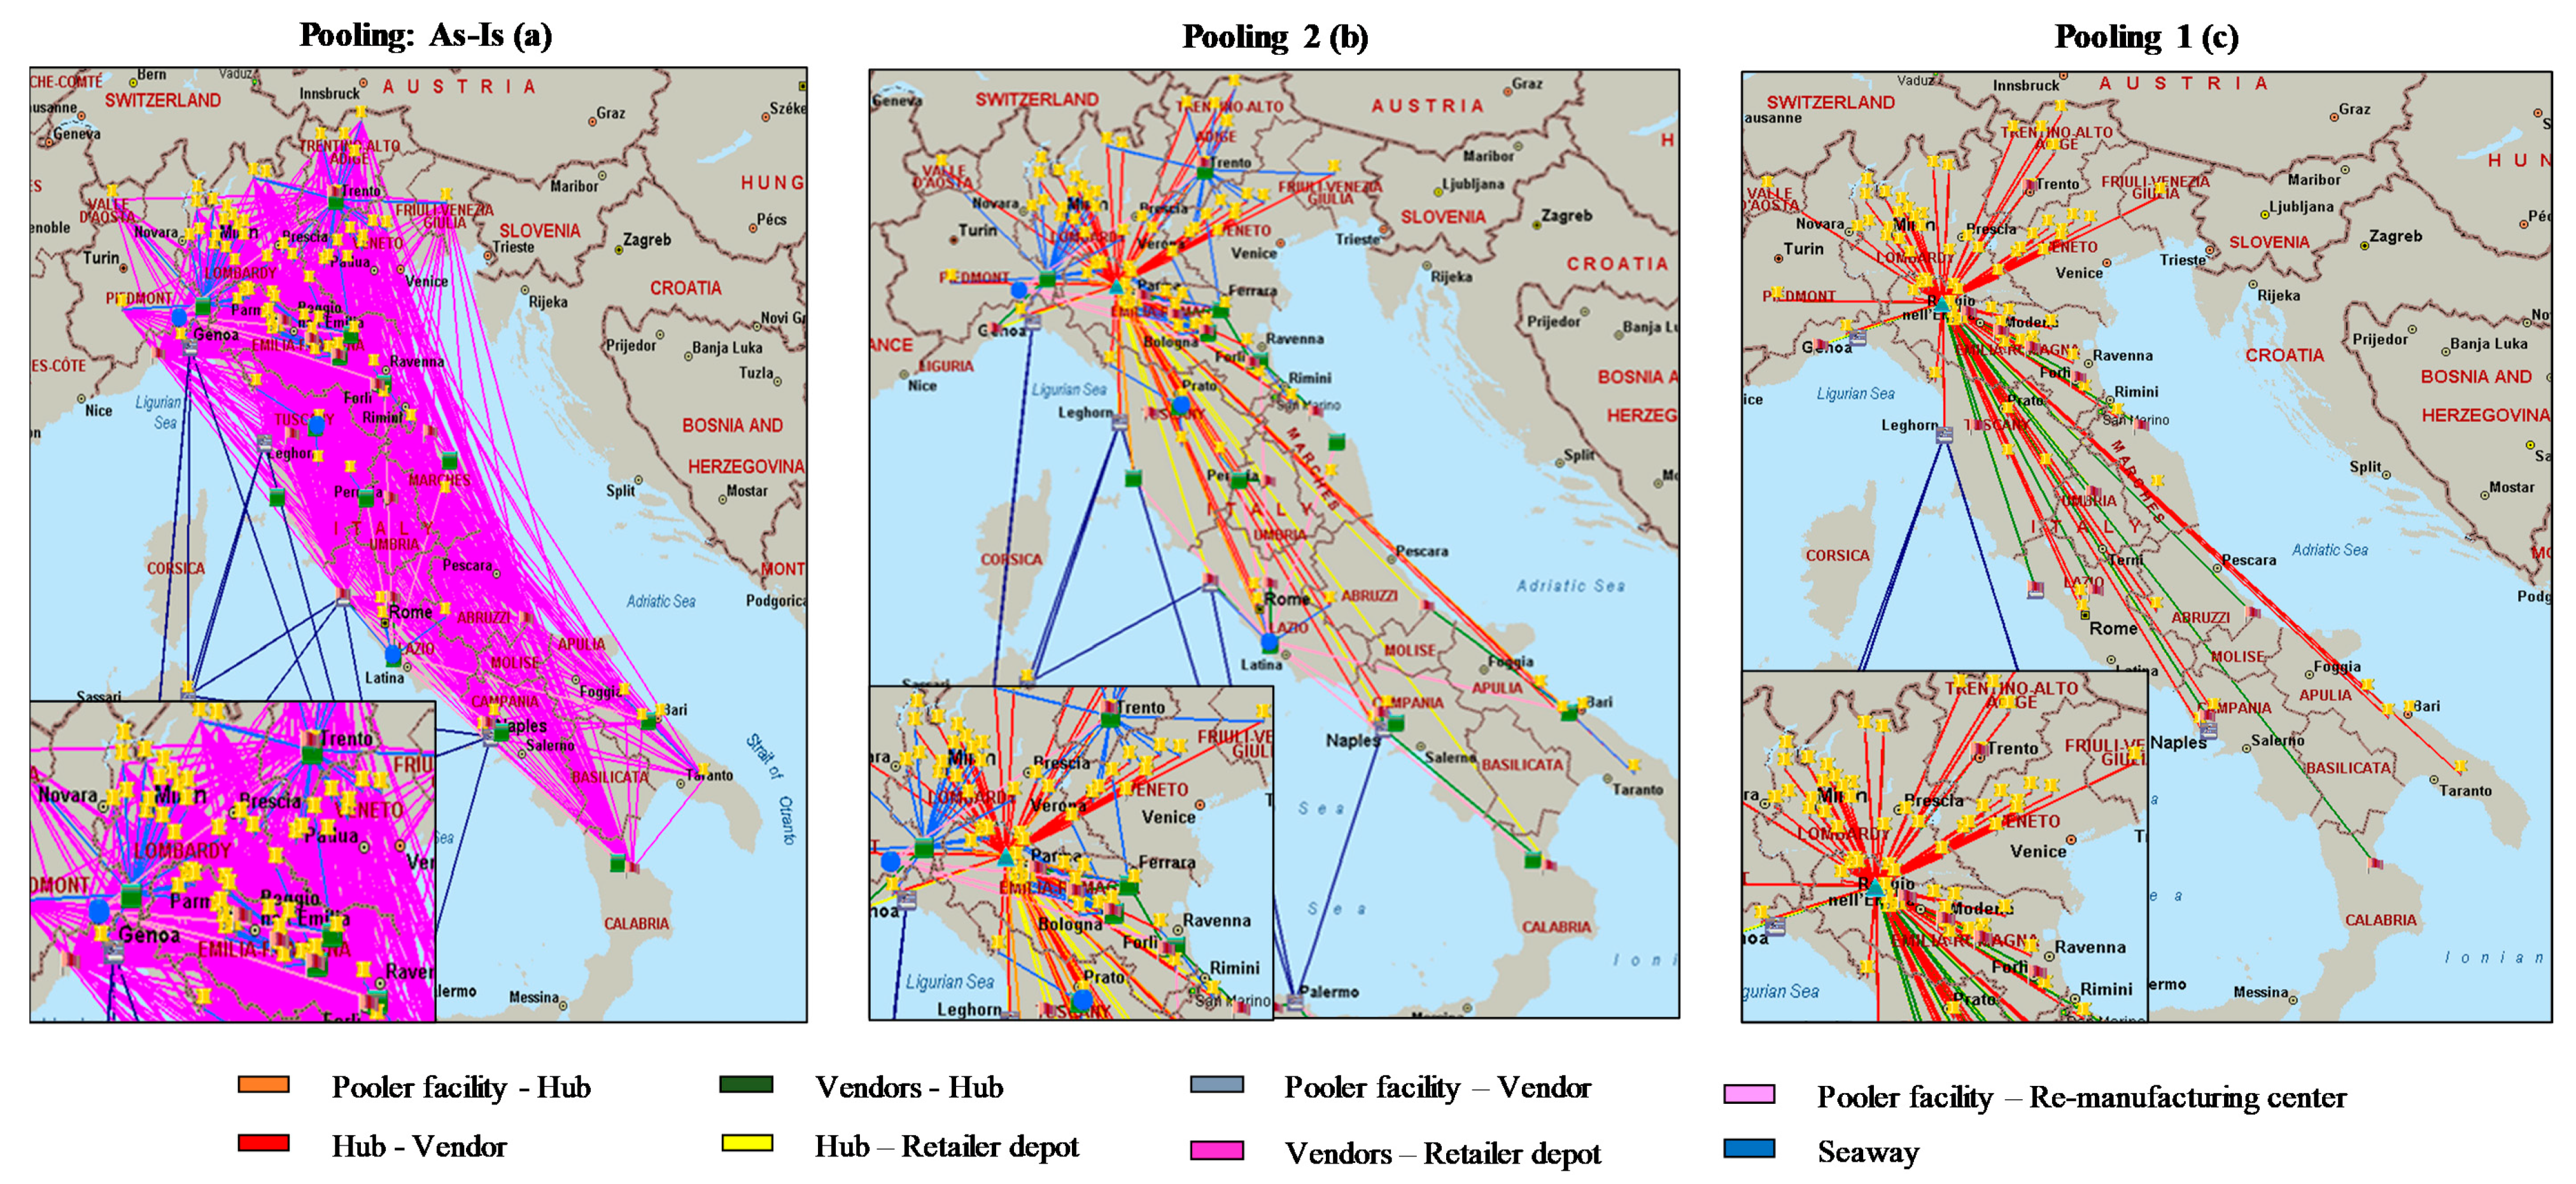
With the aim to assess the environmental and logistical impacts associated with the pallet service CLN, the analyzed scenarios were illustrated using the GIS-driven tool. Figure 4 shows three network flow maps, which provide an overview of the obtained results and demonstrate how alternative scenarios generate different impacts on pallet distribution and collection flows. All the flow maps resulted from the implementation of the pooling program, although the network configuration varied in accordance with the type of actors involved and the transport tasks.
In the maps, Euclidean arcs connect the network’s nodes according to the shipment profile, and the different colors correspond to different transport tasks. In Figure 4a, the map represents the as-is pooling scenario, as illustrated in Figure 2, where the absence of a hub generates the direct interchange between the vendors and the retailer depots, represented by purple lines, whereas light-blue arcs represent shipments from the pooler’s facilities to the vendors. The choice of establishing the hub near Parma allows the conveyance of freight from the vendors into a unique node before supplying the retailer depots located nationwide, thus consolidating both deliveries and pallet supplies. Figure 4b,c represents the pooling 2 and pooling 1 scenarios, respectively, in which the orange arcs represent shipments from the pooler’s facilities to the retailer hub, the red arcs represent shipments from the hub to the vendors, the yellow arcs represent shipments from the hub to the retailer depots, and the light-blue arcs represent shipments from the pooler’s facilities to the vendors. In such scenarios, the typical triangular connections of the CLN are highlighted in the map. In comparison with the pooling 1 scenario, the pooling 2 scenario partly contributed to reducing the total traveling, because the pooler’s facility directly supplied pallets to the vendors located nearby.
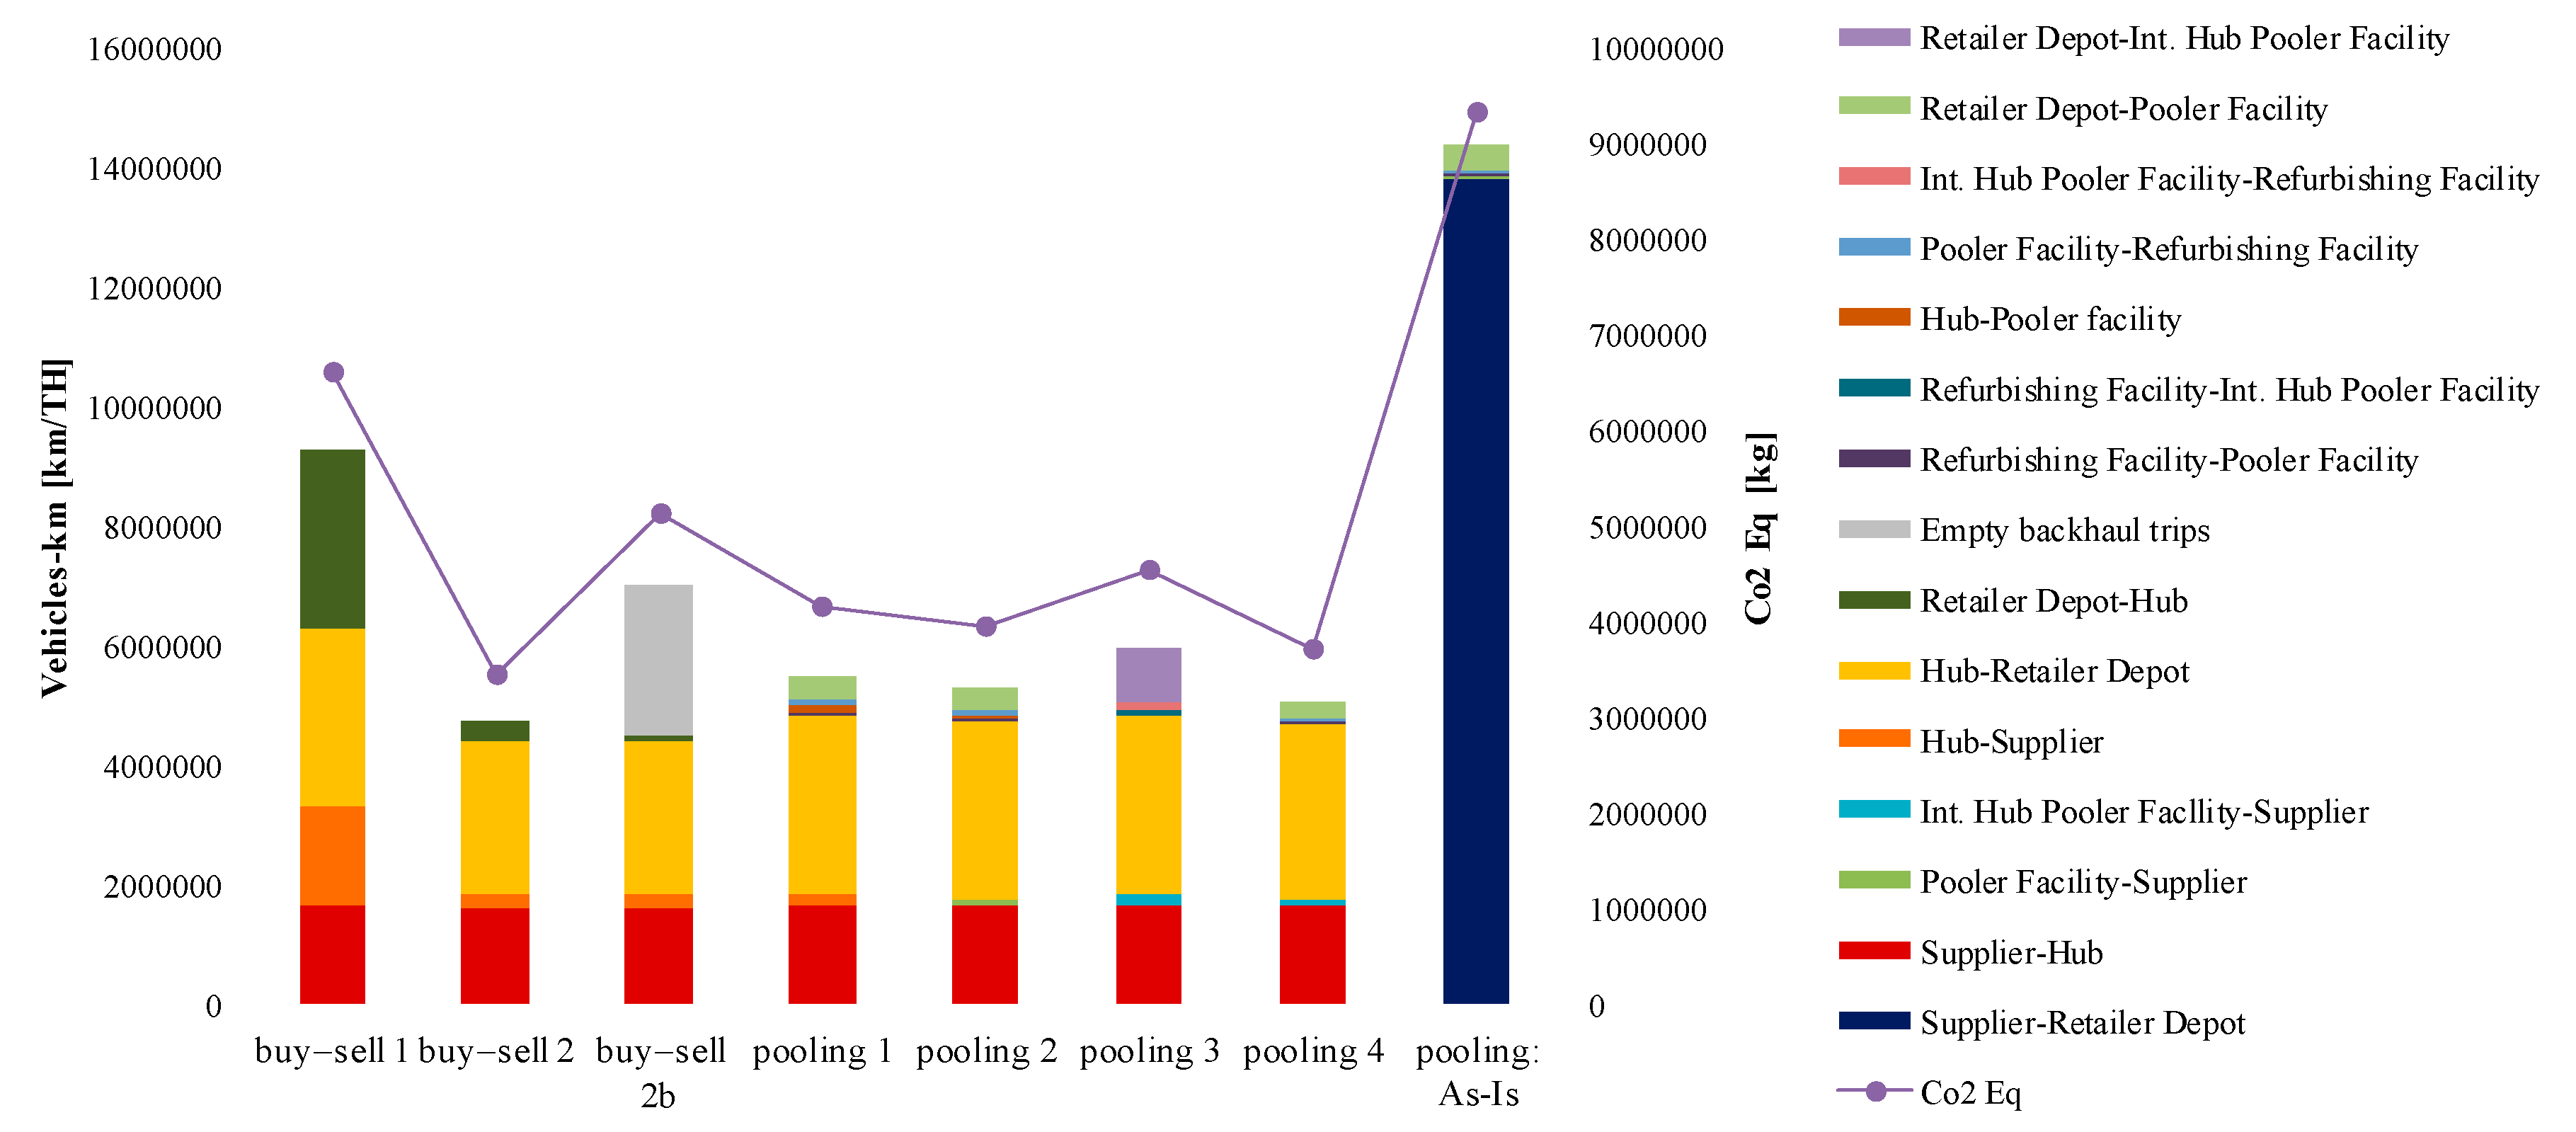
In Figure 5, the traveling distance (vehicles-km) was calculated for the different transport tasks of the CLN, and carbon emissions were determined for each scenario. Even though the buy–sell 2 scenario is reported in Figure 5, it did not consider the empty back trips of the trucks from the retailer depots. Therefore, it excluded some of the externalities the retailer generated in the environment and was thus incomparable with the other scenarios.
As shown in Figure 5, it was determined that, except for the as-is pooling scenario characterized by direct interchange between the vendors and the retailer depots, the pooler (i.e., the pooling 1, 2, 3, and 4 scenarios) evidently allowed for the reduction of transport and CLN environmental impacts. The comparison between the pallet management scenarios demonstrates how the CLN benefits from the presence of a centralized hub that allows for the consolidation of forward shipments of goods and, thus, of RTIs as well.
5. Discussion
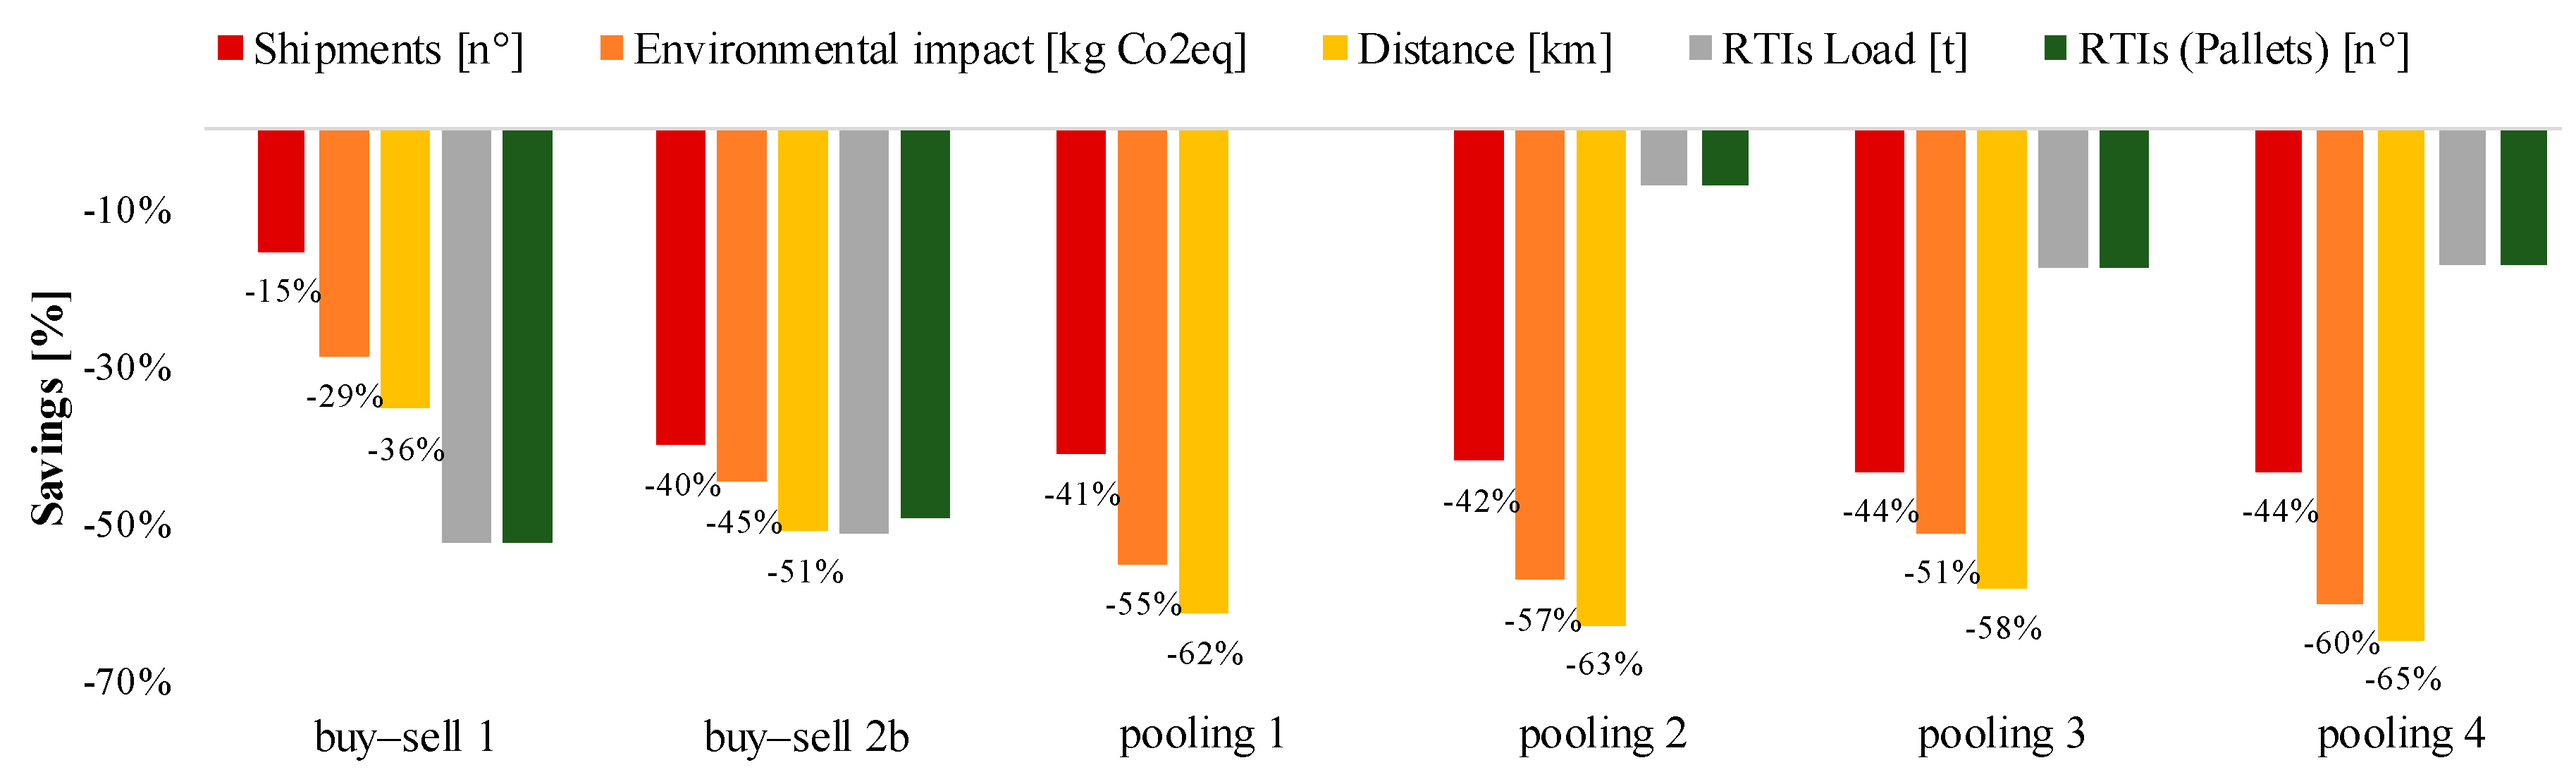
To further investigate the effects of selecting the proper pallet management strategy and network configuration on the CLN’s environmental and logistical performance, factors such as the vehicles-km and the amount of CO2eq, the total number of shipments, the total transported tertiary package weight (i.e., pallet weight), and the total number of handled pallets were evaluated, as shown in Figure 6.
As shown in Figure 6, histograms were developed to report the savings obtained per each metric with respect to the current scenario (i.e., the as-is pooling scenario). This comparison reveals that there were greater environmental benefits, i.e., the highest drop of CO2eq emissions, when implementing the pooling management strategies throughout the retailer hub. Moreover, both the buy–sell strategies performed better than the as-is pooling network for all the observed performance indicators. This result indicates that the distribution of supply chain depots, and particularly of centralized hubs, was more important than the management strategy (i.e., buy–sell vs. pooling) in reducing the economic and environmental impacts resulting from the RTI system.
The reduction of the shipped load of RTIs and of the overall number of pallets handled was derived from the consolidation opportunity offered by the retailer hub. According to the pooling scenarios, it is clear that such savings were intensified when the pallets management service was handled by the pooler entirely from the retailer depots upstream to the vendors (i.e., the pooling 2 and 4 scenarios). Furthermore, transportation benefits from overlapping the pooler and retailer networks (i.e., establishing a pooler facility within the hub) occurred in the best-performing scenario (i.e., the pooling 4 scenario).
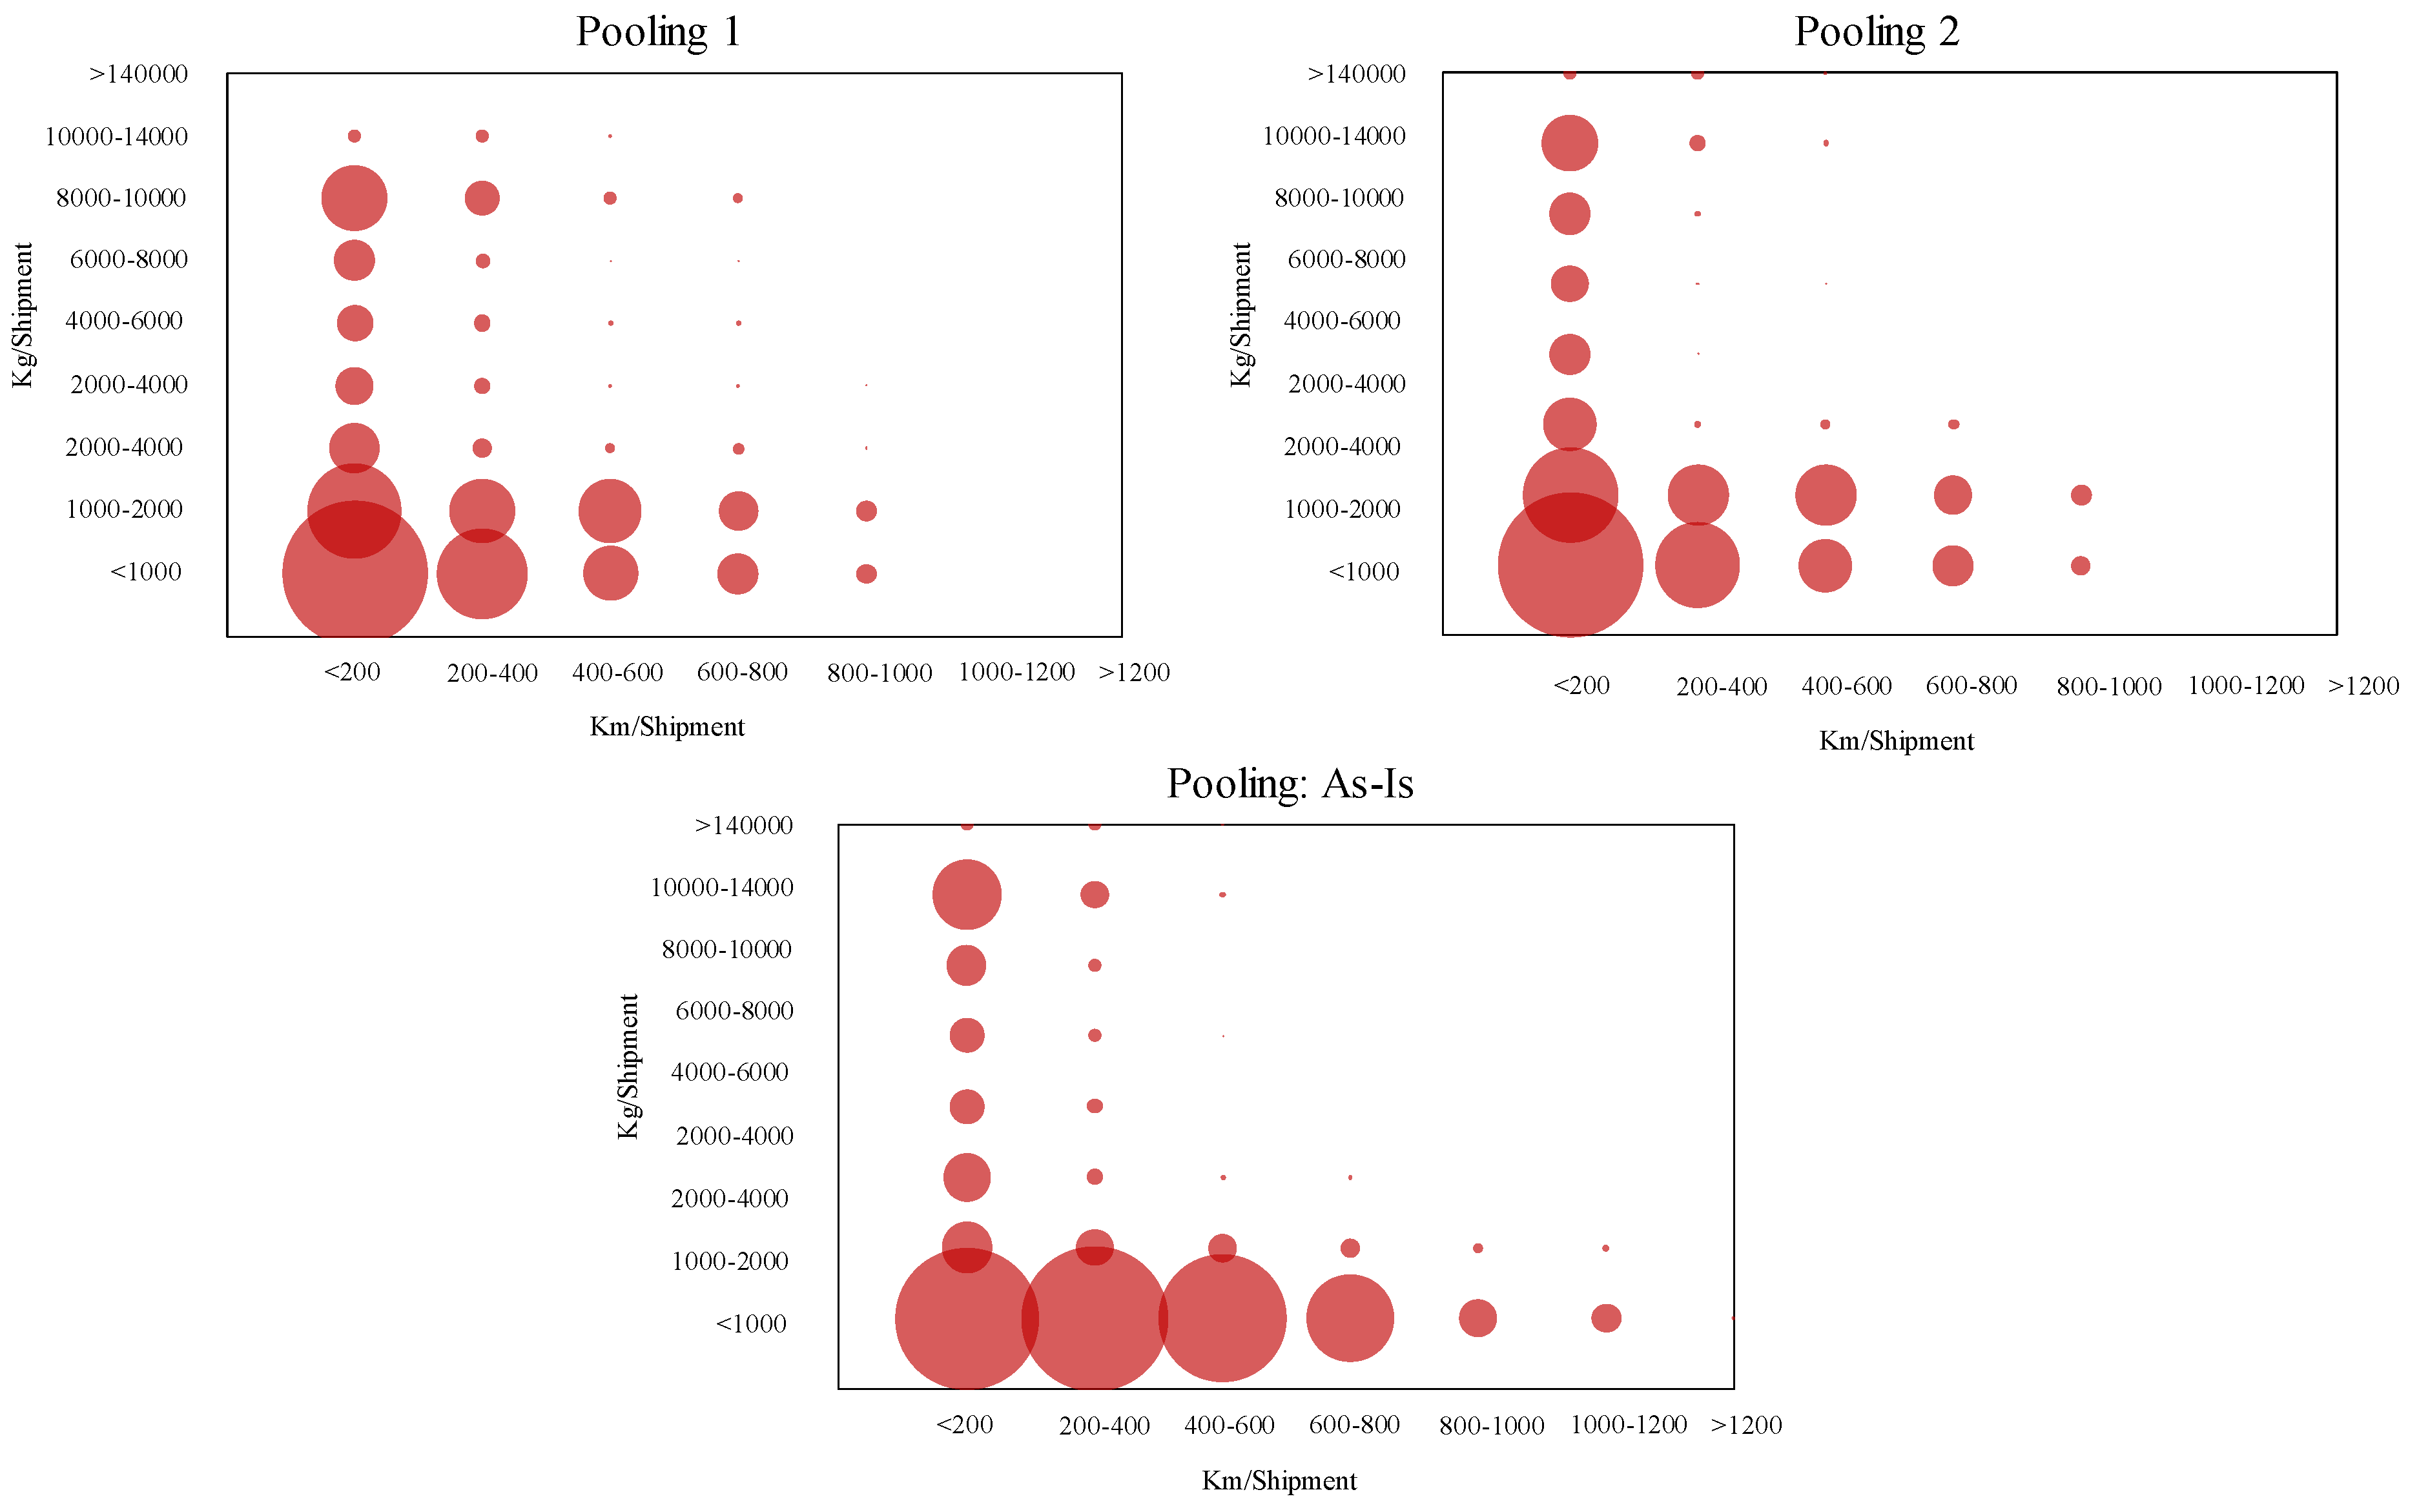
Another analysis was carried out to compare the performance of the different scenarios based on the profile of the vehicle-km and the total RTI load per shipment. Specifically, Figure 7 shows the same scenarios illustrated in Figure 4 but via a class-based frequency plot analysis using vehicle-km and vehicle-kg as the coordinates of a class. This analysis was based on the plot chart calculated by the software and illustrated in Figure 1.
The results of this analysis reveal how, whilst the pooling 1 and pooling 2 scenarios showed similar behaviors, the as-is pooling scenario required more long-range shipments characterized by a scarce utilization of the trucks. This impact resulted from the absence of a centralized hub, which forced the vendors to travel longer routes in order to supply the retailers. Conversely, the presence of the hub reduced the length of the routes, allowed for the consolidation of the loads, and enhanced the truck utilization, as highlighted by the larger diameter of the bubbles between the 1000- and 2000-kg shipments in Figure 7. In comparison with the pooling 1 scenario, the pooling 2 scenario presented a higher number of shipments with loads between 10,000 and 14,000 kg. This behavior was due to the location of the pooler’s facilities, which directly replenished the vendors with full-loaded shipments of pallets.
6. Concluding Remarks and Findings
This paper conducted a comparative analysis of alternative RTI management service scenarios applied to a case study of pallet pooling in a nationwide retailer supply chain. This paper contributes to a gap in the literature, as we investigated the combination of two pallet management strategies (i.e., buy–sell and pooling strategies) with several network configurations of a complex real-world case, involving up to 120 nodes and around 30,000 deliveries per year, and we quantified the associated logistical and environmental impacts using a tailored GIS-driven tool. Although there were limitations caused by using a single case study, this case of a real countrywide network of a pooler and a large-scale Italian retailer [30] might lead to useful insights for pallet service providers, clients, carriers, and policymakers.
First, the environmental performance of CLNs for RTIs, and specifically for pallets, was extremely affected by the transport phase. In developing a strategy for pallet service distribution, the characteristics and distribution of the observed network infrastructure, the node distribution, and the shipment profile must be taken into account carefully, as they were shown to play a crucial role in this study. Thus, the study of the environmental and logistical performance of these networks require detailed analysis and calculation of quantitative and objective KPIs. The average estimation of traveling during the whole RTI life cycle can be misleading and should instead be replaced by the actual calculation of the vehicle-km and vehicle-kg per each shipment of pallets.
Secondly, the pooler contributed significantly to reducing the carbon footprint of the pallet service CLN but was useless if not coupled with an efficient distribution route for the supply chain nodes that needed to be serviced. Traveling and environmental savings were indeed affected by the level of integration between the pooler and the retailer networks and by the presence of a centralized hub, which allowed for a reduction of CO2eq emissions of 45% even with the buy–sell management strategy. Furthermore, the greatest traveling and carbon emission reduction relating to the RTI system, up to 65% and 60%, respectively, compared with the as-is scenario, was obtained when the pallet management service was handled by the pooler entirely from the retailer depots upstream to the suppliers.
In future studies, further developments are expected to be achieved with respect to modeling RTI management services and network configurations and using optimization [8,31] to find the optimal trade-off between the environmental performance of the CLN and the costs experienced by the pooler, the retailer, and the carriers, as well as the optimal location of CLN depots for the management of RTI life cycles.
Author Contributions
R.A. and R.M. conceptualized the project with the involved companies guaranteeing supervision. The software was developed by C.P. and R.A., who also both contributed to its validation. C.P. collected data and implemented the analysis while G.B. organized the results. G.B. and R.A. wrote the paper.
Funding
This research received no external funding.
Acknowledgments
The authors would like to sincerely thank the company, CPR System, which was involved in the study. In particular, the authors would like to thank Enrico Frigo, Monica Artosi, and Sabrina Pagnoni by name for their valuable support in this research project. The project also benefited from the support of Andrea Mantelli and Alessandra Lograsso from CONAD Soc. Coop.
Conflicts of Interest
The authors declare no conflict of interest.
References
- Glock, C.H. Decision support models for managing returnable transport items in supply chains: A systematic literature review. Int. J. Prod. Econ. 2017, 183, 561–569. [Google Scholar] [CrossRef]
- Waqas, M.; Dong, D.; Ahmad, N.; Zhu, Y.; Nadeem, M. Critical Barriers to Implementation of Reverse Logistics in the Manufacturing Industry: A Case Study of a Developing Country. Sustainability 2018, 10, 4202. [Google Scholar] [CrossRef]
- Tonn, B.; Frymier, P.D.; Stiefel, D.; Skinner, L.S.; Suraweera, N.; Tuck, R. Toward an infinitely reusable, recyclable, and renewable industrial ecosystem. J. Clean. Prod. 2014, 66, 392–406. [Google Scholar] [CrossRef]
- Elia, V.; Gnoni, M.G.; Tornese, F. Measuring circular economy strategies through index methods: A critical analysis. J. Clean. Prod. 2017, 142, 2741–2751. [Google Scholar] [CrossRef]
- Koskela, S.; Dahlbo, H.; Judl, J.; Korhonen, M.-R.; Niininen, M. Reusable plastic crate or recyclable cardboard box? A comparison of two delivery systems. J. Clean. Prod. 2014, 69, 83–90. [Google Scholar] [CrossRef]
- Bottani, E.; Casella, G. Minimization of the Environmental Emissions of Closed-Loop Supply Chains: A Case Study of Returnable Transport Assets Management. Sustainability 2018, 10, 329. [Google Scholar] [CrossRef]
- Ross, S.; Evans, D. The environmental effect of reusing and recycling a plastic based packaging system. J. Clean. Prod. 2003, 11, 561–571. [Google Scholar] [CrossRef]
- Accorsi, R.; Manzini, R.; Pini, C.; Penazzi, S. On the design of closed-loop networks for product life cycle management: Economic, environmental and geography considerations. J. Transp. Geogr. 2015, 48, 121–134. [Google Scholar] [CrossRef]
- Soysal, M. Closed-loop Inventory Routing Problem for returnable transport items. Transp. Res. Part D 2016, 48, 31–45. [Google Scholar] [CrossRef]
- Auvinen, H.; Clausen, U.; Davydenko, I.; Diekmann, D.; Ehrler, V.; Lewis, A. Calculating emissions along supply chains—Towards the global methodological harmonization. Res. Transp. Bus. Manag. 2014, 12, 41–46. [Google Scholar] [CrossRef]
- Bilbao, A.M.; Carrano, A.L.; Hewitt, M.; Thorn, B.K. On the environmental impacts of pallet management operations. Manag. Res. Rev. 2011, 34, 1222–1236. [Google Scholar] [CrossRef]
- Govindan, K.; Soleimani, H.; Kannan, D. Reverse logistics and closed-loop supply chain: A comprehensive review to explore the future. Eur. J. Oper. Res. 2015, 240, 603–626. [Google Scholar] [CrossRef] [Green Version]
- Ray, C.D.; Michael, J.H.; Scholnick, B.N. Supply chain system costs of alternative grocery industry pallet systems. For. Prod. J. 2006, 56, 52–57. [Google Scholar]
- Carrano, A.L.; Thorn, B.K.; Woltag, H. Characterizing the carbon footprint of wood pallet logistics. For. Prod. J. 2014, 64, 232–241. [Google Scholar] [CrossRef]
- Hassanzadeh Amin, S.; Wu, H.; Karaphillis, G. A perspective on the reverse logistics of plastic pallets in Canada. J. Remanuf. 2018, 8, 153–174. [Google Scholar] [CrossRef] [Green Version]
- Bengtsson, J.; Logie, J. Life Cycle Assessment of one-way and pooled pallet alternatives. Procedia CIRP 2015, 29, 414–419. [Google Scholar] [CrossRef]
- Carrano, A.L.; Pazour, J.; Roy, D.; Thorn, B.K. Selection of pallet management strategies based on carbon emissions impact. Int. J. Prod. Econ. 2015, 164, 258–270. [Google Scholar] [CrossRef]
- Elia, V.; Gnoni, M.G. Designing an effective closed loop system for pallet management. Int. J. Prod. Econ. 2015, 170, 730–740. [Google Scholar] [CrossRef]
- Katephap, N.; Limnararat, S. The operational, economic and environmental benefits of returnable packaging under various reverse logistics arrangements. Int. J. Intell. Eng. Syst. 2017, 10, 210–219. [Google Scholar] [CrossRef]
- Ren, J.W.; Zhang, X.Y.; Zhang, J.; Ma, L. A multi-scenario model for pallets allocation over a pallet pool. Syst. Eng. Theory Pract. 2014, 34, 1788–1798. [Google Scholar]
- Zhou, K.; He, S.; Song, R. Optimization for service routes of pallet service center based on the pallet pool mode. Comput. Intell. Neurosci. 2016, 2016, 5691735. [Google Scholar] [CrossRef] [PubMed]
- Tornese, F.; Pazour, J.; Thorn, B.K.; Roy, D.; Carrano, A.L. Investigating the environmental and economic impact of loading conditions and repositioning strategies for pallet pooling providers. J. Clean. Prod. 2018, 172, 155–168. [Google Scholar] [CrossRef]
- Palsson, H.; Finnsgard, C.; Wänström, C. Selection of packaging systems in supply chains from a sustainability perspective: The case of Volvo. Packag. Technol. Sci. 2013, 26, 289–310. [Google Scholar] [CrossRef]
- Evangelista, P. Environmental sustainability practices in the transport and logistics service industry: An exploratory case study investigation. Res. Transp. Bus. Manag. 2014, 12, 63–72. [Google Scholar] [CrossRef]
- Mishra, D.; Gunasekaran, A.; Papadopoulos, T.; Hazen, B. Green supply chain performance measures: A review and bibliometric analysis. Sustain. Prod. Consum. 2017, 10, 85–99. [Google Scholar] [CrossRef]
- Accorsi, R.; Cholette, S.; Manzini, R.; Tufano, A. A hierarchical data architecture for sustainable food supply chain management and planning. J. Clean. Prod. 2018, 203, 1039–1054. [Google Scholar] [CrossRef]
- Tornese, F.; Carrano, A.L.; Thorn, B.K.; Pazour, J.A.; Roy, D. Carbon footprint analysis of pallet remanufacturing. J. Clean. Prod. 2016, 126, 630–642. [Google Scholar] [CrossRef]
- VTT Technical Research Centre of Finland Ltd. LIPASTO Unit Emissions Database. Available online: http://lipasto.vtt.fi/yksikkopaastot/ (accessed on 8 October 2018).
- Keller, M.; de Haan, P. Handbuch Emissionsfaktoren des Straßenverkehrs 2.1; Dokumentation: Graz, Austria; Essen, Germany; Bern, Switzerland; Heidelberg, Germany, 2004. [Google Scholar]
- Deloitte. Global Powers of Retailing 2018: Transformative Change, Reinvigorated Commerce; Deloitte: Boston, MA, USA, 2018. [Google Scholar]
- Bottani, E.; Montanari, R.; Rinaldi, M.; Vignali, G. Modeling and multi-objective optimization of closed loop supply chains: A case study. Comput. Ind. Eng. 2015, 87, 328–342. [Google Scholar] [CrossRef]
Figure 1.
Graphical user interfaces (GUIs) of the transport carbon emission calculator. The main GUI of the software provides the list and the type (e.g., reusable transport item (RTI) depot, distribution hub, refurbishing depot, etc.) of the network nodes (on the left) and the map of the logistic flows (on the right). Another GUI (shown above) represents the dot plot of the weight for load-vehicle-km elaborated per each shipment.

Figure 2.
The two-stage retailer supply chain according to the exchange and pooling pallets programs.
Figure 2.
The two-stage retailer supply chain according to the exchange and pooling pallets programs.

Figure 3.
Management strategies and network configurations scenarios.

Figure 4.
Transport flow maps: (a) pooling: as-is, (b) pooling 2, and (c) pooling 1.

Figure 5.
Performance of the scenarios: logistical and environmental indicators.

Figure 6.
Comparison of the performance indicators in the RTI management scenarios: number of shipments, environmental impact, vehicles-km, total transported pallet weight, and number of pallets.
Figure 6.
Comparison of the performance indicators in the RTI management scenarios: number of shipments, environmental impact, vehicles-km, total transported pallet weight, and number of pallets.

Figure 7.
Frequency analysis of the total vehicles-km and carried load per shipment.


Table 1.
Pallet logistic scenarios (Legend: ●/○ as yes/no).
| Scenario | Mng. Strategy | Retailer Hub | Pooler’s Net. | Pooler-in-Hub | Description |
|---|---|---|---|---|---|
| Buy–sell: as-is | Buy–sell | ○ | ○ | ○ | The business-as-usual scenario. |
| pooling: as-is | Pooling | ○ | ● | ○ | The recently implemented scenario without the retailer hub. |
| What-if scenarios | |||||
| buy–sell 1 | Buy–sell | ● | ○ | ○ | The hub receives full pallets from the suppliers and allows for consolidation of the shipments to the depots. Pallet exchange is guaranteed both upstream and downstream. |
| buy–sell 2 | Buy–sell: cons. | ● | ○ | ○ | The hub also allows for consolidating empty pallets that are shipped back by full-loaded trucks. Back-trips are not accounted for. |
| buy–sell 2b | Buy–sell: cons. | ● | ○ | ○ | The hub also allows for consolidating empty pallets that are shipped back by full-loaded trucks. Back-trips are accounted for. |
| pooling 1 | Pooling | ● | ● | ○ | Empty pallets are collected from the pooler, who replenishes the stock of the hub. Exchange policy is followed upstream with the suppliers. |
| pooling 2 | Pooling | ● | ● | ○ | The pooler closes the empty pallets cycle from the depots to the suppliers. |
| pooling 3 | Pooling | ● | ● | ● | The integrated hub–pooler facility allows for the coupling of the forward goods network with the reverse pallet network. |
| pooling 4 | Pooling | ● | ● | ● | This optimal scenario also enables the whole pooler’s network to collect from depots and serve directly the hub or the suppliers in order to minimize traveling. |
Table 2.
The database reflecting information on nodes, distance, trips, unit loads, and transport means.
Table 2.
The database reflecting information on nodes, distance, trips, unit loads, and transport means.
| Node | Distance | |||||
| Node Code | Node Type | Latitude | Longitude | Node from | Node to | Route [km] |
| 002 | Vendor | 44.035 | 12.188 | 002 | 006 | 15 |
| 006 | Retailer store | 45.151 | 10.836 | 002 | 008 | 80 |
| Trip | ||||||
| Ship. code | Node from | Node to | Date | Product | Weight [kg] | Transport mean |
| 2534 | 002 | 008 | 8 September 2018 | Apples | 630 | Delivery lorry |
| 2535 | 010 | 003 | 8 October 2018 | Kiwi | 600 | Full trailer comb. |
| Unit Load | ||||||
| Code | Length | Width | Height | Weight | ||
| {1200 × 1000 × 1000} | 1200 | 1000 | 1000 | 28 | ||
| {1200 × 800 × 1000} | 1200 | 800 | 1000 | 20 | ||
| Transport Means | ||||||
| Transport Mean | Emission Class | Load Capacity (t) | CO (g/tkm) | NOx | … | CO2eq |
| Delivery lorry | EURO 1 | 3.5 | 0.58 | 1.50 | … | 146.05 |
| Full trailer | EURO 5 | 40 | 0.00425 | 0.1 | … | 31.17 |
Table 3.
Input data.
| Network Nodes | Processes/Handling Units | |||||||
| Vendor/supplier nodes | 84 | Time horizon (TH) | 4 February 2015–31 March 2016 | |||||
| Retailer regional depots | 17 | Shipments/TH (As-Is) | 29,802 | |||||
| Retailer hub | 1 | |||||||
| Pooler’s facilities | 16 | Unit load/pallets | 4 {800 × 1200 × 1000; 600 × 1200 × 800; 800 × 600 × 600; 1000 × 1200 × 1000} | |||||
| Pallet refurbishing facilities | 4 | |||||||
| Transport Mean | Emission class | Load capacity (t) | CO (g/tkm) | NOx | PM | CH4 | NH3 | CO2eq |
| Full trailer | EURO 5 | 40 | 0.00425 | 0.1 | 0.0011 | 0.00005 | 0.00088 | 31.17 |
| Semi trailer | EURO 5 | 25 | 0.0012 | 0.016 | 0.0001 | 0.000062 | 0.0015 | 10.92 |
© 2019 by the authors. Licensee MDPI, Basel, Switzerland. This article is an open access article distributed under the terms and conditions of the Creative Commons Attribution (CC BY) license (http://creativecommons.org/licenses/by/4.0/).
Share and Cite
MDPI and ACS Style
Accorsi, R.; Baruffaldi, G.; Manzini, R.; Pini, C. Environmental Impacts of Reusable Transport Items: A Case Study of Pallet Pooling in a Retailer Supply Chain. Sustainability 2019, 11, 3147. https://doi.org/10.3390/su11113147
AMA Style
Accorsi R, Baruffaldi G, Manzini R, Pini C. Environmental Impacts of Reusable Transport Items: A Case Study of Pallet Pooling in a Retailer Supply Chain. Sustainability. 2019; 11(11):3147. https://doi.org/10.3390/su11113147
Chicago/Turabian StyleAccorsi, Riccardo, Giulia Baruffaldi, Riccardo Manzini, and Chiara Pini. 2019. "Environmental Impacts of Reusable Transport Items: A Case Study of Pallet Pooling in a Retailer Supply Chain" Sustainability 11, no. 11: 3147. https://doi.org/10.3390/su11113147
Note that from the first issue of 2016, this journal uses article numbers instead of page numbers. See further details here.