The Integrated Effect of Carbon Emissions Trading and Pollution Rights Trading for Power Enterprises—A Case Study of Chongqing


1
College of Economics and Management, Nanjing University of Aeronautics and Astronautics, 29 Jiangjun Avenue, Nanjing 211106, China
2
Research Centre for Soft Energy Science, Nanjing University of Aeronautics and Astronautics, 29 Jiangjun Avenue, Nanjing 211106, China
*
Author to whom correspondence should be addressed.
Sustainability 2019, 11(11), 3099; https://doi.org/10.3390/su11113099
Submission received: 6 May 2019
/
Revised: 25 May 2019
/
Accepted: 28 May 2019
/
Published: 1 June 2019
(This article belongs to the Collection Power System and Sustainability)
Abstract
:To control growing environmental problems, the pollution rights trading (PRT) center was established in Jiaxing in 2007, and China officially joined the carbon emission reduction market (NCET) in 2011. Since power enterprises are the main participants in the NCET market and PRT market, the integrated effect of the NCET market and PRT market on power enterprise profit and the regional environment is one of the major issues that needs to be taken into consideration. Based on system dynamics (SD) theory, we propose an NCET-PRT simulation model for power enterprises in Chongqing. Through analyzing parameters of carbon trading price, free ratio, and emission trading prices, 12 different simulation scenarios are configured for sensitivity analysis. Based on the simulation results, the following observations can be obtained: (1) NCET and PRT can effectively promote the performance of enterprises’ carbon emissions reduction and regional pollutant emission reduction but will have a minor negative impact on the industrial economy at the same time; (2) The trading mechanism is interactive; if the carbon emissions trading (NCET) mechanism is implemented separately, the emission of pollutants will be reduced significantly. However, the implementation of pollution rights trading (PRT) alone cannot significantly reduce CO2 emissions; (3) At an appropriate level, NCET and PRT can be enhanced to achieve a maximum emissions reduction effect at a minimum economic cost.
1. Introduction
In recent years, with the development of Chinese industry and the growth of consumer levels, the economy has grown rapidly, and behind this economic development, the greenhouse effect and environmental pollution have been an unneglectable problem; the emission reduction of the electrical industry is its most critical part. Although the proportion of coal consumption in China has been decreasing in recent years, China will still use a large amount of coal due to the scarcity of environmental resources in the future, which will inevitably lead to the emission of carbon dioxide and other pollutants. To control carbon emissions and pollution emissions, the Chinese Government has implemented pollution rights trading (PRT) policies and carbon emissions trading (CET) policies to alleviate environmental pressure and reduce pollutant emissions. In 2011, the Chinese government issued the “notice on the implementation of pilot carbon emission trading” and approved the four municipalities directly under the central government to carry out carbon emission trading pilots [1]. In the carbon emission reduction program of the 13th five year plan, it is clearly proposed that the ultra-low emissions from coal power should reach the level of gas and electricity [2]. By the end of 2018, China had opened eight pilot projects, with Fujian adding new ones, gradually moving towards a nationwide carbon trading policy [3]. For pollutant rights trading (PRT), China’s first emission trading center was established by Jiaxing in 2007, marking the gradual institutionalization, standardization, and internationalization of China’s emission trading [4]. In Chongqing, the pollution rights trading (PRT) was launched in 2009, and the paid use and trading of pollutant discharge rights were fully implemented in 2015. With the establishment of the CET market and PRT market, the effectiveness and design of CET and PRT have inevitably become the focus of attention.
Since the adoption of the Kyoto protocol, many scholars and experts have paid attention to this hot topic. Galinis et al. [5] described a CGE model to study the impact of different transaction scenarios on Lithuania’s economy and environment. Then, in 2005, the European Union established the European Union Emission Trading Scheme (EU ETS). In the process of research, Stern [6] stated that the carbon trading mechanism is better than the carbon tax policy. After that, Linares et al. [7] constructed a market equilibrium model to address emissions permits and tradable green certification solutions, allowing every company to address the electricity, carbon, and green certification markets simultaneously. To study whether the carbon trading mechanism can achieve a good emission reduction effect, Keohane [8] concluded, through research, that emission reduction targets are always guaranteed in the carbon trading scheme on the condition that the total emission limit is well set. Although many countries and regions are currently implementing carbon trading policies, different countries and regions have different marginal carbon emission reduction costs under their respective emission reduction commitments (Yun, [9]). After 2011, due to China’s voluntary participation, many Chinese scholars also began to study the situation of trading mechanisms in China. Cui et al. [10] built a trans-provincial emission rights trading model, which was divided into no carbon, covering pilot, and covering the whole region for analysis and discussion. Li et al. [11] suggested that ETS is an effective strategy for CO2 reduction, and the free quota ratio should be gradually reduced in ETS. With the official launch of China’s national unified carbon trading system (ETS) in 2017, based on the multi-agent model, Tang et al. [12] introduced an auction mechanism in ETS. As for how to allocate the carbon emissions quota, Zhang and Hao [13] studied the carbon emission quota allocation of China in 2020 and made the allocation scheme reach the Pareto optimality with the consideration of carbon emission reduction capacity, responsibility, and potential. In terms of the efficiency of carbon trading mechanism, Zhao et al. [14] analyzed China’s four major carbon trading markets and determined that China’s current carbon trading market only achieved a weak efficiency, but the expansion of the market can improve that efficiency. Concerning the efficiency of carbon emission reduction, Li et al. [15] believe that the expansion of carbon finance trading and the market mechanism of carbon finance can improve the efficiency of carbon emission reduction. Zhou et al. [16] proposed a method for carbon emission license allocation combining data envelopment analysis (DEA), analytic hierarchy process (AHP), and principal component analysis (PCA). Since the European Union Emission Trading Scheme (EU ETS) has gradually become mature, Ralf Martin et al. [17] summarized the research of scholars and the data sheets provided by some EU countries and enterprises, believing that carbon trading has a great impact on the economy, and the effects of emission reduction in the second stage is relatively obvious. At the same time, they agreed that innovation could make the EU ETS more dynamically efficient and that renewable energy obligations and feed-in tariffs for electricity generation could drive innovation more than carbon trading.
Concerning the emission of pollutants, from the perspective of pollution rights trading, as far back as 1997, students at an American school played the game of comparing the cost of reducing pollution to the cost of getting an emissions permit (Nugent, [18]). Chen et al. [19] explained the theory of property rights and put forward the overall planning of the definition of emission rights, emission rights transactions, and emission rights reorganization. Lu [20] interviewed businesspeople to study the actual performance of emission trading on SO2 emission, and unexpectedly found that the sulfur dioxide emission trading plan of Taiyuan seemed ineffective. However, based on the theory of system dynamics, Liao et al. [21] established the pollutant trading model in China and found that the impact of trading policies on the total emission control of SO has increased steadily since 2011. The establishment of the equilibrium model of the power network shows that the total emissions do not exceed the total emission permit (Li and Liu, [22]). In terms of the impact of sulfur dioxide emission rights trading on average emission reduction costs (APAC) and marginal emission reduction costs (MPAC), (Tu and Shen [23]) found through a calculation that trading policy can effectively reduce APAC and MPAC. With the help of the CGE model, Ma et al. [24] found, through simulation, that only a few regions in China can meet the national SO2 emissions standard under the existing SO2 trading mechanism. From the perspective of China’s energy, to reduce the emission of pollutants, China’s energy structure needs to be transformed from primary energy, such as wood and coal, to renewable energy. Zhao et al. [25] believe that economic development or the development of the non-agricultural labor market or the accumulation of human capital can help accelerate the process of rural energy transformation in China. Further, Tomas Baležentis and Dalia Štreimikienė, [26] think that the transformation of the energy mix needs to be guided by financial incentives to maintain China’s efficient energy production and consumption. From the Perspective of Pollution Sources, Chen et al. [27] found, through research, that China’s coal consumption is gradually declining, while India’s coal consumption is gradually increasing. International scrutiny and support for India’s emissions should be strengthened to link environmental pressures. Changes in the productivity index (LPI), which is related to energy and pollutant variables, are increasing from the southeast coast to the west inland, so Wu et al. [28] propose that the government needs to strengthen environmental regulations in the west. According to the power industry, several scholars have explored the carbon trading policies of the power industry. Chappin et al. [29] studied the impact of CO2 emissions trading (CET) on power company decisions in the context of oligopolies. Based on the carbon emission trading theory, the development potential of the power industry is analyzed in three aspects (Chu et al. [30]). Zhang et al. [31] investigated the market mechanisms of carbon emission trading in the power industry. Huang et al. [32] found that carbon trading has limited incentives for long-term investment in coal-fired power companies. For companies that implement carbon trading under the EU trading system, we find that enterprises with carbon emission allowances have higher profits than those without carbon emission allowances, and enterprises with high carbon emissions face higher carbon risks and higher expected benefits (Oestreich and Tsiakas [33]).
As far as we know, the existing literature mainly focuses on the impact of a single emission reduction trading mechanism (CET or PRT) on the economy and environment; there are few integrated analyses of CET and PRT for the power industry. Therefore, we think it is a problem worth studying. Kahrl et al. [34] concluded that although the trading policy has been implemented, the carbon dioxide emission of the power industry is expected to double in the next ten years with the increasing demand for electricity. Moreover, power enterprises are also the most important sources of pollutant emissions according to the data of the China Environment Statistical Yearbook (CESY) [35]. Thus, this study aims to explore the integrated efficiency of CET and PRT for the power enterprise. Motivated by the simulation research method of the emission control market in many recent studies (see, e.g., [12,16]), this paper will adopt the system dynamics (SD) simulation method to study the CET market and PRT market of Chongqing. The combined effect of the CET market and PRT market in Chongqing on the industrial economy of power, and its effect on the environment, will be analyzed. The policy suggestions of promoting CET and PRT will also be discussed. In Section 2, we analyze the logic of the SD model and establish a causal loop diagram and stock-flow diagram. Based on a qualitative analysis combined with quantitative formulas, the parameters and variables are explained. In Section 3, we first test the validity of the model; then, under different circumstances, the impact of transaction mechanism on corporate profit and the regional environment was analyzed, and optimization experiments were conducted to simulate the optimal situation. In Section 4, based on the simulation data, three simulation results are obtained, and reasonable suggestions are put forward for pollution rights trading and carbon emission trading in the power industry, to make the trading mechanism more effective in the power industry.
2. Modelling Methodology
2.1. Description of the Problem
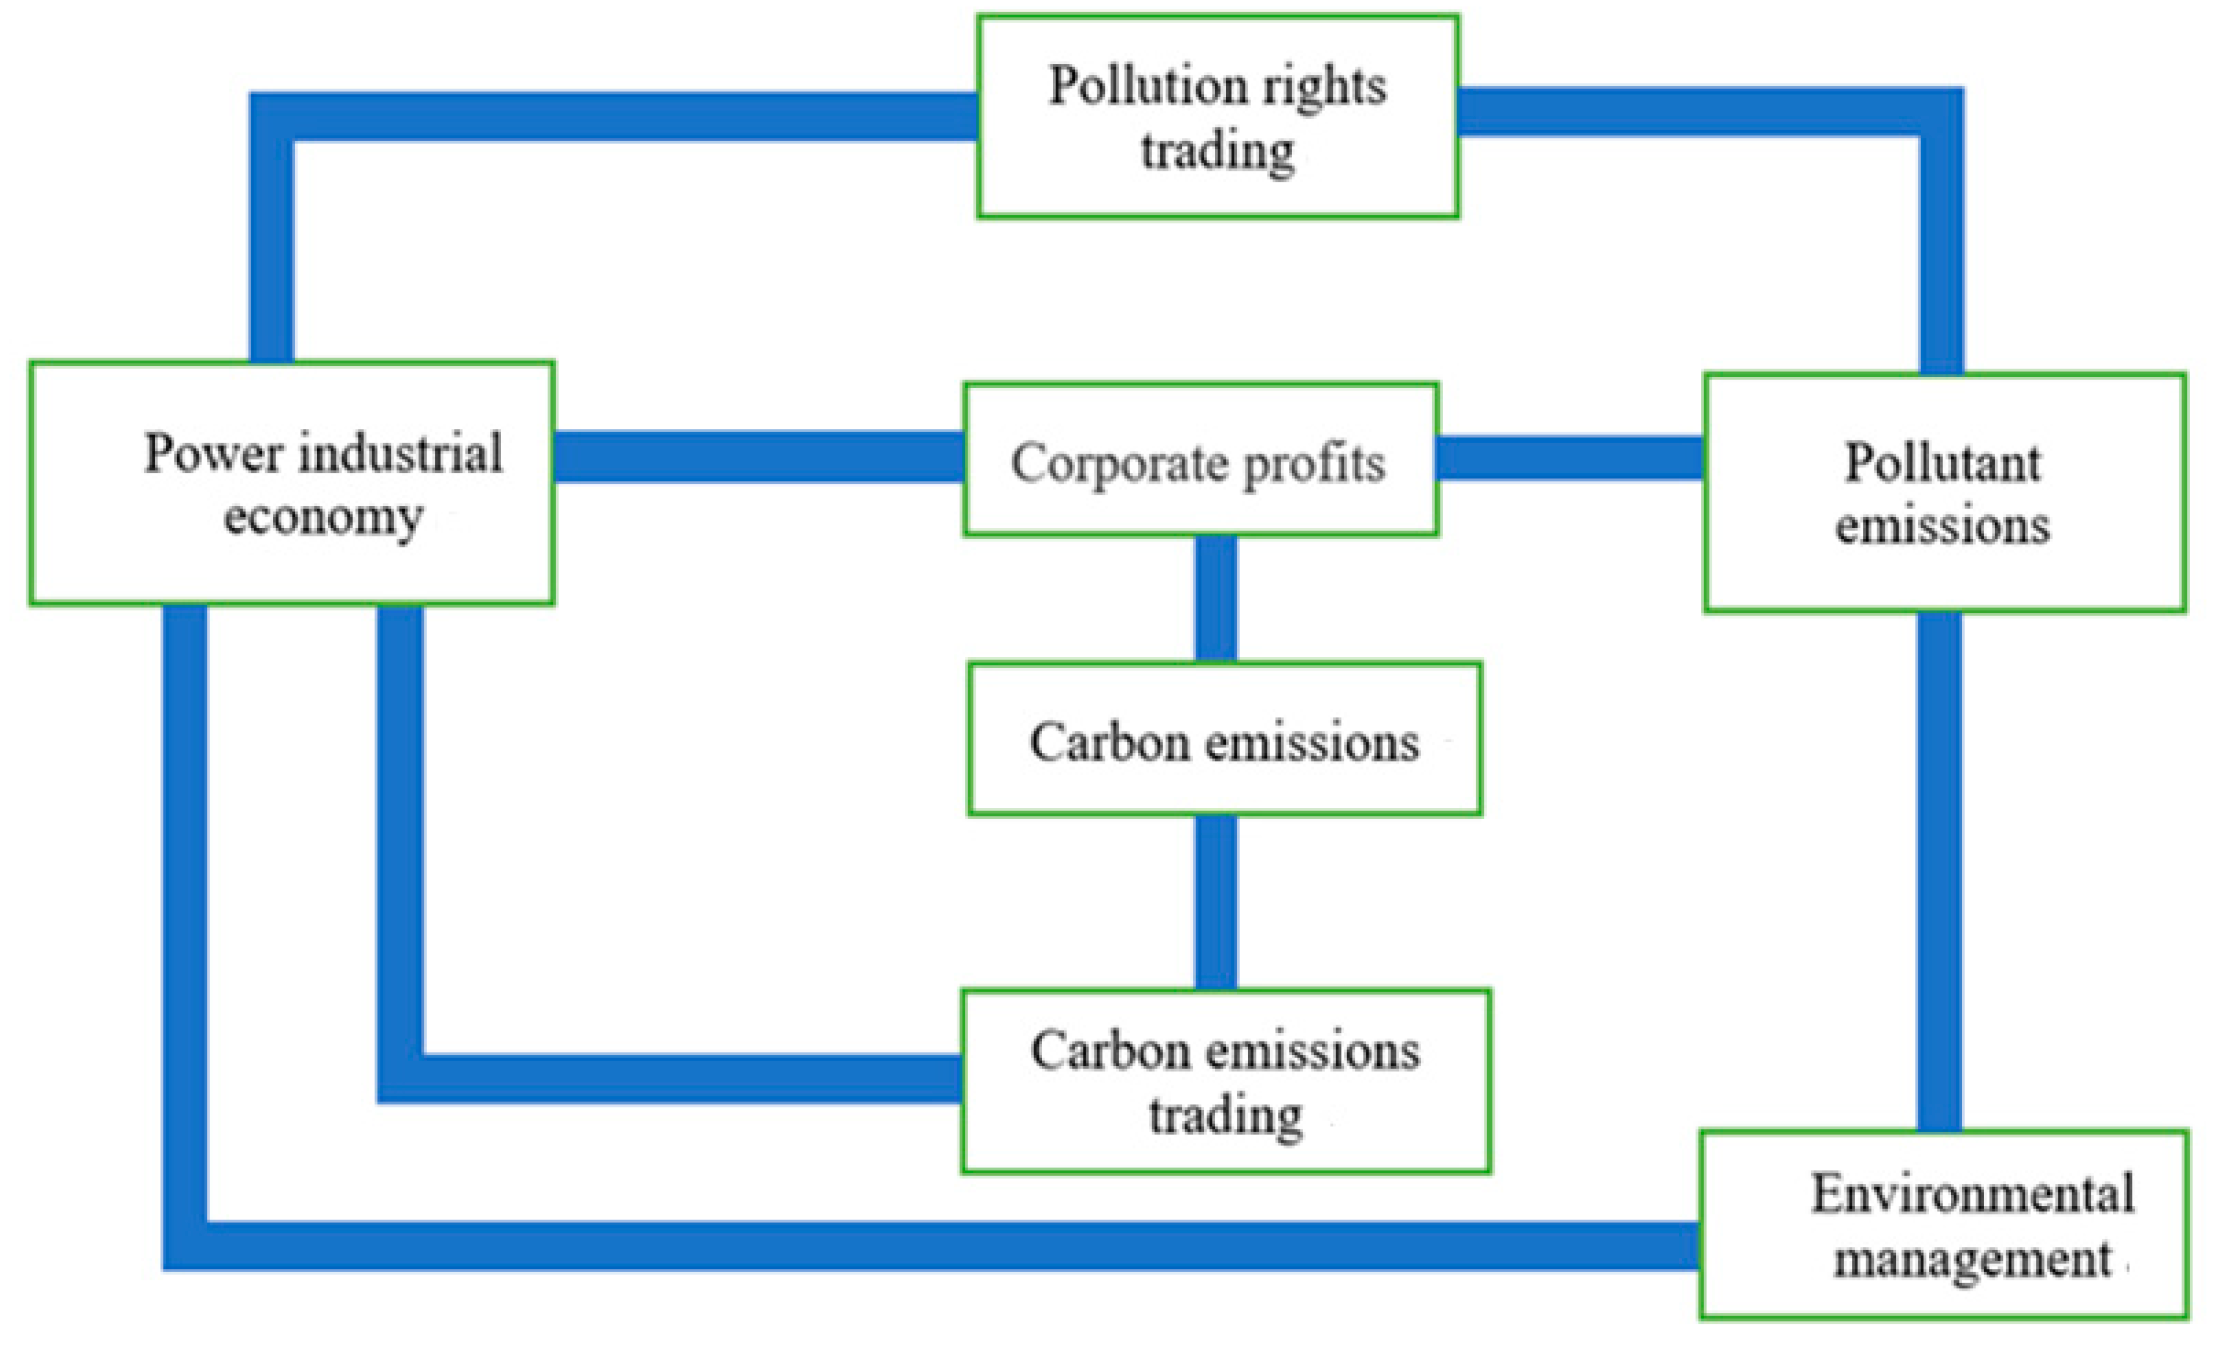
With the official launch of the carbon emission trading system, Chongqing has become the only city in western China to participate in the joint construction of the national carbon market, and it has taken the lead in China’s carbon trading market. As the only western city participating in carbon trading, the analysis of its trading impact can provide valuable experience for western cities and provide favorable support for further national policy release. In this paper, Anylogic software is used to establish the dynamic model of the combined system of carbon trading and pollution rights trading of Chongqing coal and power enterprises, which include five main parts: industrial power economy, corporate profit, carbon trading, emission trading, and environment. The increase of the industrial power economy promotes the growth of enterprises, while the increase of corporate profits leads to the increase of pollutants and carbon emissions. Under the influence of the implementation of trading policies, it also promotes environmental governance, thus jointly affecting the industrial power economy in two aspects. The specific logic frame diagram is shown in Figure 1.
The economic growth of the power industry increases the profit of enterprises through the role of subsidies, and the increase of profit will promote enterprises to expand scale, thus increasing the total coal consumption of enterprises, thus leading to an increase of CO2 and pollutant emissions. At this point, the two transaction policies and the three aspects of environmental governance jointly affect the economic situation.
2.2. Software Introduction
AnyLogic is a widely used tool for the modeling and simulation of discrete, system dynamics, multi-agent, and hybrid systems. Based on the latest complex system design methodology, it is the first tool to introduce the UML language into the field of model simulation. Compared with other simulation software, it has unique advantages in system dynamics, such as convenient dragging of variables and parameters, convenient writing of relations, and having a database interface. Due to the powerful integration ability, chart output ability, and experimental analysis ability of Anylogic, we can use the system dynamics module of the Anylogic software to conduct complex dynamic system simulations and study the model mechanism. In this paper, we first used Anylogic software to draw a causal loop diagram in the system dynamics section, followed by the drawing of the stock flow diagram and the demarcation of the subsystem. Finally, after validity verification, a comparative operation experiment and optimization experiment were established in the experimental section to complete the model construction and analysis in this paper.
2.3. Causal Circuit Diagram
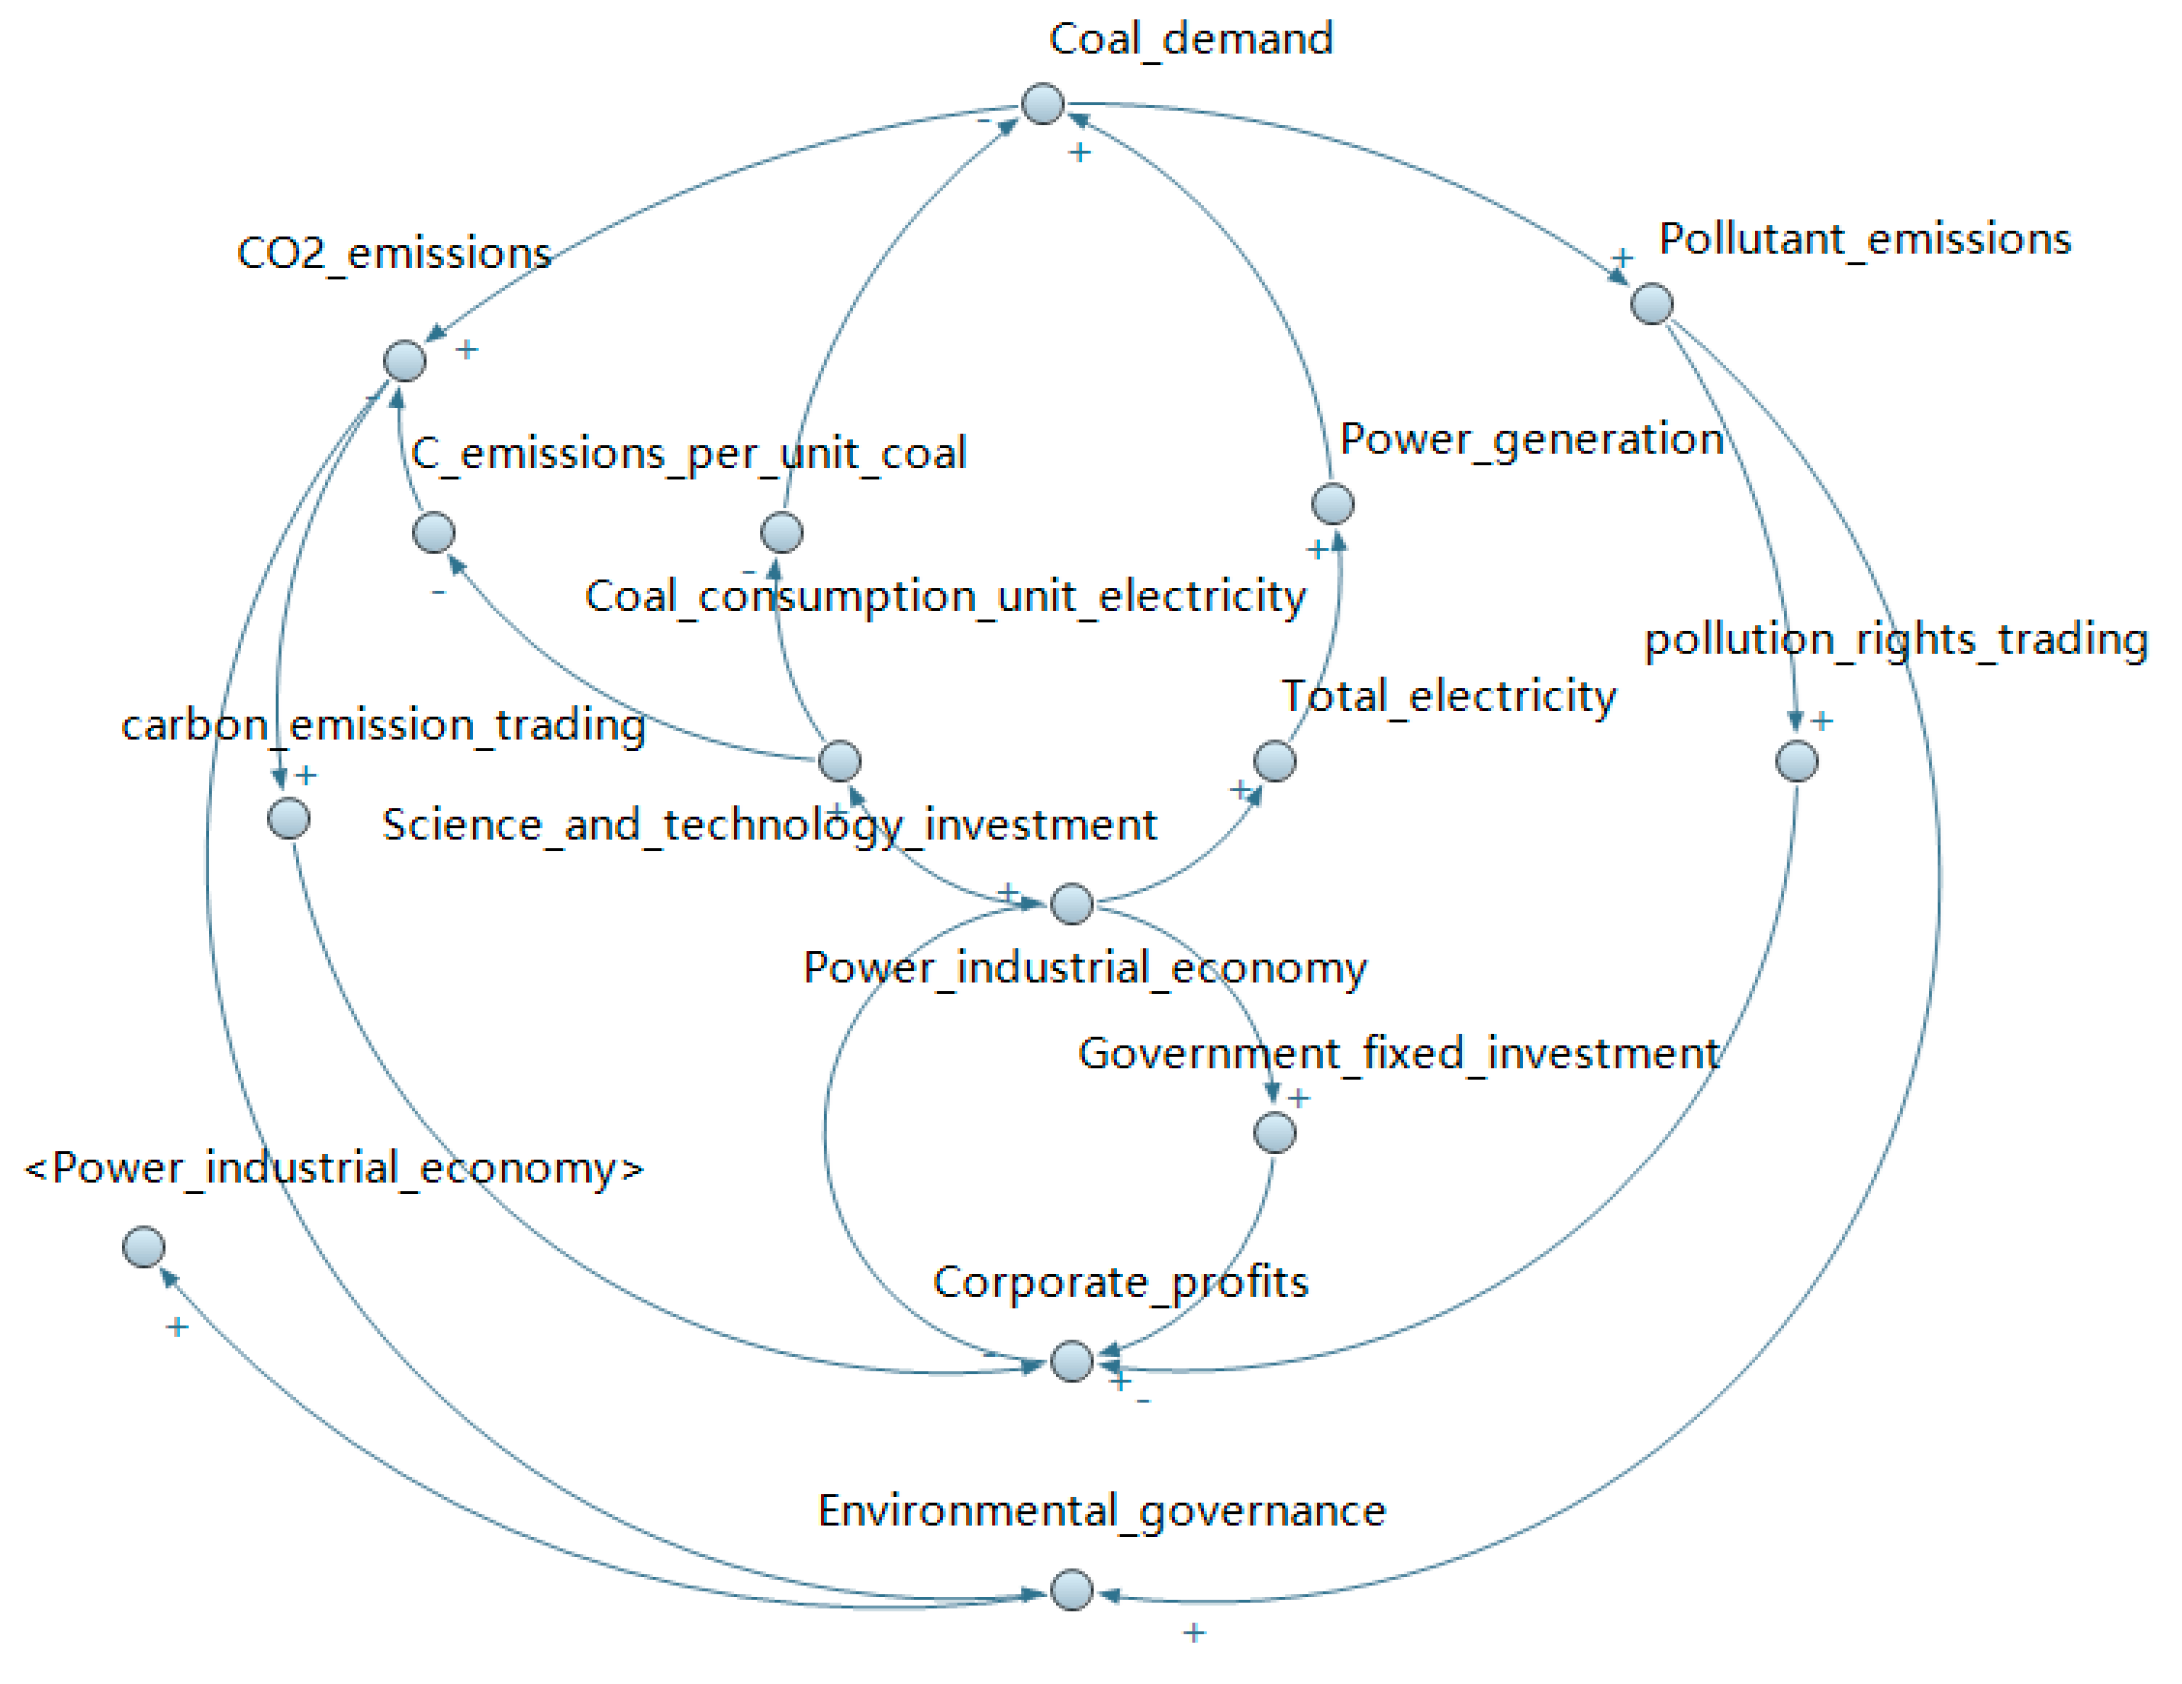
According to the transaction mechanism and model frame diagram, the causal circuit diagram of the model is constructed by using Anylogic software, as shown in Figure 2.
There are six major feedbacks in the causal loop diagram, three of which are negative, and three of which are positive.
Industrial power economy→ (+) Government fixed investment→ (+) Corporate profits→ (+) Industrial power economy
The development of the economy enables the government to invest more capital to support enterprises, which can increase their profits and ultimately promote economic growth.
1. CO2 emissions→ (+) Carbon emission trading→ (−) Corporate profits→ (−) Science and technology investment→ (+) CO2 emissions
Increased carbon dioxide emissions promote the implementation of carbon trading policies, which will have a certain impact on the profits of enterprises, resulting in slow regional economic growth and reduced investment in science and technology, thus slowing down the reduction of carbon dioxide emissions.
2. CO2 emissions→ (+) Environmental governance→ (+) Industrial power economy→ (+) Science and technology investment→ (−) CO2 emissions/ (−) Coal consumption per unit of electricity→ (−) Coal demand→ (−) CO2 emissions
Carbon dioxide emissions would increase the cost of environmental governance, which can be incorporated into the industrial power income, which can increase the country’s science and technology investment, improve energy efficiency, thereby reducing unit coal carbon and carbon emissions; on the other hand, it can also decrease the number of units needed for coal power generation, reducing coal demand, and thereby reducing carbon dioxide emissions.
3. Pollutant emissions→ (+) Environmental governance→ (+) Industrial power economy→(+) Science and technology investment→(−) Coal consumption per unit of electricity→ (−) Coal demand→ (−) Pollutant emissions
The emission of pollutants has increased the cost of environmental governance, thus contributing to industrial power’s economic growth. The state has increased its investment fund in science and technology, and technological progress has reduced the amount of coal required for each unit of power generation, thus reducing the number of pollutants discharged.
4. Pollutant emissions→ (+) Pollution rights trading→ (−) Corporate profits→ (−) Industrial power economy→ (−) Science and technology investment→ (+) Coal consumption per unit of electricity→ (+) Pollutant emissions
The emission of pollutants promotes the implementation of pollution rights trading policies, which correspondingly reduces the profits of enterprises, leads to the slow growth of the industrial power economy, and reduces the investment in science and technology, thus slowing down the reduction rate of pollutant emissions.
5. Carbon and pollutant emissions→ (+) Trade policy→ (−) Corporate profits→ (−) Industrial power economy→ (−) Total electricity→ (−) Power generation→ (−) Coal demand→(−) Carbon and pollutant emissions
The emissions of carbon and pollutants promote the implementation of trading policies, which hurt corporate profits and inhibit industrial power’s economic growth. The slow growth of total electricity use reduces the demand for coal burning and ultimately reduces carbon dioxide emission.
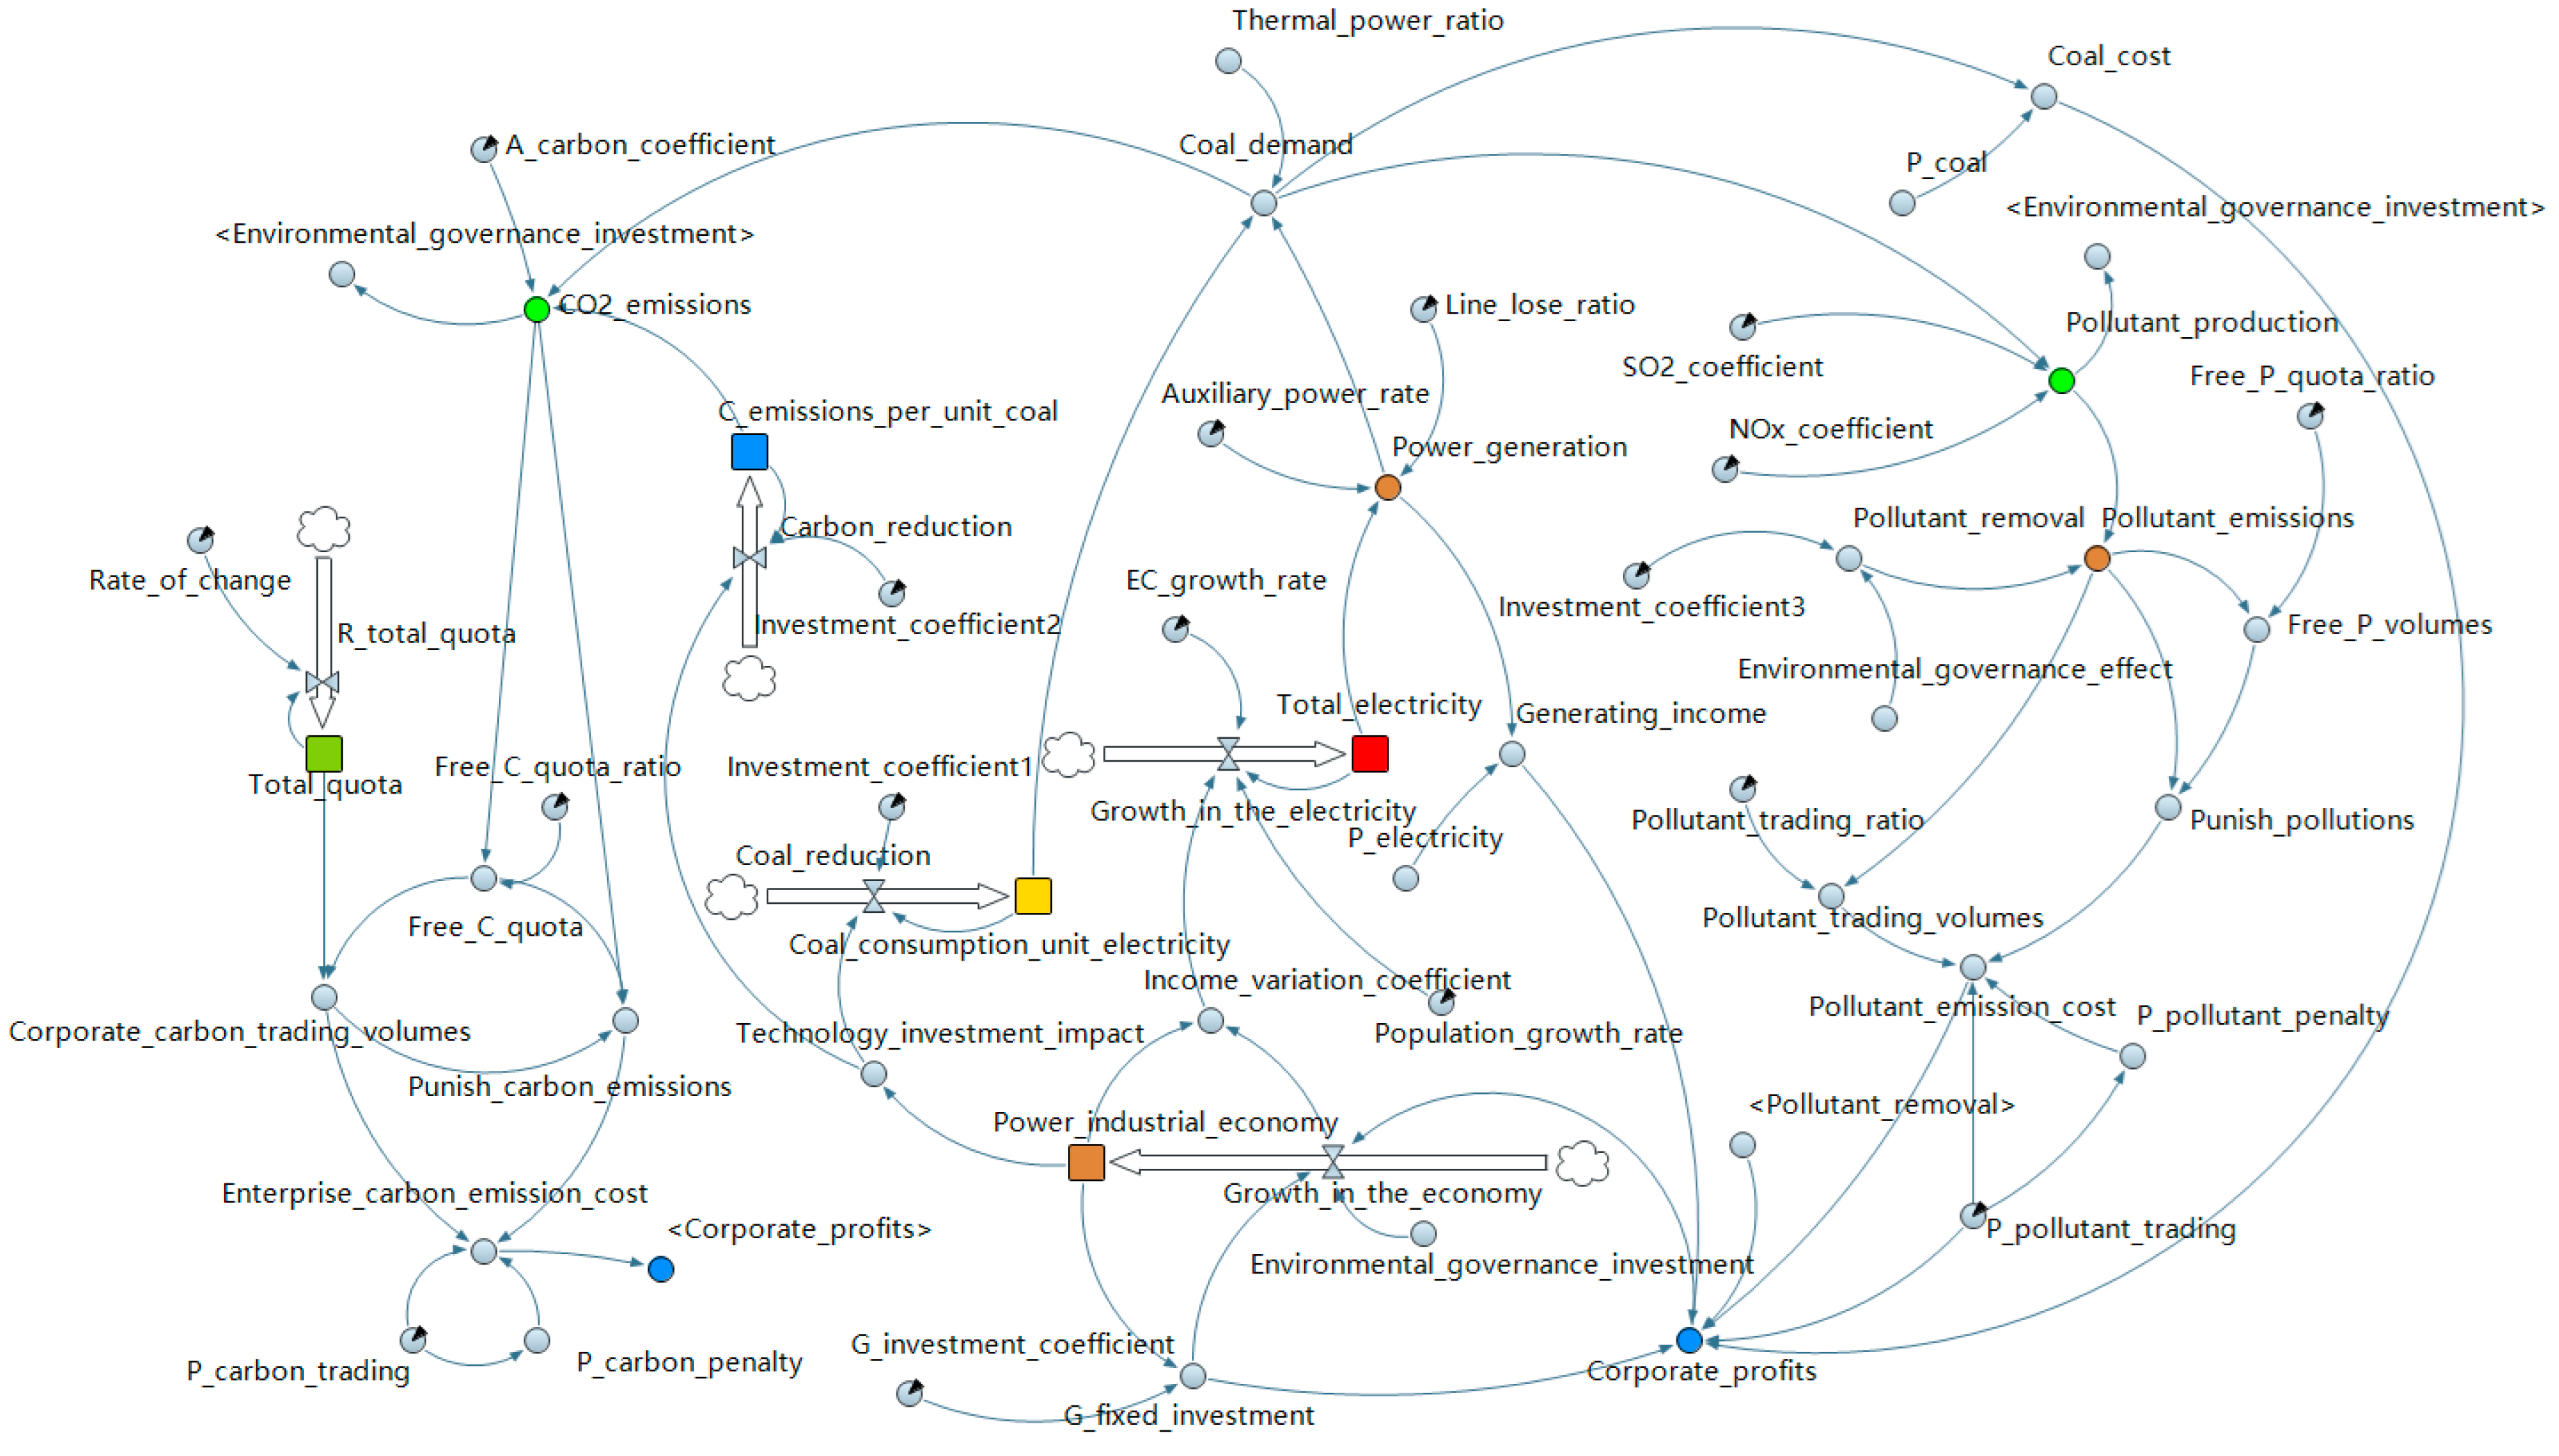
2.4. Stock Flow Diagram
According to the causal loop diagram, the stock flow diagram of coal power enterprises under the integration of carbon trading and emission trading is established, as shown in Figure 3.
This model is mainly divided into three subsystems: carbon trading subsystem (Left), economic subsystem (Middle), and pollutant trading subsystem (Right). Under the joint action of the three, the development situation and regional environment of the power industry are studied. In the process of model construction, all the data required were taken from the references of China low-carbon industry network, National Development and Reform Commission (NDRC), China carbon trading network, Chongqing carbon trading centre, the clean energy network, etc.
2.5. Main Parameters and Variables
In this paper, the entire power industry in Chongqing is selected. The enterprise profit, coal demand, and other variables are derived from the annual report of the Chongqing city. The system dynamics model is mainly divided into parameters and variables. Variables can be divided into endogenous variables and exogenous variables.
The exogenous variables of the model are mainly obtained by referring to databases, literatures, official websites, etc., mainly including the industrial power economy, carbon emission coefficient, investment coefficient, government fixed investment coefficient, carbon quota free ratio, carbon trading price, pollution emission ratio of free quota, pollutant trading price, etc. The carbon trading price and pollutant trading price come from China’s low carbon industry net.
The endogenous variables of the model mainly include regional economic growth, fixed government investment, carbon emission costs, pollution rights trading costs, scientific and technological investment, pollutant trading volume, and carbon trading volume. Based on the qualitative analysis, the formula is obtained according to the variable relationship in the system dynamics model (SD). The main variables and parameters are shown in Table 1 and Table 2.
Here, we mainly choose two variables for a detailed explanation. The calculation of carbon emissions is the carbon emission per unit of standard coal multiplied by the coal demand of the enterprise and then multiplied by an actual carbon emission coefficient. Emissions of pollutants are the sum of SO2 emissions per unit of coal and NOx emissions per unit of coal multiplied by the demand for coal and then subtracted by the amount of reduction imposed by the government. In recent years, China has been very strict in the control of heavy polluting enterprises, so the government’s role has made the emission of pollutants decline.
In Table 2, all the parameters are from the official website of the Chinese government, and the carbon trading price is from the low-carbon industrial network of China. To make the simulation more obvious, the initial price of carbon trading is set at 40 yuan/ton. Since only SO2 and NOX are traded in Chongqing, we set their prices as the product of their transaction prices and the corresponding transaction proportion. The emission coefficient of SO2 and NOX is based on the emission data of unit standard coal in Chongqing. The proportion of the free quota is based on existing national policies and literature. The proportion of fixed government investment is set by reference [36]. The line loss rate and power utilization rate are based on the actual situation in China and the standard data published by the state grid. The change rate of the total quota comes from the Chongqing development and reform commission, and its setting is based on previous average data.
In this model, we use some abbreviations to make the model cleaner, as shown in Table 3.
3. The Empirical Research
3.1. Validation Test
In order to match the simulation results with the actual situation, the validity of the model was tested. Three variables, coal demand, power generation and pollutant emissions, were selected in this paper. The fitting value from 2008 to 2017 was obtained through simulation and then compared with the real value to verify the effectiveness of the model. Specific data are shown in Table 4 below. The results show that the error of each variable in each year is less than 5%, which is acceptable. The empirical results show that the system dynamics model constructed in this paper can fully reflect the economic situation, corporate profits, and the relationship between variables in Chongqing.
3.2. Simulation Scenario Design
To explore the impact of different carbon trading and pollution rights trading on Chongqing’s industrial power economy and corporate profits, the model simulates the situation in 2012–2025 with a step size of one year. The study set up six scenarios, including basic scenario (BASE), carbon trading price scenario (A1–A3), free carbon quota proportion scenario (B1–B3), pollution rights trading price scenario (C1–C3), free emission trading quota proportion scenario (D1–D3), pollution rights trading, and carbon emission trading integration mechanism scenario (E1–E3). In the carbon trading scenario, there is no pollution rights trading. According to the average carbon trading price in Chongqing in recent years, the trading price is set at 30, 50, and 60 yuan/ton; Under the scenario of free carbon quota proportion, the quota proportion is set as 0.4, 0.6, and 0.8, respectively. Under the circumstance of pollutant emission trading, according to the transaction prices of pollutants in Chongqing environmental protection bureau and other regions, the transaction prices of pollutants are set as 1500, 2000, and 2500 yuan/ton, and the proportion of the free quota is 0.3, 0.55, and 0.8, respectively. The specific numerical settings are shown in Table 5.
3.3. Simulation Analysis
3.3.1. The Impact of Carbon Emissions Trading and Pollution Rights Trading
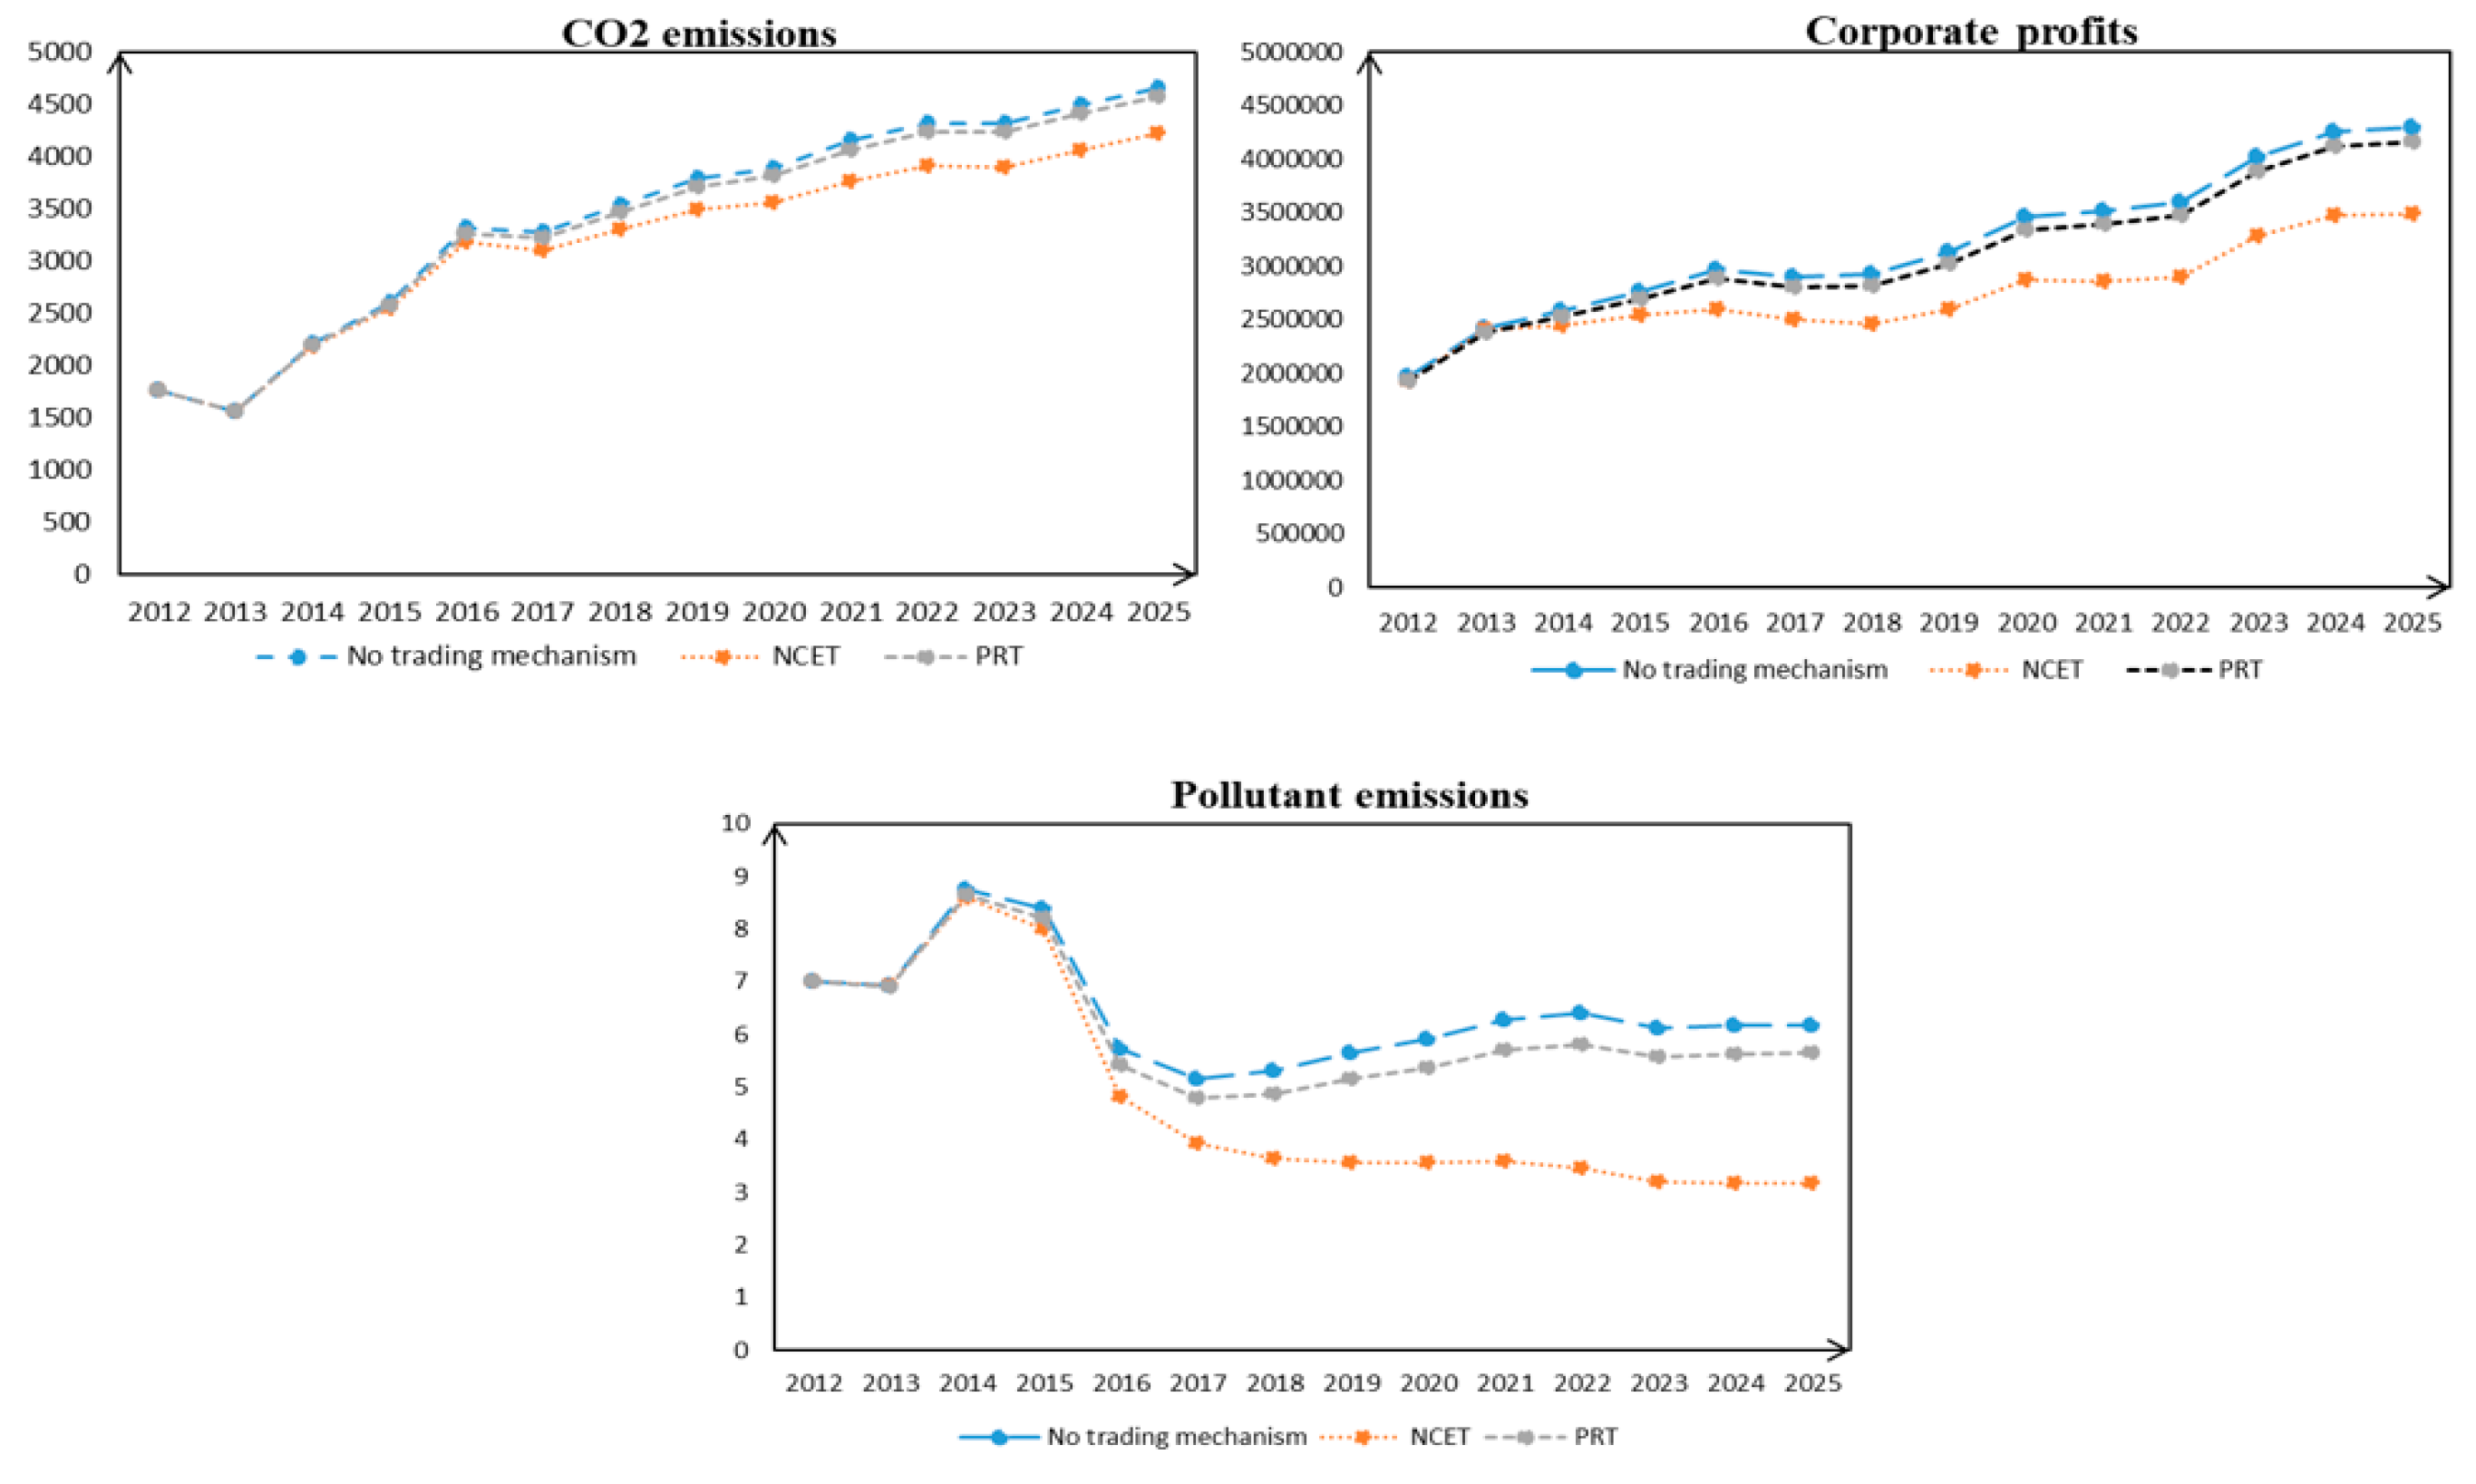
The carbon trading policy of Chongqing began to be implemented in 2014, and the pollution rights trading policy was implemented in 2010. Through the simulation, we imitate the situation of 2012–2025. We can see clearly from Figure 4, along with the implementation of policy, that carbon dioxide emissions and pollutants emissions are significantly reduced, but at the same time, the industry economy also fell.
In carbon trading, if the price is 40 yuan per ton (NCET), compared with not implementing the trading mechanism, industrial power’s profits fell by 18.56% in 2025, and carbon dioxide emissions fell by 9.19%. Further, when the pollutant price was 1600 yuan per ton (PRT), compared with the unimplemented trading mechanism, the profit of enterprises decreased by 3.1%, and the pollutant emissions decreased by 8.55%. We were surprised to find that the impact of emission rights on corporate profits is slightly smaller than that of carbon emission trading, but at the same time, it has almost the same effect of emission reduction as carbon emission trading.
3.3.2. The Interaction of Trading Mechanisms
To explore the impact of different carbon trading policies on pollutant emissions and Corporate profits, we simulated two scenarios: a carbon trading price scenario (A1-A3) and free a carbon quota ratio scenario (B1-B3).
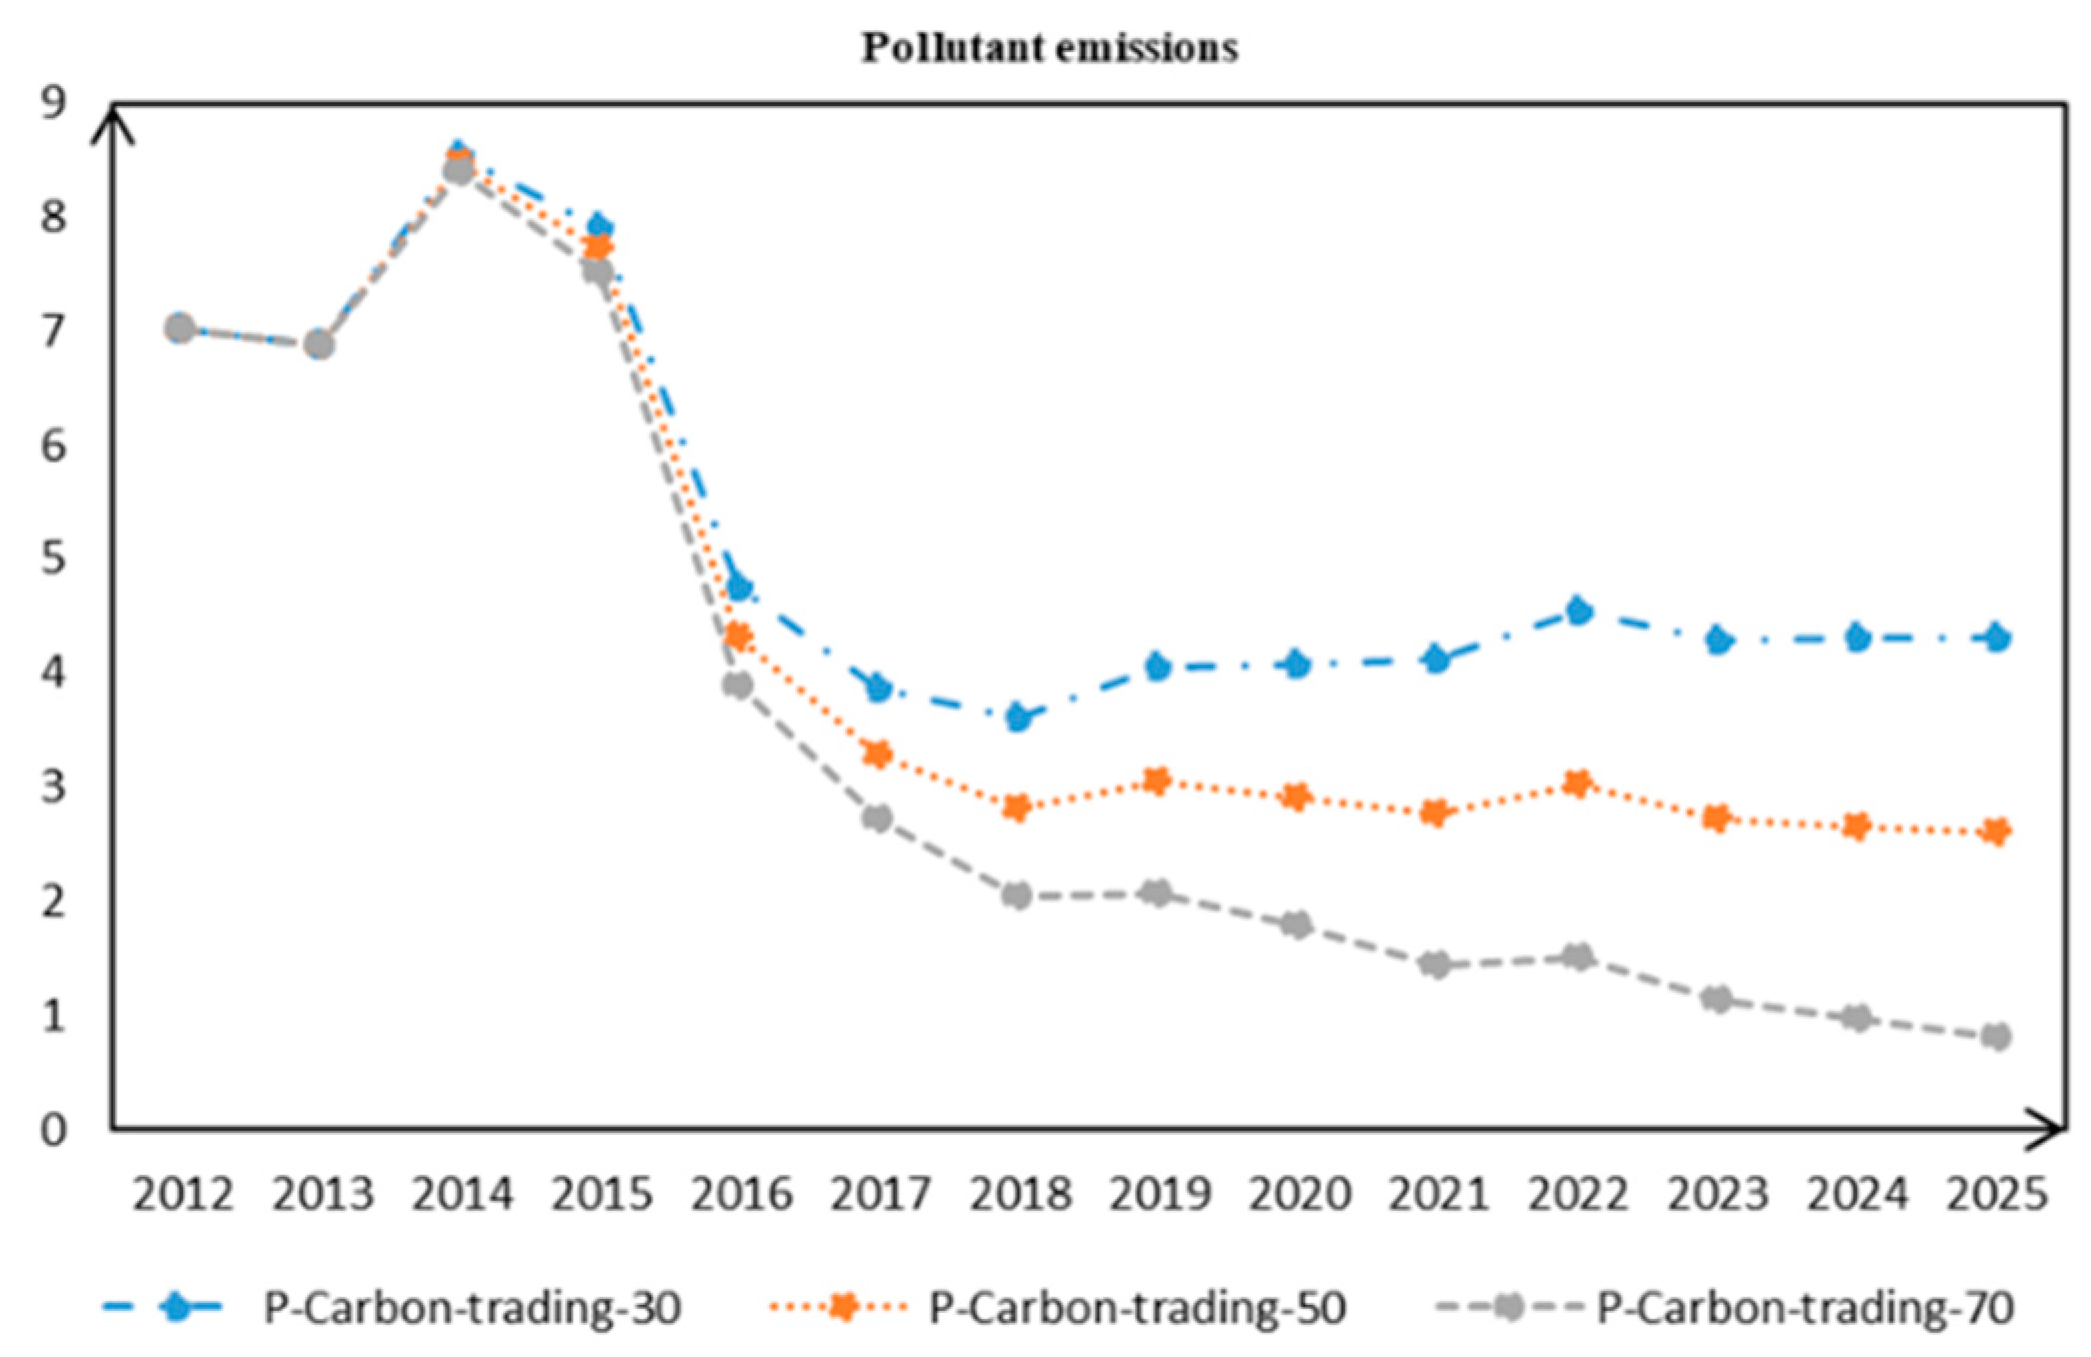
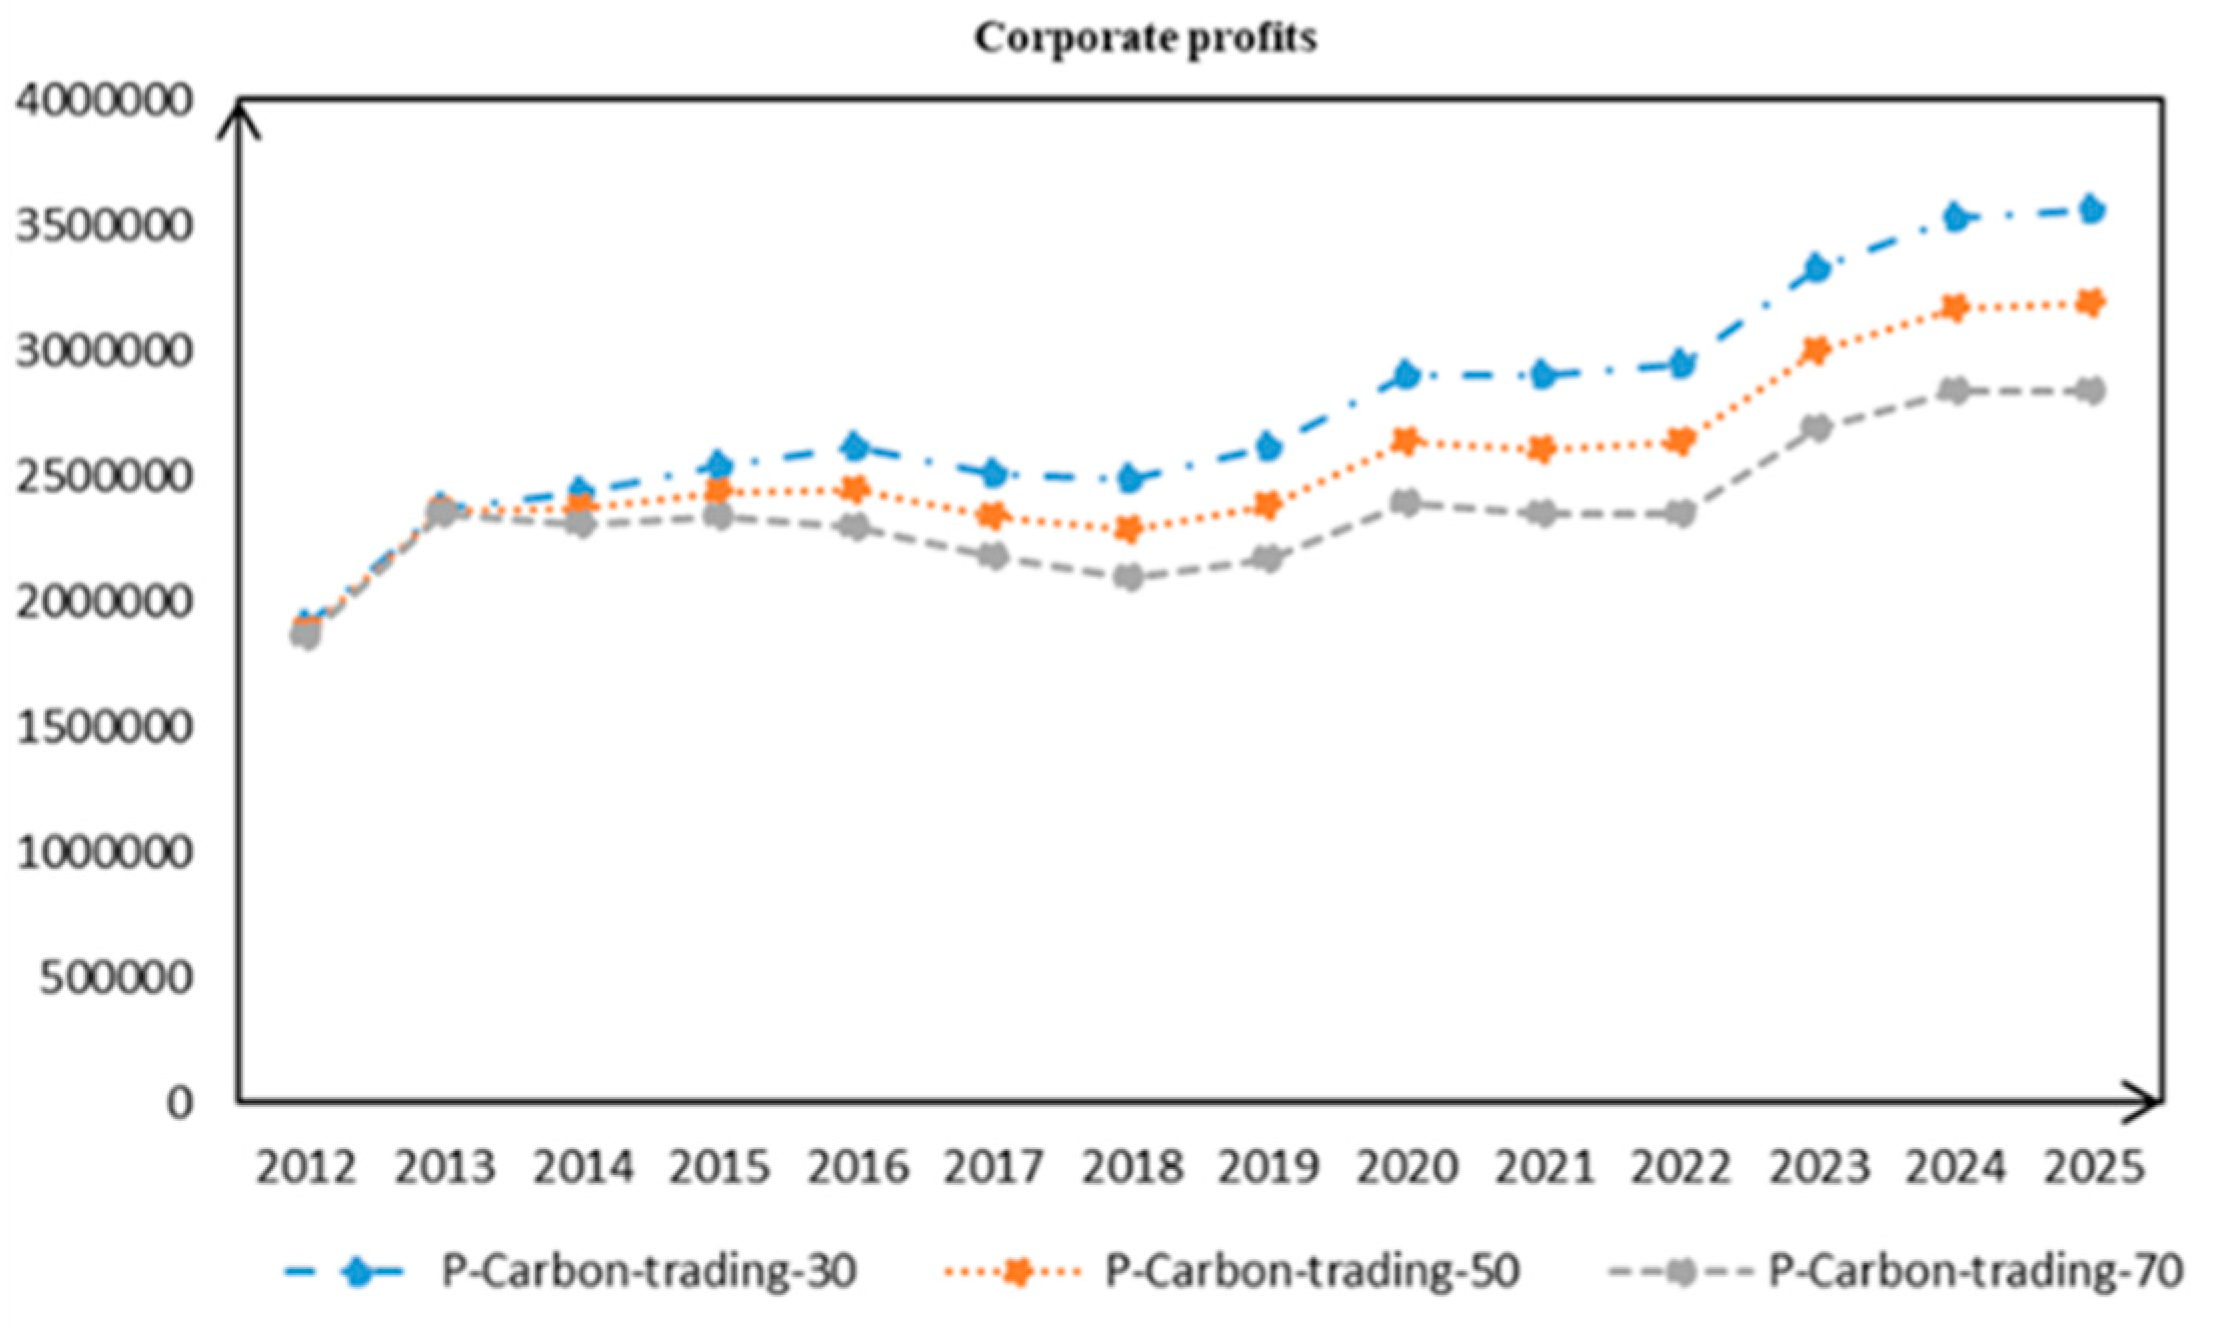
1. Different carbon trading prices
From A1 to A3, the carbon trading price increases gradually, which means the transaction cost increases gradually. As can be seen from Figure 5, when the carbon trading price keeps changing, the pollutant will also change. The simulation forecast is that in 2025, when the carbon trading price is 40 yuan per ton, the pollutant emission will be 35,540 tons, and the enterprise profit will be 33,828.13374 million yuan. At this point, the carbon prices of 30, 50, and 70 will be set, respectively, compared with the benchmark of 40 yuan, that is, when the price is changed to –25%, 25%, and 75%, respectively, the pollutant emissions will be 43,000, 26,050 and 8180 tons, respectively, which will have then decreased by –20.9%, 26.7%, and 76.9%, respectively. At this time, corporate profits will be 35,590.00, 31,863.52, and 28,416.70 million yuan, respectively, which will have decreased by –5.2%, 5.8%, and 15.9%, respectively. When the carbon price rises, the emission of pollutants will also decrease, as the emission of pollutants is highly correlated with carbon trading. This result shows that the carbon trading mechanism is necessarily linked with pollutant emissions, and the same is true for corporate profits (Figure 6).
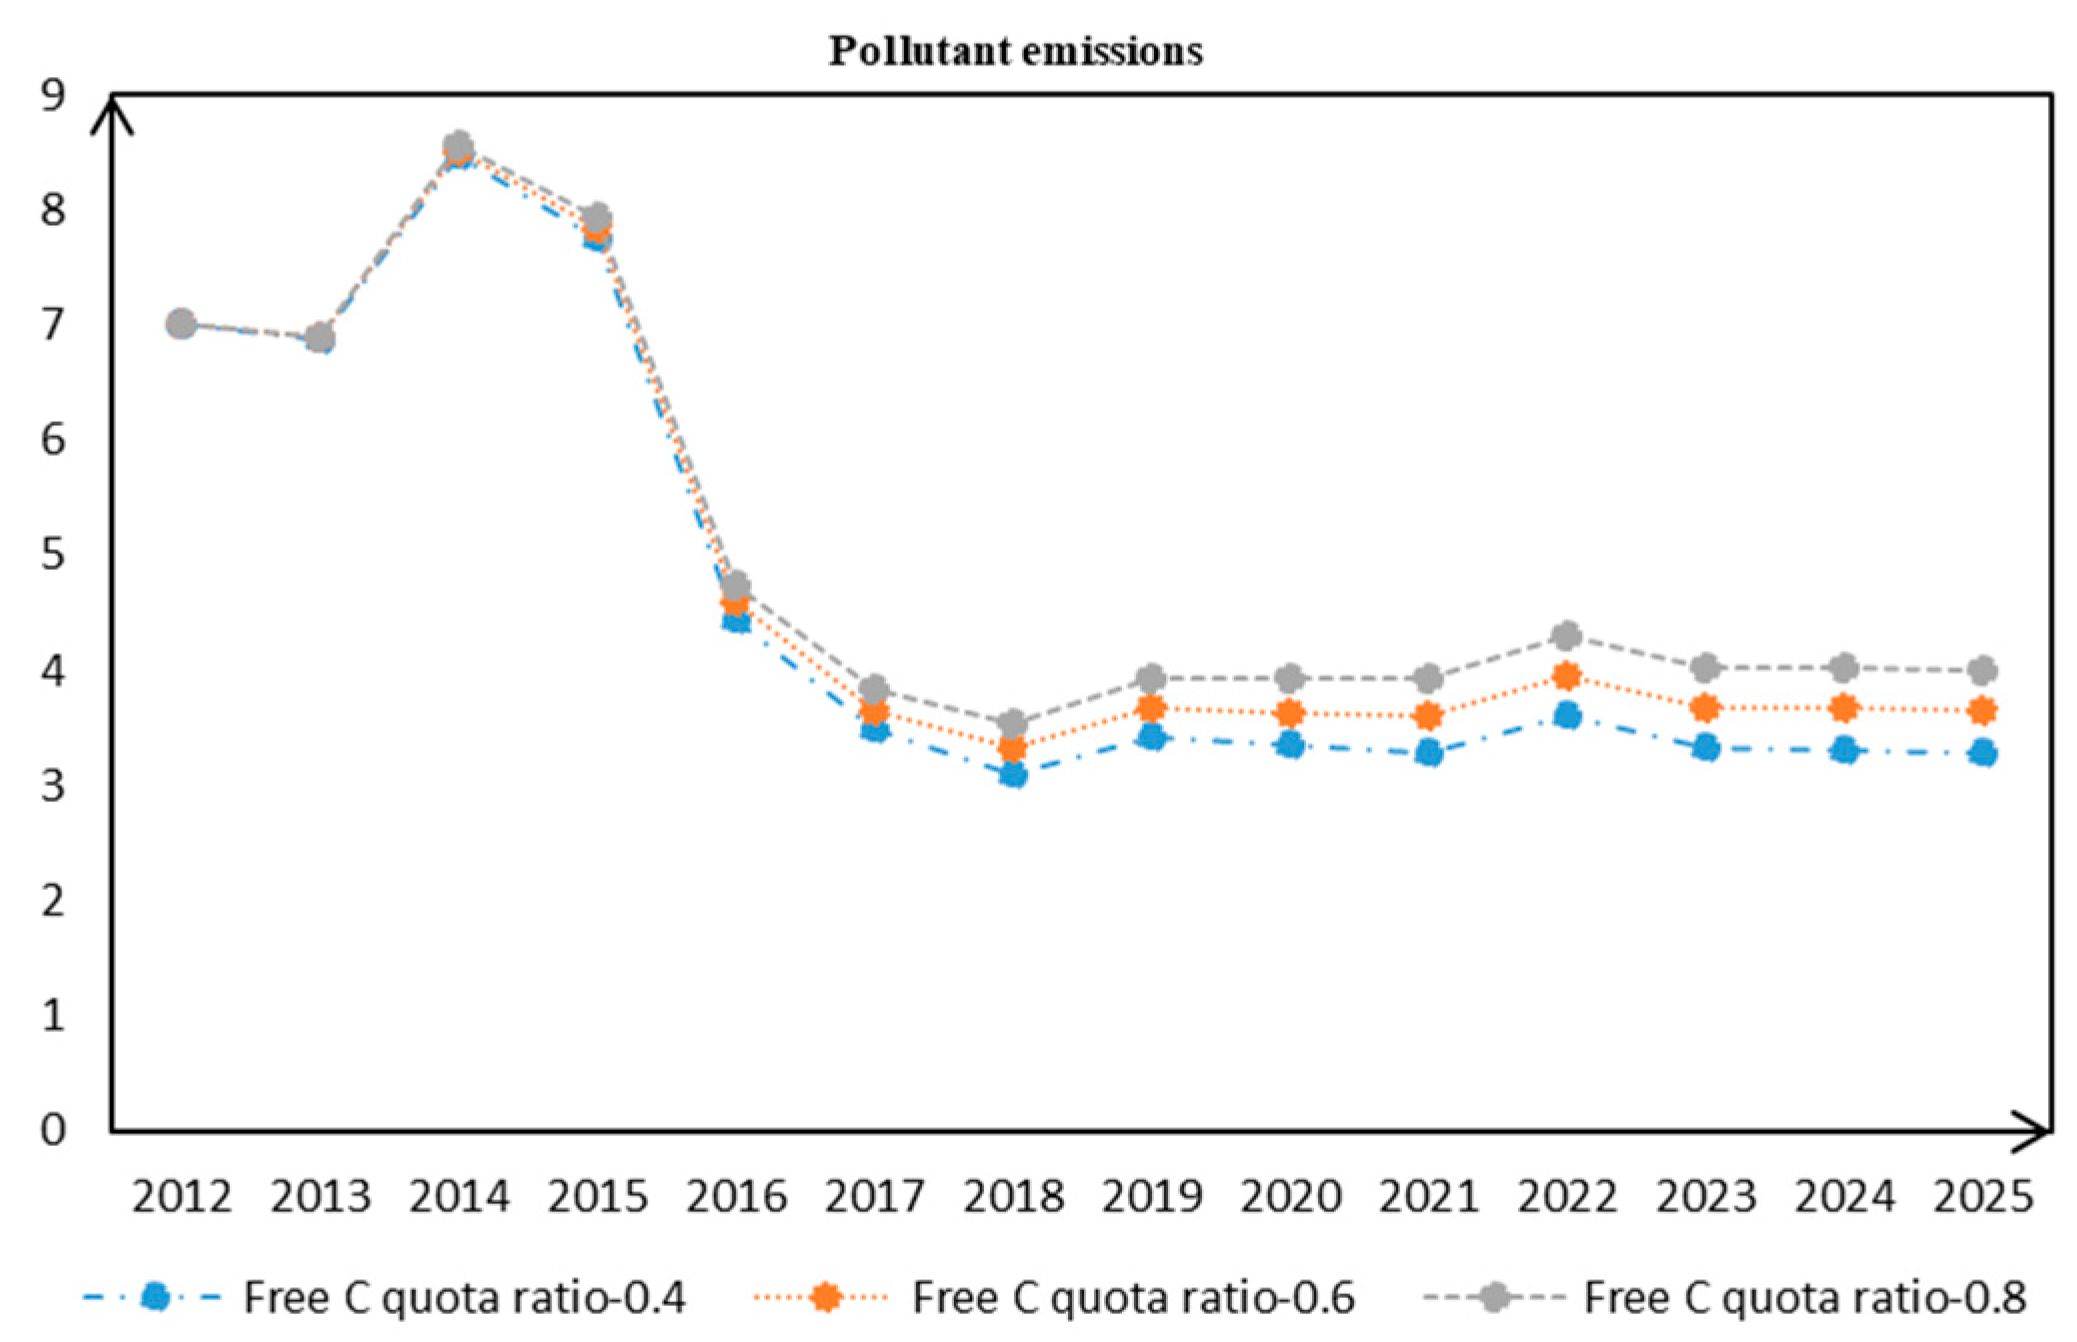
2. Different free carbon quota ratio
Figure 7 shows the influence of the different proportion of the free carbon quota on pollutant emission. From B1 to B3, the proportion of free carbon quota increases gradually. The simulation results show that when the proportion of free carbon quota changes, the pollutant emissions will also change. When the proportion of free carbon quota is 0.4, 0.6, and 0.8, respectively, the growth rate of pollutant emissions is −5.22%, 5.13%, and 15.22%, respectively. The above data show that, with the continuous growth of the proportion of free carbon quota, the emission reduction effect of pollutants will gradually decline, and the emission reduction effect of the trading mechanism will be continuously weakened. Therefore, the country needs to consider the emission reduction effect of pollutants in the proportion setting of the free carbon quota.
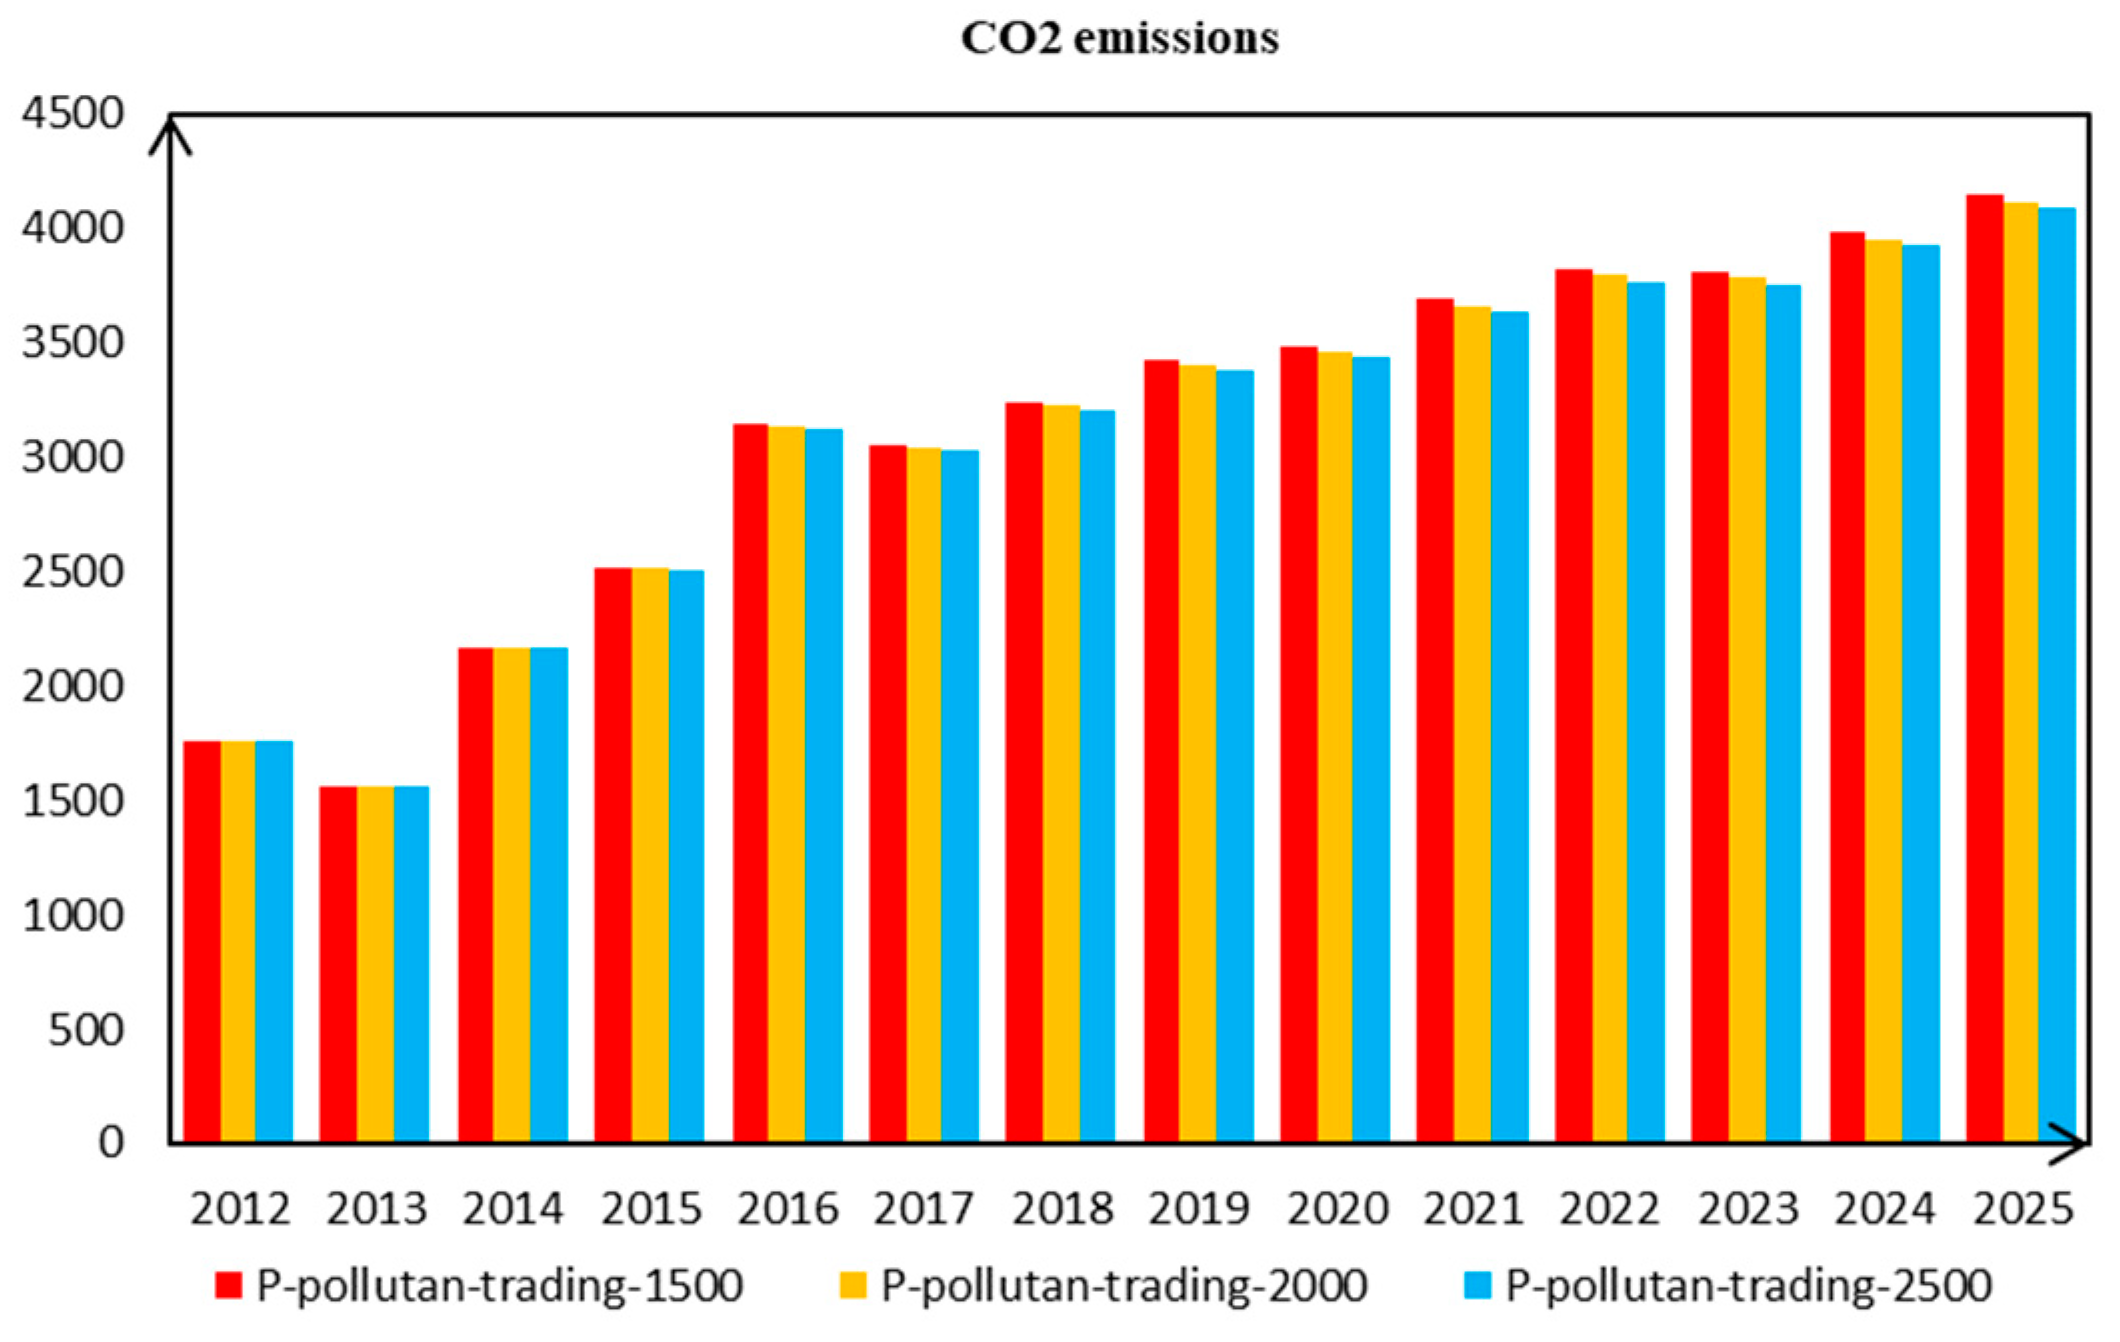
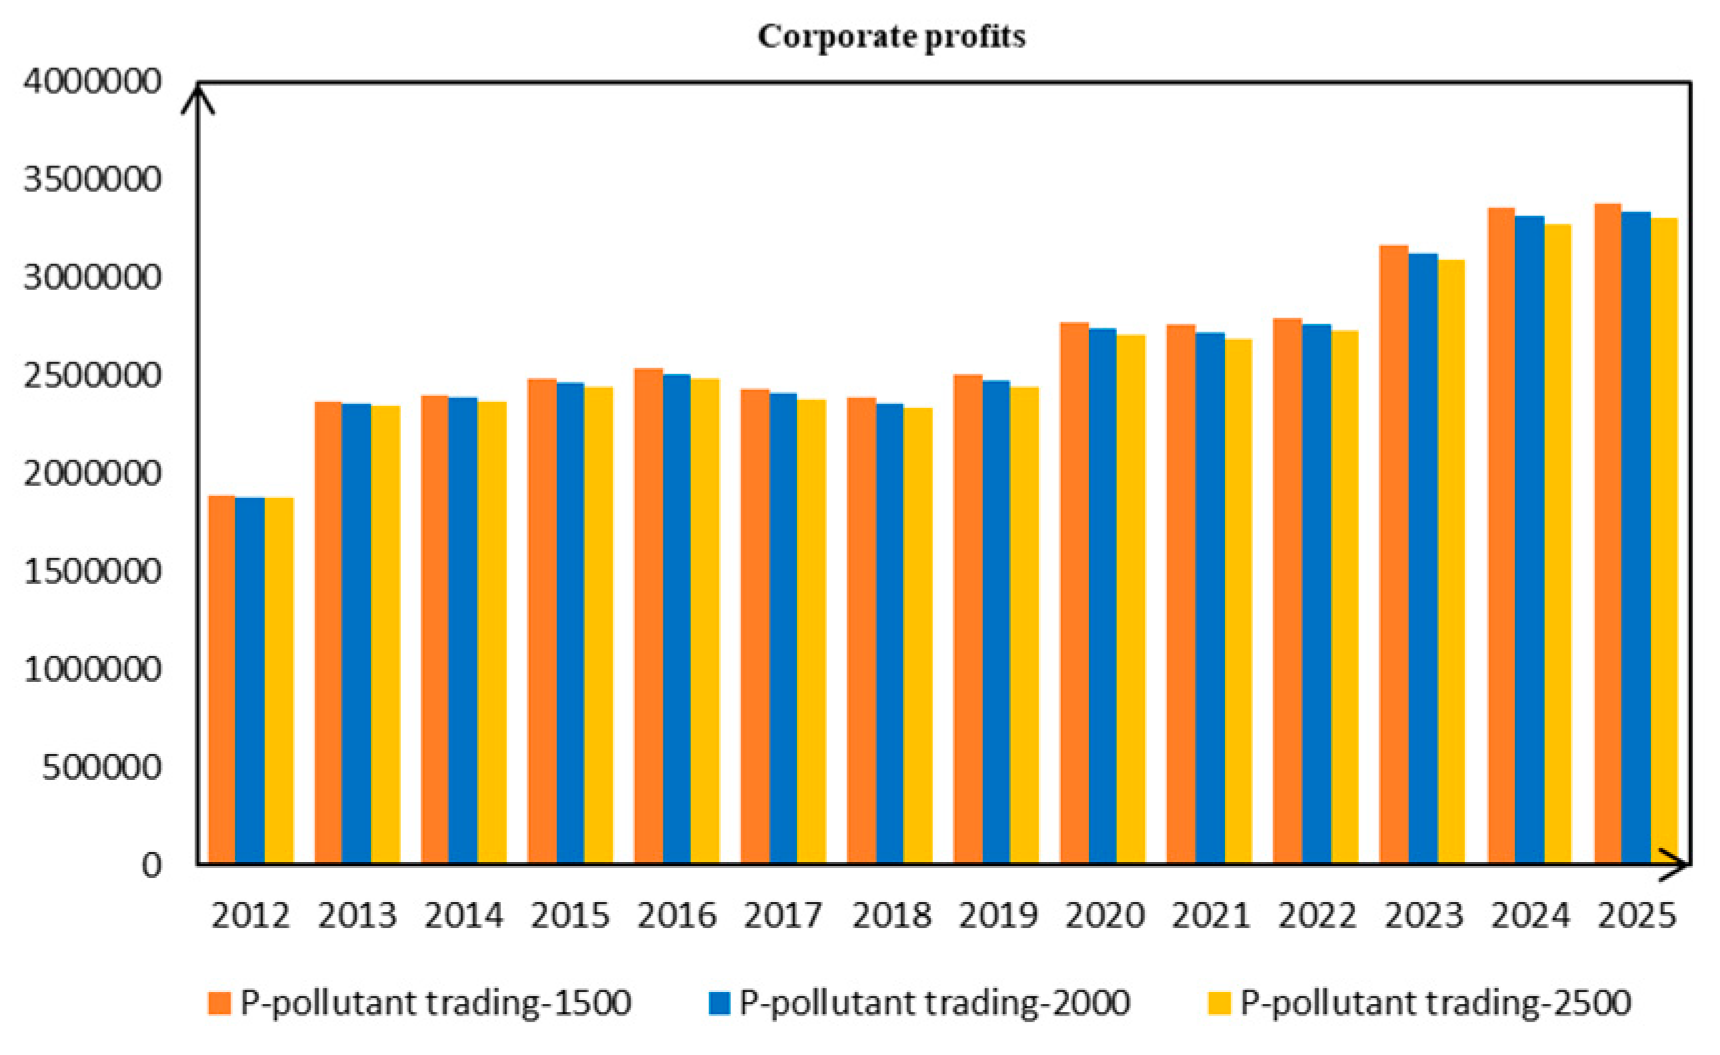
In exploring the effects of the carbon trading mechanism of pollutant discharge, we also consider the pollution rights trading mechanism, whether the impact on CO2 emissions will. Therefore, we conducted six sensitivity analysis experiments at C1–C3, and D1–D3 to explore the influence on carbon trading, emission trading transaction prices for different pollutants, and different pollutant free quota proportions, as shown in Figure 8. To our surprise, we found that, through the simulation experiment, when the pollutant market price rises, carbon dioxide emissions will be reduced, but the reduction will be modest, as the effect is not extremely obvious. At the same time, the inhibition on corporate profits is not obvious (as shown in Figure 9).
We also conducted an experiment on the proportion of the free pollutant discharge quota and found that it had no significant effect. Given this situation, we believe that pollution rights trading has a small impact on carbon emissions trading because the total amount of pollutants is relatively small and the impact on the economy is small. Also, the government strictly controls SO2 and other pollution gases, and the market mechanism has a small effect, so it has no obvious effect on the carbon trading mechanism.
3.3.3. Simulation Optimization
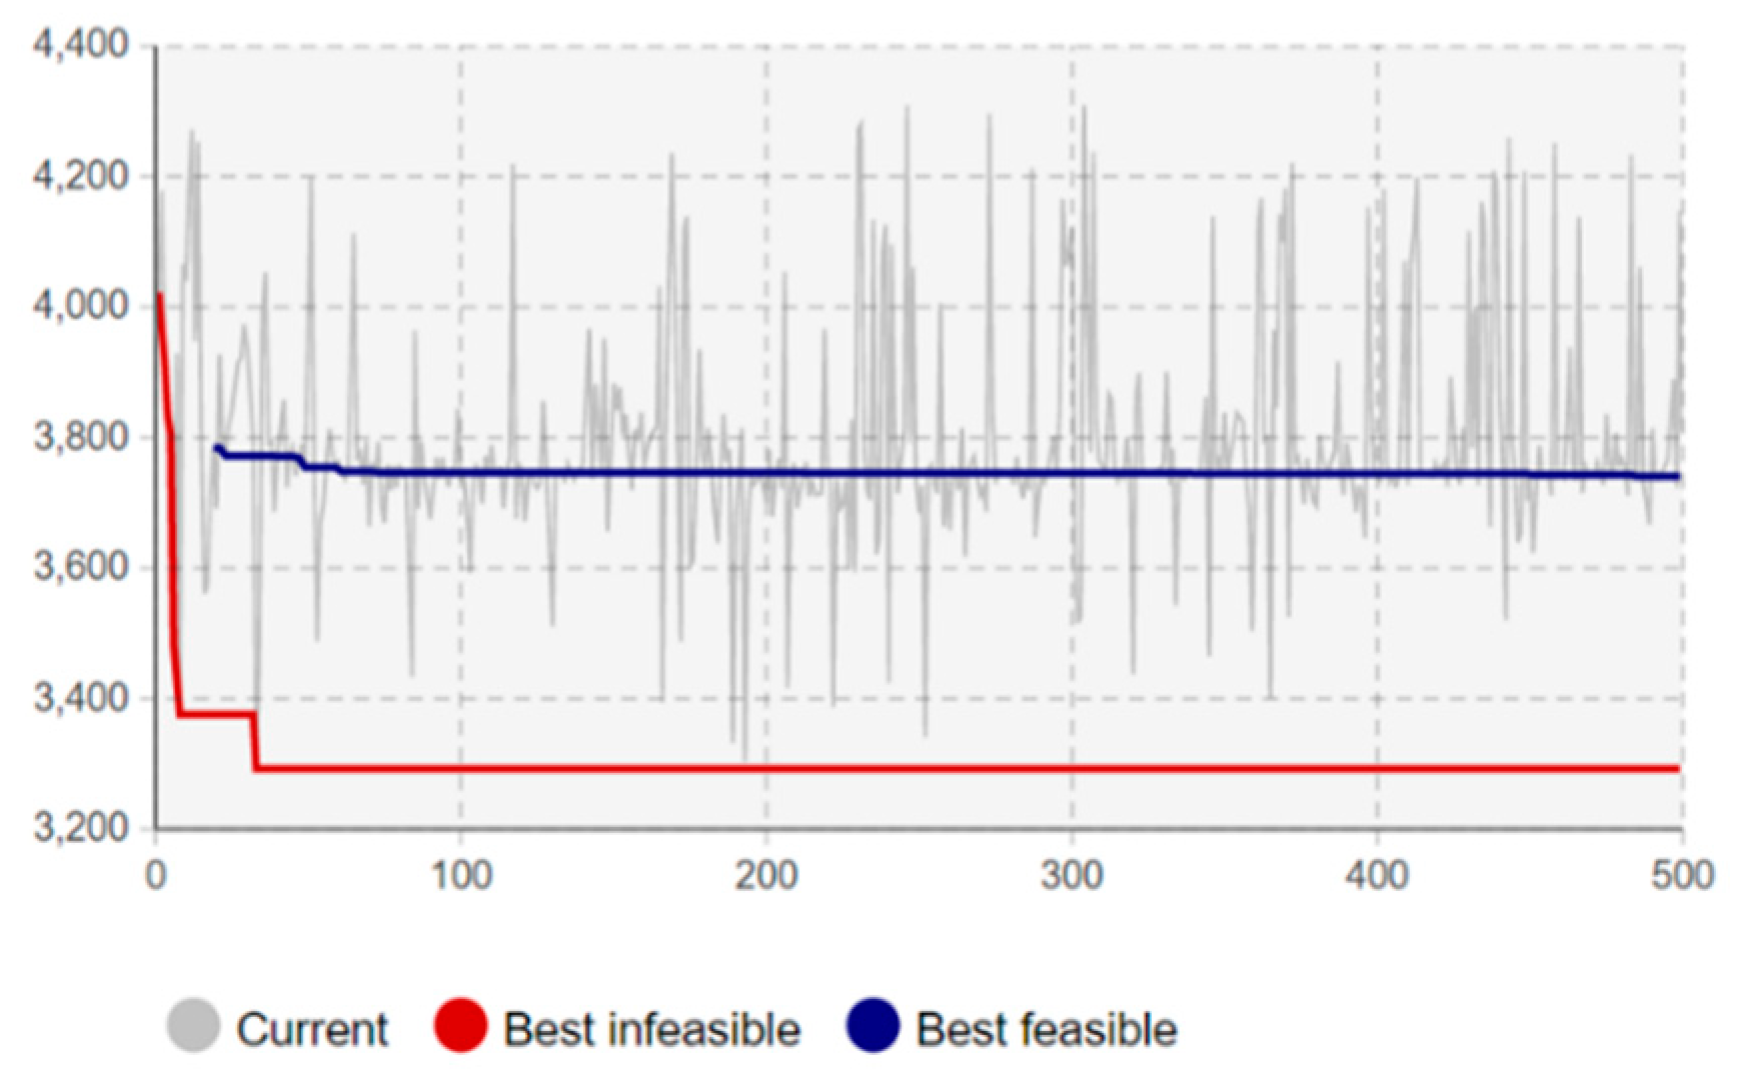
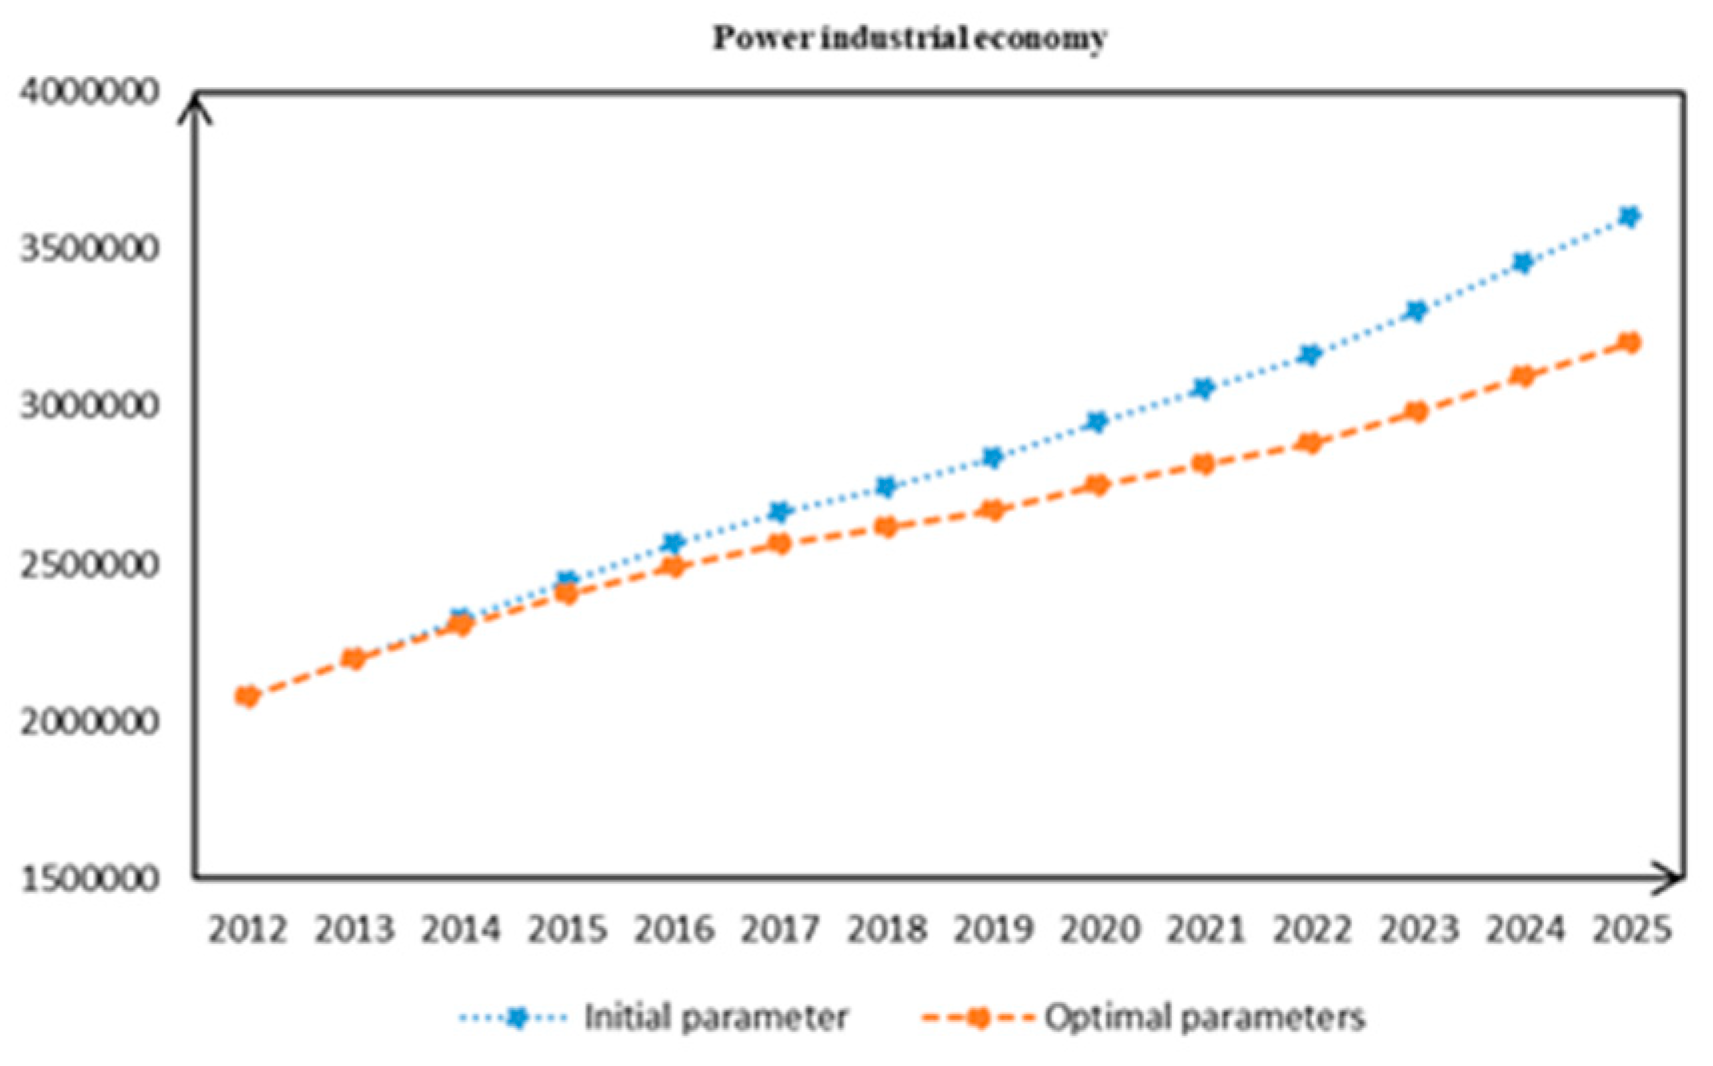
We already know that pollution rights trading and carbon emissions trading reduce emissions of CO2 and pollutants in the Chongqing region, but at the same time will have a negative impact to the industrial power economy. Although China is carrying out carbon trading and emission trading pilots, there is no good policy to tell us how to set the carbon trading price and pollutant trading price, or how to set the quota proportion. Thus, this is still a question worth investigating. To better use the carbon trading policy and emissions trading policy and reasonably level the economy, we conducted a simulation optimization experiment, with the lowest economic cost to achieve the lowest pollutant discharge amount. Therefore, we set the economic level of the Chongqing power industry at 32 billion yuan to 33 billion yuan in 2025. By changing the CO2 trading price, the proportion of free carbon quota, the pollutant trading price, and the proportion of free pollutant emission quota (E1–E3), we adjusted and optimized the results, and, finally, attained the optimal policy setting results. All of this can be done by creating an optimization experiment in Anylogic.
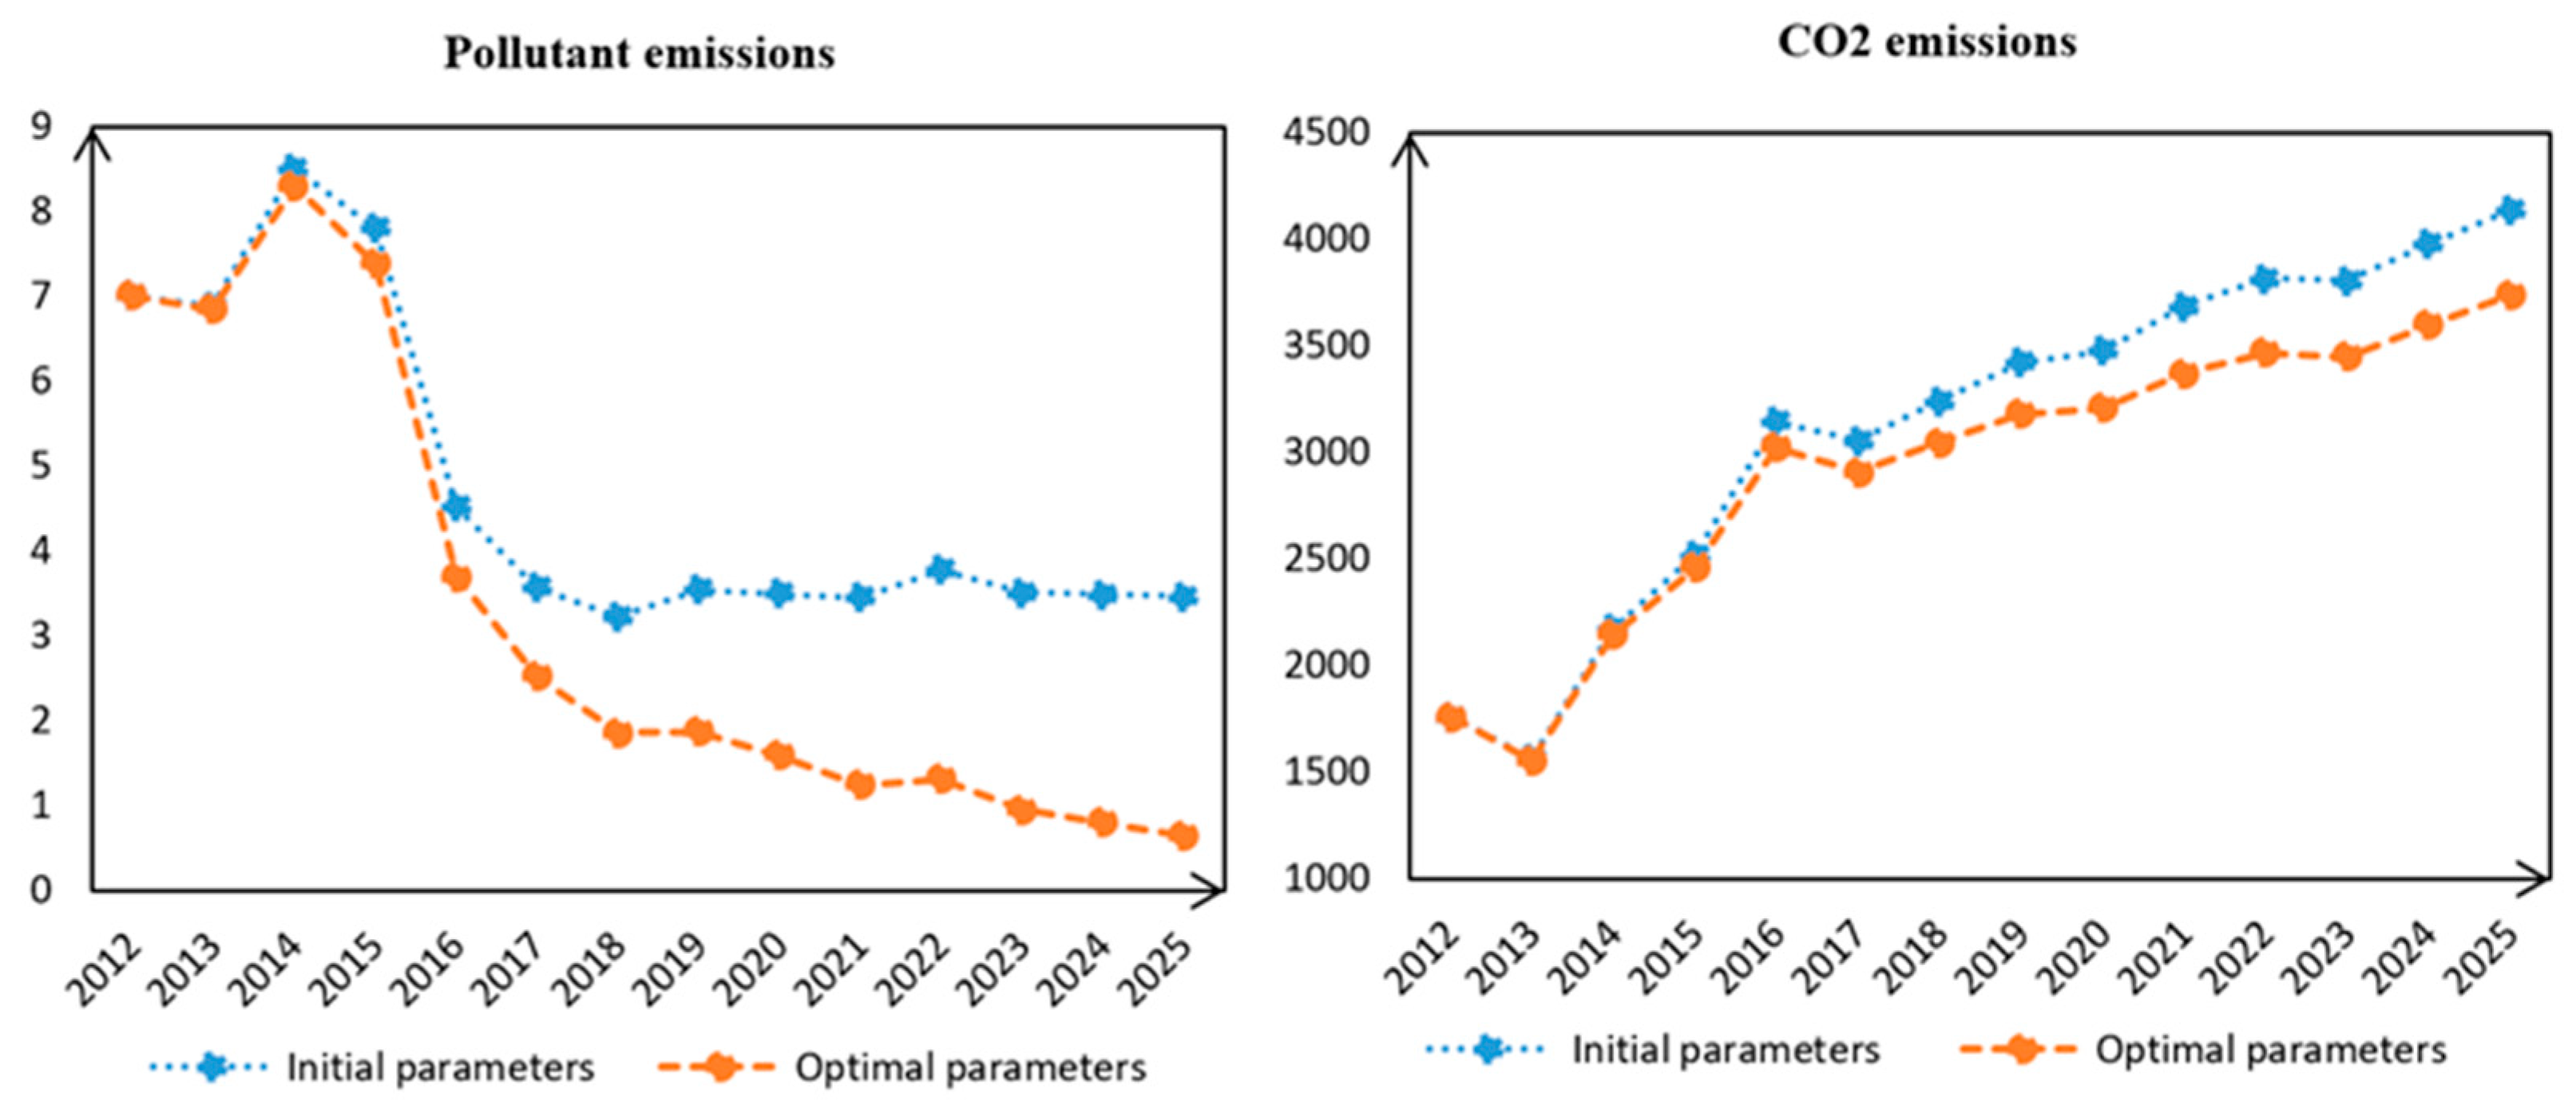
In the experiment, we set the minimum sum of CO2 emissions and pollutant emissions as the objective function; the constraint condition is that the enterprise profit is more than 30 billion yuan, and the carbon trading price and pollutant trading price are independent variables for simulation. Through the chart (Figure 10), we clearly found that when the carbon market price is set at 73 yuan/ton, the proportion of free carbon quota is set at 0.7; the pollutant market price is set at 2470 yuan/tons; and the free pollutant quota ratio is set at 0.15 (Table 6), the emissions of carbon dioxide and pollutants are minimal, at least right now. If we simulate according to this data, we can attain a specific optimized situation, as shown in Figure 11 and Figure 12.
We can find that although the economic aggregate has been reduced by 11.18% in 2025, the CO2 emissions had also been reduced by 9.6%, and even the pollutant emissions were reduced by 80%, which fully proves the superiority of the optimized result.
In the experiment, we can find that the parameters before and after the simulation have changed significantly. In the price module, both carbon trading price and pollutant trading price increased significantly in 2025, which is consistent with the expectations of residents in the market survey. In the free quota ratio module, the free carbon quota ratio increased, while the free pollutant quota ratio decreased. We believe that, here, the role of carbon trading is the most significant, enterprises have been transformed, the proportion of coal and electricity has declined significantly, and the total emissions of CO2 have declined significantly. Therefore, the proportion of free carbon quota has increased at this time, which could reduce the pressure of enterprises and can be regarded as a disguised subsidy for enterprises. For the pollutant sector, because SO2 and other polluted gases are harmful, the government still strictly controls the discharge of pollutants, so the free quota ratio is low, and the discharge of pollutants is restricted by policy. On the whole, the price of carbon trading and the price of pollution rights trading will rise substantially in the future, the proportion of free quota of pollutants will continue to go down, the proportion of free carbon quota will change less, and the country will increase the proportion of the free quota to subsidize enterprises in a certain range.
Therefore, for the carbon trading and the pollution rights trading market in Chongqing in the future, the government should guide the market towards prices according to the simulation results of the development or establish price setting systems to improve the trading mechanism, to establish an enterprise without a high loss of economy, better reduce emissions, and take care of the regional environment.
4. Conclusions and Future Research Needs
This paper considers the relationship between the economy of Chongqing electric power industry and the regional environment under the combined effect of carbon emissions trading (NCET) and pollution rights trading (PRT). By analyzing the internal relations among the profits of enterprises involved in carbon emissions trading and pollution rights trading, and using the sensitivity analysis experiment, policy optimization simulation was carried out to provide theoretical support for the future development of power enterprises in Chongqing and even the whole region. The specific simulation results are as follows.
- Under the influence of carbon emissions trading (NCET) and pollution rights trading (PRT), the pollutant discharge and carbon dioxide emissions of the power industry in Chongqing have been significantly reduced, and the environment has been improved noticeably, but at the same time, it will have a certain impact on the economy and reduce the profits of enterprises.
- Under the effect of the carbon trading mechanism, reducing the amount of free quota or increasing the price of carbon trading will reduce the emission of pollutants; pollution rights trading (PRT) has a similar effect on carbon dioxide emissions, but not as strong.
- At a certain range of economic levels and corporate profits, the simulation optimization can make the corporate profit loss smaller under certain conditions and at the same time obtain a larger income from emission reduction.
Based on the above conclusions, we may put forward some useful policy suggestions for the country. We believe that, in the future, the state should continue to increase the intensity of carbon trading, and gradually increase the price of carbon trading, so that carbon emission rights as a commodity can exist for a long time. In terms of pollutant emissions, we believe that in China, the pollution subject base is still large, so we still need to reduce the proportion of the free pollutant quota, so as to make China’s environmental quality improve.
In this study, the current situation of the power industry was firstly analyzed logically. Secondly, based on system dynamics theory, Anylogic software was used for model construction and model verification. Finally, different parameters were configured to conduct sensitivity analysis experiments, and corresponding conclusions were drawn through the analysis of charts and data, providing theoretical support for the improvement of the government’s emission reduction policy.
However, this model also has some shortcomings. It only considers the influence of two trading mechanisms and fails to fully show the influence of power generation right transactions on Chongqing regional power enterprises. In addition, this paper only considers the situation of coal-fired power, without considering the impact of the trading mechanism under the circumstances of green power of enterprises and subsidies of the state to green power. Moreover, it does not carry out an in-depth analysis of the technology investment of enterprises themselves. We also did not analyze the carbon and polluting gases produced by the transport links of the supply chain for the coal needed for power generation. Therefore, based on the research in this paper, in the future, on the basis of carbon trading and pollution rights trading, we will consider the supply chain transportation link and enterprise investment as they relate to the model, so that the research can more fully reflect the reality, and provide strong theoretical support for corporate decision-making and national policy.
Author Contributions
Conceptualization, X.Y. and D.Z.; methodology, X.Y. and S.G.; software, S.G.; validation, S.G. and X.Y.; formal analysis, S.G.; investigation, S.G. and X.Y.; resources, S.G.; data curation, S.G. and X.S.; writing—original draft preparation, S.G. and X.Y.; writing—review and editing, S.G. and X.Y.; visualization, S.G.; supervision, X.Y.; project administration, D.Z. and X.Y.; funding acquisition, D.Z. and X.Y.
Funding
This work is supported by the National Nature Science Foundation of China (71774080, 71501098, 71603135 and 71834003), China Postdoctoral Science Foundation Funded Project (2016M590453, 2018T110501), Science Foundation of Ministry of Education of China (17YJC630205) and the Fundamental Research Funds for the Central Universities (3082018NR2018011).
Conflicts of Interest
The authors declare no conflict of interest.
References
- National Development and Reform Commission (NDRC). Notice on the Implementation of Pilot Carbon Emission Trading. Available online: http://zfxxgk.ndrc.gov.cn/web/iteminfo.jsp?id=1349 (accessed on 29 October 2011).
- National Development and Reform Commission (NDRC). The 13th Five-Year Plan for Electric Power Development. Available online: http://zfxxgk.ndrc.gov.cn/web/iteminfo.jsp?id=398 (accessed on 22 December 2016).
- National Development and Reform Commission (NDRC). Notice on the Implementation of Key Tasks in the National Carbon Emission Trading Market. Available online: http://zfxxgk.ndrc.gov.cn/web/iteminfo.jsp?id=2944 (accessed on 18 December 2017).
- Jiaxing City Government. Notice on the Issuance of Measures for Trading the Emission Rights of Major Pollutants in Jiaxing (for Trial Implementation). Available online: http://www.jiaxing.gov.cn/art/2007/9/27/art_1590761_27355431.html (accessed on 27 September 2007).
- Galinis, A.; Leeuwen, M. A cge model for lithuania: The future of nuclear energy. J. Policy Model. 2000, 22, 691–718. [Google Scholar] [CrossRef]
- Stern, N. The Economics of Climate Change, 1st ed.; TSO (The Stationery Office): Britain, UK, 2006; Volume 98, pp. 1–37. [Google Scholar]
- Linares, P.; Javier, S.F.; Ventosa, M. Incorporating oligopoly, CO2 emissions trading and green certificates into a power generation expansion model. Automatica 2008, 44, 1608–1620. [Google Scholar] [CrossRef]
- Keohane, N.O. Cap and Trade, Rehabilitated: Using Tradable Permits to Control U.S. Greenhouse Gases. Rev. Environ. Econ. Policy 2008, 3, 42–62. [Google Scholar] [CrossRef]
- Zhanga, Y. Research on international carbon emissions trading and optimal exports scale of china carbon emissions. Procedia Environ. Sci. 2011, 10, 101–107. [Google Scholar] [CrossRef]
- Cui, L.B.; Fan, Y.; Zhu, L.; Bi, Q.H. How will the emissions trading scheme save cost for achieving china’s 2020 carbon intensity reduction target? Appl. Energy 2014, 136, 1043–1052. [Google Scholar] [CrossRef]
- Li, W.; Jia, Z.J. The impact of emission trading scheme and the ratio of free quota: A dynamic recursive cge model in china. Appl. Energy 2016, 174, 1–14. [Google Scholar] [CrossRef]
- Tang, L.; Wu, J.Q.; Yu, L.A.; Bao, Q. Carbon allowance auction design of china\s emissions trading scheme: A multi-agent-based approach. Energy Policy 2017, 102, 30–40. [Google Scholar] [CrossRef]
- Zhang, Y.J.; Hao, J.F. Carbon emission quota allocation among china’s industrial sectors based on the equity and efficiency principles. Ann. Oper. Res. 2017, 255, 117–140. [Google Scholar] [CrossRef]
- Zhao, X.G.; Wu, L.; Li, A. Research on the efficiency of carbon trading market in china. Renew. Sustain. Energy Rev. 2017, 79, 1–8. [Google Scholar] [CrossRef]
- Li, L.; Liu, D.; Hou, J.; Xu, D.D.; Chao, W.B. The Study of the Impact of Carbon Finance Effect on Carbon Emissions in Beijing-Tianjin-Hebei Region—Based on Logarithmic Mean Divisia Index Decomposition Analysis. Sustainability 2019, 11, 1465. [Google Scholar] [CrossRef]
- Zhou, J.G.; Li, Y.S.; Huo, X.J.; Xu, X.L. How to Allocate Carbon Emission Permits Among China’s Industrial Sectors Under the Constraint of Carbon Intensity? Sustainability 2019, 11, 914. [Google Scholar] [CrossRef]
- Martin, R.; Muûls, M.; Wagner, U.J. The impact of the european union emissions trading scheme on regulated firms: What is the evidence after ten years? Rev. Environ. Econ. Policy 2016, 10, 129–148. [Google Scholar] [CrossRef]
- Nugent, R.A. Teaching tools: A pollution rights trading game. Econ. Inq. 1997, 35, 679–685. [Google Scholar] [CrossRef]
- Chen, B.W.; Xiao, Z.H. Study on the property right of emission trading in china. Adv. Mater. Res. 2011, 233, 2087–2090. [Google Scholar] [CrossRef]
- Lu, Z. Emissions trading in china: Lessons from taiyuan so\r, 2\r, emissions trading program. Sustain. Account. Manag. Policy J. 2011, 2, 27–44. [Google Scholar] [CrossRef]
- Liao, X.L.; Li, X.L.; Zhang, B.X. System Dynamics Modeling and Simulation of China’s SO2 Emission Trading Policy. In Proceedings of the International Conference on Computer Distributed Control & Intelligent Environmental Monitoring, Changsha, China, 19–20 February 2011. [Google Scholar]
- Li, X.Q.; Liu, M.L. A research on emission trading policy in electric power market based on network equilibrium theory. Adv. Mater. Res. 2013, 6, 869–870. [Google Scholar] [CrossRef]
- Tu, Z.G.; Shen, R.J. Can china’s industrial SO2 emissions trading pilot scheme reduce pollution abatement costs? Sustainability 2014, 6, 7621–7645. [Google Scholar] [CrossRef]
- Ma, X.L.; Wang, H.Q.; Wei, W.X. The role of emissions trading mechanisms and technological progress in achieving china’s regional clean air target: A cge analysis. Appl. Econ. 2019, 51, 155–169. [Google Scholar] [CrossRef]
- Zhao, Q.R.; Chen, Q.H.; Xiao, Y.T.; Tian, G.Q.; Chu, X.L.; Liu, Q.M. Saving forests through development? Fuelwood consumption and the energy-ladder hypothesis in rural Southern China. Transform. Bus. Econ. 2017, 16, 199–219. [Google Scholar]
- Tomas, B.; Dalia, S. Sustainability in the Electricity Sector through Advanced Technologies: Energy Mix Transition and Smart Grid Technology in China. Energies 2019, 12, 1142. [Google Scholar] [Green Version]
- Chen, J.D.; Cheng, S.L.; Nikic, V.; Song, M.L. Quo Vadis? Major Players in Global Coal Consumption and Emissions Reduction. Transform. Bus. Econ. 2018, 17, 112–132. [Google Scholar]
- Wu, G.; Baležentis, T.; Sun, C.W.; Xu, S.H. Source control or end-of-pipe control: Mitigating air pollution at the regional level from the perspective of the Total Factor Productivity change decomposition. Energy Policy 2019, 129, 1227–1239. [Google Scholar] [CrossRef]
- Chappin, E.J.L.; Dijkema, G.P.J. On the impact of CO2 emission-trading on power generation emissions. Technol. Forecast. Soc. Change 2009, 76, 358–370. [Google Scholar] [CrossRef]
- Chu, J.C.; Zeng, M.; Yang, L.L. Carbon Emissions Trading and Sustainable Development of Power Industry. In Proceedings of the International Conference on Electrical & Control Engineering, Hubei, China, 25–27 June 2010. [Google Scholar]
- Zhang, F.W.; Guo, Y.; Chen, X.P. Research on China’s Power Sector Carbon Emissions Trading Mechanism. Energy Procedia 2011, 12, 127–132. [Google Scholar] [CrossRef]
- Huang, Y.; Liu, L.; Ma, X.M.; Pan, X. Abatement technology investment and emissions trading system: A case of coal-fired power industry of shenzhen, china. Clean Technol. Environ. 2015, 17, 811–817. [Google Scholar] [CrossRef]
- Oestreich, A.M.; Tsiakas, I. Carbon emissions and stock returns: Evidence from the EU Emissions Trading Scheme. J. Bank. Financ. 2015, 58, 294–308. [Google Scholar] [CrossRef]
- Kahrl, F.; Williams, J.; Ding, J.H.; Hu, J.F. Challenges to China’s transition to a low carbon electricity system. Energy Policy 2011, 39, 4032–4041. [Google Scholar] [CrossRef]
- China Environment Statistical Yearbook (CESY). Available online: http://www.mee.gov.cn/gzfw_13107/hjtj/hjtjnb/201702/P020170223595802837498.pdf (accessed on 23 February 2017).
- Zhang, J.R.; Wang, Z.D.; Tang, L.; Yu, L.A. Research on the impact of carbon emission trading policies in beijing-tianjin-hebei region based on system dynamics. Chin. J. Manag. Sci. 2016, 24, 1–8. [Google Scholar]
Figure 1.
Logic block diagram.
Figure 2.
Causal circuit diagram.
Figure 3.
Coal power enterprise stock flow chart.

Figure 4.
The impact of trading mechanisms.

Figure 5.
The impact of carbon trading prices on pollutants.
Figure 6.
The impact of carbon trading prices on Corporate profits.
Figure 7.
The impact of the free carbon quota ratio on pollutant emissions.
Figure 8.
The impact of pollutant trading prices on CO2 emissions.
Figure 9.
The impact of pollutant trading prices on Corporate profits.

Figure 10.
The optimal experiment.
Figure 11.
Comparison of economic effects.
Figure 12.
Comparison of environmental effects.

Table 1.
Variables used in our model.
| Variable | Computational formula | Unit |
|---|---|---|
| Corporate profits | (0.152 × G fixed investment – Enterprise carbon emission cost + Generating income – Coal cost – Pollutant emission cost – Pollutant removal × P pollutant trading × 1.1)/100 | Million yuan |
| Growth in the economy | (Corporate profits × 0.15 + Environmental governance investment – 0.158 × G fixed investment)/100 | Million yuan |
| G fixed investment | Industrial power economy × G investment coefficient/100 | Million yuan |
| Income variation coefficient | Economic increment / Industrial power economy | —— |
| Technology investment impact | Industrial power economy × 0.062/100 | Million yuan |
| Growth in the electricity | Total electricity × (EC growth rate + Population growth rate + 2.5 × Income variation coefficient) × (1 – Total electricity / 15,000,000)/100 | M kw·h/year |
| Coal reduction | – (3406/Technology investment impact × Investment coefficient1) × Coal consumption unit electricity | T/kw·h |
| Carbon reduction | – (C emissions per unit coal × (3000/Technology investment impact × Investment coefficient2)) | Tons/ton |
| Power generation | Total electricity × (1 + Line lose ratio + Auxiliary power rate)/100 | M kw·h |
| Coal demand | Power generation × Coal consumption unit electricity/100 | Mt |
| CO2 emissions | C emissions per unit coal × Coal demand × A carbon coefficient / 100 | Mt |
| Free C quota | CO2 emissions × Free C quota ratio/100 | Mt |
| R total quota | –1 × Total quota × Rate of change/100 | Mt |
| Corporate carbon trading volumes | (Total quota – Free C quota) / 100 | Mt |
| Punish carbon emissions | (CO2 emissions – Free C quota – Corporate carbon trading volumes)/100 | Mt |
| Enterprise carbon emission cost | (Corporate carbon trading volumes × P carbon trading + Punish carbon emissions × P carbon penalty)/100 | Million yuan |
| P carbon penalty | 4 × P carbon trading | CNY/ton |
| P coal | Table function | CNY/ton |
| Coal cost | P coal × Coal demand/100 | Million yuan |
| Generating income | Power generation × P electricity/100 | Million yuan |
| Pollutant production | Coal demand × (SO2 coefficient + NOx coefficient)/100 | Mt |
| Free P volumes | Pollutant emissions × Free P quota ratio | Mt |
| Punish pollutions | Pollutant emissions – Free P volumes | Mt |
| Pollutant trading volumes | Pollutant emissions × Pollutant trading ratio | Mt |
| Pollutant emission cost | (Pollutant trading volumes × P pollutant trading + Punish pollutions × P pollutant penalty)/100 | Million yuan |
| P pollutant penalty | 4 × P pollutant trading | CNY/ton |
| Environmental governance investment | (0.0258 × CO2 emissions + Pollutant emissions × 16)/100 | Million yuan |
| Pollutant removal | (Investment coefficient3 × Environmental governance effect)/100 | Mt |
| Pollutant emissions | Pollutant production – Pollutant removal | Mt |
Table 2.
Main parameters of the model.
| Parameter | Value | Unit | Data Source |
|---|---|---|---|
| P carbon trading | 40 | CNY/ton | Low-carbon industrial network |
| P pollutant trading | 1600 | CNY/ton | Chongqing bureau of ecological environment |
| SO2 coefficient | 0.0085 | Tons/ton | Chongqing bureau of ecological environment |
| NOx coefficient | 0.0074 | Tons/ton | Chongqing bureau of ecological environment |
| Free P quota ratio | 0.4 | —— | National pollution emission reduction policy |
| G investment coefficient | 0.6499 | —— | References [36] |
| Population growth rate | 0.0089 | —— | National Bureau of statistics |
| Auxiliary power rate | 0.0552 | —— | State Grid Corporation of China |
| Line lose ratio | 0.0605 | —— | State Grid Corporation of China |
| Rate of change | 0.0413 | —— | Chongqing development and reform commission |
| Free C quota ratio | 0.5 | —— | National carbon emission reduction policy |
Table 3.
Abbreviation and full name.
| Abbreviation | The Full Name |
|---|---|
| G fixed investment | Government fixed investment |
| Free C quota ratio | Free carbon quota ratio |
| Free P quota ratio | Free pollutant quota ratio |
| R total quota | Rate of change of total quota |
| P carbon penalty | Carbon penalty price |
| P coal | Coal price |
| Free P volumes | Free Pollutant volumes |
| P pollutant penalty | Pollutant penalty price |
| P carbon trading | Carbon trading price |
| P pollutant trading | Pollutant trading price |
| EC growth rate | Rate of growth in electricity consumption |
| C emissions per unit coal | Carbon emissions per unit coal |
| A carbon coefficient | Actual carbon emissions coefficient |
Table 4.
Simulated values and real values.
| Year | Coal Demand | Power Generation | Pollutant Emissions | ||||||
|---|---|---|---|---|---|---|---|---|---|
| The Fitting Value | The Real Value | Error Ratio | The Fitting Value | The Real Value | Error Ratio | The Fitting Value | The Real Value | Error Ratio | |
| 2012 | 761.579 | 767.98 | −0.833% | 548.02 | 550.55 | −0.460% | 7.009 | 7.0086 | 0.006% |
| 2013 | 676.224 | 673.11 | 0.867% | 605.580 | 593.67 | 2.006% | 6.843 | 6.89 | −0.682% |
| 2014 | 942.196 | 925.53 | 2.704% | 662.212 | 674.99 | −1.893% | 8.365 | 8.5 | −1.588% |
| 2015 | 1,092.44 | 1074.77 | 3.045% | 717.589 | 750.37 | −4.369% | 7.567 | 7.8 | −2.987% |
| 2016 | 1,361.48 | 1358.02 | 2.204% | 769.420 | 801.78 | −4.036% | 4.305 | 4.49 | −4.120% |
| 2017 | 1,321.82 | 1315.15 | 2.920% | 811.046 | 840.63 | −3.159% | 3.355 | 3.5 | −4.143% |
Table 5.
Simulation scenario setting.
| Simulation Scenario | Project | Carbon Trading Price (yuan/ton) | Carbon Free Quota Ratio | Pollutant Trading Price (yuan/ton) | Pollutant Free Quota Ratio |
|---|---|---|---|---|---|
| The basic situation | BASE | 0 | 0 | 0 | 0 |
| Different carbon trading price | A1 | 30 | 0.5 | 1600 | 0.6 |
| A2 | 50 | 0.5 | 1600 | 0.6 | |
| A3 | 70 | 0.5 | 1600 | 0.6 | |
| Different free carbon quotas | B1 | 40 | 0.4 | 1600 | 0.6 |
| B2 | 40 | 0.6 | 1600 | 0.6 | |
| B3 | 40 | 0.8 | 1600 | 0.6 | |
| Different pollutants trading price | C1 | 40 | 0.5 | 1500 | 0.6 |
| C2 | 40 | 0.5 | 2000 | 0.6 | |
| C3 | 40 | 0.5 | 2500 | 0.6 | |
| Different free pollutant quotas | D1 | 40 | 0.5 | 1600 | 0.3 |
| D2 | 40 | 0.5 | 1600 | 0.55 | |
| D3 | 40 | 0.5 | 1600 | 0.8 | |
| Two trading mechanism combination | E1 | 30 | 0.8 | 1500 | 0.3 |
| E2 | 50 | 0.6 | 2000 | 0.55 | |
| E3 | 70 | 0.4 | 2500 | 0.8 |
Table 6.
Initial parameters and optimal parameters.
| Different Scenarios | P Carbon Trading (CNY) | Free C Quota Ratio | P pollutant Trading (CNY) | Free P Quota Ratio |
|---|---|---|---|---|
| Initial parameters | 30 | 0.5 | 1600 | 0.6 |
| Optimal parameters | 73 | 0.7 | 2470 | 0.15 |
© 2019 by the authors. Licensee MDPI, Basel, Switzerland. This article is an open access article distributed under the terms and conditions of the Creative Commons Attribution (CC BY) license (http://creativecommons.org/licenses/by/4.0/).
Share and Cite
MDPI and ACS Style
Ge, S.; Yu, X.; Zhou, D.; Sang, X. The Integrated Effect of Carbon Emissions Trading and Pollution Rights Trading for Power Enterprises—A Case Study of Chongqing. Sustainability 2019, 11, 3099. https://doi.org/10.3390/su11113099
AMA Style
Ge S, Yu X, Zhou D, Sang X. The Integrated Effect of Carbon Emissions Trading and Pollution Rights Trading for Power Enterprises—A Case Study of Chongqing. Sustainability. 2019; 11(11):3099. https://doi.org/10.3390/su11113099
Chicago/Turabian StyleGe, Shengxian, Xianyu Yu, Dequn Zhou, and Xiuzhi Sang. 2019. "The Integrated Effect of Carbon Emissions Trading and Pollution Rights Trading for Power Enterprises—A Case Study of Chongqing" Sustainability 11, no. 11: 3099. https://doi.org/10.3390/su11113099
Note that from the first issue of 2016, this journal uses article numbers instead of page numbers. See further details here.