Article

Improved Drought Resilience Through Continuous Water Service Monitoring and Specialized Institutions—A Longitudinal Analysis of Water Service Delivery Across Motorized Boreholes in Northern Kenya

1
Department of Systems Science, Portland State University, Portland, OR 97207, USA
2
College of Nursing, University of Arkansas for Medical Sciences, Little Rock, AR 72204, USA
3
Sweet Sense, Inc., Nairobi 00603, Kenya
4
Mortenson Center in Global Engineering, University of Colorado Boulder, Boulder, CO 80309, USA
*
Author to whom correspondence should be addressed.
Sustainability 2019, 11(11), 3046; https://doi.org/10.3390/su11113046
Submission received: 16 April 2019 / Revised: 15 May 2019 / Accepted: 19 May 2019 / Published: 29 May 2019

Abstract

:
Increasing frequency and severity of drought is driving increased use of groundwater resources in arid regions of Northern Kenya, where approximately 2.5 million people depend on groundwater for personal use, livestock, and limited irrigation. As part of a broader effort to provide more sustainable water, sanitation, and hygiene services in the region, we have collected data related to site functionality and use for approximately 120 motorized boreholes across five counties. Using a multilevel model to account for geospatial and temporal clustering, we found that borehole sites, which counties had identified as strategic assets during drought, ran on average about 1.31 h less per day compared to non-strategic borehole sites. As this finding was contrary to our hypothesis that strategic boreholes would exhibit greater use on average compared to non-strategic boreholes, we consider possible explanations for this discrepancy. We also use a coupled human and natural systems framework to explore how policies and program activities in a complex system depend on consistent and reliable feedback mechanisms. Funding was provided by the United States Agency for International Development. The views expressed in this article do not necessarily reflect the views of the United States Agency for International Development or the United States Government.

1. Introduction

Approximately 3.6 billion people live in regions that are water-scarce at least one month per year, a condition expected to increase to between 4.8 and 5.7 billion people by 2050 [1]. In part, water insecurity is attributable to the effects of climate change that are already altering seasonal precipitation cycles around the globe. Whereas rainfall is increasing in higher latitudes, land areas south of the Sahara in Africa have seen records of dry months increasing by as much as 50%, despite predictions of increased precipitation for the sub-region of Eastern Africa based on climate models [2,3]. Meanwhile, warmer temperatures are drying soils, leading to a reduction in the amount of precipitation being absorbed in surface water sources, catchments, and aquifers [4]. The combination of greater precipitation variability, longer dry seasons, and reduced water storage represent a substantial natural hazard for the 18.8 million individuals residing in the arid and semi-arid regions of Kenya that increasingly depend on ground water resources for personal consumption, livestock, and limited irrigation during the dry season [5].
However, there is an important distinction between the natural hazard of drought as a hydrological imbalance [6] and the risk of drought disaster that is a function of a region’s vulnerability and capacity to cope [7]. Drought emergencies are characterized by a confluence of issues including lack of access to water, lack of access to pasture for feeding livestock, competition among communities for scarce resources, and insecurity because of conflict over resources [8]. The cost in human lives and humanitarian aid has been significant for each of the drought emergencies experienced in Eastern Africa. For example, the five droughts in Kenya between 1998 and 2011 resulted in approximately 1.6 billion USD in humanitarian aid, and each drought affected between two and four million people [7].
This study presents the initial findings from two initiatives aimed at decreasing vulnerability to drought emergencies in five Northern Kenyan counties. We first provide a brief description of both initiatives, followed by a presentation of the theoretical framework that informs this investigation. We then present the results of a multilevel analysis that explores the factors influencing water system use in these five counties. Finally, we conclude with a discussion of the implications of this investigation and the opportunities for further research.

1.1. Kenya RAPID Program

The Kenya Resilient Arid Lands Partnership for Integrated Development (Kenya RAPID) program is aimed at increasing “access to water and sanitation for people and water for livestock” while rebuilding “a healthy rangeland-management ecosystem” [9]. Kenya RAPID is funded by the United States Agency for International Development (USAID) and the Swiss Development Corporation (SDC). Launched in September of 2015, Kenya RAPID is working to increase access to improved water services from 37% to more than 50% within five years through three strategic objectives: (1) responsive and accountable governance frameworks for providing water and pasture; (2) replicable and scalable business models for water, sanitation, hygiene, and livestock service provision; and (3) increased access to water, sanitation, and hygiene services and improved rangeland management [9]. With over a dozen public and private partners, including the national and county ministries of water, four non-governmental organizations (NGOs), and six private companies, the Kenya RAPID program aims to strengthen institutions and facilitate coordination across sectors to improve service delivery and empower communities.
Kenya RAPID seeks to promote the consistent use of improved water and sanitation services through three activities. First, the program is supporting local financing and cost recovery through the creation of private and public partnership business models and improved asset management practices. Second, the program seeks to aid in the development of functioning management and maintenance systems through capacity-building of community-level structures and institutions. Finally, the program is promoting the protection and management of natural resources through integrated water resource management (IWRM); recharge, retention, and reuse (3R) initiatives; and the implementation of rangeland management plans [10]. Together, these activities are aimed at building the resilience of communities located in the arid and semi-arid regions of Kenya, so that they will be able to “mitigate, recover, and adapt to major crises, such as droughts, and minor crises like rainy seasons that cut off transportation to markets” [10] (p. 26).

1.2. National Drought Management Authority

The National Drought Management Authority (NDMA) was established as a public body by the National Drought Management Authority Act of 2016. As an agency of the Government of Kenya, NDMA is “mandated to establish mechanisms which ensure that drought does not result in emergencies and that the impacts of climate change are sufficiently mitigated” [8] (p. 1) As part of their mandate, NDMA is responsible for long-term planning and activities related to drought management, including disaster risk reduction, information and knowledge management, coordination of government agencies and relevant stakeholders, and rapid response to drought emergencies through the planning and implementation of contingency action plans [8]. The formation of the NDMA represents a significant shift in policy, “from one that relies on reacting to the effects of droughts as they arise, to one that actively seeks to reduce vulnerability and risk through sustainable development” [8] (p. 1). Intrinsic to this policy shift are the assumptions that drought disasters are avoidable—indeed, Kenya has committed to ending drought emergencies (EDE) by 2022—and that droughts are complex challenges that can only be mitigated and managed through the empowerment and increased resiliency of local institutions and communities [8].
NDMA’s activities are focused on the eight arid and 15 semi-arid counties of Kenya that are most vulnerable to drought. This vulnerability is due to multiple intersecting factors, including limited and variable precipitation; historical underinvestment in health and education services and public infrastructure; and increased land pressure due to population growth and competition for resources [8]. As a specialized institution tasked with coordinating across government ministries and public and private entities, NDMA activities are aimed at breaking mutually reinforcing cycles that span different policy environments. For example, investments in infrastructure and economic development aim to protect access to markets and basic services during drought events [11]. Similarly, investments in health and education services aim at reducing the vulnerability of households to ill-health episodes or catastrophic events [8,12,13].
NDMA’s agenda is in line with the broader transition to decentralized or devolved governance initiated in Kenya in 2010. With the establishment of county governments as a new tier of government and the creation of an Equalization Fund to address historical underinvestment in the arid and semi-arid regions of Kenya, there is a general acknowledgement that stronger local institutions, improved security, and investments in human capital will make counties more resilient to droughts [14]. However, unlike many of the county government structures that are vulnerable to election cycles and disrupted by changes in administrations and political agendas, the NDMA is established as a permanent authority that is allocated funding through a National Drought Emergency Fund that receives significant financial support from the European Union [15,16,17]. This ability to conduct planning on decadal timelines with funding that is not vulnerable to yearly budget allocations and shortfalls enables the NDMA to focus on resiliency measures, early warning systems, and longer-term investments in climate-proofed infrastructure and human capital [11]. Thus, while NDMA’s activities are informed by a broader mandate to address historical inequalities in the development of Kenya’s arid and semi-arid regions, the nature of NDMA’s activities is highly dependent on the priorities and drought risks present in each county [11]. For example, NDMA officers embedded in each county work with the local county water officers to select the strategic boreholes that will receive NDMA support for parts and servicing.

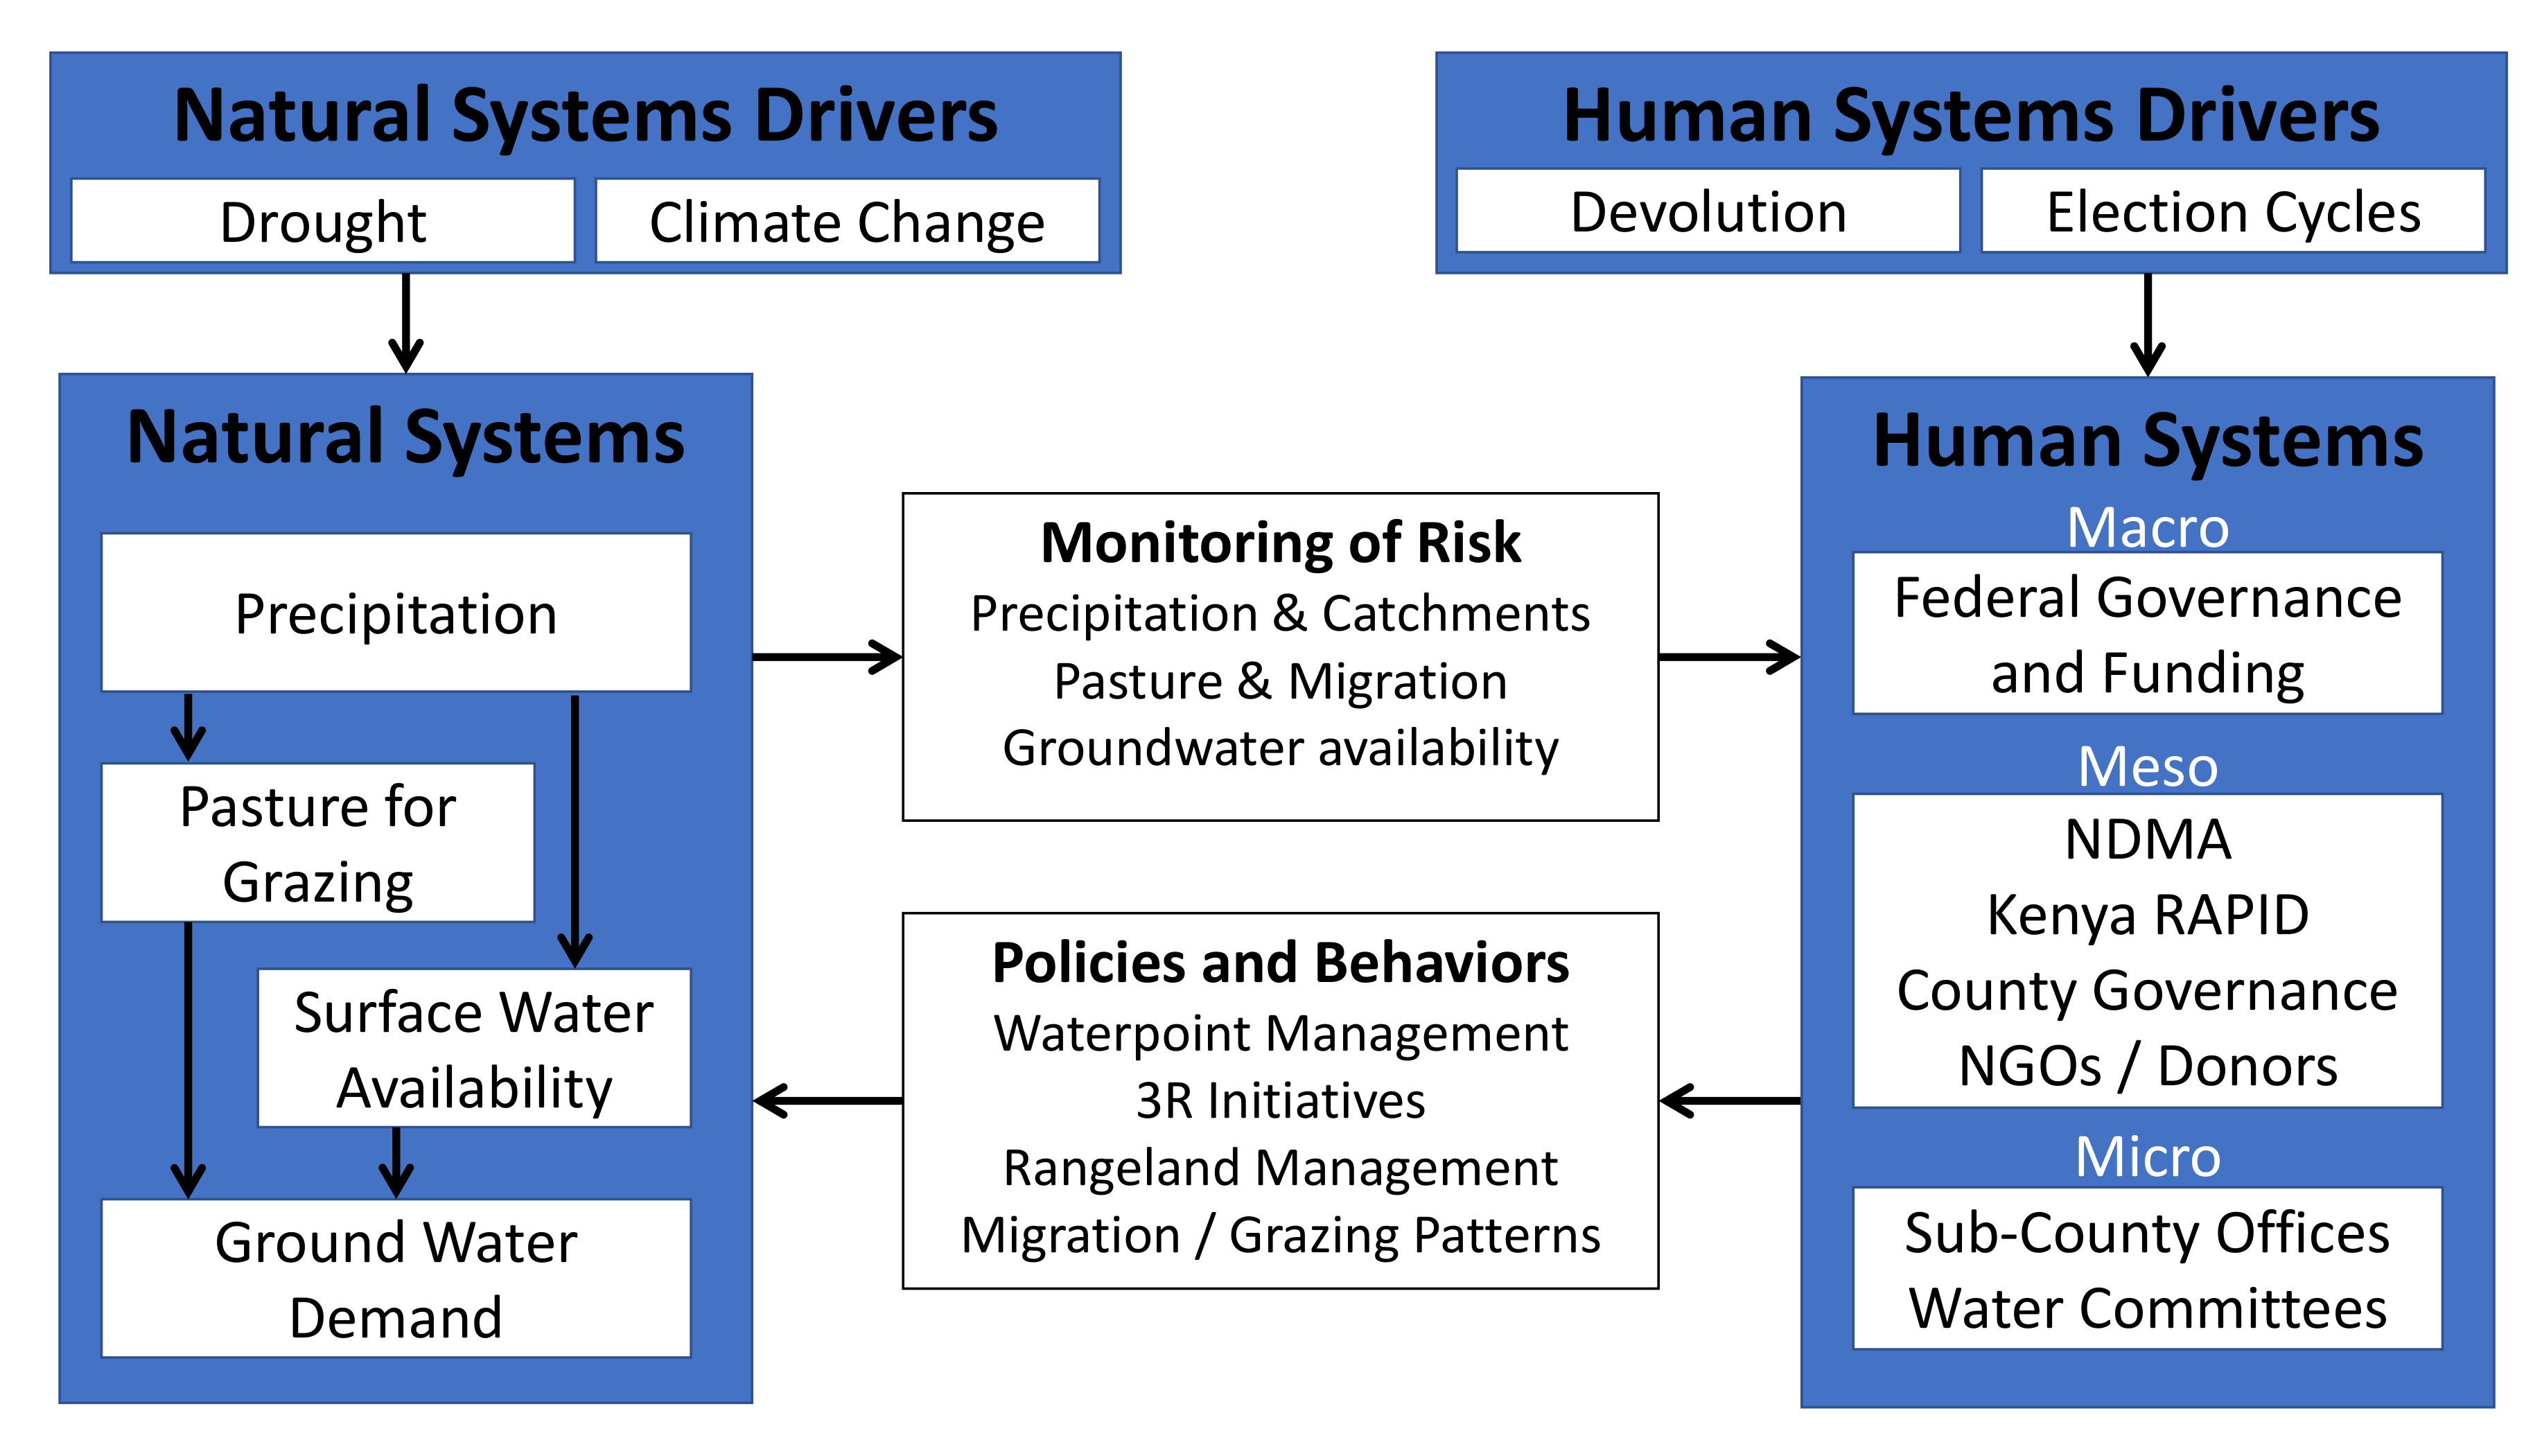
1.3. Coupled Human and Natural Systems

In this regard, the Kenya RAPID program and NDMA provide two compelling examples of meso-level initiatives that are uniquely suited—with funding, multi-agency mandate, and a degree of political autonomy—to support counties in their efforts to avoid drought emergencies while ensuring sustainable access to water resources [18]. As depicted in Figure 1, the work of both of these initiatives takes place in what is often referred to as a coupled human and natural system (CHANS), a theoretical framework that describes the dynamic interplay between human alterations of the environment and the impacts on ecological systems and human well-being [19,20].
Increased drought frequency and severity have significant effects on the amount of pasture available for grazing, the amount of available surface water, and the overall demand for groundwater resources. These changes in the natural environment are monitored through networks of individuals embedded in each of the counties, satellite imagery, and remote sensors that provide near real-time assessments of water system functionality and use. The risk of drought emergency is assessed and communicated with varying efficacy throughout the different layers of governance [21]. Information about need and assessments of risk are often sharpest at the local level where resources are typically scarce [22]. In contrast, information about need and assessments of risk are often wanting at the macro level where resources need to be mobilized. Thus, meso-level institutions and initiatives can play an important role in bridging these two contexts through the collection and communication of information from the local level and the coordination of response and resources from the macro level.
To the extent that meso-level institutions are buffered from the short-term influence of election cycles, these initiatives can support long-term capacity-building and policies that will reduce vulnerability to drought emergencies, such as sustainable waterpoint management; surface water retention, recharge, and reuse; sustainable rangeland management; and coordination of migration and grazing [23]. As outlined in a recent County Diagnostic Report for Kenya published by the University of Oxford, “Risks converge in social and natural systems with the intersection of climate hazards, financial flows, operational performance, and institutional accountability,” and “information flows strengthen institutional coordination and performance” [24] (p. 18). Thus, a key finding of this report is that the use of sensors for collecting transparent, accurate, and accessible monitoring data can play a crucial role in providing accountability, unlocking new financial flows, and supporting the development of water secure institutions at scale.
An important question in this investigation is to what extent the Kenya RAPID program and NDMA activities are fostering drought resilience by improving access to sustainable groundwater services. However, since Kenya RAPID activities and coordination with NDMA are still underway, this represents only the initial assessment of how these initiatives are supporting access to groundwater services through the monitoring and maintenance of strategic boreholes in each county. It is also important to note that processes were still being formalized for operationalizing monitoring data to inform maintenance activities in each county. As a result, this investigation is primarily focused on exploring the factors that influence strategic and non-strategic borehole use. Future investigations, including an impact evaluation taking place during the primary dry season of 2019, will more explicitly address how monitoring data from remote sensors can be used to improve groundwater service delivery in these counties.

2. Materials and Methods

2.1. Study Context

Approximately 2.5 million individuals reside in the five northern counties of Kenya, and more than half of these households obtain their water from unimproved sources [5]. Of the households that use improved sources, the vast majority use boreholes or protected wells fitted with handpumps, while about 15% of the population use public taps from piped water systems. Almost all the motorized pump sites from this study are located near settlements that are inhabited all year, but a small number of the sites are used only seasonally during drought or migration periods.
As described in [21], responsibility for the operation and maintenance of each water system is shared among a variety of organizations, with county water offices, sub-county water offices, water management committees, and utilities taking primary responsibility for the water systems under their purview. These entities are often supported with funding, parts, or labor by non-profits, faith-based entities such as the Catholic dioceses, and drought-contingent support agencies such as the NDMA.

2.2. Instrumentation and Data Management

As part of the Kenya RAPID program, program partners designed and installed remote monitoring sensors on approximately 120 motorized boreholes (SweetSense Inc, Denver, Colorado, United States). Motorized boreholes were selected by counties for sensor installations because they provide vital access to deep groundwater resources during the dry season and impact large human and livestock populations. Data related to water system functionality, the approximate number of pumping hours and volume extracted per day, and the last report date for the sensor were made available online through Sweet Sense’s online dashboard. In addition, IBM Research developed the Water Management as a Service Platform (WMaaSP) that will be used to inventory each county’s water points, including motorized boreholes, handpumps, and water catchments. The WMaaSP platform will display site functionality, use estimates, and maintenance records through an online web dashboard.
Between September 2016 and September 2018, sensors were installed on 120 motorized boreholes across the five northern counties of Kenya resulting in sites with varying numbers of daily observations based on installation date (see Table 1). Sites were selected in collaboration with county water officers, sub-county water officers, and NDMA officials. Beginning the summer of 2016, county water officers worked with NDMA officials to identify strategic boreholes that would be prioritized for sensor installation and monitoring. Counties selected sites based on the borehole yield (m 3 ), the estimated human and livestock populations served, the presence of alternative water sources, and patterns of human and livestock migration during drought periods. Each list of strategic boreholes was then reviewed for security concerns before being approved by the Ministry of Water and NDMA. As seen in Table 1, there was significant variability in the number of households and livestock served by each borehole, with non-strategic boreholes exhibiting greater variability than strategic boreholes. This could reflect the fact that more non-strategic boreholes were serving urban populations compared to rural areas with smaller or migratory human settlements.
The sensors used in this study represent an improved version of technology used in previous studies [25,26,27,28]. Sensors provided near real-time feedback on borehole functionality and use. An electric current clamp recorded whether the submersible pump was running with forty-minute sampling intervals. These current signals were then used to estimate the approximate amount of time each site was being used each day. Data was logged locally on each sensor and then transmitted via cellular and satellite networks to remote servers for analysis. Each day an R script estimated the approximate number of hours of use for each site. Where flow rate data were available for specific pump sites, the length of use was used to estimate the amount of water extracted at each site. Sensor up-time (percentage of days of reported sensor functionality) across the 120 sites averaged 96.9% (SD = 6.57%). Site up-time (percentage of days of at least some recorded use) averaged 59.5% across sites (SD = 27.5%). The use of artificial intelligence and expert-informed thresholds for determining site status (i.e., sensor malfunction, water system malfunction, seasonal disuse, or fully functional system) will be described in a forthcoming publication. At 24 of the sites, the electrical clamp was cut or removed causing the sensor to record that the pump was not being used. Representing approximately 5000 daily observations or about 5% of the total dataset, these data were removed prior to conducting the analysis.
A summary of pump site statuses, last report date, and the approximate volume extracted each week were made available through the Sweet Sense dashboard. Similar information was also available through the WMaaSP dashboard. Sensor installation and removal records as well as repair reports were logged using the mWater mobile and online applications [29]. In addition, asset inventory surveys were completed by Sweet Sense field officers and county water officers for each site to record information about water use, water quality, borehole characteristics, power source and characteristics, and water point management.
Finally, precipitation was estimated using monthly Climate Hazards Group InfraRed Precipitation with Station (CHIRPS) v2.0 according to the methodology described in Thomas et al. [28]. Gridded raster precipitation files with a resolution of 5 km were used to estimate rainfall in the proximity of each water system. However, these precipitation estimates were not used in this analysis as we found that seasonality (rainy vs. dry season) was a better predictor of use than daily precipitation values.

2.3. Statistical Analysis

To characterize the factors that influenced motorized borehole use, we examined sensor and water point data between September 2016 and January 2019. Water point data consisted of site characteristics that were recorded using a mobile survey at the time of sensor installation. Sensors were installed and replaced over the course of this study, resulting in an unbalanced number of daily observations for each pump site. Given that daily observations were nested within each pump site, we used a two-level multilevel linear regression model with random intercepts and an AR-1 correlation structure to account for autocorrelation and non-independence of the errors. Individual observations were nested within each site, and one time-varying predictor was incorporated: a rainy vs. dry season indicator, where the rainy season corresponded to the primary and secondary rainfall periods of March through May and September through November [30]. In addition, several site-level predictors were examined, including borehole status (strategic vs. non-strategic), number of households served, number of livestock served, power source (hybrid, solar, generator, or utility power), alternative sources of water (a surface water source or a different water tap), whether the water point was used for filling water trucks, and urban vs. rural location. These variables were specified using multilevel regression with the hours of use as the outcome variable (see Equation (1)), where β 00 represents average use across all clusters when controlling for all covariates, U 0 i represents the random effect that is allowed to vary for each pump site, and ε i t is the residual that varies for each observation within each pump site.
Hour s i t = β 00 + β 01 04 ( Count y i ) + β 05 ( Borehole _ Statu s i ) + β 06 ( Household s i ) + β 07 ( Livestoc k i ) + β 08 010 ( Power _ Sourc e i ) + β 011 ( Seasonal _ Pum p i ) + β 012 ( Alternative _ Water _ Sourc e i ) + β 013 ( Water _ Truckin g i ) + β 014 ( Locatio n i ) + U 0 i + β 10 ( Rainy _ Season n i t ) + ε i t
As there was almost half the amount of precipitation in Northern Kenya during 2017 compared to 2018, we also conducted a subgroup analysis to compare overall site use under two different drought conditions (see Equation (2)). In 2017, a state of emergency was declared due to reduced rainfall during the primary rainy season (March through May), catalyzing significant resources and support from organizations such as the NDMA, non-profits, county governments, and the federal government. Since only 25 sensors were installed at the beginning of the 2017 drought season—eight of those sensors were installed on strategic boreholes—we compared how use differed between 2017 and 2018 for this subset of sites. All statistical analyses were conducted using R, and the multilevel models were evaluated using the nlme package [31].
Hour s i t = β 00 + β 01 ( Borehole _ Statu s i ) + β 02 ( Household s i ) + β 03 ( Livestoc k i ) + β 04 07 ( Power _ Sourc e i ) + β 08 ( Seasonal _ P u m p i ) + β 09 ( Alternative _ Water _ Sourc e i ) + β 010 ( Water _ Truckin g i ) + β 011 ( Location n i ) + U 0 i + β 10 ( Drought _ Perio d i t ) + ε i t

3. Results

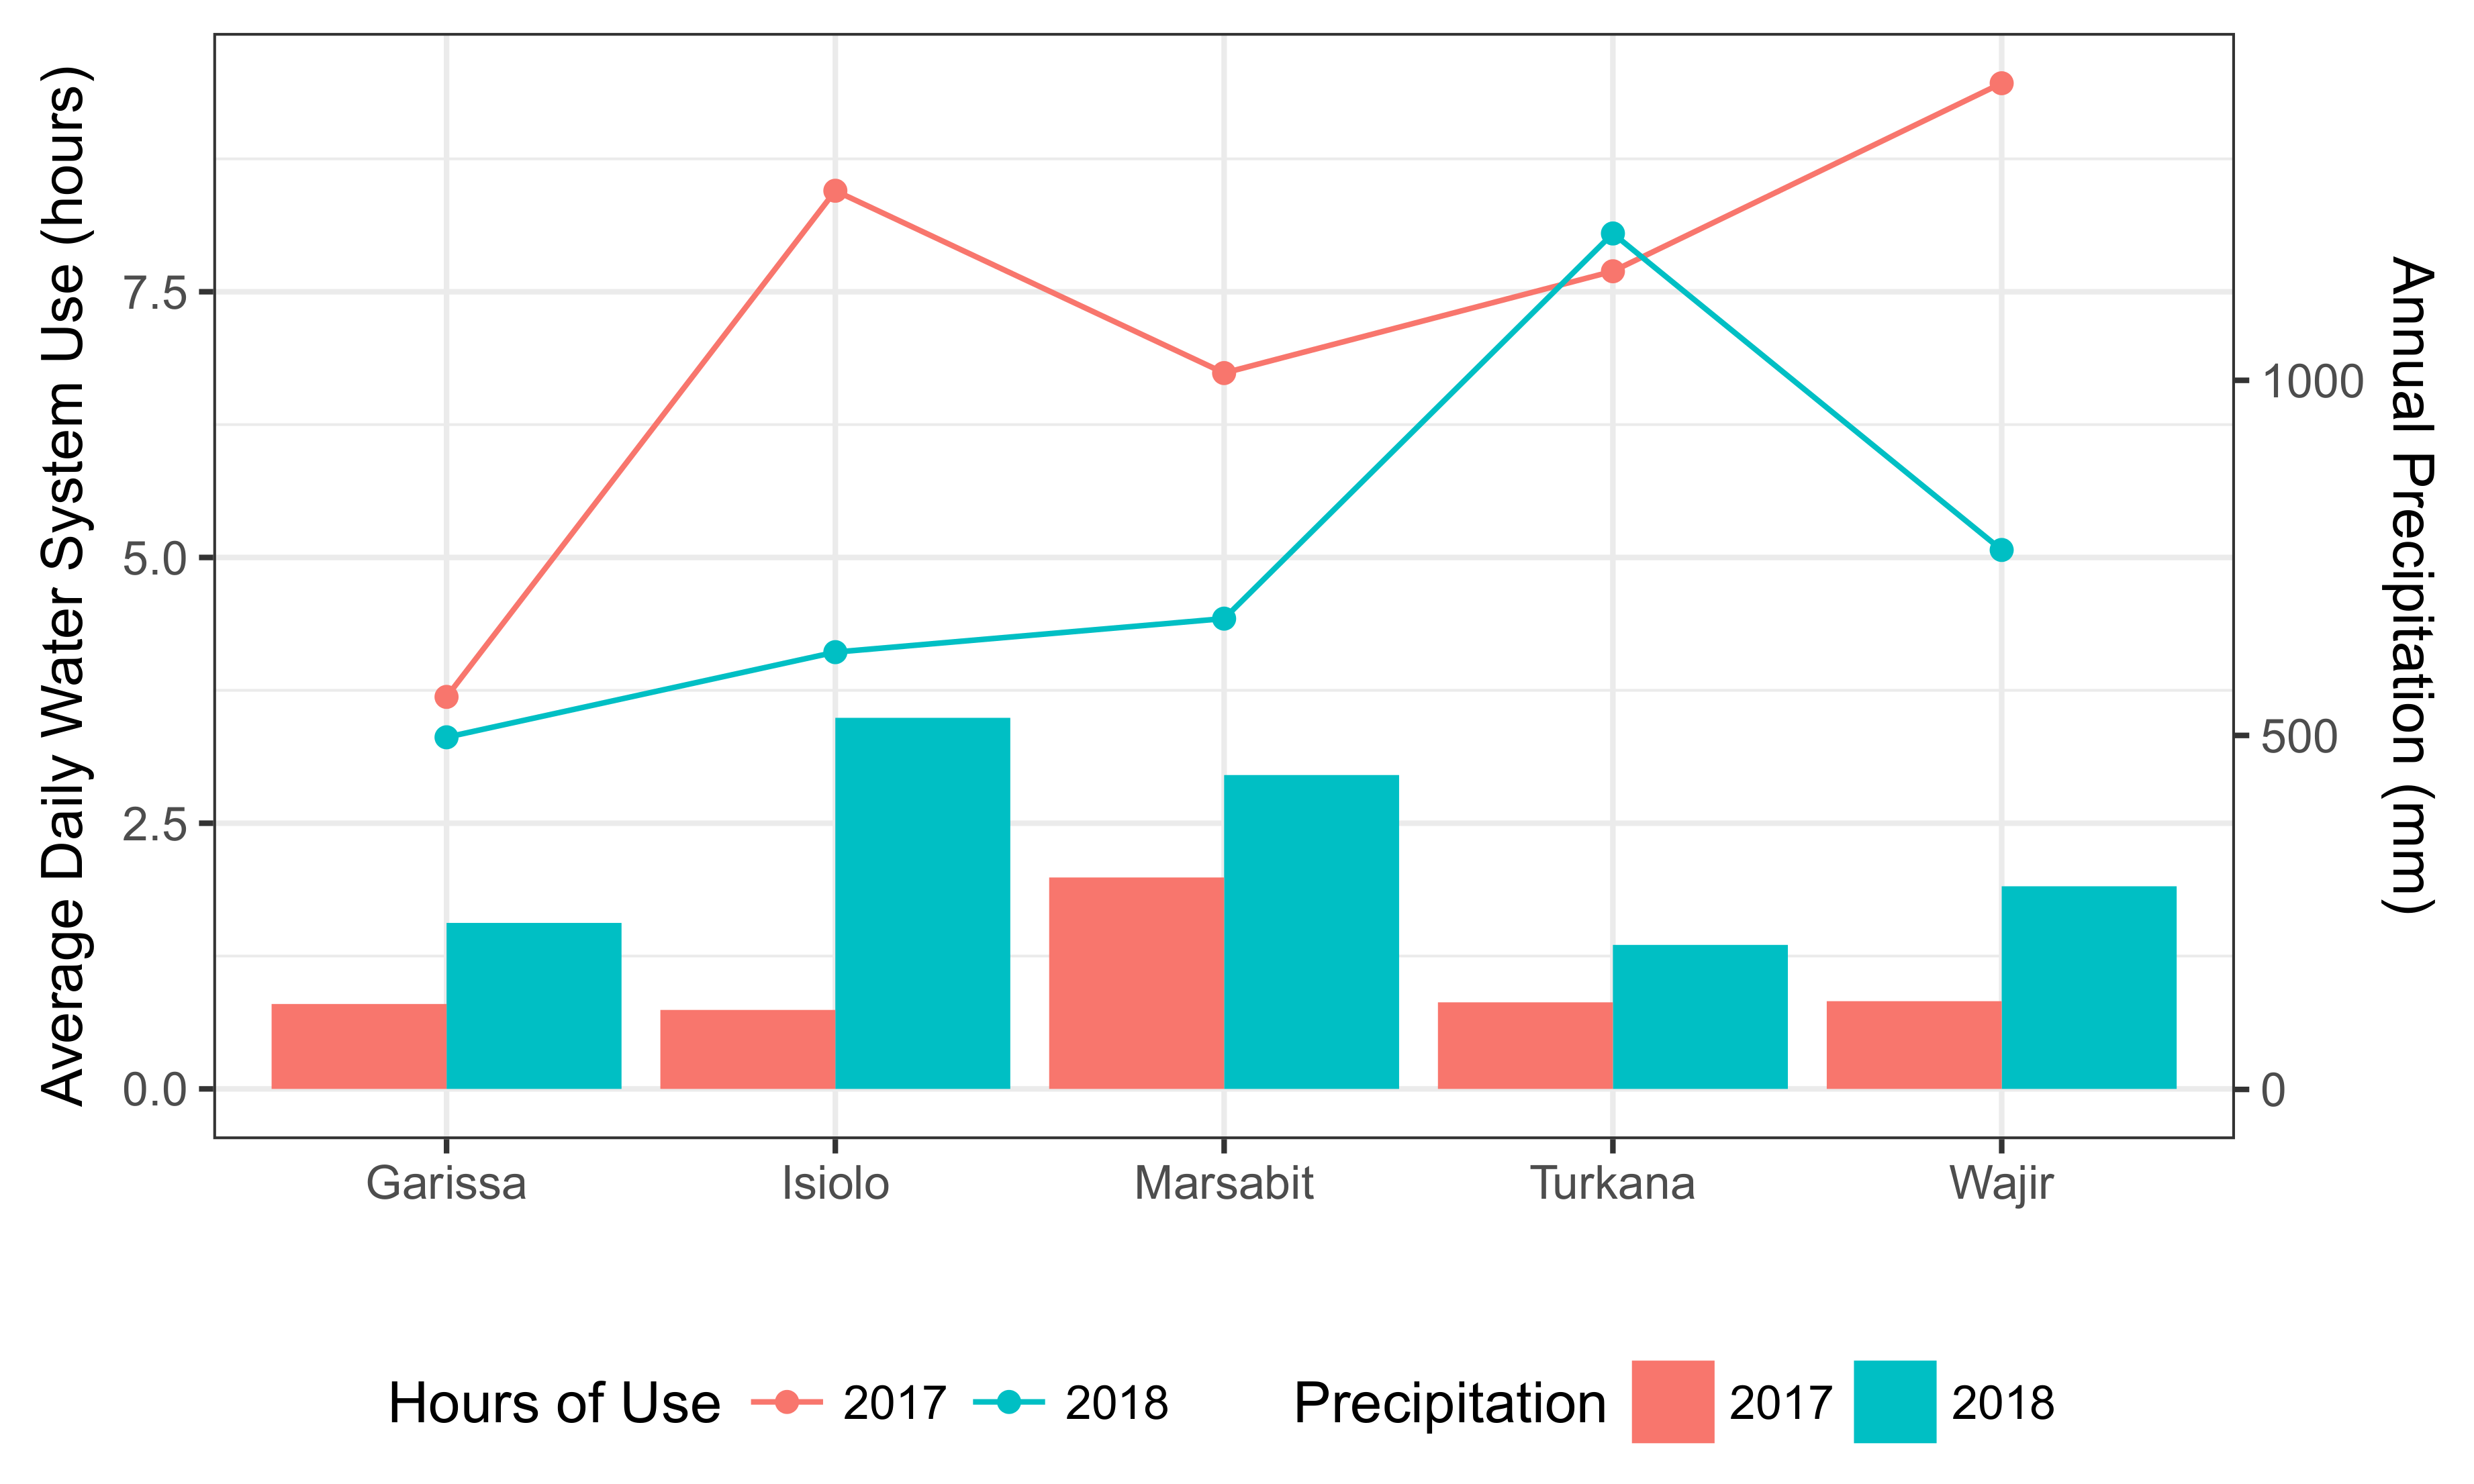
Average precipitation across the pump sites was 171 mm in 2017, compared to 326 mm in 2018. As seen in Figure 2, there was considerable variation within each county between the two years. Isiolo received the least precipitation in 2017 at 111mm, while Marsabit received the most precipitation at 298 mm. In 2018, Isiolo received the most precipitation at 523 mm, while Turkana received the least precipitation at 203 mm. Water systems were used on average 7.1 h in 2017 versus 5.4 h in 2018. Average use also varied considerably by county, with all counties except Turkana averaging greater use in 2017 than in 2018. Garissa had the lowest average use both years (3.6 and 3.3 h, respectively), while Wajir had the greatest use in 2017 (9.5 h) and Turkana had the greatest use in 2018 (8.0 h). Based on estimated flow rates from individual sites, a daily average of 142 m 3 of water was extracted from each site in 2017, compared to 98 m 3 in 2018, representing a 31% decrease in average water extraction.
In the null model with no covariates and intercepts allowed to vary across individual pump sites (i.e., Hour s i t = β 00 + U 0 i + ε i t ), there was considerable variation both within and between sites. The intraclass correlation coefficient, which provides a measure of the amount of variance attributable to differences between sites, was 45.3%. Variability across time within sites ( σ 2 = 5.12 ) was slightly greater than variability between sites ( τ 2 = 4.26 ), where σ 2 and τ 2 represent the standard deviations of site use within and between borehole sites.
As seen in Figure 3, water system use was strongly tied to precipitation, although the influence of precipitation on water system use varied considerably by county. In counties with greater variability in use such as Marsabit and Garissa, there was significant ramping behavior whereby groundwater demand would increase significantly during the dry season and then drop precipitously after rainfall events. In counties with more consistent water system use such as Turkana and Isiolo, there were more systems that were run for predictable intervals (e.g., 12- or 24-h intervals). As a result, water system use in these counties was more influenced by system functionality than precipitation events.
As seen in Table 2, there were a variety of site-level characteristics that were strong predictors of water system use. As a fixed effect, the county each site was in was a significant predictor of use, with all counties except Isiolo recording greater average daily use than the reference county of Garissa. The type of power system was also a significant predictor of use, with hybrid and utility systems being used 1.1 and 3.5 h more than sites with generators ( p = 0.0043 and p < 0.001 ). Surprisingly, water systems powered by solar were used almost an hour less per day compared to sites with generators; however, the difference was not statistically significant ( p = 0.0597 ).
The number of households and livestock being served by each water system was also statistically significant ( p = 0.005 and p = 0.0242 ), although the effect size per thousand was small (−0.195 and −0.0343). However, sites used for filling water trucks were used on average three hours more compared to sites not used for water trucking ( p < 0.001 ), and urban sites were used 3.25 h more than rural sites ( p < 0.001 ). Sites where the operator reported using the water system less during the rainy season averaged slightly more use on average compared to non-seasonal sites ( 0.713 , p = 0.0278 ). However, in general sites were used 0.383 h less during the rainy season compared to the dry season ( p = 0.0024 ). Similarly, sites that reported using a surface water source when the water system was non-functional were used almost an hour less per day on average compared to sites that reported using a different water tap ( p = 0.0128 ).
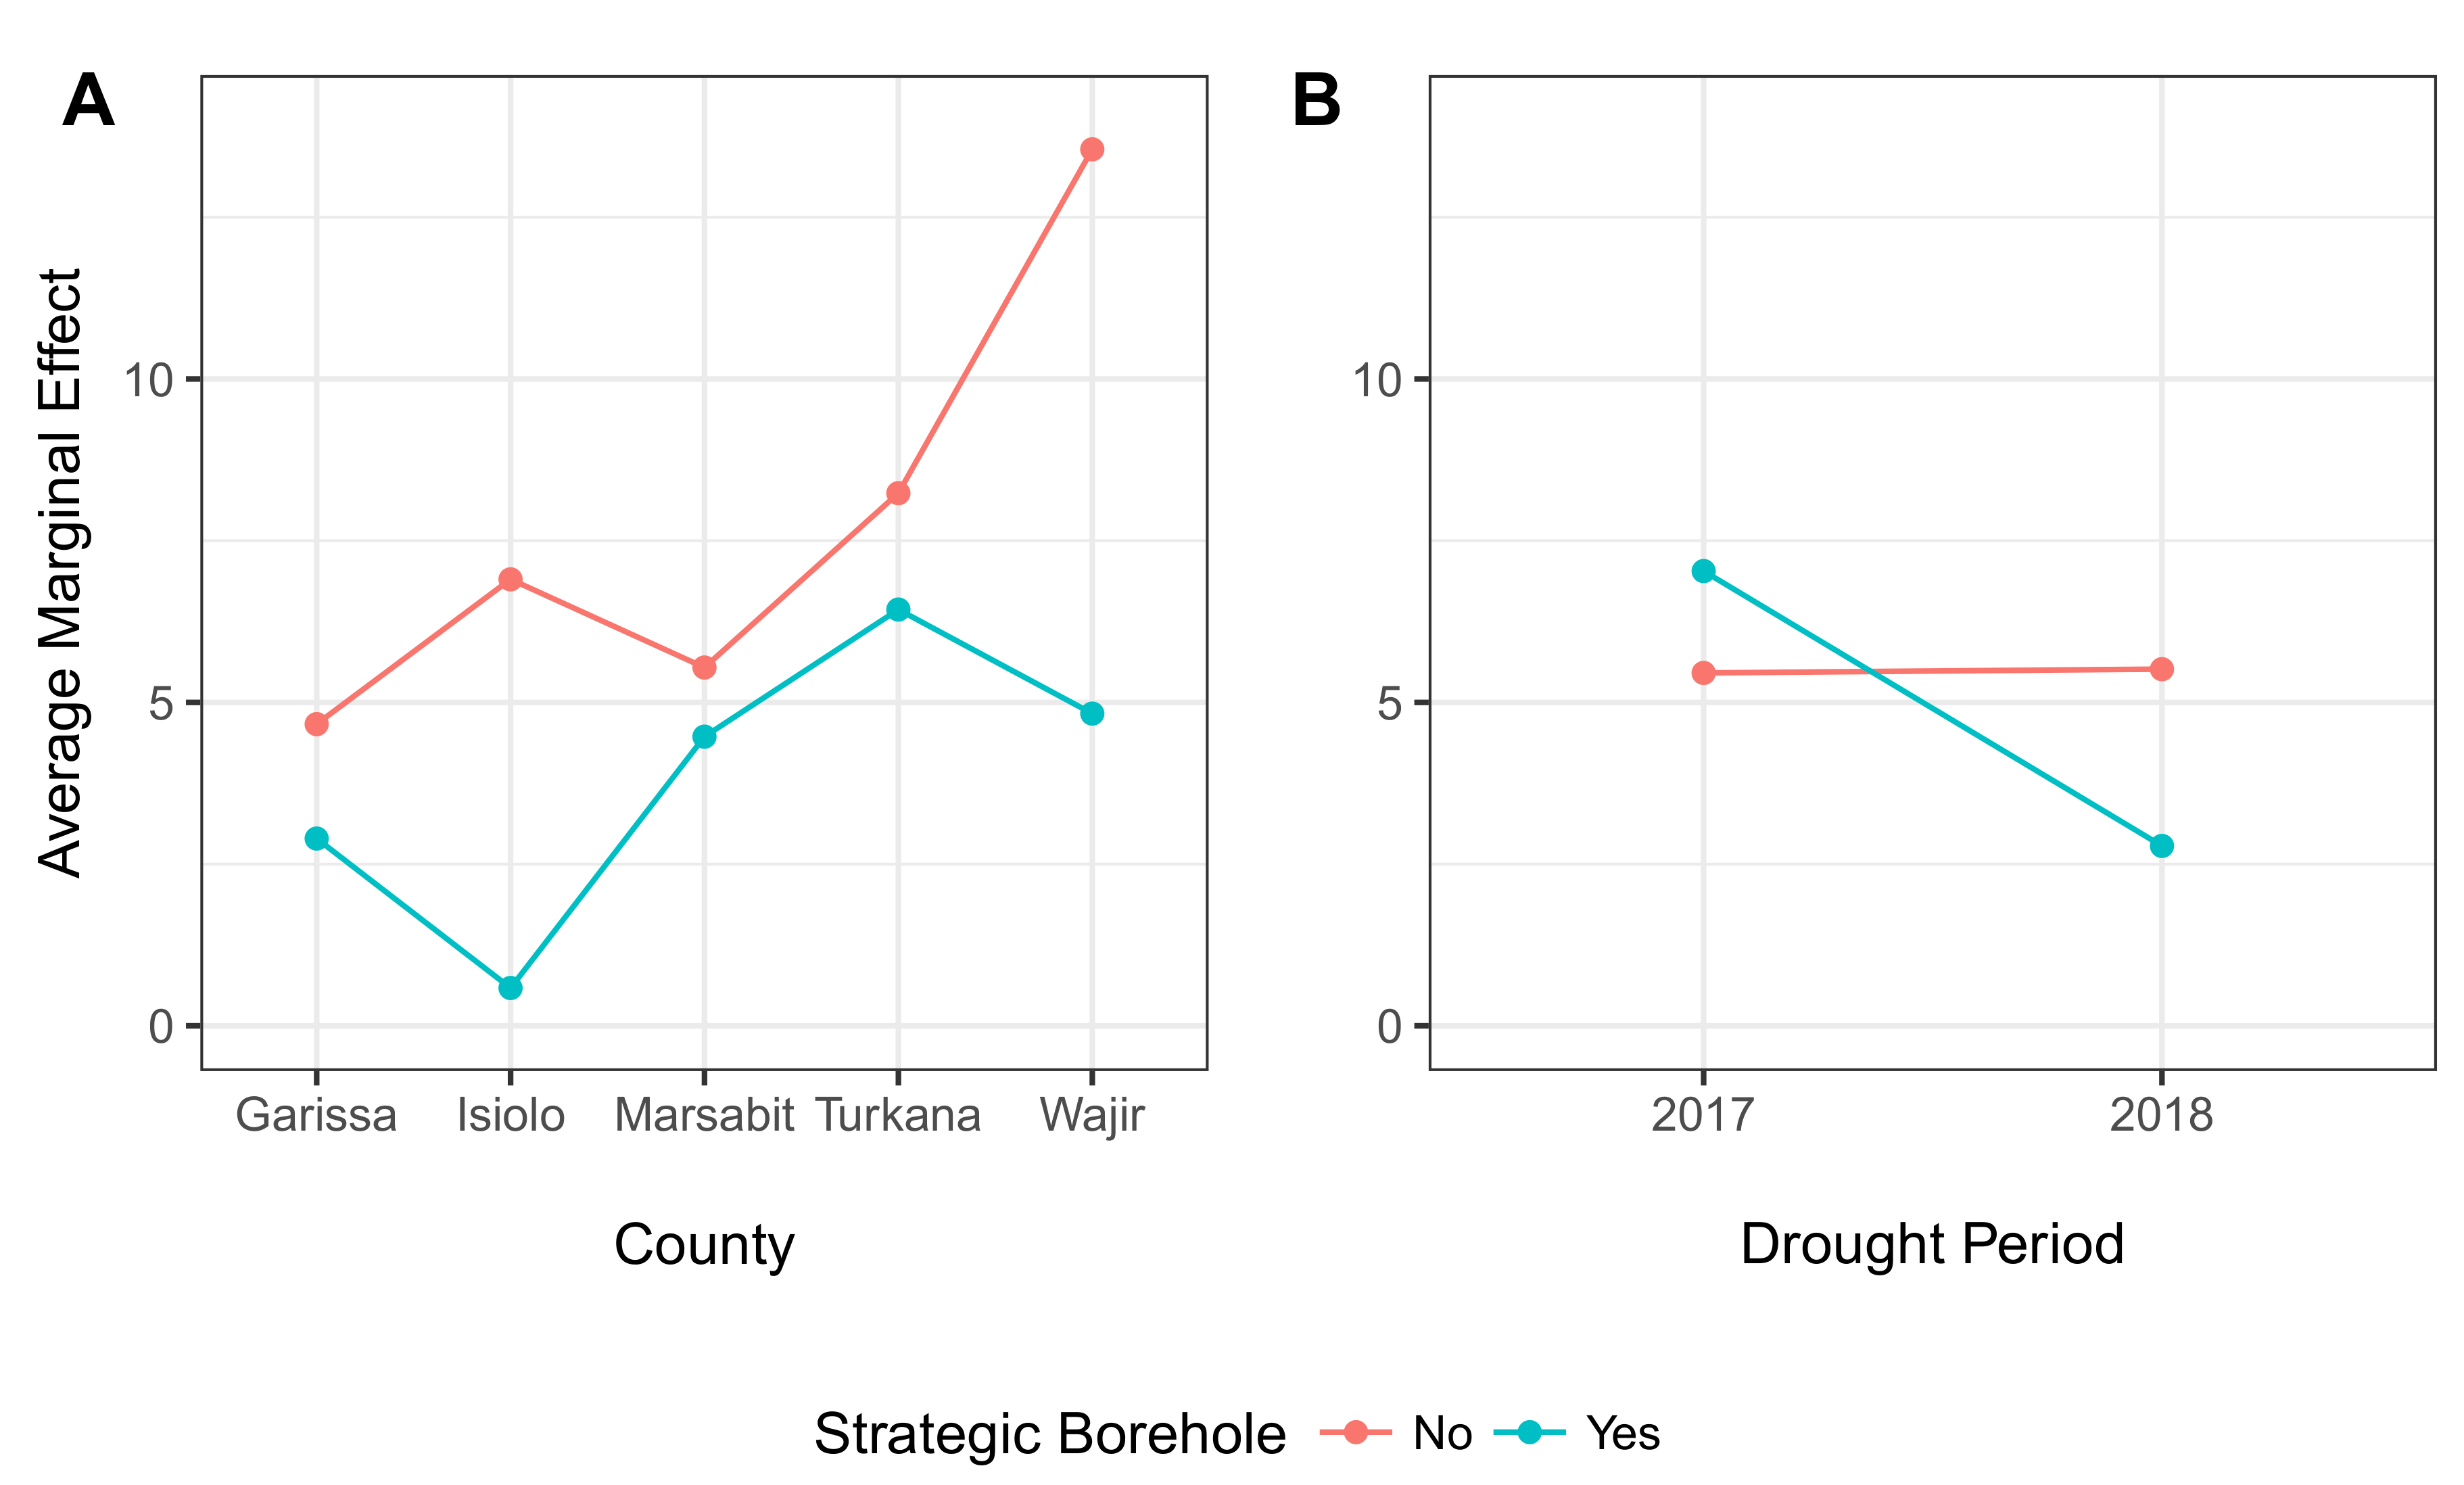
A surprising finding was that sites designated as strategic boreholes were used almost two hours less on average compared to non-strategic boreholes ( p = 0.0010 ), even when controlling for all the fixed effects listed above. To better understand why strategic boreholes were used less, we constructed two additional models to explore the interactions between borehole status, county activities, and drought conditions.
In the first exploratory model (i.e., Hour s i t = β 00 + β 01 - 04 ( Count y i ) + β 05 ( Borehole _ Statu s i ) + β 06 ( Count y i * Borehole _ Statu s i ) + U 0 i + ε i t ), we found that interactions between borehole status and county were only significant for Isiolo and Wajir. This is further demonstrated in Figure 4, where the average reduction in water system use for strategic boreholes was greater for these two counties. However, it is important to note that borehole statuses were severely unbalanced in Wajir and Isiolo because there was only one non-strategic borehole that was monitored in Wajir and only four strategic boreholes monitored in Isiolo.
In the second exploratory model (i.e., Hour s i t = β 00 + β 01 ( Borehole _ Statu s i ) + U 0 i + β 10 ( Drought _ Perio d i t ) + β 11 ( Borehole _ Statu s i * Drought _ Perio d i t ) + ε i t ) we looked at differences in water system use when controlling for drought conditions. As noted previously, there was significantly less precipitation in 2017 compared to 2018. One consequence is that the NDMA was more active in each of the counties in 2017, not only assessing drought risk and coordinating execution of each county’s contingency action plan, but also providing significant assistance through water trucking, fuel subsidies, water equipment, and support to emergency repair teams.
When the 2017 drought began in June, there were only 25 sensors installed on water systems, and only eight of those water systems were designated as strategic boreholes. Therefore, we looked at changes in use for those 25 water systems while controlling for the 2017 and 2018 dry season (June through September). However, all the predictors that were significant in the full model were no longer significant, but water systems were used about 2.69 h more in 2017 compared to 2018 ( S E = 0.645, p < 0.001). Furthermore, when borehole status and drought year were interacted in a separate model the interaction was significant ( β = 4.10 ,   S E = 1.30 ,   p = 0.0016 ). As seen in Figure 4, there is a significant difference in the average marginal effect of borehole status when interacted with drought year. Whereas the 17 non-strategic boreholes were used approximately the same amount of time during both dry seasons, strategic borehole use dropped from 6.5 h per day in 2017 to less than three hours per day in 2018.

4. Discussion and Conclusions

Fostering resilience to drought emergencies is a complex task, and the effort to improve sustainable water services describes just one facet of a broader movement to build capacity and reduce vulnerability in Kenya’s northern counties. However, sustainable water services have a disproportionate impact on the severity of drought disasters, as the inability to access safe or improved water services has ramifications that are felt rapidly and touch all other aspects of community life in rural regions [10]. While traditional drought strategies have focused on food supplies and getting humanitarian aid to the places where it is needed in a timely manner, recent strategies have shifted their focus to preventing drought emergencies by fostering resilience, building capacity, and developing early warning and rapid response systems to avoid the worst effects of drought emergencies: inter-communal conflict over scarce resources, the destruction of community assets, and the loss of human lives [7].
This investigation builds on previous studies that have shown how specialized institutions equipped with continuous monitoring technology can significantly improve the sustainability of water services in developing communities [18,26,32]. For example, Nagel et al. [26] conducted an experiment where functionality increased significantly (91%) while time to repair decreased (21 days) using sensor-informed maintenance compared to circuit-rider maintenance (73% functionality and 57 days to repair) or nominal maintenance methods (68% functionality and 152 days to repair). Similarly, Thomson et al. [32] used handpump sensors and a sensor-informed maintenance model to raise pump functionality to 98%, with 89% of repairs being completed within five days.
However, both studies are quick to point out that the data from sensors alone are not sufficient to improve the operation and maintenance of water systems. Researchers at the University of Oxford have contributed significantly to the effort to articulate how smart monitoring must be combined with professional maintenance services, sustainable finance, and coordination to provide sustainable water services [33]. Koehler et al. extend this analysis further in their articulation of the need for pluralist institutions that “facilitate risk management through improved information flows, sustainable finance and reliable maintenance” [23] (p. 272). These pluralist institutions ideally facilitate collaboration between the market, bureaucratic, and community perspectives that must be represented in the effort to reconcile conflicting values and manage a common pool resource such as water [18]. While the FundiFix model and Kenya RAPID programs have been implemented as external interventions, the NDMA provides a compelling example of a pluralist, meso-level institution that is able to “reduce operational and financial inefficiencies by pooling finances and operating at scale” while channeling resources from the federal budget to the communities and contexts where and when they are needed [23] (p. 275).
The NDMA’s ability to support each county’s waterpoint management is dependent on the drought conditions that catalyze resources. Whereas the drought in 2017 provided additional resources for fuel, maintenance, and water equipment, resulting in greater overall use of strategic boreholes, the lack of drought in 2018 resulted in diminished overall use of boreholes, particularly strategic boreholes. Based on interviews with field officers and an examination of repair records, one reason cited for decreased use of strategic boreholes in 2018 compared to 2017 is that strategic boreholes in 2018 were disproportionately affected by malfunctions and prolonged repairs. It is not clear if the number of malfunctions experienced between 2017 and 2018 is different, or if there were simply fewer resources in 2018 to conduct repairs in a timely fashion. In addition to the lack of resources normally triggered by drought conditions, the contested presidential election and expensive re-vote in 2017 could have contributed to additional budget shortfall for county water offices [34]. All five counties involved in this study reported limited resources for paying personnel or mobilizing vehicles or repairs during the months of June through August when Kenya was entering a new annual financial cycle.
It is also possible that water systems at strategic boreholes were used less in 2018 simply because there was less demand. This investigation also builds on the growing literature demonstrating how ground water demand varies significantly depending on precipitation events and the availability of surface water sources [22,28,35]. As outlined by Thomson et al. [35], the implications of fluctuating demand for basic water services are significant because previous studies have suggested that high adherence to safe water is necessary to realize sustained health benefits [36,37,38,39]. As discussed in Thomson et al., the apparent tendency of households to switch from improved to unimproved water sources based on surface water availability merits further investigation. Much like stove stacking with cookstoves [40], water source stacking challenges the assumption that keeping waterpoints functional will be sufficient to decrease the burden of disease from water-borne illnesses [35]. The apparent elasticity of demand also suggests that operation and maintenance be focused where and when demand is least elastic: during dry periods, in areas with limited surface water availability, or in areas where demand for clean water is already high.
There are several limitations of this study. For example, the fact that we measured water system use instead of functionality means that we were unable to reliably distinguish when water systems were broken from when water systems were simply not being used. Also, we observed that the definition of strategic borehole was applied differently in each county. While this preserves each county’s prerogative for prioritizing particular boreholes, it also makes comparisons across counties difficult. For example, in Isiolo there was initially difficulty identifying which boreholes were designated as strategic due to discrepancies between the NDMA officer and the county water office. Of the four that were labelled strategic, many were closed down during the year and only mobilized during drought conditions. In contrast, most of the strategic boreholes in Turkana were used all year, with variable usage patterns depending on the extent of human and livestock migration during the dry season. Also, at the time of writing a process was still being formalized for operationalizing these data to inform maintenance activities in each county. It is also worth noting that the number of water points with sensors represented a small fraction of the total number of motorized and non-motorized boreholes in each county. Due to the evolving nature of the online dashboards and the inchoate processes for integrating sensor data into existing operation and maintenance activities, the effect of having access to information about each pump site on overall site use and functionality was not considered in this phase of the study.
Finally, much of this investigation has focused on the unique role that meso-level institutions and initiatives can play in reducing the vulnerability of communities in arid regions to drought disasters. While we have emphasized the value of using continuous waterpoint monitoring data to inform and mobilize support for the operation and maintenance activities of local county water offices, we acknowledge that water security cannot be reduced to waterpoint management. Given that these activities take place on a complex and adaptive ecological and social landscape, it will be important to explore how funding and resources for waterpoint management can be balanced with the other initiatives being undertaken by each county to increase drought resiliency. Since all of these initiatives are tightly interlinked—for example, surface water catchments can increase surface water availability and groundwater recharge, and sustainable rangeland management can reduce the need for human and livestock migration—it will be important to consider whether the sum of these activities is greater than any of their individual contributions.

Author Contributions

Conceptualization, E.A.T., N.T.-B., C.N.; Methodology, N.T.-B., C.N., and E.A.T.; Software, N.T.-B. and C.N.; Validation, N.T.-B., C.N., and E.A.T.; Formal analysis, N.T.-B., C.N., and E.A.T.; Investigation, N.T.-B., C.N., and E.A.T.; Resources, E.A.T., L.S., C.M.; Data curation, L.S., C.M., N.T.-B., E.A.T.; Writing—original draft preparation, N.T.-B.; Writing—Review and editing, N.T.-B., E.A.T., C.N., L.S., and C.M.; Visualization, N.T.-B.; Supervision, E.A.T.; Project administration, E.A.T., L.S., and C.M.; Funding acquisition, E.A.T.

Funding

The data used in this publication was made possible through support provided by the U.S. Agency for International Development, under the terms of Cooperative Agreement No. AID-615-A-15-00008. Additional support was provided by the Link Foundation, the Cisco Foundation, and the National Science Foundation IGERT Grant #0966376: “Sustaining Ecosystem Services to Support Rapidly Urbanizing Areas.” Any opinions, findings, and conclusions expressed in this material are those of the authors and do not necessarily reflect the views of the U.S. Agency for International Development or the National Science Foundation.

Acknowledgments

Our partners include the Kenya National Drought Management Authority, the Millennium Water Alliance, Catholic Relief Services, World Vision, mWater, IRC, CARE, IRC Wash, IBM Research, SweetSense Inc., the USAID Program, and the county governments of Turkana, Isiolo, Wajir, Garissa and Marsabit in Kenya.

Conflicts of Interest

E.A.T., C.N., L.S., and C.M. are employees of SweetSense Inc., and E.A.T. is co-owner. N.T.-B. was a graduate student working with the Sustainable Water, Energy, and Environmental Technologies Lab (SWEET Lab) at Portland State University.

References

  1. WWAP. Wastewater—The Untapped Resources; Technical Report; United Nations World Water Assessment Programme: Paris, France, 2017. [Google Scholar] [CrossRef]
  2. Lehmann, J.; Mempel, F.; Coumou, D. Increased Occurrence of Record-wet and Record-dry Months Reflect Changes in Mean Rainfall. GRL In-Revis. 2018. [Google Scholar] [CrossRef]
  3. Rowell, D.P.; Booth, B.B.; Nicholson, S.E.; Good, P. Reconciling past and future rainfall trends over East Africa. J. Clim. 2015, 28, 9768–9788. [Google Scholar] [CrossRef]
  4. Shah, A.; Mills, R. Funding Mechanisms to Incentivize Sustainable and Inclusive Water Provision in Kenya’s Arid and Semi-Arid Lands; Oxfam Research Report; Oxfam International: Oxford, UK, 2018. [Google Scholar]
  5. KNBS/SID. Exploring Kenya’s Inequality: Pulling Apart or Pooling Together? Technical Report; Kenya National Bureau of Statistics and Society for International Development: Nairobi, Kenya, 2013. [Google Scholar]
  6. Banholzer, S.; Kossin, J.; Donner, S. The Impact of Climate Change on Natural Disasters. In Reducing Diaster: Early Warning Systems for Climate Change; Zommers, Z., Singh, A., Eds.; Springer: New York, NY, USA, 2014; Chapter 2; pp. 21–50. [Google Scholar]
  7. Fitzgibbon, C.; Crosskey, A. Disaster Risk Reduction Management in the Drylands in the Horn of Africa; Technical Report; International Livestock Research Institute: Nairobi, Kenya, 2013. [Google Scholar]
  8. NDMA. Ending Drought Emergencies Common Programme Framework; Technical Report; National Drought Management Authority: Nairobi, Kenya, 2015. [Google Scholar]
  9. USAID. USAID KENYA RAPID PROGRAM Fact Sheet; Technical Report; USAID: Washington, DC, USA, 2018. [Google Scholar]
  10. MWA. Kenya Resilient Arid Lands Partnership for Integrated Development (Kenya RAPID); Technical Report; Millennium Water Alliance: Washington, DC, USA, 2015. [Google Scholar]
  11. Zommers, Z.; Singh, A. (Eds.) Reducing Disaster: Early Warning Systems for Climate Change; Springer: Dordrecht, The Netherlands; Heidelberg, Germany; New York, NY, USA; London, UK, 2014. [Google Scholar] [CrossRef]
  12. Narayan, D.; Petesch, P. (Eds.) Moving Out of Poverty: Cross-Disciplinary Percpectives on Mobility; Palgrave Macmillan and The World Bank: Washington, DC, USA, 2007; pp. 1–394. [Google Scholar] [CrossRef]
  13. Homewood, K.; Trench, P.C.; Kristjanson, P. Staying Maasai? Pastoral Livelihoods, Diversification and the Role of Wildlife in Development. In Staying Maasai? Livelihoods, Conservation and Development in East African Rangelands; Springer: New York, NY, USA, 2009; Chapter 10; pp. 369–408. [Google Scholar]
  14. Khaunya, M.F.; Wawire, B.P.; Chepng, V. Devolved Governance in Kenya; Is it a False Start in Democratic Decentralization for Development? Int. J. Econ. Financ. Manag. 2015, 4, 27–37. [Google Scholar]
  15. Pozzi, B.; Oduor, J. Partnerships Key to Ending Drought Emergencies: The Standard Digital. 2018. Available online: https://www.standardmedia.co.ke/article/2001295319/partnerships-key-to-ending-drought-emergencies (accessed on 28 May 2019).
  16. EEAS. EU Provides Emergency Response Funds to National Drought Management Agency. 2014. Available online: http://eeas.europa.eu/archives/delegations/kenya/press_corner/all_news/news/2014/20140610_1_en.htm (accessed on 28 May 2019).
  17. EEAS. The European Union (EU) Has Allocated Another EUR 29M in Response for Drought Emergency. 2017. Available online: https://eeas.europa.eu/headquarters/headquarters-homepage/22271/european-union-eu-has-allocated-another-eur-29m-response-drought-emergency_en (accessed on 28 May 2019).
  18. Koehler, J.; Rayner, S.; Katuva, J.; Thomson, P.; Hope, R. A cultural theory of drinking water risks, values and institutional change. Glob. Environ. Chang. 2018, 50, 268–277. [Google Scholar] [CrossRef]
  19. Liu, J.; Dietz, T.; Carpenter, S.R.; Folke, C.; Alberti, M.; Redman, C.L.; Schneider, S.H.; Ostrom, E.; Pell, A.N.; Lubchenco, J.; et al. Coupled human and natural systems. Ambio 2007, 36, 639–649. [Google Scholar] [CrossRef]
  20. Stevenson, R.J. A revised framework for coupled human and natural systems, propagating thresholds, and managing environmental problems. Phys. Chem. Earth Parts A/B/C 2011, 36, 342–351. [Google Scholar] [CrossRef]
  21. Haines, S.; Imana, C.A.; Opondo, M.; Ouma, G.; Rayner, S. Weather and Climate Knowledge for Water Security: Institutional Roles and Relationships in Turkana; REACH Working Paper 5; University of Oxford: Oxford, UK, 2017. [Google Scholar]
  22. Kelly, E.; Shields, K.F.; Cronk, R.; Lee, K.; Behnke, N.; Klug, T.; Bartram, J. Seasonality, water use and community management of water systems in rural settings: Qualitative evidence from Ghana, Kenya, and Zambia. Sci. Total Environ. 2018, 628–629, 715–721. [Google Scholar] [CrossRef] [PubMed]
  23. Koehler, J. Exploring policy perceptions and responsibility of devolved decision-making for water service delivery in Kenya’s 47 county governments. Geoforum 2018, 92, 68–80. [Google Scholar] [CrossRef]
  24. Olago, D.; Opondo, M.; Mumma, A.; Ouma, G.; Dulo, S.; Trevett, A.; Harvey, P.; Hope, R.; Stallone, A.; Koehler, J.; et al. Country Diagnostic Report, Kenya; REACH Working Paper 3; University of Oxford: Oxford, UK, 2015. [Google Scholar]
  25. Thomas, E.; Zumr, Z.; Graf, J.; Wick, C.; McCellan, J.; Imam, Z.; Barstow, C.; Spiller, K.; Fleming, M. Remotely Accessible Instrumented Monitoring of Global Development Programs: Technology Development and Validation. Sustainability 2013, 5, 3288–3301. [Google Scholar] [CrossRef] [Green Version]
  26. Nagel, C.; Beach, J.; Iribagiza, C.; Thomas, E.A. Evaluating Cellular Instrumentation on Rural Handpumps to Improve Service Delivery-A Longitudinal Study in Rural Rwanda. Environ. Sci. Technol. 2015, 49, 14292–14300. [Google Scholar] [CrossRef] [PubMed]
  27. Wilson, D.L.; Coyle, J.R.; Thomas, E.A. Ensemble machine learning and forecasting can achieve 99% uptime for rural handpumps. PLoS ONE 2017, 12, e0188808. [Google Scholar] [CrossRef] [PubMed]
  28. Thomas, E.A.; Needoba, J.; Nagel, C.; Kaberia, D.; Butterworth, J.; Mugo, R.; Odour, P.; Macharia, D.; Mitheu, F.; Adams, E. Quantifying increased groundwater demand from prolonged drought in the East African Rift Valley. Sci. Total Environ. 2019. [Google Scholar] [CrossRef] [PubMed]
  29. Feighery, J.; Smith, R.; Grassick, C.; Feighery, A. mWater: A free and open-access platform for water data sharing and collaboration. Open Water J. 2015, 3, 7. [Google Scholar]
  30. Camberlin, P. Climate of Eastern Africa. In Oxford Research Encyclopedia of Climate Science; Oxford University Press: New York, NY, USA, 2018. [Google Scholar] [CrossRef]
  31. Pinheiro, J.; Bates, D.; DebRoy, S.; Sarkar, D.; R Core Team. nlme: Linear and Nonlinear Mixed Effects Models; R Package Version 3.1-137; R Core Team: Vienna, Austria, 2018. [Google Scholar]
  32. Thomson, P.; Koehler, J.; Hope, R. “Can Mobile Data Improve Rural Water Institutions in Rural Africa?” GWF Discussion Paper 1414, Global Water Forum, Canberra, Australia. 2014. Available online: http://www.globalwaterforum.org/2014/04/14/can-mobile-data-improve-rural-water-institutions-in-africa/ (accessed on 28 May 2019).
  33. Thomson, P.; Koehler, J. Performance-oriented Monitoring for the Water SDG – Challenges, Tensions and Opportunities. Aquat. Procedia 2016, 6, 87–95. [Google Scholar] [CrossRef]
  34. The Carter Center. Kenya 2017 General and Presidential Elections Report; Technical Report; The Carter Center: Atlanta, GA, USA, 2018. [Google Scholar]
  35. Thomson, P.; Bradley, D.; Katilu, A.; Katuva, J.; Lanzoni, M.; Koehler, J.; Hope, R. Rainfall and groundwater use in rural Kenya. Sci. Total Environ. 2018, 649, 722–730. [Google Scholar] [CrossRef] [PubMed]
  36. Brown, J.; Clasen, T. High Adherence Is Necessary to Realize Health Gains from Water Quality Interventions. PLoS ONE 2012, 7, e36735. [Google Scholar] [CrossRef] [PubMed]
  37. Enger, K.S.; Nelson, K.L.; Clasen, T.; Rose, J.B.; Eisenberg, J.N.S. Linking quantitative microbial risk assessment and epidemiological data: Informing safe drinking water trials in developing countries. Environ. Sci. Technol. 2012, 46, 5160–5167. [Google Scholar] [CrossRef] [PubMed]
  38. Hunter, P.R.; Zmirou-Navier, D.; Hartemann, P. Estimating the impact on health of poor reliability of drinking water interventions in developing countries. Sci. Total Environ. 2009, 407, 2621–2624. [Google Scholar] [CrossRef] [PubMed]
  39. Howard, G.; Pedley, S.; Tibatemwa, S. Quantitative microbial risk assessment to estimate health risks attributable to water supply: Can the technique be applied in developing countries with limited data? J. Water Health 2006, 4, 49–65. [Google Scholar] [CrossRef] [PubMed]
  40. Masera, O.R.; Saatkamp, B.D.; Kammen, D.M. From linear fuel switching to multiple cooking strategies: A critique and alternative to the energy ladder model. World Dev. 2000, 28, 2083–2103. [Google Scholar] [CrossRef]
Figure 1. Coupled human and natural systems framework to model how perceptions, policies, and behaviors mediate the dynamic interactions between human and natural systems.
Sustainability 11 03046 g001
Figure 2. Average daily water system use for each county by year (line graph with left axis); annual precipitation (bar chart with right axis). Use data was collected from installed sensors, and precipitation data was collected from CHIRPS data.
Sustainability 11 03046 g002
Figure 3. Left axis: average hours of daily water system use for each county from 2017 through 2018. The red line indicates average daily use across all boreholes for each county, whereas the blue and pink dots show the individual observations for strategic and non-strategic boreholes, respectively. Right axis: the blue line describes the average daily precipitation across all pump sites for each county. The dark grey region demarcates the primary rainy season (March through May) and the light grey region demarcates the secondary rainy season (September through November). Use data was collected from installed sensors, and precipitation data was collected from CHIRPS data.
Sustainability 11 03046 g003
Figure 4. (A) Average marginal effect of strategic borehole status on hours of use for each county. (B) Average marginal effect of strategic borehole status on hours of use for the 2017 and 2018 drought seasons.
Sustainability 11 03046 g004
Table 1. Sample characteristics for all data and for the drought comparison sub-study. Interquartile range (IQR) represents the difference between first and third quartiles for all strategic and non-strategic boreholes. Observations were collected between the September 2016 and January 2019.
All DataDrought Comparison
StrategicNon-StrategicStrategicNon-Strategic
Number of water systems
    Garissa15322
    Isiolo41203
    Marsabit201134
    Turkana161907
    Wajir19131
Median number of daily observations
    Garissa (IQR)240 (49)620 (150)620 (1)620 (1)
    Isiolo (IQR)480 (3)310 (220)0 (0)630 (130)
    Marsabit (IQR)350 (230)360 (270)640 (2)640 (13)
    Turkana (IQR)200 (110)430 (270)0 (0)640 (160)
    Wajir (IQR)360 (150)600 (0)610 (41)600 (0)
Median households served (IQR)480 (680)1700 (5700)420 (890)2500 (6800)
Median livestock served (IQR)2300 (6600)0 (1100)3400 (13,000)0 (1200)
Power source
    Generator27472
    Solar11905
    Utility1502
    Hybrid331313
Used for filling water trucks131115
Urban location31104
Seasonally used pump site431475
Alternative source: other pipe stand292337
Alternative source: surface water36743
Table 2. Multilevel model results for all data.
Coefficient (SE)p-Value
Intercept3.95 (0.795)<0.001
County: Garissa (reference)NANA
County: Isiolo−1.94 (0.686)0.0058
County: Marsabit0.514 (0.592)0.388
County: Turkana2.33 (0.690)0.0011
County: Wajir2.39 (0.558)0.0001
Strategic Borehole Status−1.33 (0.384)0.0009
Households Served (1000s)−0.195 (0.0541)0.0005
Livestock Served (1000s)−0.0343 (0.0149)0.0242
Power: Generator (reference)NANA
Power: Hybrid1.11 (0.375)0.0043
Power: Solar−0.959 (0.516)0.0667
Power: Utility3.56 (0.666)<0.001
Seasonal Pump0.685 (0.319)0.0349
Alt. Surface Water Source−0.982 (0.337)0.0091
Rainy Season−0.389 (0.126)0.0021
Water Trucking3.03 (0.348)<0.001
Urban Location3.23 (0.578)<0.001

