The Role of Large Dams in Promoting Economic Development under the Pressure of Population Growth


1
State Environmental Protection Key Laboratory of Integrated Surface Water-Groundwater Pollution Control, School of Environmental Science and Engineering, Southern University of Science and Technology, Shenzhen 518055, China
2
Guangdong Provincial Key Laboratory of Soil and Groundwater Pollution Control, School of Environmental Science and Engineering, Southern University of Science and Technology, Shenzhen 518055, China
3
Department of Civil Engineering, The University of Hong Kong, Pokfulam, Hong Kong, China
4
UNSW Water Research Centre, School of Civil and Environmental Engineering, The University of New South Wales, Sydney, NSW 2052, Australia
5
Department of Civil Engineering, Indian Institute of Technology-Bombay, Powai, Mumbai 400076, India
6
State Key Laboratory of Hydroscience and Engineering, Tsinghua University, Beijing 100084, China
*
Authors to whom correspondence should be addressed.
Sustainability 2019, 11(10), 2965; https://doi.org/10.3390/su11102965
Submission received: 5 May 2019
/
Revised: 13 May 2019
/
Accepted: 17 May 2019
/
Published: 24 May 2019
(This article belongs to the Special Issue Large-scale Water Projects, Socio-economic Development, and Environmental Sustainability)
Abstract
:The close relationship between large dams and social development (i.e., water, food, and energy consumption) has been revealed in previous studies, and the vital role of large dams in sustaining societies has been recognized. With population projections indicating continued growth during this century, it is expected that further economic development of society, e.g., Gross Domestic Product (GDP) growth, will be greatly affected by possible challenges, such as water, food, and energy shortages in the future, especially if proper planning, development, and management strategies are not adopted. In our previous study, we have argued that construction of additional large dams will be considered as one of the best available options to meet future increases in water, food, and energy demands, which are all crucial to sustain economic development. In the present study, firstly, we will emphasize the vital role of dams in promoting economic growth through analyzing the relationship between large dam development and GDP growth at both global and national scales. Secondly, based on the projection results of future large dam development, we will preliminarily predict the future economic development represented by GDP. The results show that the impacts of large dams upon GDP are more significant in countries with higher levels of socioeconomic development, which generally supports large dams as the vital factor to promote economic development.
1. Introduction
Regarded as a driving force in demands of water, food, and energy, the world’s population has been increasing rapidly since the beginning of the 20th century, and will reach 9.7 billion by 2050 according to the medium-growth projection scenario of the United Nations [1]. At the global scale, consumptions of water, food, and energy have all been increasing along with population growth [2,3,4,5,6], and among these, water is the key factor in consideration of its various uses, e.g., drinking, irrigation, and hydropower [7]. The total volume of available water resources is sufficient to meet all the demands if it were evenly distributed in space and time [8]; however, this is not the case, as significant spatial and temporal variability exists in the distribution of water resources around the world. Moreover, when coupled with population, there is often a mismatch between water resources and population [7,9]. It is worth noting that many areas of the world have been facing, or will face, different types of water scarcity (i.e., little or no water scarcity, physical water scarcity, and economic water scarcity), which are defined in terms of access to water based on the relationship between the availability of water resources and the demand of people [10,11]. There is no doubt that water scarcity, as well as the associated issues of food and energy security. will affect economic development to a large extent, and sometimes economic development will be the dominant factor of water scarcity in turn, e.g., economic water scarcity, the symptoms of which include scant infrastructure development either at the small or large scale, is mainly caused by a lack of investment in getting enough water or a lack of human capacity to satisfy the water demand [11].
In order to meet the needs of a growing population, a number of infrastructure projects (e.g., dams) were built to increase water withdrawals from rivers and groundwater for much of the 20th century. Specifically, during the second half of the 20th century, construction of dams was regarded as the main measure of river basin management for generating hydropower, controlling flood, storing water storage, and reducing risks from natural disasters [7,11,12,13,14,15,16,17,18]. By contrast, dams have played a less important role in other functions, such as transportation along rivers, recreation, tourism, and aquaculture [7]. Moreover, large dams (and related reservoirs and hydropower stations) are considered to play a more important role than small ones [7]. Large dam construction has been integral to human population growth and technological innovation [19], and along with other infrastructure projects, large dam construction has effectively enhanced societies’ capabilities in water resources management, as well as the related issues of food and energy security [20,21]. Moreover, dam development in the 20th century has coincided with economic development at both national and regional scales [22,23]. World Commission on Dams (WCD) stated that dams are one of a series of public infrastructure projects aimed at the economic development of a region, nation, or river basin, and are promoted as an important way to meet water, food, and energy needs and support economic development [22]. Nilsson et al. also reported that dam-impacted basins experience about 25 times more economic activity than unaffected basins [23].
In our previous study [7], the close relationship between global large dam construction and social development has been investigated based on some key social data (e.g., population and consumption of water, food, and energy) and the information of large dams around the world (e.g., number and storage capacity). We have also argued that construction of additional large dams will have to be considered as one of the best available options to meet future increases in water, food, and energy demands, which are vital to sustain economic development. In the present study, the role of dams in promoting economic development will be further emphasized through analyzing the relationship between large dam development and economic development represented by gross domestic product (noted as GDP hereafter) growth at both global and national scales. Moreover, based on the projections of future large dam construction (e.g., the number of dams by 2050), this study will address the question of future economic development and project the GDP growth of all countries by 2050. The results will be useful for policymakers to have a more informed understanding of economic development affected by large dam development in the future.
2. Materials and Methods
2.1. Groups of Countries
Following our previous study [7], the main countries are broadly grouped into three categories, with developed countries (44 in total) on one extreme, the least developed countries (LDCs) (49 in total) on the other, and developing countries (150 in total) in between [9,24], according to the level of socioeconomic development (Table 1). It is worth noting that five of the developing countries, namely Brazil, Russia, India, China, and South Africa (BRICS), are very likely to become the world’s fastest growing economies in the near future [25,26]. Therefore, the following analyses will consider two sub-groups within the developing countries, i.e., BRICS and the rest.
2.2. Research Data
The dam data used in this study are derived from the International Commission on Large Dams and Global Reservoir and Dam databases [27,28]. Selected from the above two databases, the number of large dams constructed between 1900 and 2010 is 32,473. The economic data (i.e., the GDP data) used in this study are derived from World Bank [29], which are available from 1960 for most countries. Specifically, to maintain consistency with the length of the dam data, only the GDP data for each country by 2010 are selected for analysis. In addition, the 0.5-degree grid-based global population density dataset [30] available from 1990 to 2015 (every five years) is used to project the future population density.
2.3. Regression Method and Assessment Criteria
Relationship between large dam construction (i.e., the number of large dams, reservoir capacity, and installed hydropower capacity) and economic development represented by the GDP data will be analyzed in this study. The regression method is used to examine the goodness of fit, and different forms of functions (i.e., linear, logarithmic, exponential, polynomial, and so on) are attempted. In order to quantitatively evaluate the performance of the regression equation, the corresponding coefficient of determination (i.e., R2) is computed, and the higher R2 value indicates the greater performance of the regression equation. The basic equation to compute the R2 value is given as follows:
where yi is the i-th observed value, is the mean of all the observed values, and is the i-th regression value.
2.4. Projection of Future Population Growth
Future population growth is regarded as the major driving force for building more large dams. Projection of future population density for the period 2020–2050 is conducted based on the global population density dataset [30]. First, the trend of the population density for each grid is evaluated based on the gridded population density data from 1990 to 2015 (every five years). It is worth noting that both the linear and quadratic polynomial regressions will be attempted in this study and the more suitable one will be selected to project future population density (see Section 3.3 for details). Second, the population density for each grid from 2020 to 2050 (every five years) is extrapolated with this trend. Third, the percentage change of the population density for each grid is calculated through using the difference of population density in 2050 and 2015 divided by the population density in 2015. Then, the global map of the percentage change of the population density from 2015 to 2050 can be obtained.
3. Results and Discussion
3.1. Overview of Global Dams and GDP
As mentioned above, along with other infrastructures, dams have enhanced the capability of our society in water resources management [7]. By the year 2010, a total of 32,473 large dams had been constructed all over the world [27]. The number of large dams (as well as related reservoirs and hydropower stations) for each country is calculated and the result is shown in Figure 1 (see the blue circles). At the continental scale, there were 14,719, 9241, 5163, 1799, 988, and 563 large dams in Asia, North America, Europe, Africa, South America, and Oceania, respectively. It is worth noting that nearly 90% (i.e., (14,719 + 9241+5163)/32,473) of the large dams were built in Asia, North America, and Europe, which are the three continents with more developed countries than other continents. In terms of the locations, most large dams have been constructed in the basins of the great rivers, such as the Yangtze River, the Yellow River, and the Ganges River in Asia, the Mississippi River in North America, and the Rhine River and Danube River in Europe. Furthermore, at the national scale, it is observed that United States has built the most large dams with the number of 7968, followed by China (with the number of 4928) and India (with the number of 4104). Among them, the United States is the most-developed country in the world, while China and India are the two fastest developing countries. Therefore, such results can preliminary indicate the close relationship between large dams and economic development.
Moreover, based on the main use of a large dam given by Global Reservoir and Dam database [28], it is observed that 29% of the large dams were built for hydroelectricity, 34% for irrigation, 10% for flood control, 16% for water supply, and 11% for other uses (e.g., navigation and recreation). It is observed that hydroelectricity and irrigation are the two most important considerations for large dam construction for the purposes of energy production and food production, respectively. It is worth noting that social stability is a prerequisite for economic development, and adequate energy and food supplies are both important factors in maintaining social stability. From this perspective, large dams can be related to economic development to some extent.
With reference to economic development, the GDP data of all the countries around the world in 2010 are collected in this study, since the 32,473 large dams were constructed by the year 2010. Figure 1 also shows the global map of the GDP data in 2010. Compared with the dam data, it is clear that the bigger blue circles are generally located in the countries with larger GDP (i.e., countries with the color of light pink), such as the United States, China, Japan, India, Brazil, Republic of Korea, Canada, and a number of countries in Western Europe (e.g., France and Spain). Therefore, in order to further investigate the quantitative relationship between large dams and economic development represented by the GDP data, a more detailed analysis is conducted in the next subsection.
3.2. Relationship of Large Dams with GDP
In this study, the relationship between large dams and GDP is investigated based on the dam data by the year 2010 and the GDP data of each country in 2010. It is worth noting that due to the data availability, different variables will be selected as the representative of dam development at different scales. At the global scale, only one variable (i.e., the number of large dams) is selected as the representative of dam development because a part of large dams in some countries do not include other information, such as reservoir capacity and installed capacity, so only the relationship between the number of large dams and the GDP data can be established. At the national scale, three variables (i.e., the number of large dams, reservoir capacity, and installed capacity) are selected to represent dam development. For a designated country, the dam data and the GDP data in 1960, 1970, 1980, 1990, 2000, and 2010 can be collected, and the relationships of the three selected variables with the GDP data can be established over this 50-year period (i.e., 1960–2010).
Firstly, at the global scale, high correlation was found between the number of large dams and the GDP data for all the countries worldwide (Figure 2a). The R2 value of the linear regression was 0.81, which indicated that large dams could play a vital role in promoting economic development. The other three sub-graphs in Figure 2 show the linear regressions between the number of large dams and the GDP data for the three groups of countries mentioned in Section 2.1, respectively. It is observed that the linear regression for developed countries had the highest R2 value of 0.93, followed by that for developing countries with the R2 value of 0.72. By contrast, the lowest R2 value (i.e., 0.15) of the linear regression for the LDCs demonstrated that the number of large dams and the GDP data in the LDCs were relatively independent. This is partially responsible for non-standard and incomplete data statistics due to relatively backward methods and techniques in the LDCs. As a result, it is concluded that the impacts of large dams upon GDP were more significant in countries with higher levels of economic development. The above analysis, in general, supports large dams as an essential factor to promote economic development reflected by the GDP data. Moreover, Table 2 lists the number of large dams and the GDP data for all the countries worldwide during 1960–2010 (every ten years). It is found that the exponential function fits the data well, and therefore, the regression equation to estimate the GDP data based on the number of large dams for all the countries worldwide is given as follows:
where GDP is the GDP data for all the countries worldwide, and NLD is the number of large dams.
GDP = 2.4838 × 10¹¹ exp(1.6519 × 10⁻⁴ NLD), R2 = 0.99
Secondly, with reference to specific countries, the relationships of the GDP data with the three selected variables (i.e., the number of large dams, reservoir capacity, and installed capacity) during the period of 1960–2010 were analyzed. In this study, the United States and Japan were selected as the representatives of developed countries, while the BRICS were selected as the representatives of developing countries. No country was selected as the representative of the LDCs because (i) there were only 184 large dams in the LDCs by 2010, accounting for less than 0.6% of the total number of large dams, and (ii) the correlation between large dams and GDP in the LDCs was rather weak (see Figure 2d).
For developed countries, Figure 3 shows the relationships of the GDP data with the number of large dams, reservoir capacity, and installed capacity in United States and Japan during 1960–2010. The six scatter points in each sub-graph, from left to right, denoted the data in 1960, 1970, 1980, 1990, 2000 and 2010, respectively. Generally, the high R2 values indicated the close relationship between large dams and economic development. Moreover, it is observed that the logarithmic regression curves fit the data well, which indicated that the changing rates of large dam development would become smaller with the increasing GDP. The reasons for this may be as follows. Recently, construction of large dams has been regarded to involve trade-offs between economic, social, and environmental benefits and costs, which have made construction of large dams controversial [31]. In addition, dam removal has been emerging as an issue in recent years, especially in developed countries, such as the United States [32,33,34,35,36]. This may reflect the fact that some dams may have exceeded their design lives or outlived their original purpose leading to diminished utility, in addition to concerns about their environmental impacts [33,37]. This may also partly explain why the R2 values for the United States were lower than those for Japan.
For developing countries, it is worth noting that the GDP data of Russia before 1989 were not available [29]. That is because Russia was a part of the former Soviet Union before 1989. As a result, only the relationships of the GDP data with the number of large dams, reservoir capacity, and installed capacity in Brazil, India, China, and South Africa during 1960–2010 were analyzed. Similarly, all the data were processed with the logarithmic regression method, and Table 3 lists the corresponding R2 values. It is observed that all the R2 values were larger than 0.82, which clearly indicated the significant relationships between economic development and large dam construction in these four fast developing countries. Specifically, for China, the R2 value for the relationship between GDP and the number of large dams (i.e., 0.82) was much smaller than the other two (i.e., 0.97 and 0.92). This is mainly because with the advances of science and technology, recent large dams (and related reservoirs and hydropower stations) have been designed to be larger and higher, leading to the result that the increase of the number of large dams has fallen behind the increases of reservoir capacity and installed capacity. In other words, the role of one recent large dam may be considered equivalent to the role of several past large dams.
Thirdly, this study further investigates the situation illustrating how the presence of large dams has affected the economic development, taking China as a case study. Figure 4 shows the comparisons of the GDP data against the number of large dams and reservoir capacity in China for each year from 1960 to 2010. It is observed that compared to the variation of the number of large dams, the variation of the reservoir capacity curve could better match that of the GDP curve. This is consistent with the results of R2 values (Table 3), which indicated that the correlation of the GDP data with reservoir capacity was higher than that with the number of large dams. In addition, there has been a boom in dam construction since Chinese economic system reform and the introduction of open-door policies in the 1970s [38,39]. According to the study of Miao et al., on average 4.4 reservoirs with a reservoir capacity larger than 0.1 km3 were constructed per annum during the 1970s–1990s, and the pace of construction accelerated after 2000, with an average of 11.8 such reservoirs constructed per annum in the 2000s [38]. The increasing rate of the reservoir capacity was 22.42 km3 per annum after 2000, which was nearly twice as much as that before 2000 (i.e., with a rate of 12.44 km3 per annum) (see Figure 4b). Correspondingly, the increasing rate of the GDP data was 4.13×10¹¹ $USD per annum after 2000, which was almost 16 times as much as that before 2000 (i.e., with a rate of 2.57×10¹⁰ $USD per annum) (see Figure 4). Therefore, it is concluded that the economic development represented by the GDP data was closely related to the construction of large dams (and related reservoirs and hydropower stations), although the casual relationship between them was still unclear and difficult to be teased out. Nevertheless, since the construction of large dams (and related reservoirs and hydropower stations) can help to meet the increasing demands of water, food, and energy, which are all important factors in promoting economic growth, it is believed that large dams (and related reservoirs and hydropower stations) can contribute to the economic development to a certain extent [38].
3.3. Future Population Growth and Economic Development
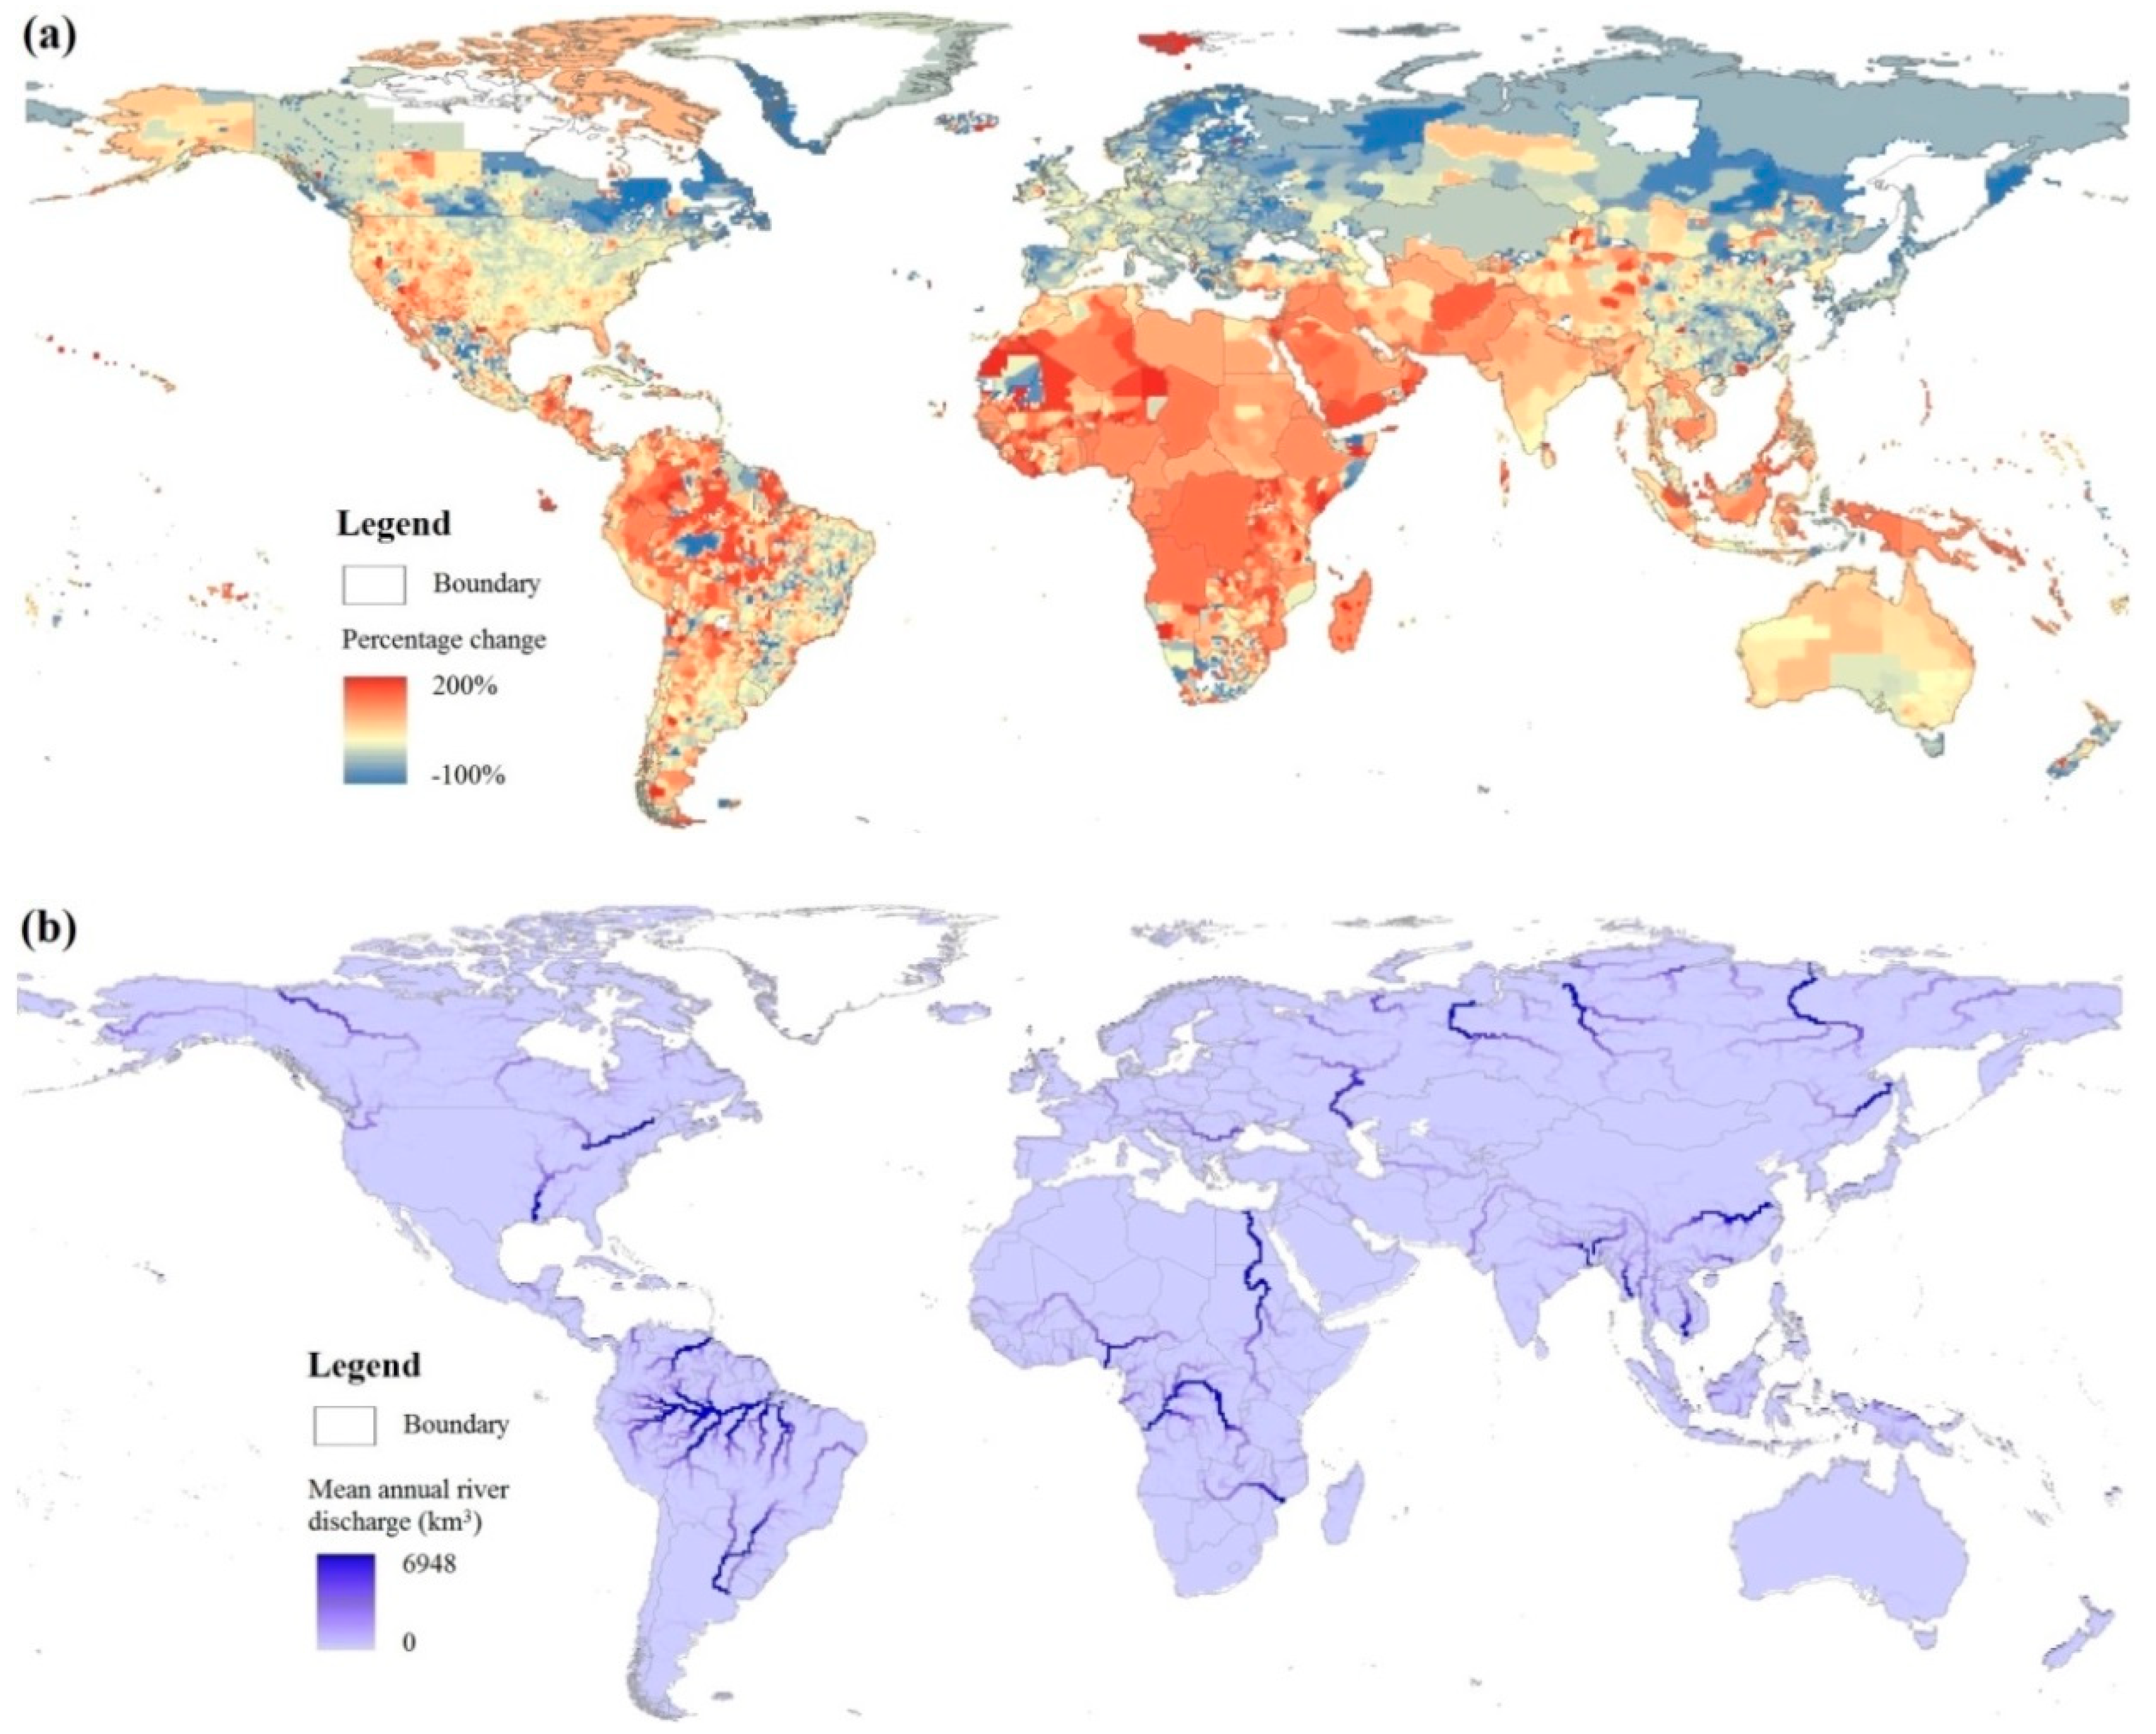
Currently, most countries around the world are facing different types of water scarcity [11], and measures need to be taken to reduce and combat it. More than 1.2 billion people are living in areas of physical water scarcity, lacking enough water for everyone’s demands; about 1.6 billion people are living in areas where human capacity or financial resources are likely to be insufficient to develop adequate water resources [11,18]. What is more, it is foreseeable that this situation will not be improved easily, since the global population is still increasing. Based on the projection method in Section 2.4, the global map of the percentage change of the population density from 2015 to 2050 can be obtained (Figure 5a). It is worth noting that both the linear and quadratic polynomial regressions were attempted to evaluate the trend of the population density in this study and it is found that the sum of squared errors based on the quadratic polynomial regression was one order smaller than that based on the linear regression. Therefore, the quadratic polynomial regression was used to project the future population density for the period 2020–2050. According to the projection result of this study, the mean population density of the world in 2050 will be 90 persons per square kilometer, and the world’s population will reach 9.76 billion, which is very close to the value of the medium-growth projection scenario (9.7 billion) of the UN [1]. It is observed that future population growth will be mainly concentrated in the southwest part of Asia, almost the whole of Africa, western North America, and most of South America. In contrast, the population density in 2050 will be smaller than that in 2015 in eastern Asia, almost the whole of Europe, and the northeast part of North America. Normally, more population means greater demands for water, food, and energy to sustain the socioeconomic development, which may lead to the construction of more large dams [7].
As mentioned before, along with other infrastructures, large dams have enhanced the capability of society in water resource management [7], and by the year 2010, a number of large dams had been built in the selected countries in the previous analyses, i.e., 7968 in United States, 2368 in Japan, 624 in Brazil, 66 in Russia, 4104 in India, 4928 in China, and 923 in South Africa. Considering population growth as the major driving force of large dam construction, more large dams are needed to support future population growth and ever-increasing demand for water, food, and energy. According to the result of our previous study [7], there will be 36,813 large dams all over the world by the year 2050, which means that an additional 4340 dams will be constructed, accounting for 13.36% of the total number of large dams (i.e., 32,473) in the year 2010. Then, based on Equation (2), the GDP data for all the countries worldwide will reach 1.09×10¹⁴ $USD by the year 2050, which is an increase of 67.56% of the total GDP (i.e., 6.49×10¹³ US$) from the year 2010. This result again proves the vital role of large dams in promoting economic development, at least as represented by the GDP data.
3.4. Discussion
As mentioned above, thousands of large dams will be built in the near future. As such, it would be valuable to identify the locations of these future large dams. According to Figure 5a, the regions with warm color, which means more population in the future, should build more large dams to sustain the socioeconomic development, including GDP. However, other factors, such as water availability, financial support, existing exploitation rate of water resources, and technical exploitation potential, should be synthetically considered when deducing the possible locations of future large dams. Examples of such considerations are as follows: (i) Compared with the global distribution of the GDP data of each country in 2010 (see Figure 1), and given that limited financial support is available in most African countries, there will not be many large dams in the future despite urgent demands for water, food, and energy in this continent. (ii) Few available water resources (see Figure 5b, which is obtained from a previous study [40]) and low technical exploitation potential in the southwest part of Asia (e.g., Arabian Peninsula) are the limiting factors for the construction of more large dams in this region. (iii) As the exploitation rate of suitable sites for large dams is relatively high in some developed regions (e.g., over 80% in United States), few large dams can be constructed in these regions [41]. As a result, it is important to distinguish regions with or without abundant water resources; however, how to determine the threshold value based on the global map of the mean annual river discharge still needs further study. Moreover, large dams can only be constructed under suitable conditions of topography. For example, river reaches with larger catchment areas where more water can be impounded and larger slope angles where the topography favors hydropower generation are more suitable for building large dams. Therefore, how to determine the threshold values of the catchment area and slope angle is another problem worth studying.
Based on the relationship between the large dam data and the GDP data, large dam construction is concluded to be helpful for promoting economic development. Within this context, the observation that “water is an essential component of our economies” is noteworthy [21]. Nevertheless, large dams are not the only option available for coping with population growth and water scarcity, at least, for some regions and countries. For example, Kummu et al. noted that three major strategies (i.e., construction of reservoirs, exploitation of groundwater, and irrigation of cropland) were adapted to optimize the use of available water resources [42], and they reported that in Asia and Africa, in particular, the trend of reservoir construction matched that of water shortage well. Wada et al. examined, at the global scale, six approaches to coping with water stress, namely, four soft-path approaches (i.e., improved agricultural water productivity, better irrigation efficiency, increased domestic and industrial water-use intensity, and limiting population growth) and two hard-path approaches (i.e., increased water storage in reservoirs, and desalination of seawater), and concluded that the hard-path approaches are less plausible in tackling water stress than the soft-path approaches. However, it is worth noting that one of the hard-path approaches involving the dam construction is the only option to increase the water storage and enhance the capabilities in water resources management and the related issues of socioeconomic development; the soft-path approaches will be ineffective when there are indeed not enough available water resources [43]. The Organization for Economic Co-operation and Development (OECD) also suggested that water storage became more favorable under conditions of global climate change and increased water stress [44]. The anticipated impacts of climate change on hydrology and water resources [45], such as more frequent floods and droughts, further emphasized the need for additional large dams, both for storing water to mitigate droughts and for regulating flows during floods. However, construction of new dams (and related reservoirs and hydropower stations), and in particular the large ones, may drastically transform the natural environment and cause severe negative effects, including biodiversity depletion, population displacement, ecosystem degradation (e.g., breaking the continuity of rivers), increase in the groundwater level around the reservoirs, water quality in the reservoirs (e.g., eutrophication), changes to flow and the flow regime, and increase in the losses to evaporation from water surfaces [7,37,46,47,48,49]. For example, Biemans et al. indicated that the total storage capacity of large dams equates to about 20% of annual global runoff, and the effect of reservoir management and irrigation extraction decreases mean global discharge by 2.1% or 930 km3 [50]. Moreover, it has been estimated that nearly 40–80 million people have been directly displaced globally in association with large dam construction [22]. Specifically, the Three Gorges Reservoir project in China has involved resettlement of more than 1.2 million local residents, costing more than US $6.3 billion on resettlement programs [38]. Therefore, regarding the social and environmental issues associated with the development of large dams, each infrastructure project of large dam construction should undergo a rigorous and transparent cost-benefit analysis [7,44,51].
4. Conclusions
This study, based on the analyses of the large dam data and the GDP data, concludes that large dam construction has essentially played a role in promoting economic development. The results show that the impacts of large dams on economic development represented by the GDP data were more significant in countries with higher levels of economic development. This study also projects the future population density for 2020–2050 and shows the global map of the percentage change of the population density from 2015 to 2050. In the face of continued population growth, construction of additional large dams would have to be considered as one of the best available options to sustain future socioeconomic development, and it is projected that the GDP data for all the countries worldwide will increase by 67.56% from 2010 to 2050. Taking into account other factors, such as water availability, financial support, existing exploitation rate of water resources, and technical exploitation potential, this study preliminarily deduces that future large dams would be most likely located in regions that have abundant available water resources and suitable conditions of topography to build large dams.
Overall, large dam construction is regarded as an effective way to deal with the economic development problems in the foreseeable future. United Nations Development Programme (UNDP) noted that “the contribution of large-scale infrastructure (e.g., large dams) to human development should not be overlooked” [52]. Therefore, over the coming decades, the need for construction of additional large dams in order to support and sustain economic development is abundantly clear. Rather, the considerable question is how to find better ways to plan, build, and operate dams (and related reservoirs and hydropower stations) so that their negative impacts on environment and society can be reduced [7]. This is not only specific to large dams, but also to most water-related issues, including the management of large river basins and inter-basin water planning [53,54,55].
Author Contributions
Conceptualization, H.S. and J.C.; methodology, H.S.; validation, H.S. and S.L.; formal analysis, H.S. and S.L.; supervision, B.S.; writing—original draft preparation, H.S.; writing—review and editing, H.S., J.C., S.L., and B.S.
Funding
This research was funded by Guangdong Provincial Key Laboratory of Soil and Groundwater Pollution Control (2017B030301012) and Natural Science Foundation of Qinghai Province (2017-ZJ-911).
Acknowledgments
This research was also supported by State Environmental Protection Key Laboratory of Integrated Surface Water-Groundwater Pollution Control.
Conflicts of Interest
The authors declare no conflict of interest.
References
- United Nations (UN). World Population Prospects, the 2015 Revision. 2015. Available online: https://esa.un.org/unpd/wpp/Download/Standard/Population/ (accessed on 1 March 2016).
- Rosegrant, M.W.; Cai, X.; Cline, S.A. World Water and Food to 2025: Dealing with Scarcity; The International Food Policy Research Institute: Washington, DC, USA, 2002. [Google Scholar]
- United States Department of Agriculture (USDA). World Grain Consumption and Stocks, 1960–2009. 2009. Available online: http://www.fas.usda.gov/psdonline (accessed on 1 June 2015).
- REN21. Renewables 2011 Global Status Report; REN21: Paris, France, 2011. [Google Scholar]
- International Energy Agency (IEA). Key World Energy Statistics 2012; IEA: Paris, France, 2012. [Google Scholar]
- World Resource Simulation Center (WRSC). Global Water Consumption 1900–2025. 2012. Available online: http://www.wrsc.org/attach_image/global-water-consumption-1900-2025 (accessed on 1 June 2015).
- Chen, J.; Shi, H.; Sivakumar, B.; Peart, M.R. Population, Water, Food, Energy and Dams. Renew. Sustain. Energy Rev. 2016, 56, 18–28. [Google Scholar] [CrossRef]
- United Nations Educational, Scientific and Cultural Organization (UNESCO). World Water Resources: A New Appraisal and Assessment for the 21st Century; UNESCO: Paris, France, 1998. [Google Scholar]
- United Nations Development Programme (UNDP). Human Development Report 2010—The Real Wealth of Nations: Pathways to Human Development; UNDP: New York, NY, USA, 2010. [Google Scholar]
- International Water Management Institute (IWMI). International Water Management Institute Analysis Done for Comprehensive Assessment of Water Management in Agriculture Using the Watersim Model, Chapter 2. 2007. Available online: http://www.grida.no/graphicslib/detail/areas-of-physical-and-economic-water-scarcity_1570 (accessed on 1 May 2015).
- IWMI. Water for Food, Water for Life: A Comprehensive Assessment of Water Management in Agriculture; Earthscan: London, UK; IWMI: Colombo, Sri Lanka, 2007. [Google Scholar]
- Wu, Y.; Chen, J. An Operation-Based Scheme for a Multiyear and Multipurpose Reservoir to Enhance Macroscale Hydrologic Models. J. Hydrometeorol. 2012, 13, 270–283. [Google Scholar] [CrossRef]
- Wu, Y.; Chen, J. Estimating irrigation water demand using an improved method and optimizing reservoir operation for water supply and hydropower generation: A case study of the Xinfengjiang reservoir in southern China. Agric. Water Manag. 2013, 116, 110–121. [Google Scholar] [CrossRef]
- Spänhoff, B. Current status and future prospects of hydropower in Saxony (Germany) compared to trends in Germany, the European Union and the World. Renew. Sustain. Energy Rev. 2014, 30, 518–525. [Google Scholar] [CrossRef]
- Shi, H.; Wang, G. Impacts of climate change and hydraulic structures on runoff and sediment discharge in the middle Yellow River. Hydrol. Process. 2015, 29, 3236–3246. [Google Scholar] [CrossRef] [Green Version]
- Shi, H.; Li, T.; Wang, K.; Zhang, A.; Wang, G.; Fu, X. Physically based simulation of the streamflow decrease caused by sediment-trapping dams in the middle Yellow River. Hydrol. Process. 2016, 30, 783–794. [Google Scholar] [CrossRef]
- Shi, H.; Chen, J.; Wang, K.; Niu, J. A new method and a new index for identifying socioeconomic drought events under climate change: A case study of the East River basin in China. Sci. Total Environ. 2018, 616–617, 363–375. [Google Scholar] [CrossRef]
- World Water Assessment Programme (WWAP). The United Nations World Water Development Report 4: Managing Water under Uncertainty and Risk; WWAP: Perugia, Italy, 2012. [Google Scholar]
- Poff, N.L.; Hart, D.D. How dams vary and why it matters for the emerging science of dam removal. BioScience 2002, 52, 659–738. [Google Scholar] [CrossRef]
- World Bank. Directions in Hydropower. 2009. Available online: http://documents.worldbank.org/curated/en/2009/03/12331 040/directions-hydropower (accessed on 1 June 2015).
- WWAP. The United Nations World Water Development Report 2016: Water and Jobs; WWAP: Perugia, Italy, 2016. [Google Scholar]
- World Commission on Dams (WCD). Dams and Development: A New Framework for Decision-Making; WCD: Frankfurt, Germany, 2000. [Google Scholar]
- Nilsson, C.; Reidy, C.A.; Dynesius, M.; Revenga, C. Fragmentation and flow regulation of the world’s large river systems. Science 2005, 308, 405–408. [Google Scholar] [CrossRef] [PubMed]
- United Nations Population Fund (UNFPA). Population Dynamics in the Least Developed Countries: Challenges and Opportunities for Development and Poverty Reduction; UNFPA: New York, NY, USA, 2011. [Google Scholar]
- BBVA Research. BBVA EAGLEs: Emerging and Growth-Leading Economies; BBVA Research: Bilbao, Spain, 2012. [Google Scholar]
- SouthAfrica.info. New Era as South Africa Joins BRICS; Brand South Africa: Johannesburg, South Africa, 2011. [Google Scholar]
- International Commission on Large Dams (ICOLD). The World Register of Dams. 2013. Available online: http://www.icold-cigb.net (accessed on 1 May 2015).
- Lehner, B.; Liermann, C.R.; Revenga, C.; Vorosmarty, C.; Fekete, B.; Crouzet, P.; Döll, P.; Endejan, M.; Frenken, K.; Magome, J.; et al. Global Reservoir and Dam Database, Version 1 (GRanDv1): Reservoirs, Revision 01. 2011. Available online: http://sedac.ciesin.columbia.edu/ data/set/grand-v1-reservoirs-rev01 (accessed on 1 May 2015).
- World Bank. World Development Indicators. 2016. Available online: http://data.worldbank.org/data-catalog/world-development-indicators (accessed on 1 July 2017).
- Center for International Earth Science Information Network (CIESIN), Centro Internacional de Agricultura Tropical (CIAT). Gridded Population of the World, Version 3 (GPWv3); NASA Socioeconomic Data and Applications Center (SEDAC): Palisades, NY, USA, 2005. [CrossRef]
- Caspary, G. Assessing, mitigating and monitoring environmental risks of large dams in developing countries. Impact Assess. Proj. Apprais. 2009, 27, 19–32. [Google Scholar] [CrossRef]
- Grant, G. Dam removal: Panacea or Pandora for rivers? Hydrol. Process. 2001, 15, 1531–1532. [Google Scholar] [CrossRef]
- Lejon, A.G.; Malm Renöfält, B.; Nilsson, C. Conflicts associated with dam removal in Sweden. Ecol. Soc. 2009, 14, 4. [Google Scholar] [CrossRef]
- Fox, C.A.; Magilligan, F.J.; Sneddon, C.S. “You kill the dam, you are killing a part of me”: Dam removal and the environmental politics of river restoration. Geoforum 2016, 70, 93–104. [Google Scholar] [CrossRef]
- Noda, K.; Hamada, J.; Kimura, M.; Oki, K. Debates over dam removal in Japan. Water Environ. J. 2018, 32, 446–452. [Google Scholar] [CrossRef]
- Ding, L.; Chen, L.; Ding, C.; Tao, J. Global Trends in Dam Removal and Related Research: A Systematic Review Based on Associated Datasets and Bibliometric Analysis. Chin. Geogr. Sci. 2019, 29, 1–12. [Google Scholar] [CrossRef]
- Beck, M.W.; Claassen, A.H.; Hundt, P.J. Environmental and livelihood impacts of dams: Common lessons across development gradients that challenge sustainability. Int. J. River Basin Manag. 2012, 10, 73–92. [Google Scholar] [CrossRef]
- Miao, C.; Borthwick, A.; Liu, H.; Liu, J. China’s Policy on Dams at the Crossroads: Removal or Further Construction? Water 2015, 7, 2349–2357. [Google Scholar] [CrossRef]
- Feng, G. The key to bring the Yellow River under control is to speed up construction of check-dams in the Sandy and Grit Areas. Sci. Technol. Rev. 2000, 145, 53–57. (In Chinese) [Google Scholar]
- Li, J.; Li, T.; Liu, S.; Shi, H. An efficient method for mapping high-resolution global river discharge based on the algorithms of drainage network extraction. Water 2018, 10, 533. [Google Scholar] [CrossRef]
- The International Journal on Hydropower and Dams. World Atlas & Industry Guide. 2010. Available online: https://www.hydropower-dams.com/product/world-atlas-industry-guide/ (accessed on 1 July 2014).
- Kummu, M.; Ward, P.J.; de Moel, H.; Varis, O. Is physical water scarcity a new phenomenon? Global assessment of water shortage over the last two millennia. Environ. Res. Lett. 2010, 5, 034006. [Google Scholar] [CrossRef] [Green Version]
- Wada, Y.; Gleeson, T.; Esnault, L. Wedge approach to water stress. Nat. Geosci. 2014, 7, 615–617. [Google Scholar] [CrossRef]
- Organization for Economic Co-operation and Development (OECD). Mitigating Droughts and Floods in Agriculture: Policy Lessons and Approaches, OECD Studies on Water; OECD: Paris, France, 2016. [Google Scholar]
- Sivakumar, B. Water crisis: From conflict to cooperation—An overview. Hydrol. Sci. J. 2011, 56, 531–552. [Google Scholar] [CrossRef]
- Huang, Y.; Lin, W.; Li, S.; Ning, Y. Social Impacts of Dam-Induced Displacement and Resettlement: A Comparative Case Study in China. Sustainability 2018, 10, 4018. [Google Scholar] [CrossRef]
- Tilt, B.; Gerkey, D. Dams and population displacement on China’s Upper Mekong River: Implications for social capital and social-ecological resilience. Glob. Environ. Chang. Hum. Policy Dimens. 2016, 36, 153–162. [Google Scholar] [CrossRef]
- Kumar, D.; Katoch, S.S. Sustainability indicators for run of the river (RoR) hydropower projects in hydro rich regions of India. Renew. Sustain. Energy Rev. 2014, 35, 101–108. [Google Scholar] [CrossRef]
- Biemans, H.; Haddeland, I.; Kabat, P.; Ludwig, F.; Hutjes, R.W.A.; Heinke, J.; von Bloh, W.; Gerten, D. Impact of reservoirs on river discharge and irrigation water supply during the 20th century. Water Resour. Res. 2011, 47, W03509. [Google Scholar] [CrossRef]
- Urban, F.; Siciliano, G.; Nordensvard, J. China’s dam-builders: Their role in transboundary river management in South-East Asia. Int. J. Water Resour. Dev. 2018, 34, 747–770. [Google Scholar] [CrossRef]
- Independent Evaluation Group (IEG). World Bank Lending for Large Dams: A Preliminary Review of Impacts; IEG: Washington, DC, USA, 1996. [Google Scholar]
- UNDP. Human Development Report 2006—Beyond Scarcity: Power, Poverty and the Global Water Crisis; UNDP: New York, NY, USA, 2006. [Google Scholar]
- Zhuang, W. Eco-environmental impact of inter-basin water transfer projects: A review. Environ. Sci. Pollut. Res. 2016, 23, 12867–12879. [Google Scholar] [CrossRef] [PubMed]
- Sun, J.; Dang, Z.; Zheng, S. Development of payment standards for ecosystem services in the largest interbasin water transfer projects in the world. Agric. Water Manag. 2017, 182, 158–164. [Google Scholar] [CrossRef]
- Kefayati, M. Empirical evaluation of river basin sustainability affected by inter-basin water transfer using composite indicators. Water Environ. J. 2018, 32, 104–111. [Google Scholar] [CrossRef]
Figure 1.
Global distribution of the 32,473 large dams (related reservoirs and hydropower stations) constructed from 1900 to 2010 and the GDP data of each country in 2010.
Figure 1.
Global distribution of the 32,473 large dams (related reservoirs and hydropower stations) constructed from 1900 to 2010 and the GDP data of each country in 2010.

Figure 2.
The linear regressions between the number of large dams and the GDP data for (a) all the countries worldwide, (b) developed countries, (c) developing countries, and (d) the LDCs. Note: The axes are in logarithmic scale except for sub-graph (d).
Figure 2.
The linear regressions between the number of large dams and the GDP data for (a) all the countries worldwide, (b) developed countries, (c) developing countries, and (d) the LDCs. Note: The axes are in logarithmic scale except for sub-graph (d).

Figure 3.
The logarithmic regressions between the GDP data and large dam development (top to bottom: the number of large dams, reservoir capacity, and installed capacity) in the two selected developed countries during 1960–2010: (a) United States and (b) Japan.
Figure 3.
The logarithmic regressions between the GDP data and large dam development (top to bottom: the number of large dams, reservoir capacity, and installed capacity) in the two selected developed countries during 1960–2010: (a) United States and (b) Japan.

Figure 4.
The comparisons of the GDP data against: (a) the number of large dams and (b) reservoir capacity in China for each year from 1960 to 2010.
Figure 4.
The comparisons of the GDP data against: (a) the number of large dams and (b) reservoir capacity in China for each year from 1960 to 2010.

Figure 5.
The global map of: (a) the percentage change of the population density from 2015 to 2050, and (b) the mean annual river discharge.
Figure 5.
The global map of: (a) the percentage change of the population density from 2015 to 2050, and (b) the mean annual river discharge.


Table 1.
The three groups of countries in the world by their levels of socioeconomic development.
| Group | Country |
|---|---|
| Developed Countries: 44 in total | Australia, Austria, Andorra, Bahrain, Barbados, Belgium, Brunei Darussalam, Canada, Czech Republic, Cyprus, Denmark, Estonia, Finland, France, Germany, Greece, Hong Kong (China, SAR), Hungary, Iceland, Ireland, Israel, Italy, Japan, Liechtenstein, Luxembourg, Malta, Monaco, Netherlands, New Zealand, Norway, Poland, Portugal, Qatar, Republic of Korea, San Marino, Singapore, Slovakia, Slovenia, Spain, Sweden, Switzerland, United Arab Emirates, United Kingdom, United States |
| Least Developed Countries (LDCs): 49 in total | Afghanistan, Angola, Bangladesh, Benin, Bhutan, Burkina Faso, Burundi, Cambodia, Central African Republic, Chad, Comoros, Democratic Republic of the Congo, Djibouti, Equatorial Guinea, Eritrea, Ethiopia, Gambia, Guinea, Guinea-Bissau, Haiti, Kiribati, Lao People’s Democratic Republic, Lesotho, Liberia, Madagascar, Malawi, Maldives, Mali, Mauritania, Mozambique, Myanmar, Nepal, Niger, Rwanda, Samoa, São Tomé and Príncipe, Senegal, Sierra Leone, Solomon Islands, Somalia, Sudan, Timor-Leste, Togo, Tuvalu, Uganda, United Republic of Tanzania, Vanuatu, Yemen, Zambia |
| Developing countries: 150 in total | All the other countries, including BRICS |
Table 2.
The number of large dams and the GDP data for all the countries worldwide during 1960–2010 (every ten years).
Table 2.
The number of large dams and the GDP data for all the countries worldwide during 1960–2010 (every ten years).
| Year | 1960 | 1970 | 1980 | 1990 | 2000 | 2010 |
|---|---|---|---|---|---|---|
| Number of large dams | 9056 | 14,968 | 22,361 | 27,559 | 30,773 | 32,473 |
| GDP | 1.16 × 10¹² | 2.77 × 10¹² | 1.07 × 10¹³ | 2.25 × 10¹³ | 3.28 × 10¹³ | 6.49 × 10¹³ |
Table 3.
R2 values of the logarithmic regressions for evaluating the relationships between the GDP data and large dam development in Brazil, India, China, and South Africa during 1960–2010.
Table 3.
R2 values of the logarithmic regressions for evaluating the relationships between the GDP data and large dam development in Brazil, India, China, and South Africa during 1960–2010.
| Country | Brazil | India | China | South Africa |
|---|---|---|---|---|
| GDP vs. Number of large dams | 0.99 | 0.92 | 0.82 | 0.93 |
| GDP vs. Reservoir capacity | 0.95 | 0.91 | 0.97 | 0.91 |
| GDP vs. Installed capacity | 0.97 | 0.94 | 0.92 | 0.84 |
© 2019 by the authors. Licensee MDPI, Basel, Switzerland. This article is an open access article distributed under the terms and conditions of the Creative Commons Attribution (CC BY) license (http://creativecommons.org/licenses/by/4.0/).
Share and Cite
MDPI and ACS Style
Shi, H.; Chen, J.; Liu, S.; Sivakumar, B. The Role of Large Dams in Promoting Economic Development under the Pressure of Population Growth. Sustainability 2019, 11, 2965. https://doi.org/10.3390/su11102965
AMA Style
Shi H, Chen J, Liu S, Sivakumar B. The Role of Large Dams in Promoting Economic Development under the Pressure of Population Growth. Sustainability. 2019; 11(10):2965. https://doi.org/10.3390/su11102965
Chicago/Turabian StyleShi, Haiyun, Ji Chen, Suning Liu, and Bellie Sivakumar. 2019. "The Role of Large Dams in Promoting Economic Development under the Pressure of Population Growth" Sustainability 11, no. 10: 2965. https://doi.org/10.3390/su11102965
Note that from the first issue of 2016, this journal uses article numbers instead of page numbers. See further details here.