Groundwater Recharge Potential for Sustainable Water Use in Urban Areas of the Jequitiba River Basin, Brazil

 and
and 
Abstract
:1. Introduction
2. Materials and Methods
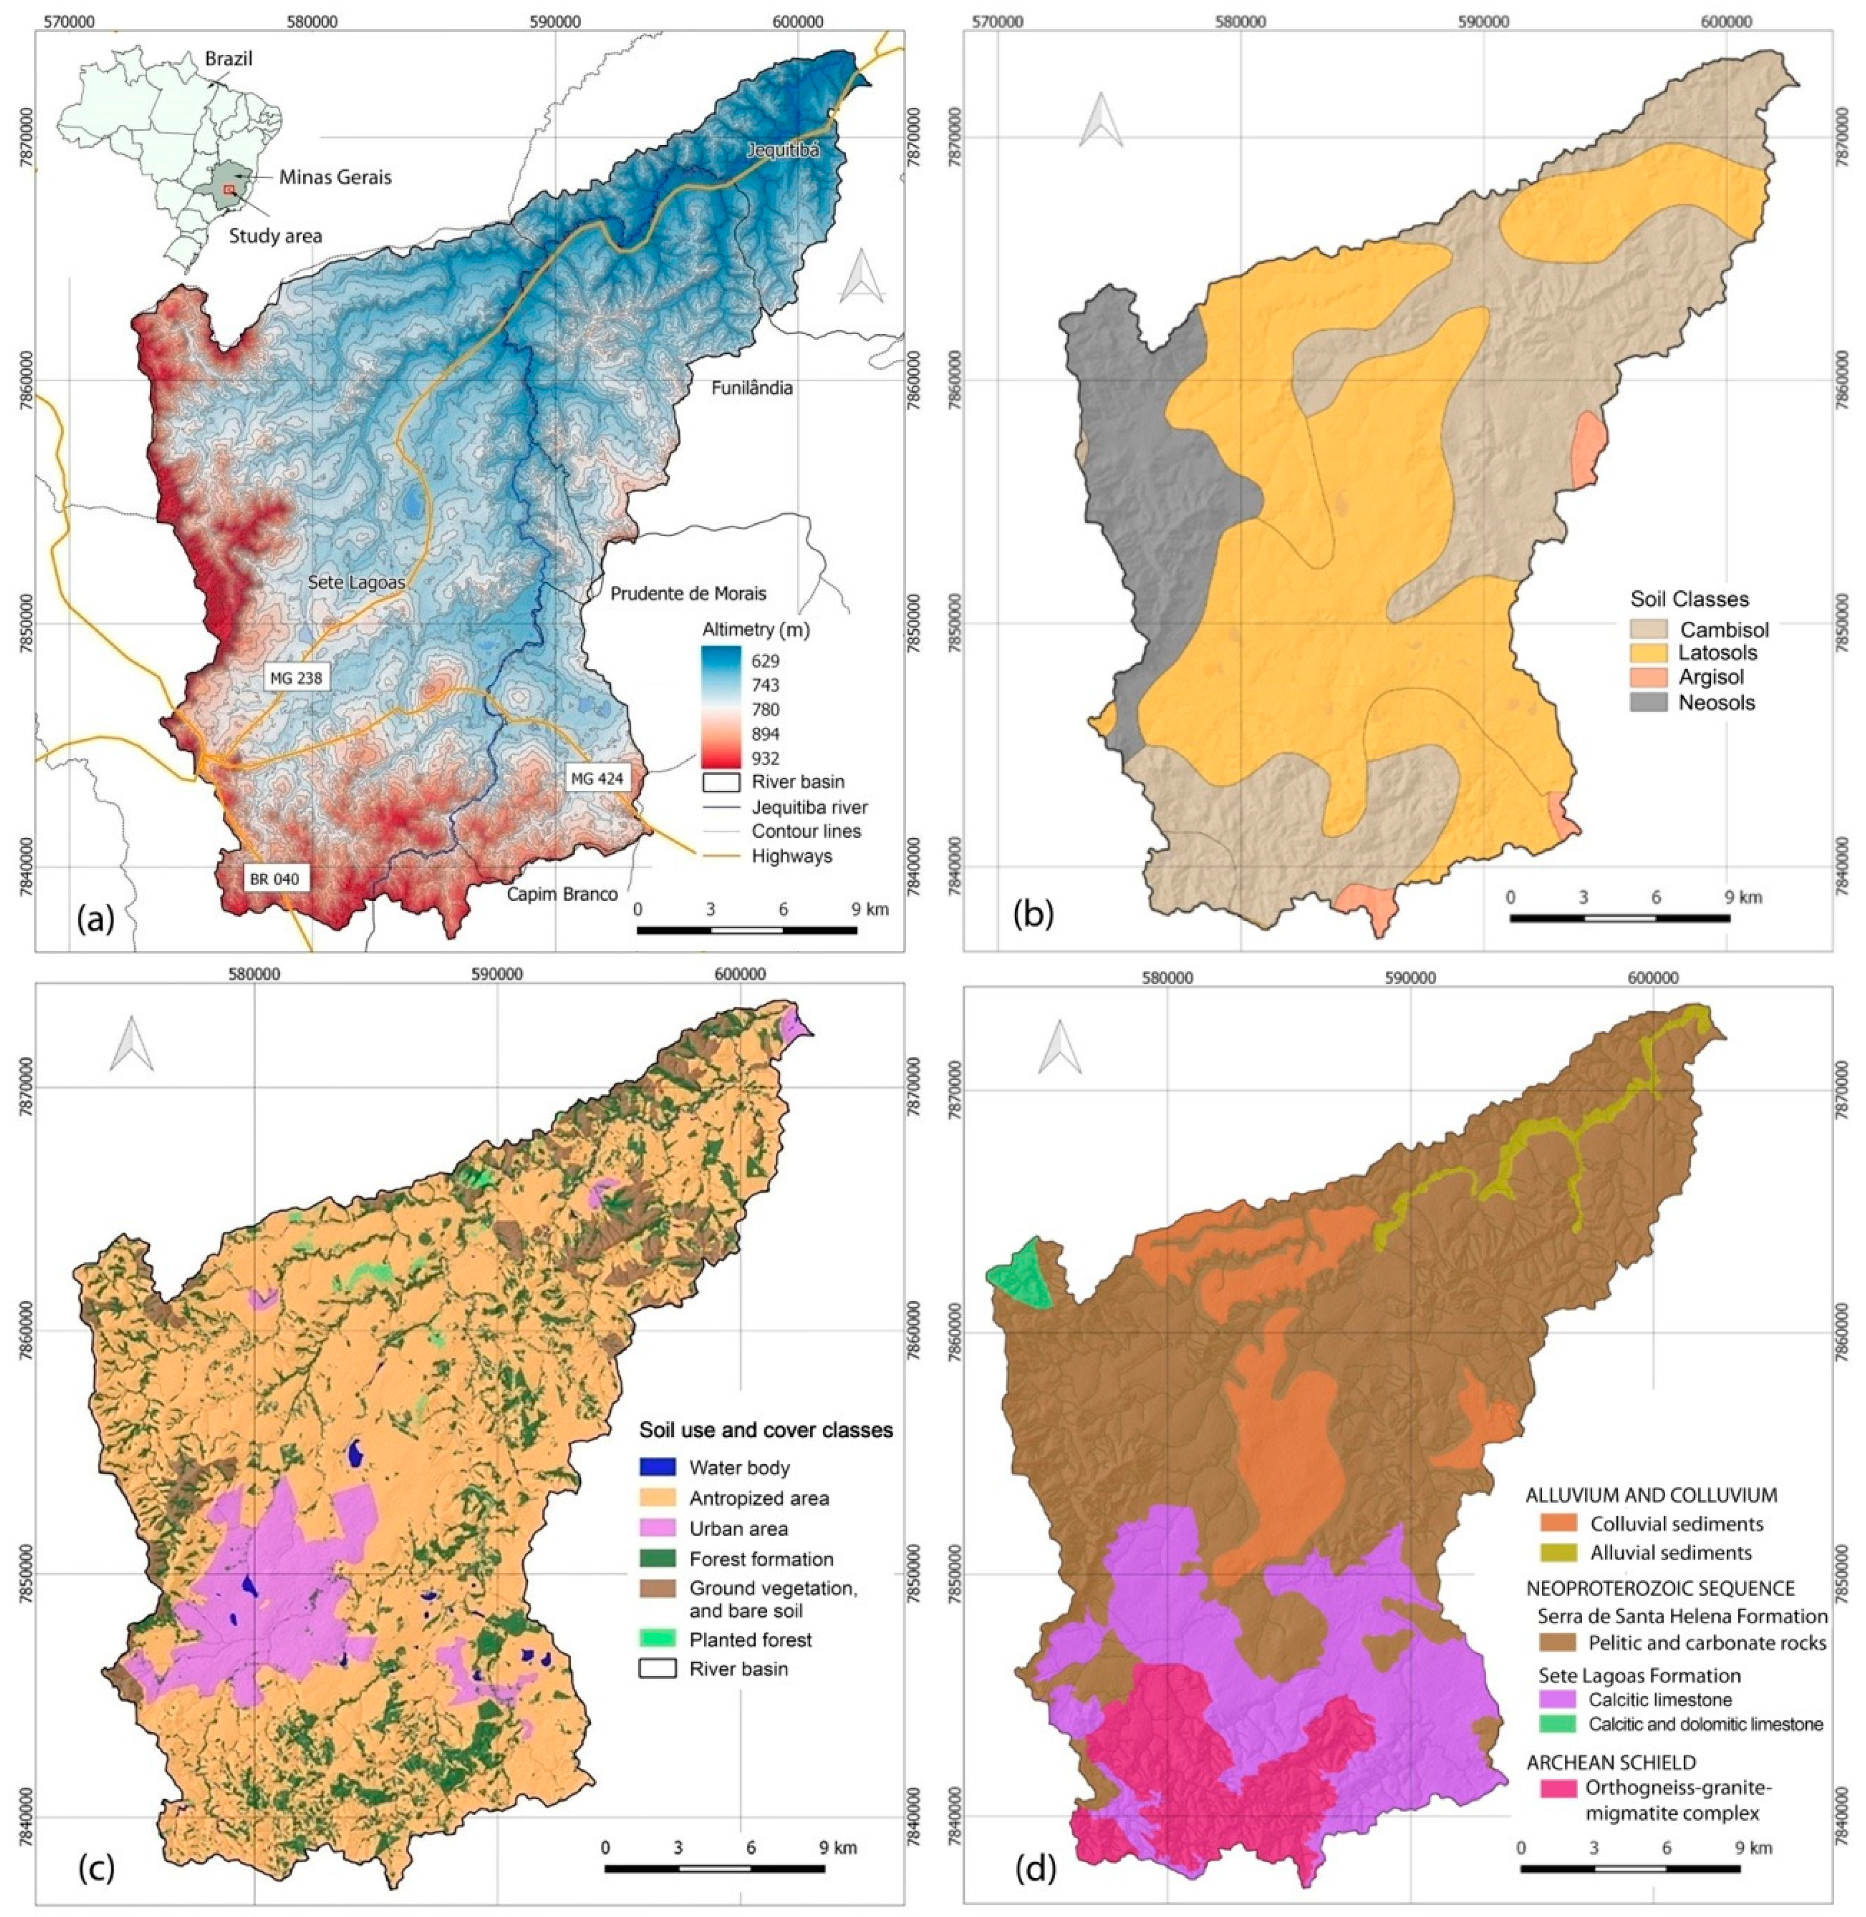
2.1. Study Area
2.2. Materials and Software
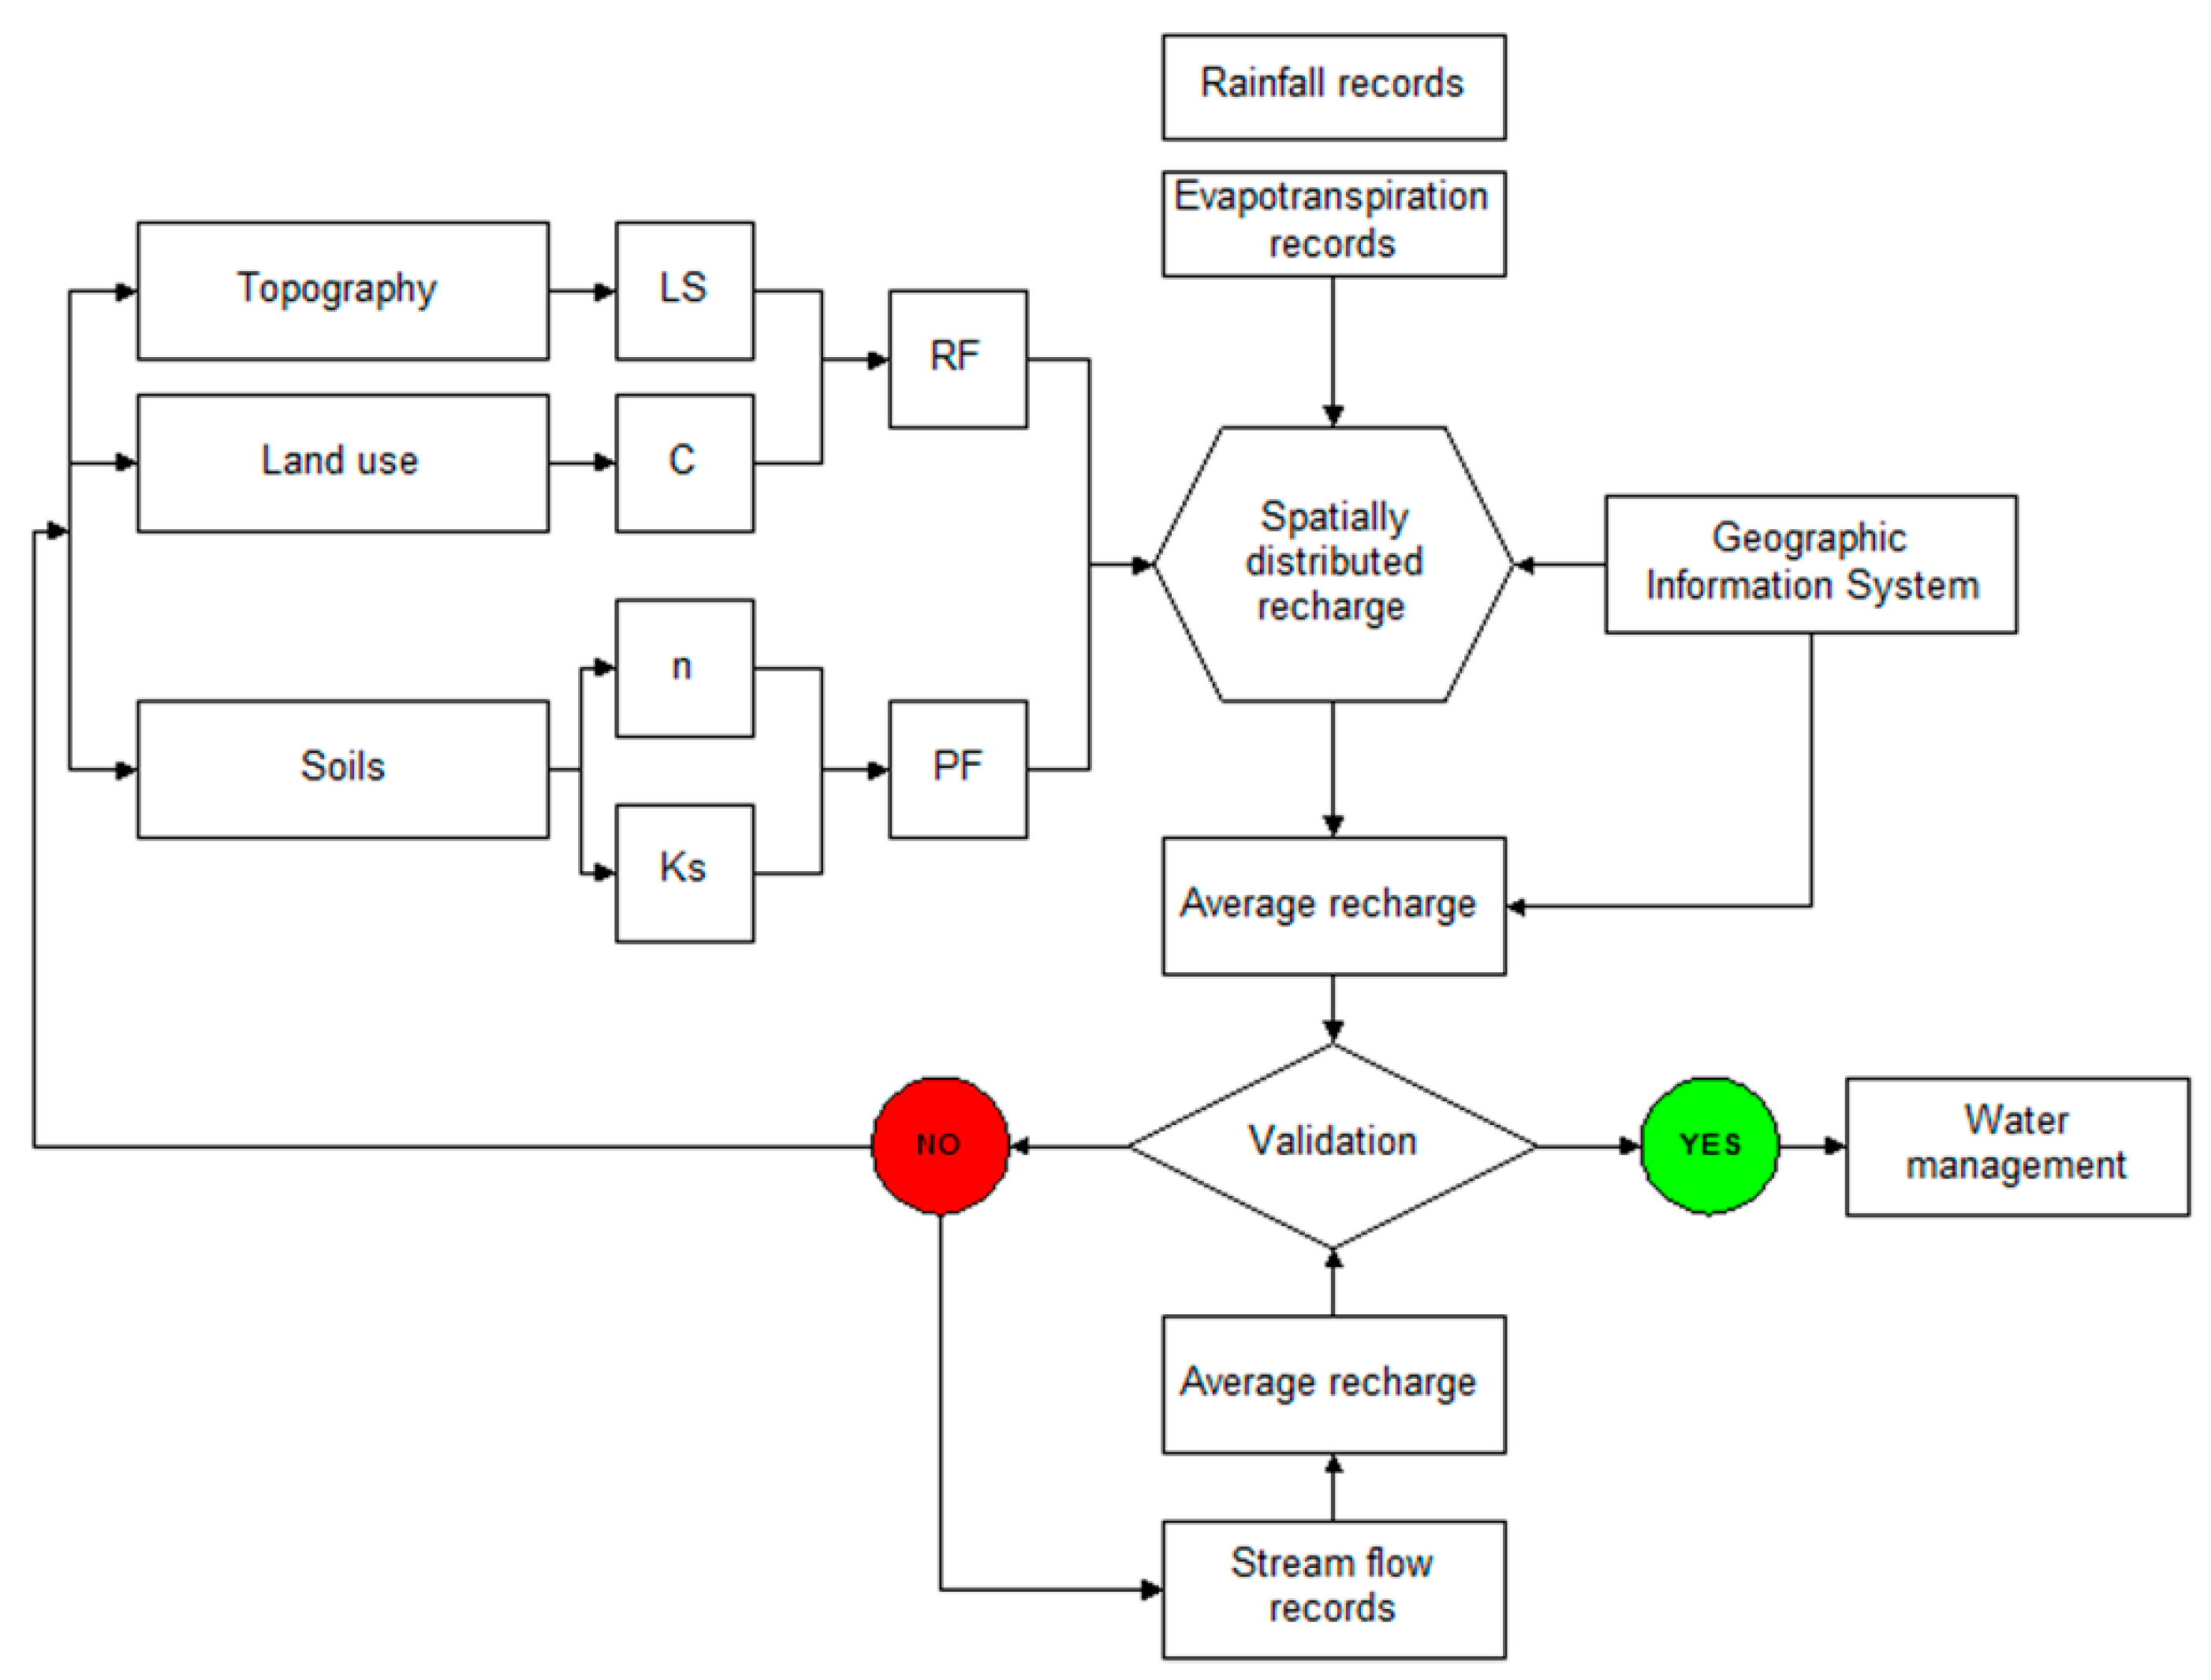
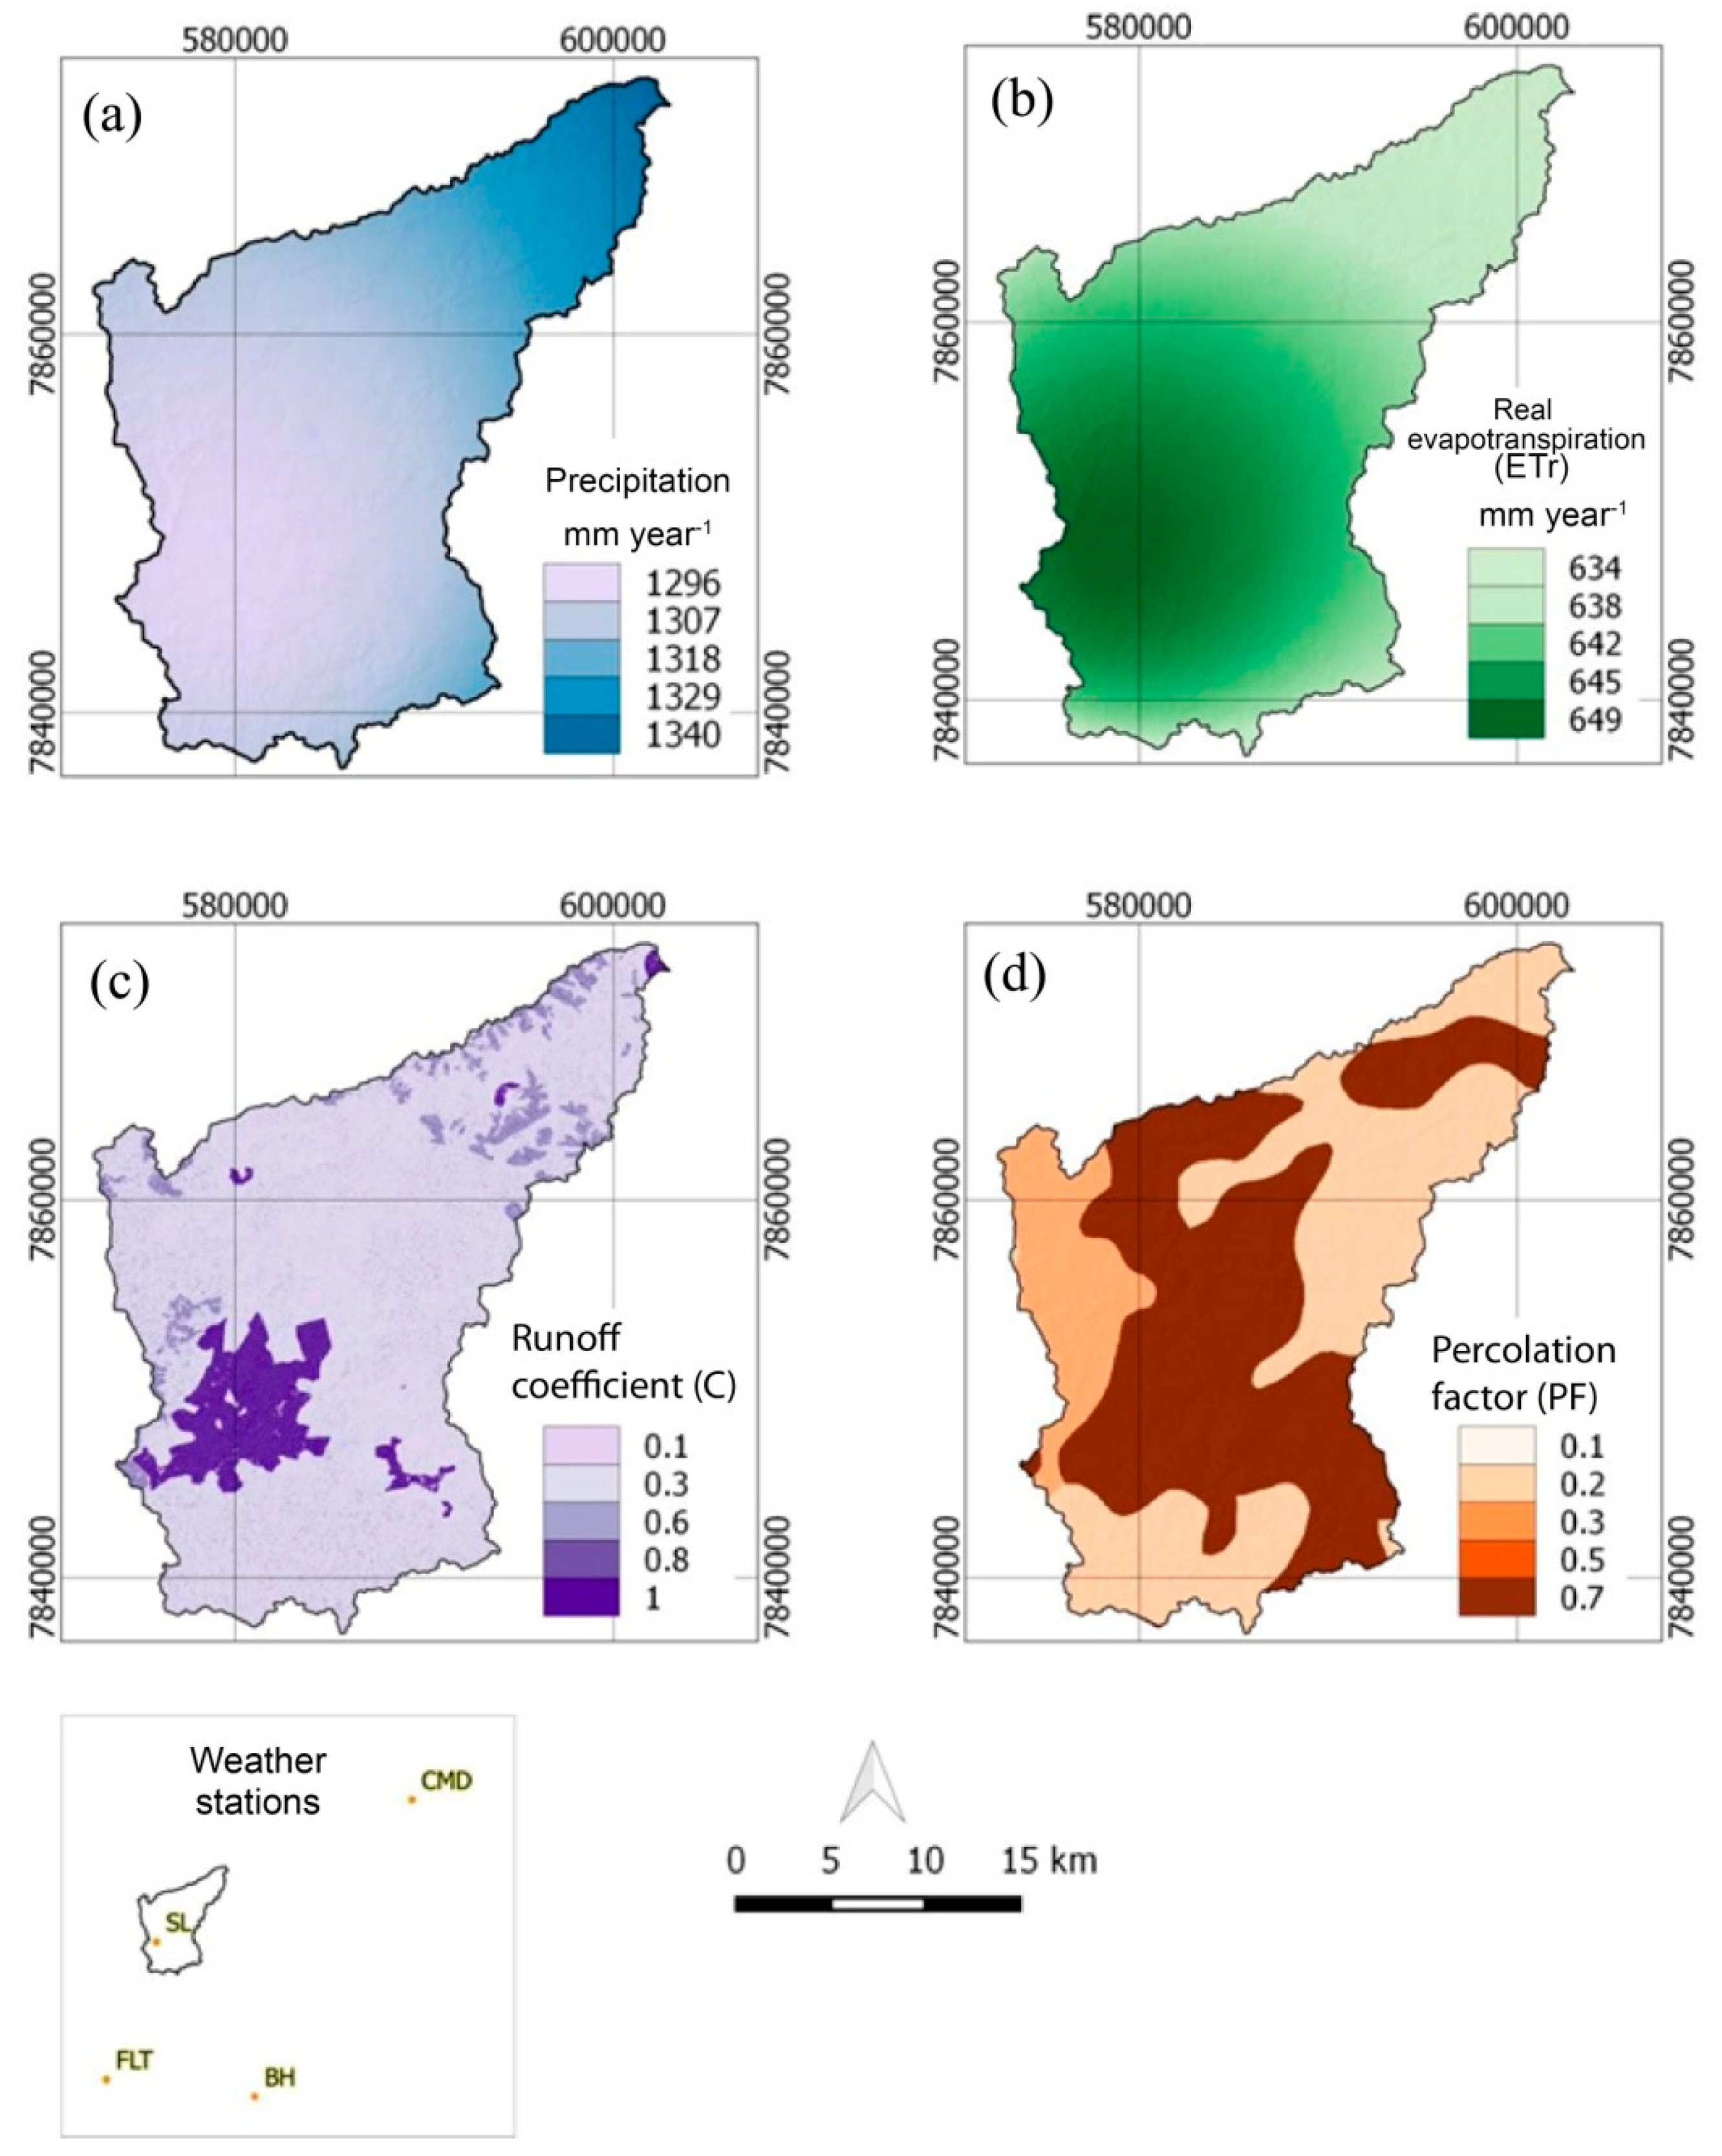
2.3. Methods
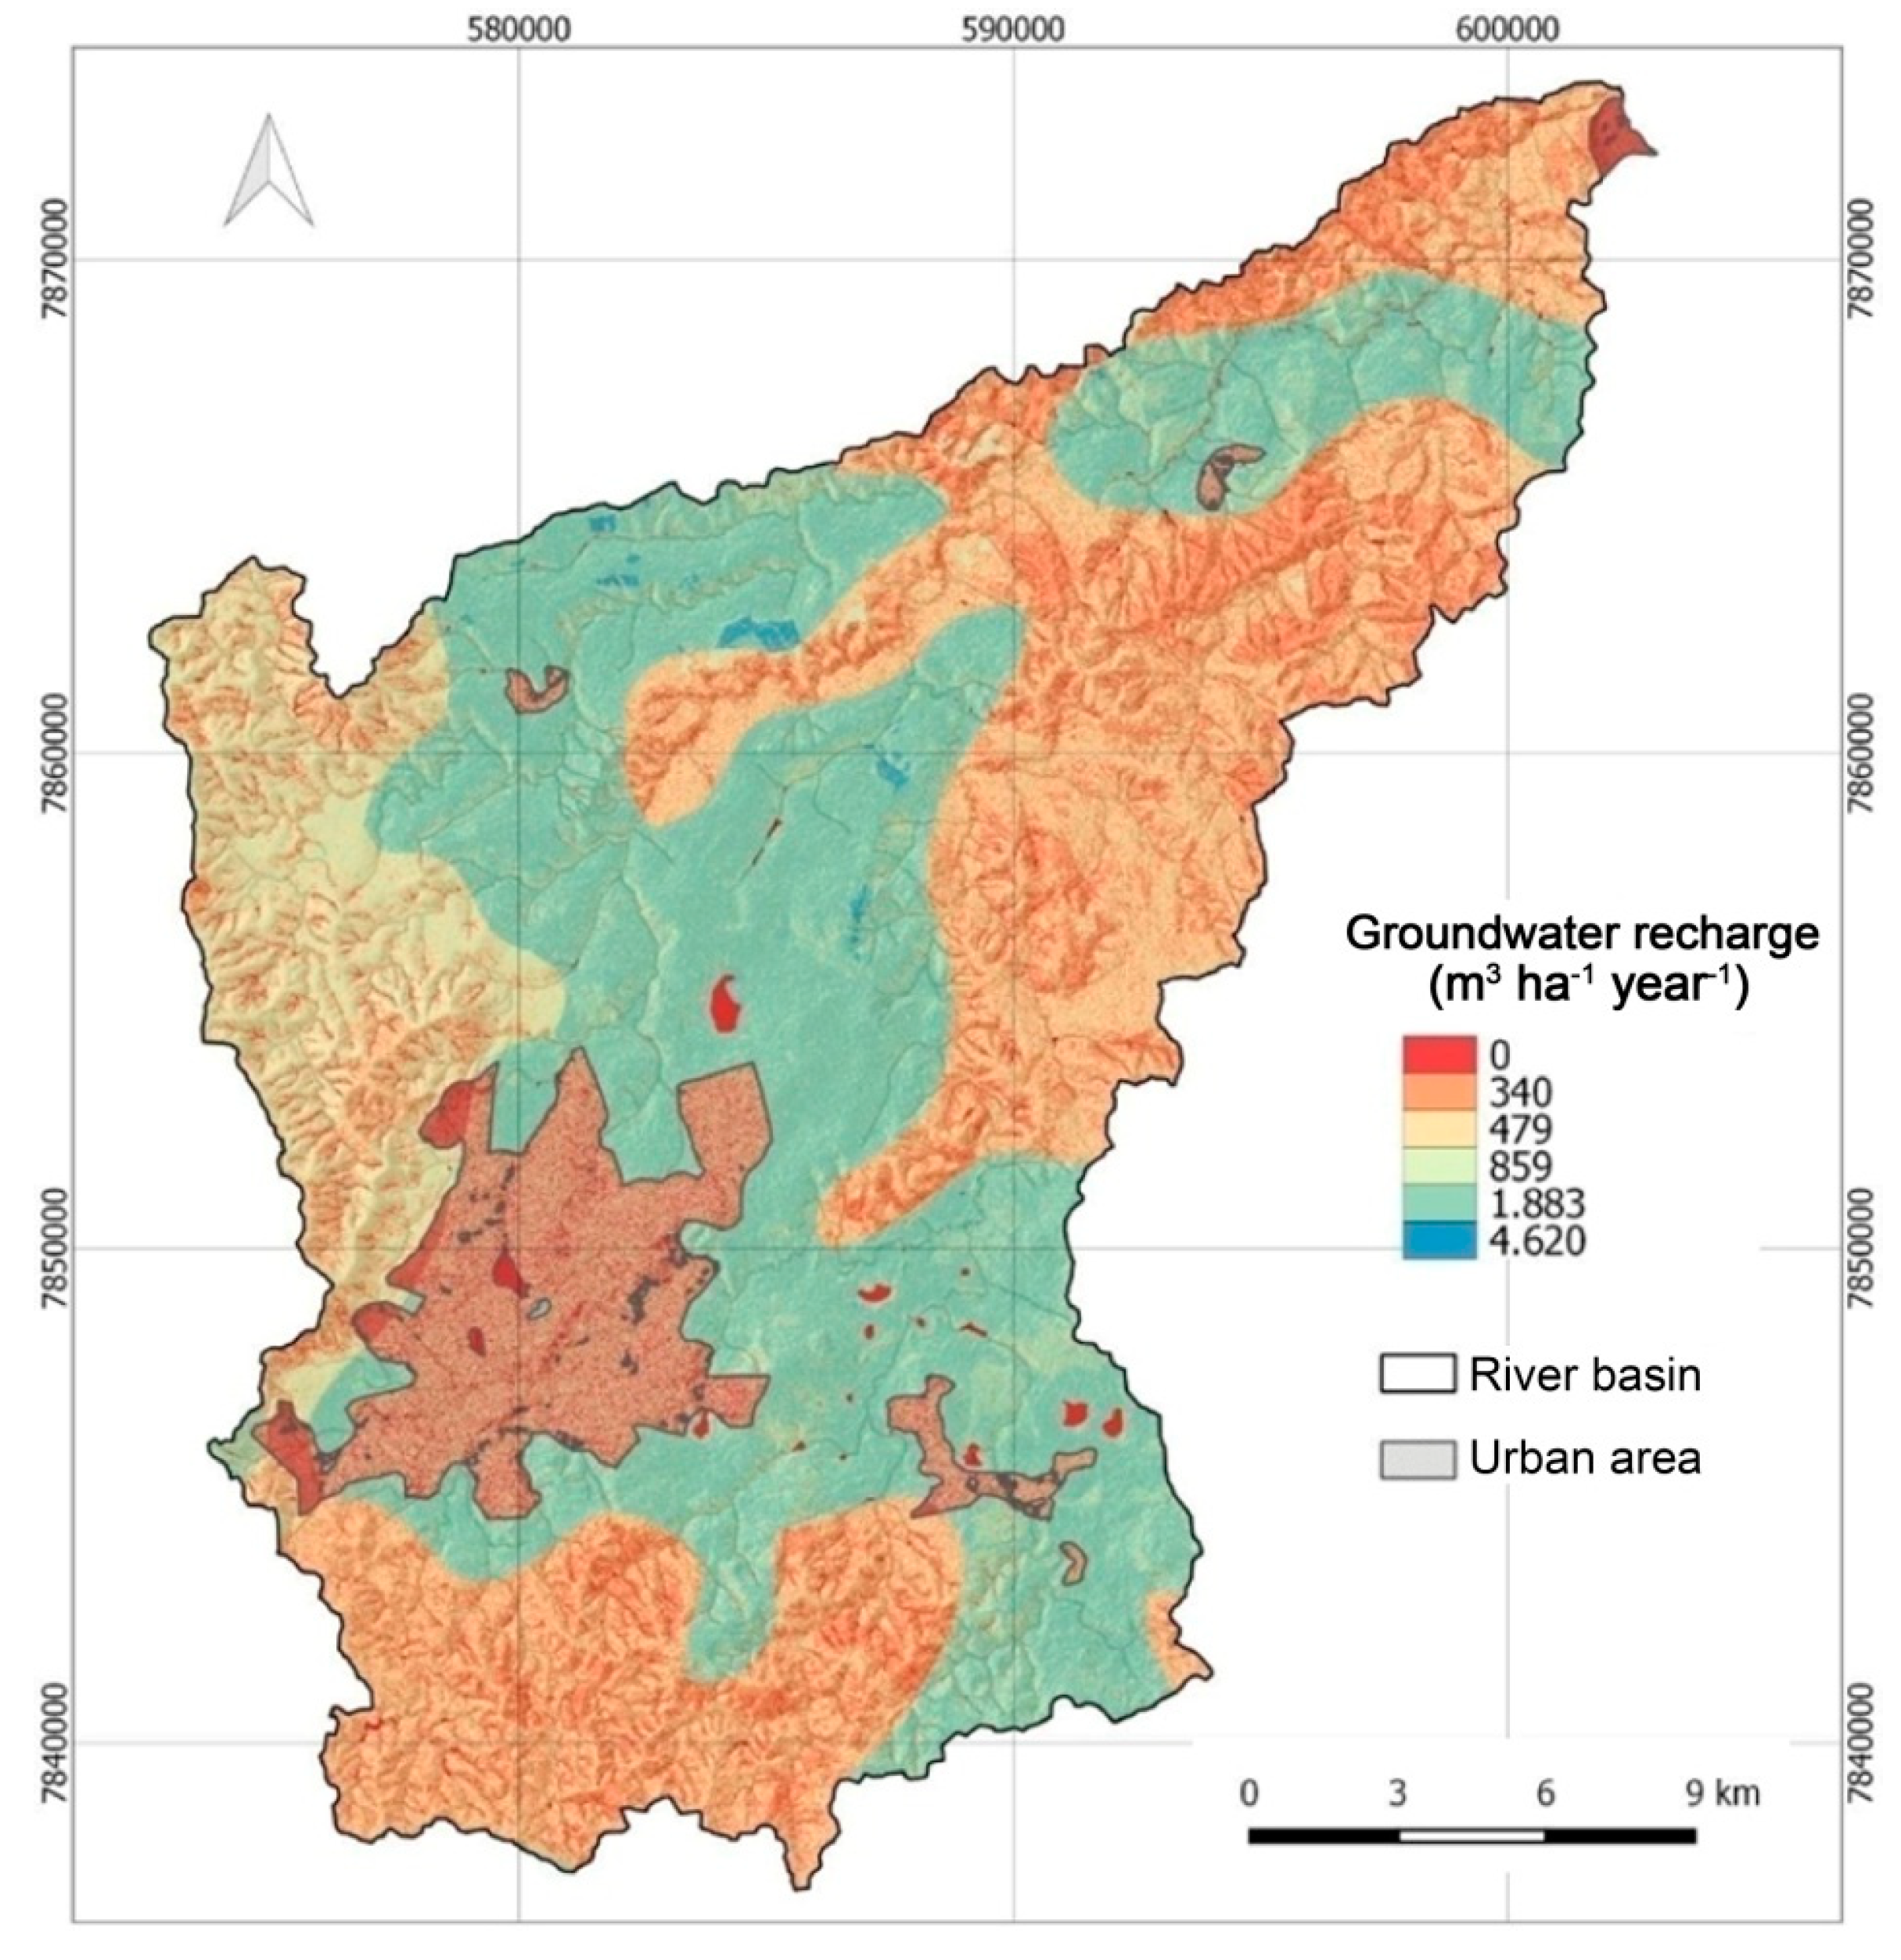
3. Results
4. Discussion
4.1. Appreciation of Model Results
4.2. Controls of Groundwater Recharge and the Need to Delineate Zones of Groundwater Recharge Potential
4.3. Management Considerations
5. Conclusions
Author Contributions
Funding
Acknowledgments
Conflicts of Interest
References
- Oki, T.; Kanae, S. Global hydrological cycles and world water resources. Science 2006, 313, 1068–1072. [Google Scholar] [CrossRef]
- Arnell, N.W. Climate change and global water resources. Glob. Environ. Chang. 1999, 9, S31–S49. [Google Scholar] [CrossRef]
- Water Resources Group. Charting Our Water Future: Economic Frameworks to Inform Decision-Making; McKinsey & Company: New York, NY, USA, 2009. [Google Scholar]
- Lerner, D.N. Groundwater recharge in urban areas. Atmos. Environ. Part B Urban Atmos. 1990, 24, 29–33. [Google Scholar] [CrossRef]
- Lerner, D.N. Identifying and quantifying urban recharge: A review. Hydrogeol. J. 2002, 10, 143–152. [Google Scholar] [CrossRef]
- Pacheco, F.A.L.; Varandas, S.G.P.; Sanches Fernandes, L.F.; Valle Junior, R.F. Soil losses in rural watersheds with environmental land use conflicts. Sci. Total Environ. 2014, 485–486, 110–120. [Google Scholar] [CrossRef] [PubMed]
- Valle Junior, R.F.; Varandas, S.G.P.; Sanches Fernandes, L.F.; Pacheco, F.A.L. Environmental land use conflicts: A threat to soil conservation. Land Use Policy 2014, 41, 172–185. [Google Scholar] [CrossRef]
- Botelho, M.H.C. Água de Chuva: Engenharia das Águas Pluviais nas Cidades; Blucher: São Paulo, Brazil, 2012; ISBN 978-85-212-0596-8. [Google Scholar]
- De Barros, L.C. Barraginhas: Água de Chuva para Todos; Empresa Brasileira de Pesquisa Agropecuária, Embrapa Milho e Sorgo: Brasília, Brazil, 2009; ISBN 978-85-7383-447-5.
- Timm, L.C.; Reichardt, K. Solo, Planta e Atmosfera: Conceitos, Processos e Aplicações; Manole On-line publisher: Barueri, Brazil, 2008; ISBN 8520417736. [Google Scholar]
- Scanlon, B.R.; Faunt, C.C.; Longuevergne, L.; Reedy, R.C.; Alley, W.M.; Mcguire, V.L.; Mcmahon, P.B. Groundwater depletion and sustainability of irrigation in the US High Plains and Central Valley. Proc. Natl. Acad. Sci. USA 2012, 109, 9320–9325. [Google Scholar] [CrossRef] [Green Version]
- Siebert, S.; Burke, J.; Faures, J.M.; Frenken, K.; Hoogeveen, J.; Döll, P.; Portmann, F.T. Groundwater use for irrigation—A global inventory. Hydrol. Earth Syst. Sci. 2010, 14, 1863–1880. [Google Scholar] [CrossRef]
- Wada, Y.; Van Beek, L.P.H.; Bierkens, M.F.P. Nonsustainable groundwater sustaining irrigation: A global assessment. Water Resour. Res. 2012, 48. [Google Scholar] [CrossRef]
- Sophocleous, M. Groundwater recharge and sustainability in the High Plains aquifer in Kansas, USA. Hydrogeol. J. 2005, 13, 351–365. [Google Scholar] [CrossRef]
- Todd, D.K. Hidrologia de Águas Subterrâneas; Edgard Blucher: São Paulo, Brazil, 1967; ISBN 1000213223042. [Google Scholar]
- Gribbin, J.B. Introdução à Hidráulica, Hidrologia e Gestão de Águas Pluviais; Cengage Learning: São Paulo, Brazil, 2014; ISBN 8522116342. [Google Scholar]
- Valle, R.F.; Varandas, S.G.P.; Sanches Fernandes, L.F.; Pacheco, F.A.L. Groundwater quality in rural watersheds with environmental land use conflicts. Sci. Total Environ. 2014, 493, 812–827. [Google Scholar] [CrossRef] [PubMed]
- Kalbus, E.; Reinstorf, F.; Schirmer, M. Measuring methods for groundwater—Surface water interactions: A review. Hydrol. Earth Syst. Sci. 2006, 10, 873–887. [Google Scholar] [CrossRef]
- Winter, T.C. Relation of streams, lakes, and wetlands to groundwater flow systems. Hydrogeol. J. 1999, 7, 28–45. [Google Scholar] [CrossRef]
- Sophocleous, M. Interactions between groundwater and surface water: The state of the science. Hydrogeol. J. 2002, 10, 52–67. [Google Scholar] [CrossRef]
- Kollet, S.J.; Maxwell, R.M. Integrated surface-groundwater flow modeling: A free-surface overland flow boundary condition in a parallel groundwater flow model. Adv. Water Resour. 2006, 29, 945–958. [Google Scholar] [CrossRef]
- Wisler, C.O.; Brater, E.F. Hidrologia; Ao Livro Técnico: Rio de Janeiro, Brazil, 1964. [Google Scholar]
- Chowdhury, A.; Jha, M.K.; Chowdary, V.M. Delineation of groundwater recharge zones and identification of artificial recharge sites in West Medinipur district, West Bengal, using RS, GIS and MCDM techniques. Environ. Earth Sci. 2009. [Google Scholar] [CrossRef]
- Zaidi, F.K.; Nazzal, Y.; Ahmed, I.; Naeem, M.; Jafri, M.K. Identification of potential artificial groundwater recharge zones in Northwestern Saudi Arabia using GIS and Boolean logic. J. African Earth Sci. 2015, 111, 156–169. [Google Scholar] [CrossRef]
- Saraf, A.K.; Choudhury, P.R.; Roy, B.; Sarma, B.; Vijay, S.; Choudhury, S. GIS based surface hydrological modelling in identification of groundwater recharge zones. Int. J. Remote Sens. 2004, 25, 5759–5770. [Google Scholar] [CrossRef]
- Yeh, H.F.; Lee, C.H.; Hsu, K.C.; Chang, P.H. GIS for the assessment of the groundwater recharge potential zone. Environ. Geol. 2009, 58, 185–195. [Google Scholar] [CrossRef]
- Yeh, H.F.; Cheng, Y.S.; Lin, H.I.; Lee, C.H. Mapping groundwater recharge potential zone using a GIS approach in Hualian River, Taiwan. Sustain. Environ. Res. 2016, 26, 33–43. [Google Scholar] [CrossRef] [Green Version]
- Nimmo, J.R.; Healy, R.W.; Stonestrom, D.A. Aquifer Recharge. In Encyclopedia of Hydrological Sciences; Wiley: Hoboken, NJ, USA, 2006; ISBN 0470848944. [Google Scholar]
- Allison, G.B.; Gee, G.W.; Tyler, S.W. Vadose-Zone Techniques for Estimating Groundwater Recharge in Arid and Semiarid Regions. Soil Sci. Soc. Am. J. 2010, 58, 6–14. [Google Scholar] [CrossRef]
- Jiménez-Martínez, J.; Skaggs, T.H.; van Genuchten, M.T.; Candela, L. A root zone modelling approach to estimating groundwater recharge from irrigated areas. J. Hydrol. 2009, 367, 138–149. [Google Scholar] [CrossRef]
- Delin, G.N.; Healy, R.W.; Lorenz, D.L.; Nimmo, J.R. Comparison of local- to regional-scale estimates of ground-water recharge in Minnesota, USA. J. Hydrol. 2007, 334, 231–249. [Google Scholar] [CrossRef] [Green Version]
- Jódar-Abellán, A.; Albaladejo-García, J.A.; Prats-Rico, D. Artificial groundwater recharge. Review of the current knowledge of the technique. Revista de la Sociedad Geológica de España 2017, 30, 138–149. [Google Scholar]
- Bouwer, H. Artificial recharge of groundwater: Hydrogeology and engineering. Hydrogeol. J. 2002, 10, 121–142. [Google Scholar] [CrossRef]
- Stiefel, J.M.; Melesse, A.M.; McClain, M.E.; Price, R.M.; Anderson, E.P.; Chauhan, N.K. Effects of rainwater-harvesting-induced artificial recharge on the groundwater of wells in Rajasthan, India. Hydrogeol. J. 2009, 17, 2061. [Google Scholar] [CrossRef]
- Singh, A.; Panda, S.N.; Kumar, K.S.; Sharma, C.S. Artificial groundwater recharge zones mapping using remote sensing and gis: A case study in Indian Punjab. Environ. Manag. 2013, 52, 61–71. [Google Scholar] [CrossRef]
- Terêncio, D.P.S.; Sanches Fernandes, L.F.; Cortes, R.M.V.; Pacheco, F.A.L. Improved framework model to allocate optimal rainwater harvesting sites in small watersheds for agro-forestry uses. J. Hydrol. 2017, 550, 318–330. [Google Scholar] [CrossRef]
- Terêncio, D.P.S.; Sanches Fernandes, L.F.; Cortes, R.M.V.; Moura, J.P.; Pacheco, F.A.L. Rainwater harvesting in catchments for agro-forestry uses: A study focused on the balance between sustainability values and storage capacity. Sci. Total Environ. 2018, 613–614, 1079–1092. [Google Scholar] [CrossRef]
- Bellu, A.; Sanches Fernandes, L.F.; Cortes, R.M.V.; Pacheco, F.A.L. A framework model for the dimensioning and allocation of a detention basin system: The case of a flood-prone mountainous watershed. J. Hydrol. 2016, 533, 567–580. [Google Scholar] [CrossRef]
- Tucci, C.E.M.; Collischonn, W. Drenagem Urbana E Controle de Erosão, 2nd ed.; Oficina de Textos: São Paulo, Brazil, 1998; ISBN 978-85-7975-160-8. [Google Scholar]
- Mignot, E.; Li, X.; Dewals, B. Experimental modelling of urban flooding: A review. J. Hydrol. 2019, 568, 334–342. [Google Scholar] [CrossRef]
- De Roo, A.; Odijk, M.; Schmuck, G.; Koster, E.; Lucieer, A. Assessing the effects of land use changes on floods in the meuse and oder catchment. Phys. Chem. Earth Part B Hydrol. Ocean. Atmos. 2001, 26, 593–599. [Google Scholar] [CrossRef]
- Acreman, M.; Holden, J. How wetlands affect floods. Wetlands 2013, 33, 773–786. [Google Scholar] [CrossRef]
- Caldas, A.M.; Pissarra, T.C.T.; Costa, R.C.A.; Neto, F.C.R.; Zanata, M.; Parahyba, R.d.B.V.; Fernandes, L.F.S.; Pacheco, F.A.L. Flood vulnerability, environmental land use conflicts, and conservation of soil and water: A study in the Batatais SP municipality, Brazil. Water 2018, 10, 1357. [Google Scholar] [CrossRef]
- Minderhoud, P.S.J.; Erkens, G.; Pham, V.H.; Bui, V.T.; Erban, L.; Kooi, H.; Stouthamer, E. Impacts of 25 years of groundwater extraction on subsidence in the Mekong delta, Vietnam. Environ. Res. Lett. 2017. [Google Scholar] [CrossRef]
- Sušnik, J.; Vamvakeridou-Lyroudia, L.S.; Savić, D.A.; Kapelan, Z. Integrated System Dynamics Modelling for water scarcity assessment: Case study of the Kairouan region. Sci. Total Environ. 2012, 440, 290–306. [Google Scholar] [CrossRef]
- Custodio, E. Aquifer overexploitation: What does it mean? Hydrogeol. J. 2002, 10, 254–277. [Google Scholar] [CrossRef]
- Álvarez, X.; Valero, E.; Santos, R.M.B.; Varandas, S.G.P.; Sanches Fernandes, L.F.; Pacheco, F.A.L. Anthropogenic nutrients and eutrophication in multiple land use watersheds: Best management practices and policies for the protection of water resources. Land Use Policy 2017, 69, 1–11. [Google Scholar] [CrossRef]
- Santos, R.M.B.; Sanches Fernandes, L.F.; Pereira, M.G.; Cortes, R.M.V.; Pacheco, F.A.L. Water resources planning for a river basin with recurrent wildfires. Sci. Total Environ. 2015, 526, 1–13. [Google Scholar] [CrossRef]
- Ferreira, A.R.L.; Sanches Fernandes, L.F.; Cortes, R.M.V.; Pacheco, F.A.L. Assessing anthropogenic impacts on riverine ecosystems using nested partial least squares regression. Sci. Total Environ. 2017, 583, 466–477. [Google Scholar] [CrossRef]
- Pacheco, F.A.L.; Santos, R.M.B.; Sanches Fernandes, L.F.; Pereira, M.G.; Cortes, R.M.V. Controls and forecasts of nitrate yields in forested watersheds: A view over mainland Portugal. Sci. Total Environ. 2015, 537, 421–440. [Google Scholar] [CrossRef]
- Santos, R.M.B.; Sanches Fernandes, L.F.; Pereira, M.G.; Cortes, R.M.V.; Pacheco, F.A.L. A framework model for investigating the export of phosphorus to surface waters in forested watersheds: Implications to management. Sci. Total Environ. 2015, 536, 295–305. [Google Scholar] [CrossRef]
- Pacheco, F.A.L.; Pires, L.M.G.R.; Santos, R.M.B.; Sanches Fernandes, L.F. Factor weighting in DRASTIC modeling. Sci. Total Environ. 2015, 505, 474–486. [Google Scholar] [CrossRef]
- Valle Junior, R.F.; Varandas, S.G.P.; Sanches Fernandes, L.F.; Pacheco, F.A.L. Multi criteria analysis for the monitoring of aquifer vulnerability: A scientific tool in environmental policy. Environ. Sci. Policy 2015, 48, 250–264. [Google Scholar] [CrossRef]
- Pacheco, F.A.L.; Sanches Fernandes, L.F. The multivariate statistical structure of DRASTIC model. J. Hydrol. 2013, 476, 442–459. [Google Scholar] [CrossRef]
- Pacheco, F.A.L.; Sanches Fernandes, L.F. Environmental land use conflicts in catchments: A major cause of amplified nitrate in river water. Sci. Total Environ. 2016, 548–549, 173–188. [Google Scholar] [CrossRef]
- Rocha, C.I.O. Plano Diretor de Drenagem Urbana em Cidades Planejadas: Premissa de Zoneamento Baseado no Risco de Contaminação da Água Subterrânea. Ph.D. Thesis, Escola Politécnica da Universidade de São Paulo, São Paulo, Brazil, 2014. [Google Scholar]
- Sanches Fernandes, L.F.; Pacheco, F.A.L.; Cortes, R.M.V.; Jesus, J.J.B.; Varandas, S.G.P.; Santos, R.M.B. Integrative assessment of river damming impacts on aquatic fauna in a Portuguese reservoir. Sci. Total Environ. 2017, 601–602, 1108–1118. [Google Scholar]
- Pacheco, F.A.L. Regional groundwater flow in hard rocks. Sci. Total Environ. 2015, 506–507, 182–195. [Google Scholar] [CrossRef]
- Pacheco, F.A.L.; van der Weijden, C.H. Weathering of plagioclase across variable flow and solute transport regimes. J. Hydrol. 2012, 420–421, 46–58. [Google Scholar] [CrossRef]
- Van Der Weijden, C.H.; Pacheco, F.A.L. Hydrochemistry, weathering and weathering rates on Madeira island. J. Hydrol. 2003, 283, 122–145. [Google Scholar] [CrossRef]
- Pacheco, F.A.L.; Van Der Weijden, C.H. Mineral weathering rates calculated from spring water data: A case study in an area with intensive agriculture, the Morais Massif, northeast Portugal. Appl. Geochem. 2002, 17, 583–603. [Google Scholar] [CrossRef]
- Pacheco, F.A.L.; Alencoão, A.M.P. Role of fractures in weathering of solid rocks: Narrowing the gap between laboratory and field weathering rates. J. Hydrol. 2006, 316, 248–265. [Google Scholar] [CrossRef]
- Pacheco, F.A.L.; Van der Weijden, C.H. Role of hydraulic diffusivity in the decrease of weathering rates over time. J. Hydrol. 2014, 512, 87–106. [Google Scholar] [CrossRef]
- Pacheco, F.A.L.; Van der Weijden, C.H. Modeling rock weathering in small watersheds. J. Hydrol. 2014, 513, 13–27. [Google Scholar] [CrossRef]
- Pacheco, F.A.L.; Van der Weijden, C.H. Integrating topography, hydrology and rock structure in weathering rate models of spring watersheds. J. Hydrol. 2012, 428–429, 32–50. [Google Scholar] [CrossRef]
- De Luca, D.A.; Lasagna, M.; Gisolo, A.; Morelli di Popolo e Ticineto, A.; Falco, M.; Cuzzi, C. Potential recharge areas of deep aquifers: an application to the Vercelli–Biella Plain (NW Italy). Rend. Lincei 2019, 30, 137–153. [Google Scholar] [CrossRef]
- Blasch, K.W.; Bryson, J.R. Distinguishing sources of ground water recharge by using δ2H and δ18O. Ground Water 2007, 45, 294–308. [Google Scholar] [CrossRef] [PubMed]
- Ingram, R.G.S.; Hiscock, K.M.; Dennis, P.F. Noble gas excess air applied to distinguish groundwater recharge conditions. Environ. Sci. Technol. 2007, 41, 1949–1955. [Google Scholar] [CrossRef]
- Sukhija, B.S.; Reddy, D.V.; Nagabhushanam, P.; Hussain, S.N.; Giri, V.Y.; Patil, D.J. Environmental and injected tracers methodology to estimate direct precipitation recharge to a confined aquifer. J. Hydrol. 1996, 177, 77–97. [Google Scholar] [CrossRef]
- Sanches Fernandes, L.F.; Santos, C.; Pereira, A.; Moura, J. Model of management and decision support systems in the distribution of water for consumption: case study in North Portugal. Eur. J. Environ. Civ. Eng. 2011, 15, 411–426. [Google Scholar] [CrossRef]
- Fernandes, L.F.S.; Marques, M.J.; Oliveira, P.C.; Moura, J.P. Decision support systems in water resources in the demarcated region of Douro—Case study in Pinhão river basin, Portugal. Water Environ. J. 2014, 28, 350–357. [Google Scholar] [CrossRef]
- Instituto Brasileiro de Geografia E Estatística—IBGE Sistema IBGE de Recuperação Eletrônica (SIDRA). Available online: http://www.sidra.ibge.gov.br (accessed on 1 November 2018).
- Pessoa, P.F.P. Caracterização Hidrogeológica da Região Cárstica de Sete Lagoas-MG: Potencialidades e Riscos. Ph.D. Thesis, São Paulo University, São Paulo, Brazil, 1996. [Google Scholar]
- Botelho, L.A.L.A. Gestão dos Recursos Hídricos em Sete Lagoas/MG: UMA Abordagem a Partir da Evolução Espaçotemporal da Demanda e da Captação de Água; Federal University of Minas Gerais: Belo Horizonte, Brazil, 2008. [Google Scholar]
- Galvão, P.; Halihan, T.; Hirata, R. Evaluating karst geotechnical risk in the urbanized area of Sete Lagoas, Minas Gerais, Brazil. Hydrogeol. J. 2015, 23, 1499–1513. [Google Scholar] [CrossRef]
- Universidade Federal De Lavras; Fundação Estadual Do Meio Ambiente De Minas Gerais. Mapa de Solos do Estado de Minas Gerais. Available online: http://www.dps.ufv.br/?page_id=742 (accessed on 1 November 2018).
- FBDS—Fundação Brasileira para o Desenvolvimento Sustentável. Mapeamento em Alta Resolução dos Biomas Brasileiros. Available online: http://geo.fbds.org.br/ (accessed on 1 November 2018).
- Iglesias, M.; Uhlein, A. Estratigrafia do Grupo Bambuí e coberturas fanerozóicas no vale do rio São Francisco, norte de Minas Gerais. Rev. Bras. Geociências 2018, 39, 256–266. [Google Scholar] [CrossRef]
- CPRM/CODEMIG—Companhia de Pesquisa de Recursos Minerais/Companhia de Desenvolvimento Econômico de Minas Gerais. Mapa Geológico do Estado de Minas Gerais. Available online: www.portaldageologia.com.br (accessed on 1 October 2018).
- Batista, R.C.R. Caracterização Hidrogeológica do Entorno do Centro Nacional de Pesquisa de Milho e Sorgo (CNPMS), em Sete Lagoas, MG. MSc Thesis in Sanitation, Environment and Water Resources, Federal University of Minas Gerais, Belo Horizonte, Brazil, 2009. [Google Scholar]
- UAF-NASA Alaska Satellite Facility—Making Remote-Sensing Data Accessible Since 1991. Available online: https://www.asf.alaska.edu/ (accessed on 1 November 2018).
- Instituto Nacional de Meteorologia, Ministério da Agricultura, P. e A. Dados Meteorológicos. Available online: http://www.inmet.gov.br/portal/ (accessed on 1 November 2018).
- Agência Nacional de Águas. HidroWEB: Acervo de Dados Hidrológicos. Available online: http://www.snirh.gov.br/hidroweb/publico/apresentacao.jsf (accessed on 1 November 2018).
- Sistema Nacional de Cadastro Ambiental Rural. Consulta Pública dos Dados do Cadastro Ambiental Rural. Available online: http://www.car.gov.br/publico/municipios/downloads (accessed on 1 November 2018).
- QGIS a Free and Open Source Geographic Information System. Available online: https://www.qgis.org/en/site/ (accessed on 1 November 2018).
- Mazzini, P.L.F.; Schettini, C.A.F. Avaliação de metodologias de interpolação espacial aplicadas a dados hidrográficos costeiros quase-sinóticos. Braz. J. Aquat. Sci. Technol. 2013, 13, 53–64. [Google Scholar] [CrossRef]
- Böhner, J.; Selige, T. Spatial prediction of soil attributes using terrain analysis and climate regionalisation. Göttinger Geogr. Abhandlungen 2002, 115, 13–27. [Google Scholar]
- Desmet, P.J.J.; Govers, G. A GIS procedure for automatically calculating the USLE LS factor on topographically complex landscape units. J. Soil Water Conserv. 1996, 51, 427–433. [Google Scholar]
- American Society of Civil Engineers (ASCE). Design and Construction of Sanitary and Storm Sewers; ASCE Manual of Practice No 37, WPCF Manual of Practice No 9; American Society of Civil Engineers: New York, NY, USA, 1969; ISBN 0686304098.
- de Pedron, F.A.; Fink, J.R.; Rodrigues, M.F.; de Azevedo, A.C. Condutividade e retenção de água em Neossolos e saprolitos derivados de arenito. Rev. Bras. Cienc. do Solo 2011, 35, 1253–1262. [Google Scholar]
- de Araújo Pedron, F.; Fink, J.R.; Rodrigues, M.F.; de Azevedo, A.C. Hydraulic conductivity and water retention in leptosols-regosols and saprolite derived from sandstone, Brazil. Rev. Bras. Ciência do Solo 2011, 35, 1253–1262. [Google Scholar] [CrossRef] [Green Version]
- Santos, R.M.B.; Sanches Fernandes, L.F.; Moura, J.P.; Pereira, M.G.; Pacheco, F.A.L. The impact of climate change, human interference, scale and modeling uncertainties on the estimation of aquifer properties and river flow components. J. Hydrol. 2014, 519, 1297–1314. [Google Scholar] [CrossRef]
- Scanlon, B.R.; Healy, R.W.; Cook, P.G. Choosing appropriate techniques for quantifying groundwater recharge. Hydrogeol. J. 2002, 10, 18–39. [Google Scholar] [CrossRef]
- Cao, G.; Scanlon, B.R.; Han, D.; Zheng, C. Impacts of thickening unsaturated zone on groundwater recharge in the North China Plain. J. Hydrol. 2016, 537, 260–270. [Google Scholar] [CrossRef]
- Koch, H.; Vögele, S. Dynamic modelling of water demand, water availability and adaptation strategies for power plants to global change. Ecol. Econ. 2009, 68, 2031–2039. [Google Scholar] [CrossRef]
- Fyles, H.; Madramootoo, C. Water Management. In Emerging Technologies for Promoting Food Security: Overcoming the World Food Crisis; Woodhead Publishing: Sawston, Cambridge, UK, 2015; ISBN 9781782423539. [Google Scholar]
- Butler, D.; Memon, F. Water Demand Management; IWA Publishing: London, UK, 2006; p. 380. ISBN 1843390787. [Google Scholar]
- Russell, S.; Fielding, K. Water demand management research: A psychological perspective. Water Resour. Res. 2010. [Google Scholar] [CrossRef]
- Dessu, S.B.; Melesse, A.M.; Bhat, M.G.; McClain, M.E. Assessment of water resources availability and demand in the Mara River Basin. Catena 2014, 115, 104–114. [Google Scholar] [CrossRef]
- McMahon, P.B.; Plummer, L.N.; Böhlke, J.K.; Shapiro, S.D.; Hinkle, S.R. A comparison of recharge rates in aquifers of the United States based on groundwater-age data. Hydrogeol. J. 2011. [Google Scholar] [CrossRef]
- Cook, P.G. A Guide to Regional Groundwater Flow in Fractured Rock Aquifers; CSIRO Land and Water: Henley Beach, Australia, 2003; p. 115. ISBN 1 74008 233 8.
- Scanlon, B.R.; Reedy, R.C.; Stonestrom, D.A.; Prudic, D.E.; Dennehy, K.F. Impact of land use and land cover change on groundwater recharge and quality in the southwestern US. Glob. Chang. Biol. 2005, 11, 1577–1593. [Google Scholar] [CrossRef]
- Brauman, K.A.; Freyberg, D.L.; Daily, G.C. Land cover effects on groundwater recharge in the tropics: Ecohydrologic mechanisms. Ecohydrology 2012, 5, 435–444. [Google Scholar] [CrossRef]
- Ilstedt, U.; Bargués Tobella, A.; Bazié, H.R.; Bayala, J.; Verbeeten, E.; Nyberg, G.; Sanou, J.; Benegas, L.; Murdiyarso, D.; Laudon, H.; et al. Intermediate tree cover can maximize groundwater recharge in the seasonally dry tropics. Sci. Rep. 2016. [Google Scholar] [CrossRef]
- Zomlot, Z.; Verbeiren, B.; Huysmans, M.; Batelaan, O. Spatial distribution of groundwater recharge and base flow: Assessment of controlling factors. J. Hydrol. Reg. Stud. 2015, 4, 349–368. [Google Scholar] [CrossRef] [Green Version]
- Maréchal, J.C.; Varma, M.R.R.; Riotte, J.; Vouillamoz, J.M.; Kumar, M.S.M.; Ruiz, L.; Sekhar, M.; Braun, J.J. Indirect and direct recharges in a tropical forested watershed: Mule Hole, India. J. Hydrol. 2009, 364, 272–284. [Google Scholar] [CrossRef] [Green Version]
- Le Maitre, D.C.; Scott, D.F.; Colvin, C. A review of information on interactions between vegetation and groundwater. Water SA 1999, 25, 137–152. [Google Scholar]
- Zhang, H.; Hiscock, K.M. Modelling the impact of forest cover on groundwater resources: A case study of the Sherwood Sandstone aquifer in the East Midlands, UK. J. Hydrol. 2010, 392, 136–149. [Google Scholar] [CrossRef]
- Zhang, Y.K.; Schilling, K.E. Effects of land cover on water table, soil moisture, evapotranspiration, and groundwater recharge: A Field observation and analysis. J. Hydrol. 2006, 319, 328–338. [Google Scholar] [CrossRef]
- Allen, A.; Chapman, D. Impacts of afforestation on groundwater resources and quality. Hydrogeol. J. 2001, 9, 390–400. [Google Scholar] [CrossRef]
- Schlesinger, W.H.; Jasechko, S. Transpiration in the global water cycle. Agric. For. Meteorol. 2014, 189–190, 115–117. [Google Scholar] [CrossRef]
- Zhang, L.; Dawes, W.R.; Walker, G.R. Response of mean annual evapotranspiration to vegetation changes at catchment scale. Water Resour. Res. 2001, 37, 701–708. [Google Scholar] [CrossRef]
- Leite, F.P.; Barros, N.F.; Novais, R.F.; Sans, L.M.A.; Fabres, A.S. Relações hídricas em povoamento de eucalipto com diferentes densidades populacionais. Rev. Bras. Ciência do Solo 1999, 23, 9–16. [Google Scholar] [CrossRef]
- Consensa, C.O.B. Balanço Hídrico em Povoamento de Eucalipti com Diferentes Densidades de Plantas em Argissolo. Master’s Thesis, Federal University of Santa Maria, Santa Maria, RS, Brazil, 2015. [Google Scholar]
- Hund, S.V.; Allen, D.M.; Morillas, L.; Johnson, M.S. Groundwater recharge indicator as tool for decision makers to increase socio-hydrological resilience to seasonal drought. J. Hydrol. 2018, 563, 1119–1134. [Google Scholar] [CrossRef]
- Arulbalaji, P.; Padmalal, D.; Sreelash, K. GIS and AHP Techniques Based Delineation of Groundwater Potential Zones: a case study from Southern Western Ghats, India. Sci. Rep. 2019. [Google Scholar] [CrossRef]
- Rajaveni, S.P.; Brindha, K.; Elango, L. Geological and geomorphological controls on groundwater occurrence in a hard rock region. Appl. Water Sci. 2015, 7, 1377–1389. [Google Scholar] [CrossRef] [Green Version]
- Singh, P.; Thakur, J.K.; Kumar, S. Delineating groundwater potential zones in a hard-rock terrain using geospatial tool. Hydrol. Sci. J. 2013, 58, 213–223. [Google Scholar] [CrossRef] [Green Version]
- Kudamnya, E.A.; Edet, A.E.; Ekwere, A.S. Geomorphological Control on Groundwater Occurrence within the Basement Terrain of Keffi Area, North-Central Nigeria. In Advances in Sustainable and Environmental Hydrology, Hydrogeology, Hydrochemistry and Water Resources; Springer: Cham, Switherland, 2019. [Google Scholar]
- Suganthi, S.; Elango, L.; Subramanian, S.K. Groundwater potential zonation by remote sensing and GIS techniques and its relation to the groundwater level in the coastal part of the Arani and Koratalai river basin, Southern India. Earth Sci. Res. J. 2013, 17, 87–95. [Google Scholar]
- Dar, I.A.; Sankar, K.; Dar, M.A. Deciphering groundwater potential zones in hard rock terrain using geospatial technology. Environ. Monit. Assess. 2011, 173, 597–610. [Google Scholar] [CrossRef]
- Yenehun, A.; Walraevens, K.; Batelaan, O. Spatial and temporal variability of groundwater recharge in Geba basin, Northern Ethiopia. J. African Earth Sci. 2017, 134, 198–212. [Google Scholar] [CrossRef] [Green Version]
- Cheo, A.E.; Voigt, H.J.; Wendland, F. Modeling groundwater recharge through rainfall in the Far-North region of Cameroon. Groundw. Sustain. Dev. 2017, 5, 118–130. [Google Scholar] [CrossRef]
- Sandoval, J.A.; Tiburan, C.L. Identification of potential artificial groundwater recharge sites in Mount Makiling Forest Reserve, Philippines using GIS and Analytical Hierarchy Process. Appl. Geogr. 2019, 105, 73–85. [Google Scholar] [CrossRef]
- Wakode, H.B.; Baier, K.; Jha, R.; Azzam, R. Impact of urbanization on groundwater recharge and urban water balance for the city of Hyderabad, India. Int. Soil Water Conserv. Res. 2018, 6, 51–62. [Google Scholar] [CrossRef]
- Kalhor, K.; Ghasemizadeh, R.; Rajic, L.; Alshawabkeh, A. Assessment of groundwater quality and remediation in karst aquifers: A review. Groundw. Sustain. Dev. 2019, 8, 104–121. [Google Scholar] [CrossRef]
- Ghasemizadeh, R.; Hellweger, F.; Butscher, C.; Padilla, I.; Vesper, D.; Field, M.; Alshawabkeh, A. Review: Groundwater flow and transport modeling of karst aquifers, with particular reference to the North Coast Limestone aquifer system of Puerto Rico. Hydrogeol. J. 2012, 20, 1441–1461. [Google Scholar] [CrossRef] [Green Version]
- White, W.B. Conceptual models for karstic aquifers. Speleogenes. Evol. Karst Aquifers 2003, 1, 1–6. [Google Scholar]
- Groves, C.G.; Howard, A.D. Early development of karst systems: 1. Preferential flow path enlargement under laminar flow. Water Resour. Res. 1994, 30, 2837–2846. [Google Scholar] [CrossRef]
- Malard, A.; Jeannin, P.Y.; Vouillamoz, J.; Weber, E. An integrated approach for catchment delineation and conduit-network modeling in karst aquifers: Application to a site in the Swiss tabular Jura. Hydrogeol. J. 2015, 23, 1341–1357. [Google Scholar] [CrossRef]
- Perrin, J.; Luetscher, M. Inference of the structure of karst conduits using quantitative tracer tests and geological information: Example of the Swiss Jura. Hydrogeol. J. 2008, 16, 951–967. [Google Scholar] [CrossRef]
- White, E.L.; Aron, G.; White, W.B. The influence of urbanization of sinkhole development in central Pennsylvania. Environ. Geol. Water Sci. 1986, 8, 91–97. [Google Scholar] [CrossRef]
- Porhemmat, J.; Nakhaei, M.; Altafi Dadgar, M.; Biswas, A. Investigating the effects of irrigation methods on potential groundwater recharge: A case study of semiarid regions in Iran. J. Hydrol. 2018, 565, 455–466. [Google Scholar] [CrossRef]
- Atapour, H.; Aftabi, A. Geomorphological, geochemical and geo-environmental aspects of karstification in the urban areas of Kerman city, southeastern, Iran. Environ. Geol. 2002, 42, 783–792. [Google Scholar]
- Gutiérrez, F.; Galve, J.P.; Guerrero, J.; Lucha, P.; Cendrero, A.; Remondo, J.; Bonachea, J.; Gutiérrez, M.; Sánchez, J.A. The origin, typology, spatial distribution and detrimental effects of the sinkholes developed in the alluvial evaporite karst of the Ebro River valley downstream of Zaragoza city (NE Spain). Earth Surf. Process. Landforms 2007, 32, 912–928. [Google Scholar] [CrossRef]


| Data Type | Use in the Recharge Evaluation Model | URL of Website |
|---|---|---|
| Digital elevation model | Calculation of slope length and steepness factor (Equation (1)) | https://www.asf.alaska.edu |
| Land use and cover map | Calculation of runoff parameter (Equation (1)) | http://geo.fbds.org.br |
| Soil map and associated porosity and hydraulic conductivity data | Calculation of percolation factor (Equation (2)) | http://www.dps.ufv.br |
| Rainfall and evapotranspiration data | Calculation of recharge potential (Equation (3)) | http://www.inmet.gov.br |
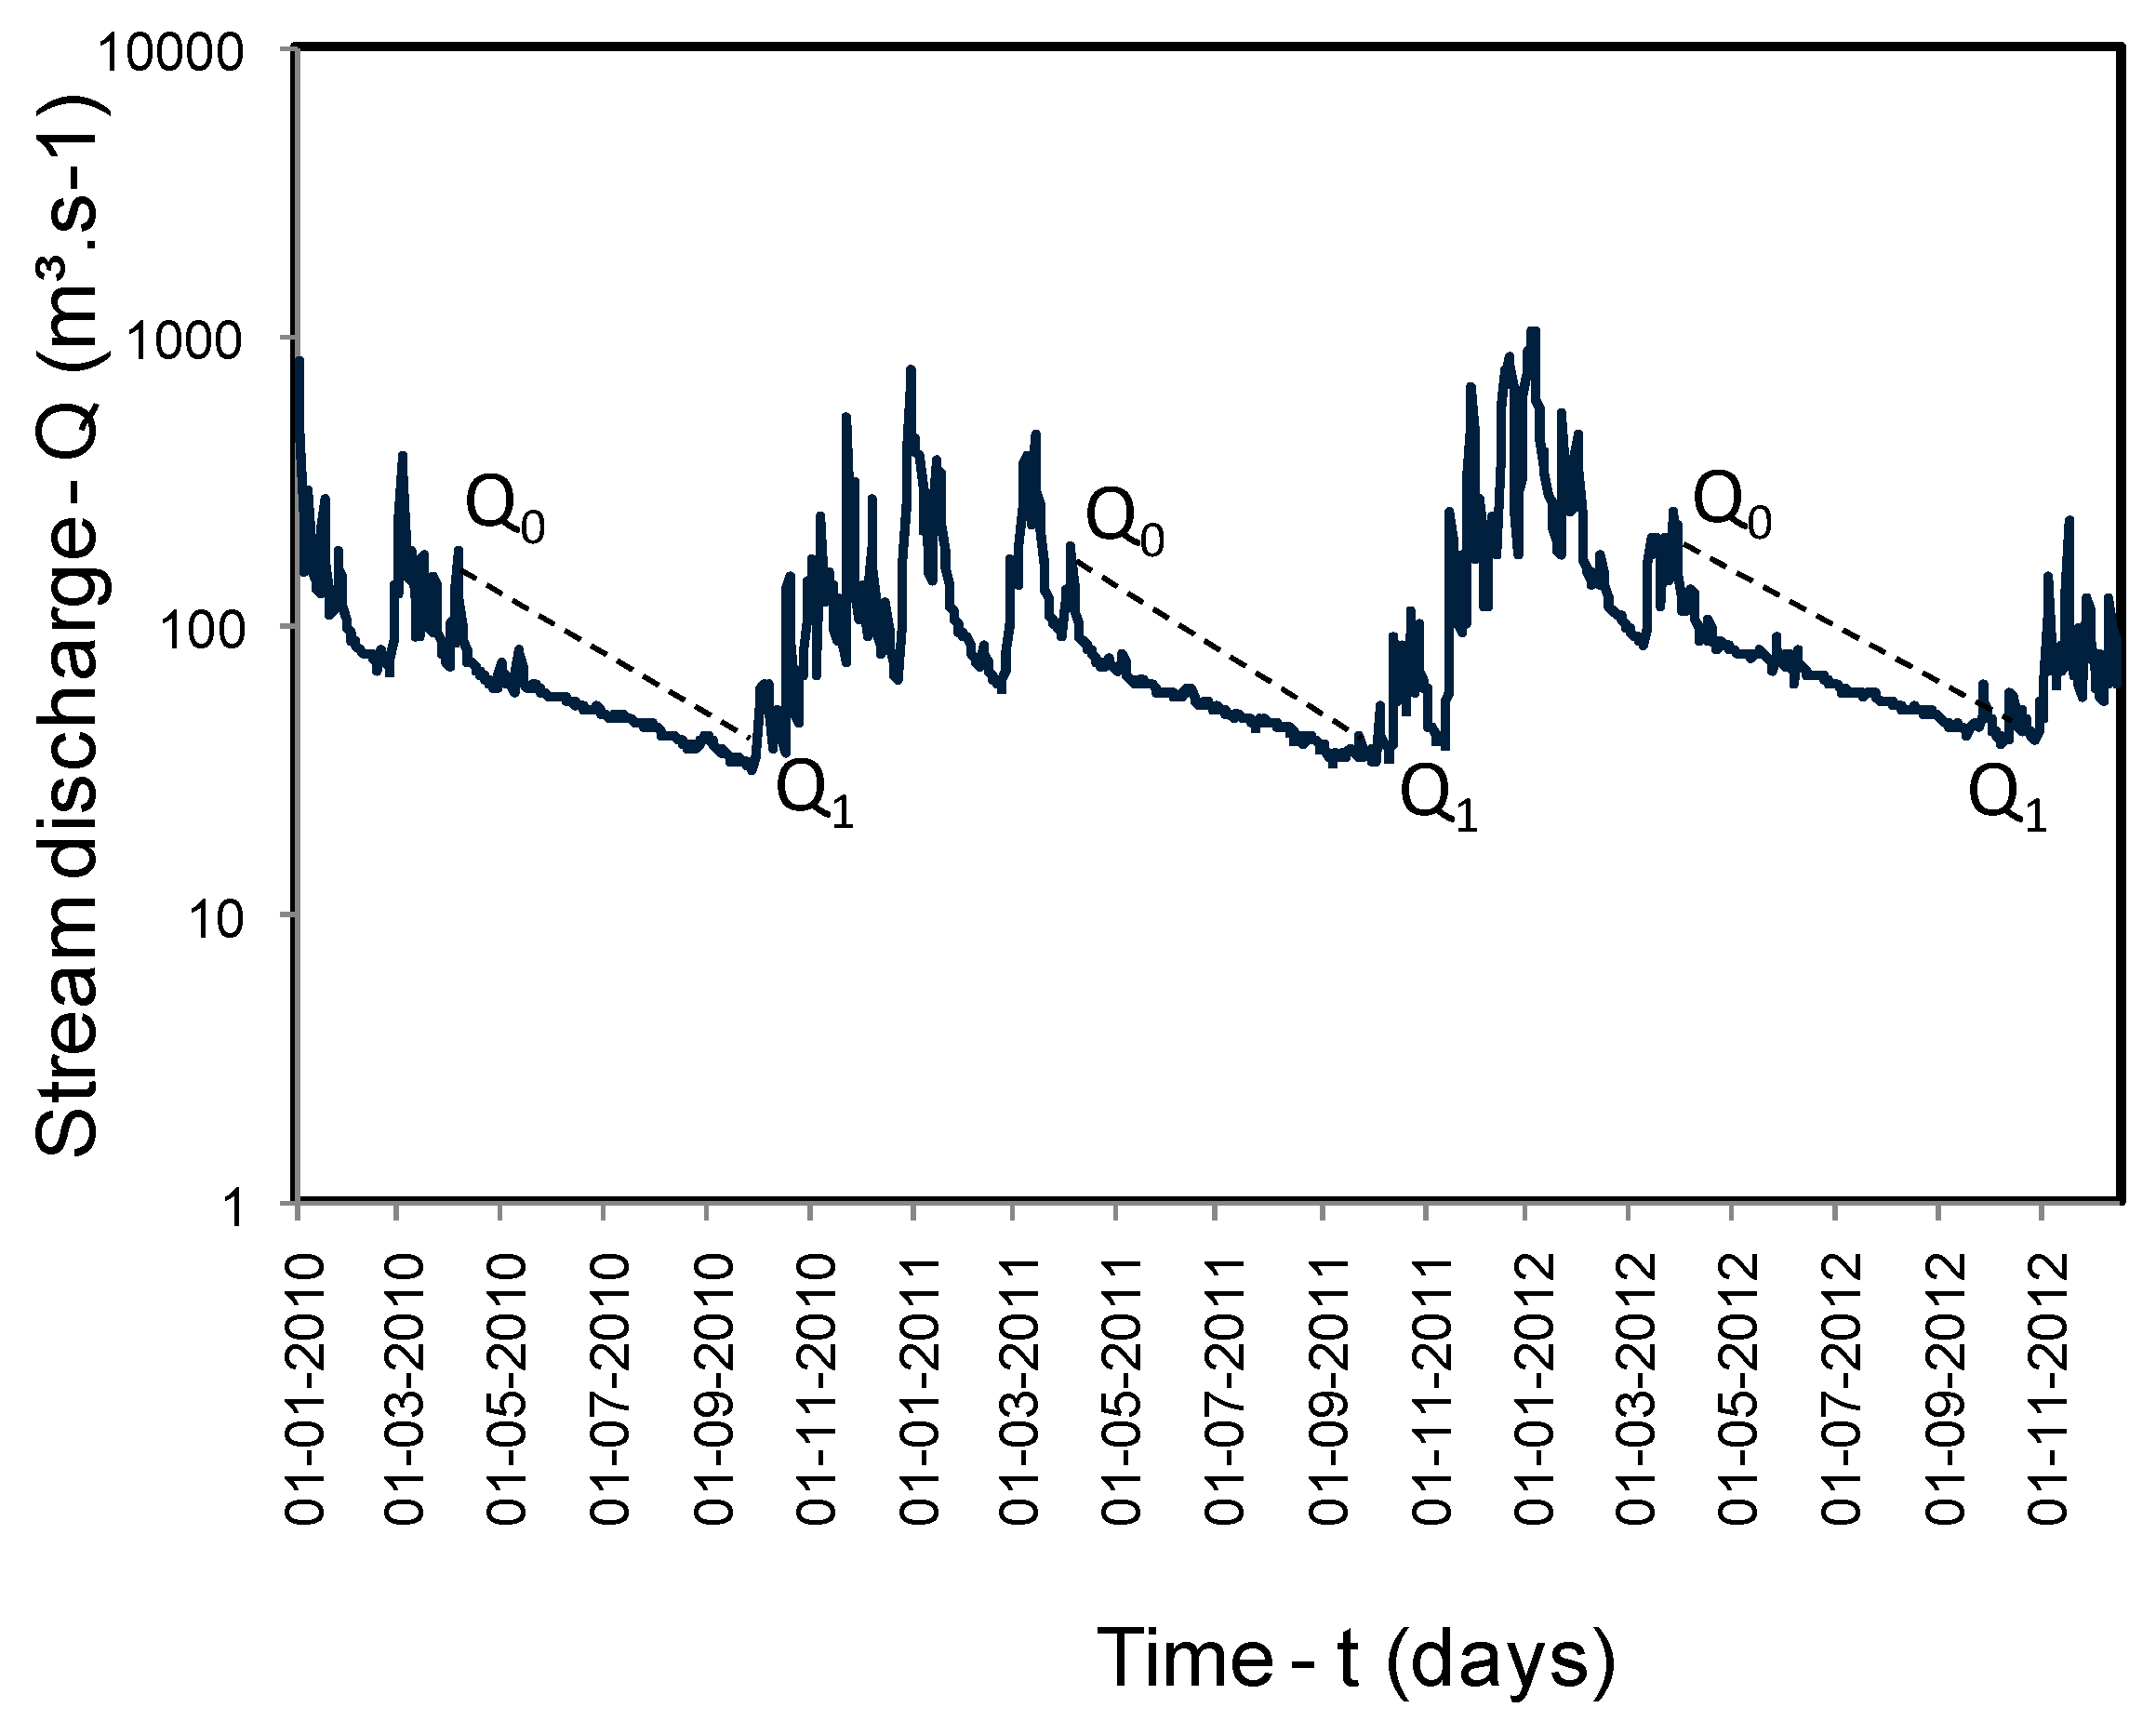
| Stream flow data | Validation of recharge potential using na independent method (recession analysis) | http://www.snirh.gov.br/hidroweb |
| Geologic map | Information for discussion | www.portaldageologia.com.br |
| Administrative data | Additional information | http://www.car.gov.br |
| Population data | Additional information | http://www.sidra.ibge.gov.br |
| Soil Use and Cover Classes | C |
|---|---|
| Anthropized area | 0.5 |
| Urban area | 0.85 |
| Forest formation | 0.1 |
| Planted forest | 0.13 |
| Ground vegetation, and bare soil | 0.6 |
| Soil Type | Ks (mm/h) | Total Porosity |
|---|---|---|
| Cambisol | 16 | 0.53 |
| Latosol | 52 | 0.69 |
| Argisol | 19 | 0.44 |
| Neosol | 32 | 0.43 |
| Method | Volume (m3) | ∆V | ∆V (%) |
|---|---|---|---|
| Spatialization | 3.63 × 10⁹ | 5.22 × 10⁸ | 14.4% |
| Recession analysis | 3.11 × 10⁹ |
| Parameter | Average Recharge Potential (m3 ha−1 year−1) |
|---|---|
| Municipality | |
| Prudente de Morais | 1350.8 |
| Sete Lagoas | 1013.8 |
| Jequitiba | 807.5 |
| Funilândia | 633.2 |
| Capim Branco | 480.8 |
| Lithologic types | |
| Alluvial sediments | 1357.0 |
| Colluvial sediments | 1061.5 |
| Carbonate and pelitic rocks | 829.3 |
| Igneous rocks | 539.3 |
| Land use and cover | |
| Forest | 1899.4 |
| Agriculture and pasture | 888.4 |
| Native vegetation | 672.3 |
| Ground vegetation and bare soil | 484.0 |
| Urban area | 217.1 |
© 2019 by the authors. Licensee MDPI, Basel, Switzerland. This article is an open access article distributed under the terms and conditions of the Creative Commons Attribution (CC BY) license (http://creativecommons.org/licenses/by/4.0/).
Share and Cite
da Costa, A.M.; de Salis, H.H.C.; Viana, J.H.M.; Leal Pacheco, F.A. Groundwater Recharge Potential for Sustainable Water Use in Urban Areas of the Jequitiba River Basin, Brazil. Sustainability 2019, 11, 2955. https://doi.org/10.3390/su11102955
da Costa AM, de Salis HHC, Viana JHM, Leal Pacheco FA. Groundwater Recharge Potential for Sustainable Water Use in Urban Areas of the Jequitiba River Basin, Brazil. Sustainability. 2019; 11(10):2955. https://doi.org/10.3390/su11102955
Chicago/Turabian Styleda Costa, Adriana Monteiro, Hugo Henrique Cardoso de Salis, João Hebert Moreira Viana, and Fernando António Leal Pacheco. 2019. "Groundwater Recharge Potential for Sustainable Water Use in Urban Areas of the Jequitiba River Basin, Brazil" Sustainability 11, no. 10: 2955. https://doi.org/10.3390/su11102955