A Travel Behavior-Based Skip-Stop Strategy Considering Train Choice Behaviors Based on Smartcard Data


1
Department of Civil and Environmental Engineering, Seoul National University, Seoul 08826, Korea
2
Future Transport Policy Research Division, Korea Railroad Research Institute, Uiwang 16105, Korea
3
Institute of Engineering Research, Seoul National University, Seoul 08826, Korea
4
Department of Civil and Environmental Engineering and Institute of Construction and Environmental Engineering, Seoul National University, Seoul 08826, Korea
*
Author to whom correspondence should be addressed.
Sustainability 2019, 11(10), 2791; https://doi.org/10.3390/su11102791
Submission received: 23 April 2019
/
Revised: 6 May 2019
/
Accepted: 9 May 2019
/
Published: 16 May 2019
(This article belongs to the Special Issue Sustainability Issues in Public Transport)
Abstract
:This study analyzes a skip-stop strategy considering four types of train choice behavior with smartcard data. The proposed model aims to minimize total travel time with realistic constraints such as facility condition, operational condition, and travel behavior. The travel time from smartcard data is decomposed by two distributions of the express trains and the local trains using a Gaussian mixture model. The utility parameters of the train choice model are estimated with the decomposed distribution using the multinomial logit model. The optimal solution is derived by a genetic algorithm to designate the express stations of the Bundang line in the Seoul metropolitan area. The results indicate the travel times of the transfer-based strategy and the high ridership-based strategy are estimated to be 21.2 and 19.7 min/person, respectively. Compared to the travel time of the current system, the transfer-based strategy has a 5.8% reduction and the high ridership-based strategy has a 12.2% reduction. For the travel behavior-based strategy, the travel time was estimated to be 18.7 minutes, the ratio of the saved travel time is 17.9%, and the energy consumption shows that the travel behavior-based strategy consumes 305,437 (kWh) of electricity, which is about 12.7% lower compared to the current system.
1. Introduction
For sustainable development at the global level, public transportation has emerged as an effective alternative. OECD member countries are planning and carrying out transportation policies focusing on public transportation, especially railway, in order to reduce emissions of air pollutants. Railway attracts more attention as an environmentally friendly mode than road transport. Recently, the skip-stop strategy has become increasingly and globally popular in terms of improving the efficiency of railway operation and passenger convenience.
Community of metro (CoMET) is the urban railway research institute with 34 metro operators around the world, providing the key performance index regarding sustainability, i.e., energy consumption and GHG emissions. The skip-stop strategy contributes to the construction of sustainable transportation systems, such as the reduction of greenhouse gas (GHG) emissions and traffic congestion by improving the share of railway modes [1]. The skip-stop strategy reduces energy consumption and environmental costs in terms of sustainability [2]. It efficiently consumes power energy by reducing the number of stop stations while increasing the transport capacity [3].
In the transportation engineering field, the skip-stop strategy has also received much attention in recent years due to its transit efficiency, which increases capacity and the scheduled speed by allowing trains to skip designated stops along a railway line. The skip-stop strategy has allowed for the simultaneous operation of both express and local trains on the same railway line in the urban railway network [4]. Compared with the general operations of an urban railway, the skip-stop strategy has been considered an efficient transportation technique that maintains a high scheduled speed and short travel time [5]. The main idea of the skip-stop approach was to reduce the total travel time by skipping the local stations that have less ridership. Although the passengers’ waiting times would be increased at these local stations, this strategy had the advantage of reducing the total travel time of the railway network [6,7,8,9]. The skip-stop strategy has been designed properly and coordinated sensibly by considering various conditions [10,11,12,13,14,15]. In practice, the express stations were designated based on empirical criteria, in that they served as transfer stations with other railways lines and tended to have a considerable number of riderships within the station [5].
Since the skip-stop strategy is an NP-hard problem, the metaheuristic algorithm is required to estimate the optimal solution. Representative metaheuristic methodologies include genetic algorithm (GA), simulated annealing algorithm and Tabu search algorithm. Simulated annealing algorithms are generally known to have a disadvantage in that it is difficult to consider various solutions compared to GA [16]. It is also known that the Tabu search algorithm does not guarantee a better solution than a random search such as the GA [17]. GA is widely used for skip-stop analysis because it estimates a fast and accurate solution compared with other algorithms [18]. Many previous studies have used GA to deal with complex issues, such as the skip-stop strategy and scheduling the trains [6]. The GA was considered suitable for finding a global solution that goes beyond the local solution. The GA applied for a process of determining the optimal solution by checking the convergence of each solution that evolves over generations. Many skip-stop related studies, therefore, have determined the optimal solution for the designation of an express station using GA [3].
The problem has been solved as an optimization problem, i.e., by minimizing the passengers’ travel time. The scheduled travel time was separated into specific components, i.e., accelerating time, constant travel time, decelerating time, and dwelling time. The influence of each component was used to solve the problem [12]. These studies derived an optimized skip-stop strategy, but it had limitations in that it did not reflect the passenger’s behavior, such as train choice behavior between local and express. In the conventional traffic assignment problem, many studies have conducted the analysis assuming that the passenger chooses the route with the minimum travel time. However, in reality, train choice behavior was varied depending on individual preferences. Even with the same origin–destination (O-D), train passengers chose the express train or local train according to their preferences. For practical field skip-stop operations, it was necessary to reflect travel behaviors for designating express stations of the transit network. Studies have been conducted to distinguish the characteristics of routes according to the distribution of probabilistic travel time of the O-D pair. The Gaussian mixture model (GMM) has been used extensively as a method of separating groups of passengers using the distribution of variables [19,20]. GMM has shown results in decomposing groups and in defining group-specific characteristics according to their specific distribution.
The government of Seoul has been operating the automatic fare collection (AFC) system based on the smartcard since 2004. With the introduction of the AFC system, it has become possible to identify the trip information of individual transit passengers [21,22]. This information provided an opportunity to analyze individual travel behaviors. The smartcard data consisted of 20 million instances of personal transit information per day, containing 99% of transit passengers’ trips. Regarding the skip-stop strategy, the train choice behavior was distinguished according to the travel time from an individual’s smartcard data, and the probability of train choice was estimated through the distribution of the travel time.
This study proposed an optimal skip-stop strategy that considers travel behaviors. The energy consumption and GHG emissions were also measured quantitatively to identify the sustainability of the optimal strategy. The two types of train choice were defined as travel behavior, since the probability of train choice varies when the skip-stop system is installed. In addition, we analyzed the solution to derive the express stations of the skip-stop through a genetic algorithm. The travel time distribution of O-D was estimated by using individual smartcard data, and it was decomposed by two distributions for the express trains and the local trains based on the GMM. A model for designating express stations was proposed considering the probability of individual travel behaviors. Two empirical models in the practical field were compared to evaluate the proposed model. The models were sufficiently detailed to enable consideration of various characteristics, including the designation of stations on the skip-stop networks. Regarding the sustainability of proposed skip-stop strategy, the energy consumption and GHG emissions were quantitatively measured. The environmental benefit–cost was also identified by comparing the current railway system.
2. Methodology of Optimizing Skip-Stop Strategy
2.1. Modeling Strategy
This study considers the trains that stop at all stations as local trains and the trains that stop only at designated stations as express trains. Express trains of this scheme have higher scheduled speeds than the local trains and increase the scheduled speed by skipping stations [23]. To create the optimal design of the skip-stop strategy, we incorporated technological advancements in the optimization model. The optimization model is designed to three main steps; i.e., (1) the classification of the travel behavior type, (2) classification of the travel time distribution, and (3) modeling the skip-stop strategy with the various constraints [12,13].
Four types of travel behavior of the train choices are identified as shown in the skip-stop network in Figure 1. The travel patterns using the express train and the local train are defined as train choice behavior. Passengers exhibit four travel behaviors that represent the behaviors of the railway networks. Figure 1 shows a conceptual network of skip-stop strategy consisting of seven stations, which is comprised of three express stations and four local stations. The red line indicates the express train route, which stops only at the express stations, i.e., station numbers 2, 4, and 6. The blue line shows the route of the local train, which stops at all the stations which are number 1 to 7. In this network, four types of travel behaviors can be defined, i.e., the local train only, the express train only, one transfer, and two transfers. When passengers choose the local train, the passenger has the choice to travel to any stations within the railway line. The express train passengers can only travel to stations where the express trains stop. When passengers consider the transfer type, both express and local stations should be considered. A transfer passenger should get off the local train at an express station to transfer to the express train stopping at the current station. As an example, the one transfer type available for route choice is i.e., 1-2-4, 1-2-6, 1-4-6, and 3-4-6. The O-D trips that lie on local stations but require long distance travel have the opportunity to transfer twice within a single line. The two transfer type is done by using the one transfer type and by traveling until the passenger arrives at the closest express station to transfer to the destination which is a local station. As an example, shown in Figure 1, passengers that travel from station 1 to station 7 take too long just using the local train to travel to the destination. As such, the passenger transfers at station 2, to an express train and rides this express train to station 6. Again, the passenger gets off the express train and takes a local train at station 6 to go to the desired station at station 7. These are the types of travel behavior that is shown according to the skip-stop strategy, and they are a preliminary step to reflect travel behavior in the model.
2.2. Genetic Algorithm for Optimizing the Skip-Stop Strategy
Genetic algorithm (GA) is a method which provides the optimal solutions of both constrained and unconstrained optimization problems. The algorithm derives an optimal solution based on a natural selection process of biological evolution. To employ the GA for optimizing the skip-stop strategy, the chromosome and the gene need to be defined. In the skip-stop strategy, the chromosomes are defined as the stations which are composed of two types, i.e., express and local. The gene is the set of the chromosomes which are the array of the stations. Since the objective function of this study set to minimize the total travel time, the fitness of each gene evolves toward decreasing the travel time.
The operation of the genetic algorithm consists of selection, crossover, mutation, and replacement steps. Selection is the most critical operation, a computational process for selecting a genetically good parent in a population [12]. Parents that have evolved to meet the objective function and the constraint (array of the inverse of the line) are selected. The crossover is the operation of producing the offspring. The crossover uses the parents who are selected in the selection step. The crossover creates the offspring (a new array of the stations consisting the railway line) by crossing the type and order of the selected station. The mutation is the step of modifying the generated gene of the offspring. In the mutation step, the type of station in the new array could be changed as express or local randomly. The Mutation step prevents local minima problems. Finally, Replacement is to change the population to evolve into the next generation. Replacement constructs a population of new generations by replacing genes in the population with newly created genes. The population of a new generation could simply be substituted for all genes, or only the inferior genes could be substituted.
GA was used in this study to search for an optimal skip-stop strategy since the all-enumeration methods require massive computational power, i.e., computations, where is the number of stations. The skip-stop strategy was implemented in AMD Ryzen 5 1600X on a six-core processor with 16 GB memory. The computation time of solving the optimal solution of the skip-stop strategy is about 15 min with 30 stations, i.e., computations. The process of the GA for optimal skip-stop strategy and the conceptual diagram of the step of GA are shown in Figure 2.
2.3. Gaussian Mixture Model for Travel Behavior
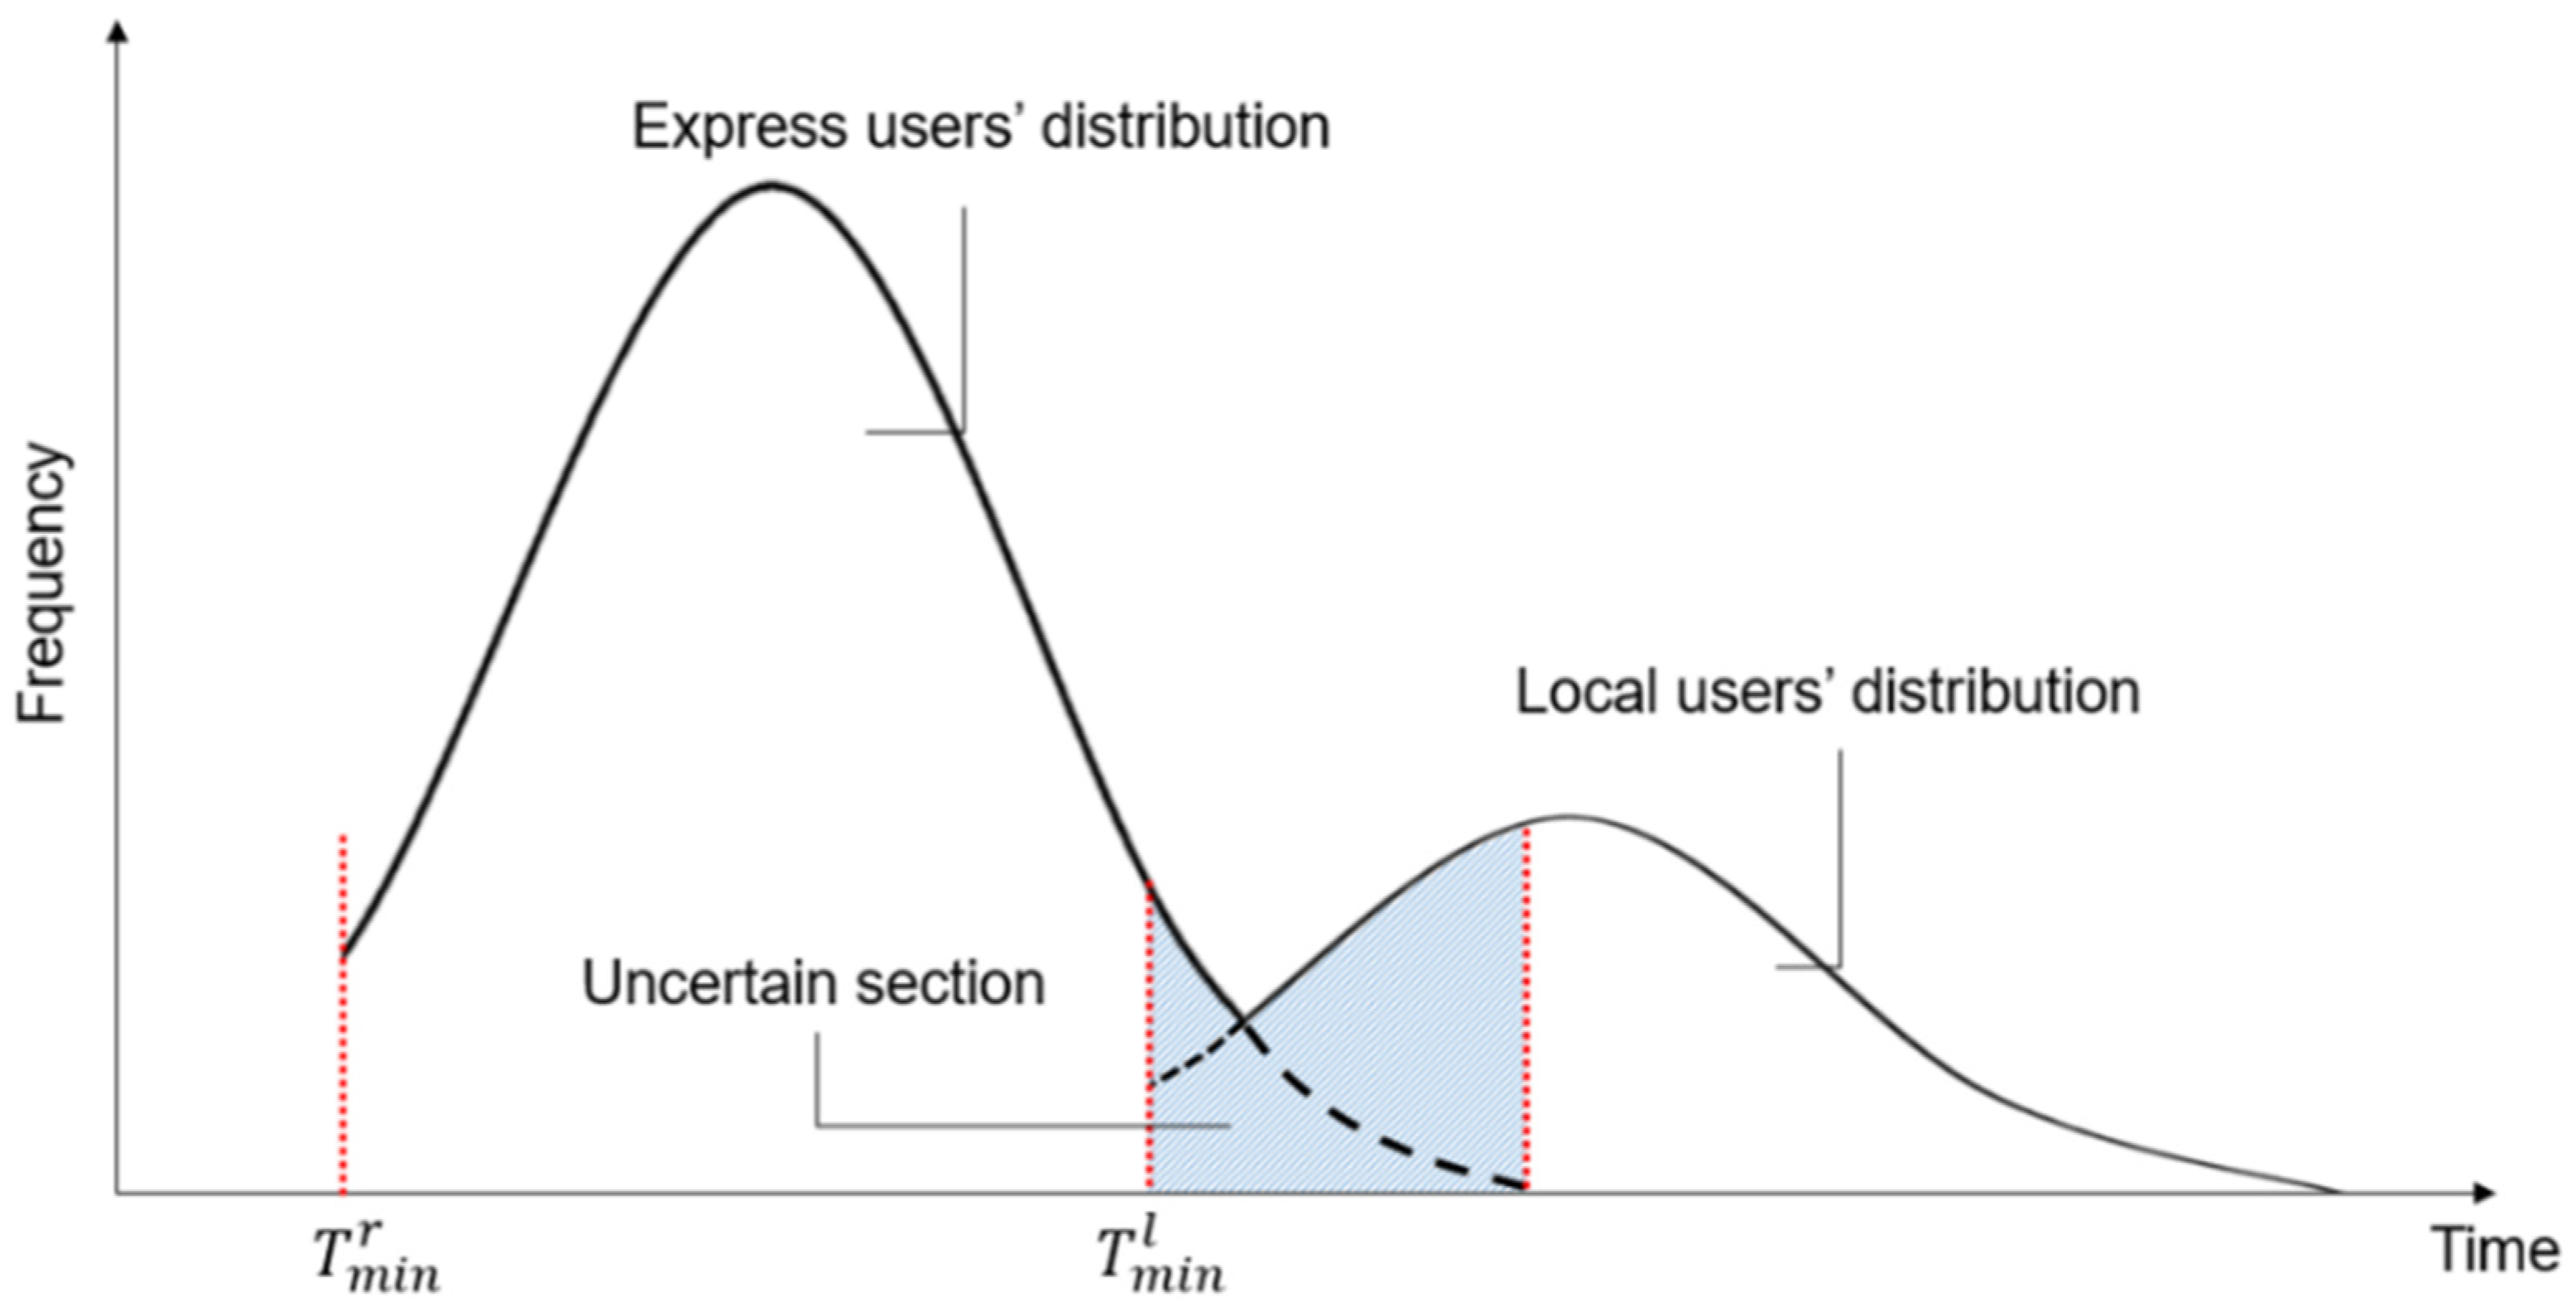
In a network that operates express strategy, the travel time distribution is shown as a bimodal form because the travel time distribution of the express train and local train are mixed. Figure 3 shows that the travel time distribution of O-D for the skip-stop railway system is a mixed distribution of the distributions of an express train and a local train. There are two peaks on the distribution, which are the express travel time and local travel time, respectively. The peak of the left side of the mixed distribution is for the express train distribution and the peak of the right side of the mixed distribution is for the local train distribution. Since two distributions are mixed, there is an overlapping part of the distribution. On the uncertain section, which is shown with the shaded area, the distribution is illustrated as overlapping. To understand the passenger’s behavior concerning train choice, it is essential to decompose the distribution curves of the overlapping sections. Decomposition of the mixed distribution provides information on the probability of train choice behavior (express or local). Since distributions by O-D pairs do not appear as the same type, a stochastic approach is required to calculate the respective travel times of the local train passengers and the express train passengers for the O-D pair. Previous studies analyzed the skip-stop strategy with the deterministic assumptions [13,14,15]. For example, the travel times of one station is fixed to three minutes. However, in the real world, passengers’ travel times are different even with the same O-D. This indicates that passengers’ travel behaviors occur stochastically. Regarding the skip-stop strategy, some only take the express train, while others take the local train. The proposed approach stochastically considers the traffic volume of O-D according to the travel time.
As previously mentioned, the distribution of the travel time appears in a bimodal form and can be separated depending on the choice of the trains to identify the travel behaviors. The GMM assumes that all of the data points are generated from a mixture of a finite number of Gaussian distributions with unknown parameters. Since the smartcard data can only provide the passenger’s travel time to understand the travel behavior, GMM is reasonable for estimating the unknown multivariate distribution parameters of the train choice behavior [20]. In Equation (1), three parameters, i.e., , , and are updated based on the empirical method algorithm, and the estimations of the probability of travel time, can be obtained via one of several estimators, such as the mean or maximum of the posterior distribution. The formulation of GMM is as shown in Equation (1).
where, is the parameter of distribution of observation associated with travel time, is the vector of travel time, is the sum of the number of the mixture, is the number of the mixture (:1, …, ), is the weight of the mixture , is the number of travel time observations, is the mean travel time.
2.4. Multinomial Logit Model for Estimating Travel Behavior
The mode choice model is used to analyze and predict a passenger’s choice of one alternative from a finite set. Since many behavioral responses are discrete or qualitative in the transportation field, mode choice models have various applications [24,25,26]. It corresponds to choices of one or another of a set of alternatives. This estimates a mode choice probability according to the variables.
The multinomial logit model (MNL) is the most representative model for discrete choice analysis in the train choice problem [27]. We employ the model to analyze the relationships between the dependent variable and a set of independent variables. The response models can be classified into two distinct types, depending on whether the dependent variable has an ordered or an unordered structure. Since passengers may not only choose the minimum travel time in the real world, train choice behavior must be identified. In order to consider travel behavior, it is necessary to estimate the utility of train choice behavior. With the railway service, the utility of the train choice is affected by various factors, such as time value, congestion, and comfort. As illustrated above, the probability of train choice behavior was estimated with the GMM, and it provides an opportunity to estimate utility parameters. The logit model with travel time as the independent variable is shown in Equation (2):
where, is the exponential of the utility function for each type of train, is the type of train, is the alternative specific constant, is the coefficient of travel time, is the travel time for each type of train, k, from station to station , is the probability of alternative for individual , is a set of types of trains.
2.5. Mathematical Formulation for Skip-Stop Strategy
This section presents the formulation of the skip-stop strategy model to apply to urban railway networks. With the GMM and logit model mentioned above, the travel behavior of the skip-stop strategy is reflected to the proposed formulation. The travel behavior of skip-stop strategy is identified by the GMM model, separating the travel time distribution. With the decomposed distribution, the utility parameter of travel time for train choice behavior is estimated by the logit model.
The primary objective of this model is to minimize passengers’ total travel time while taking into consideration their actual behaviors. Since the travel time of each O-D pair is changed when the skip-stop strategy is calculated, the demand flow of station is also changed by the estimated utility parameter. The designation of the station is based on minimizing the passenger’s total travel time, as shown in Equation (4). Equation (5) represents the total travel time, expressed as the multiplication of the demand flow and the passenger’s travel time between station and station :
where, is the decision variable that determines whether or not trains are to be skipped ( is 1 if an express train stops at station ; otherwise, it is 0.), is the demand flow rate of station to , and is the travel time from station to .
Travel time consists of the sum of the maximum speed time of the moving train, dwelling time, acceleration time, overtaking time, and waiting time, as shown in Equation (6):
where, is the travel time from station to , is the maximum speed travel time from station to , is the dwell time at station , is the safety distance (time) between local and express train at station , is the acceleration speed of the train, is the overtaking time of the express train at station , and is the waiting time for riding the train.
The most crucial formulation is Equation (7), which reflects the train choice behavior of the passenger. The results of GMM and MNL are considered in Equation (7). O-D ridership volume, local train choice probability, and express train choice probability are calculated using the estimated utility parameter, and the probability according to the type of train is expressed as the rate of flow:
where, is the demand flow rate of station to , is the estimated exponential of utility the of the local train , and is the estimated exponential of the utility of the express train .
Since skip-stop allows for express trains to skip local stations, the distance to the local train ahead becomes shorter than the safety distance. Equation (8) sets the safe distance (time) required between the two trains to prevent a collision as follows:
where, is the safety distance (time), is the travel time of the express train, is the travel time of the local train, and is the interval with the local train when the express train departs at station .
Equation (9) ensures the appropriate overtaking time that allows for the express train to overtake the preceding local train at the station where the auxiliary rail is installed. The overtaking time is the maximum time that it takes for an express train to overtake a local train at the station:
where, is the overtaking distance (time), is the travel time of the express train, is the travel time of the local train, is the interval with the local train when the express train departs at station , and is a set of the stations where siding tracks are installed.
Equation (10) describes the waiting time as the minimum time between half of the headway or maximum time of six minutes [12]. In general, the waiting time of the local train is set to half of the headway. However, the passenger who rides the express train has less waiting time than half of the headway, since the express train has a two to three times longer headway than the local train. Considering the passenger characteristics, the minimum waiting time is set to half of the headway and the maximum waiting time is set to 5 min:
where, is the waiting time of the passenger at station , and is the headway of the train at station .
The travel time is classified as the travel time of the local train and the travel time of the express train to identify the passenger route choice. The travel time of the local train is defined as the time that the passenger travels only riding the local train. The travel time of the express train is defined as the time that the passenger travels on an express train, including the transfer time between local trains and express trains at express stations. Equations (11) and (12) are the mathematical formulation of the travel time of the local train and the express train, respectively. In Equation (11), the travel time consists of the time with a maximum speed of the moving train, dwelling time, acceleration, deceleration time, waiting time and overtaking time. In Equation (12), there is no overtaking time. Since local trains wait at an overtaking siding track while the express trains pass, overtaking times are only included in the travel times of the local trains:
where, is the travel time from station to station using the train type or , is the express train, is the local train, is the in-vehicle time from station to station , is the dwell time of the traversing stations by train type, is the acceleration time, is the waiting time at station , is the overtaking time for the local train when the express train overtakes, and is the safety time for the express train before overtakes local train.
3. Empirical Analysis
3.1. Description of Test Network (Seoul Metro Bundang Railway Line)
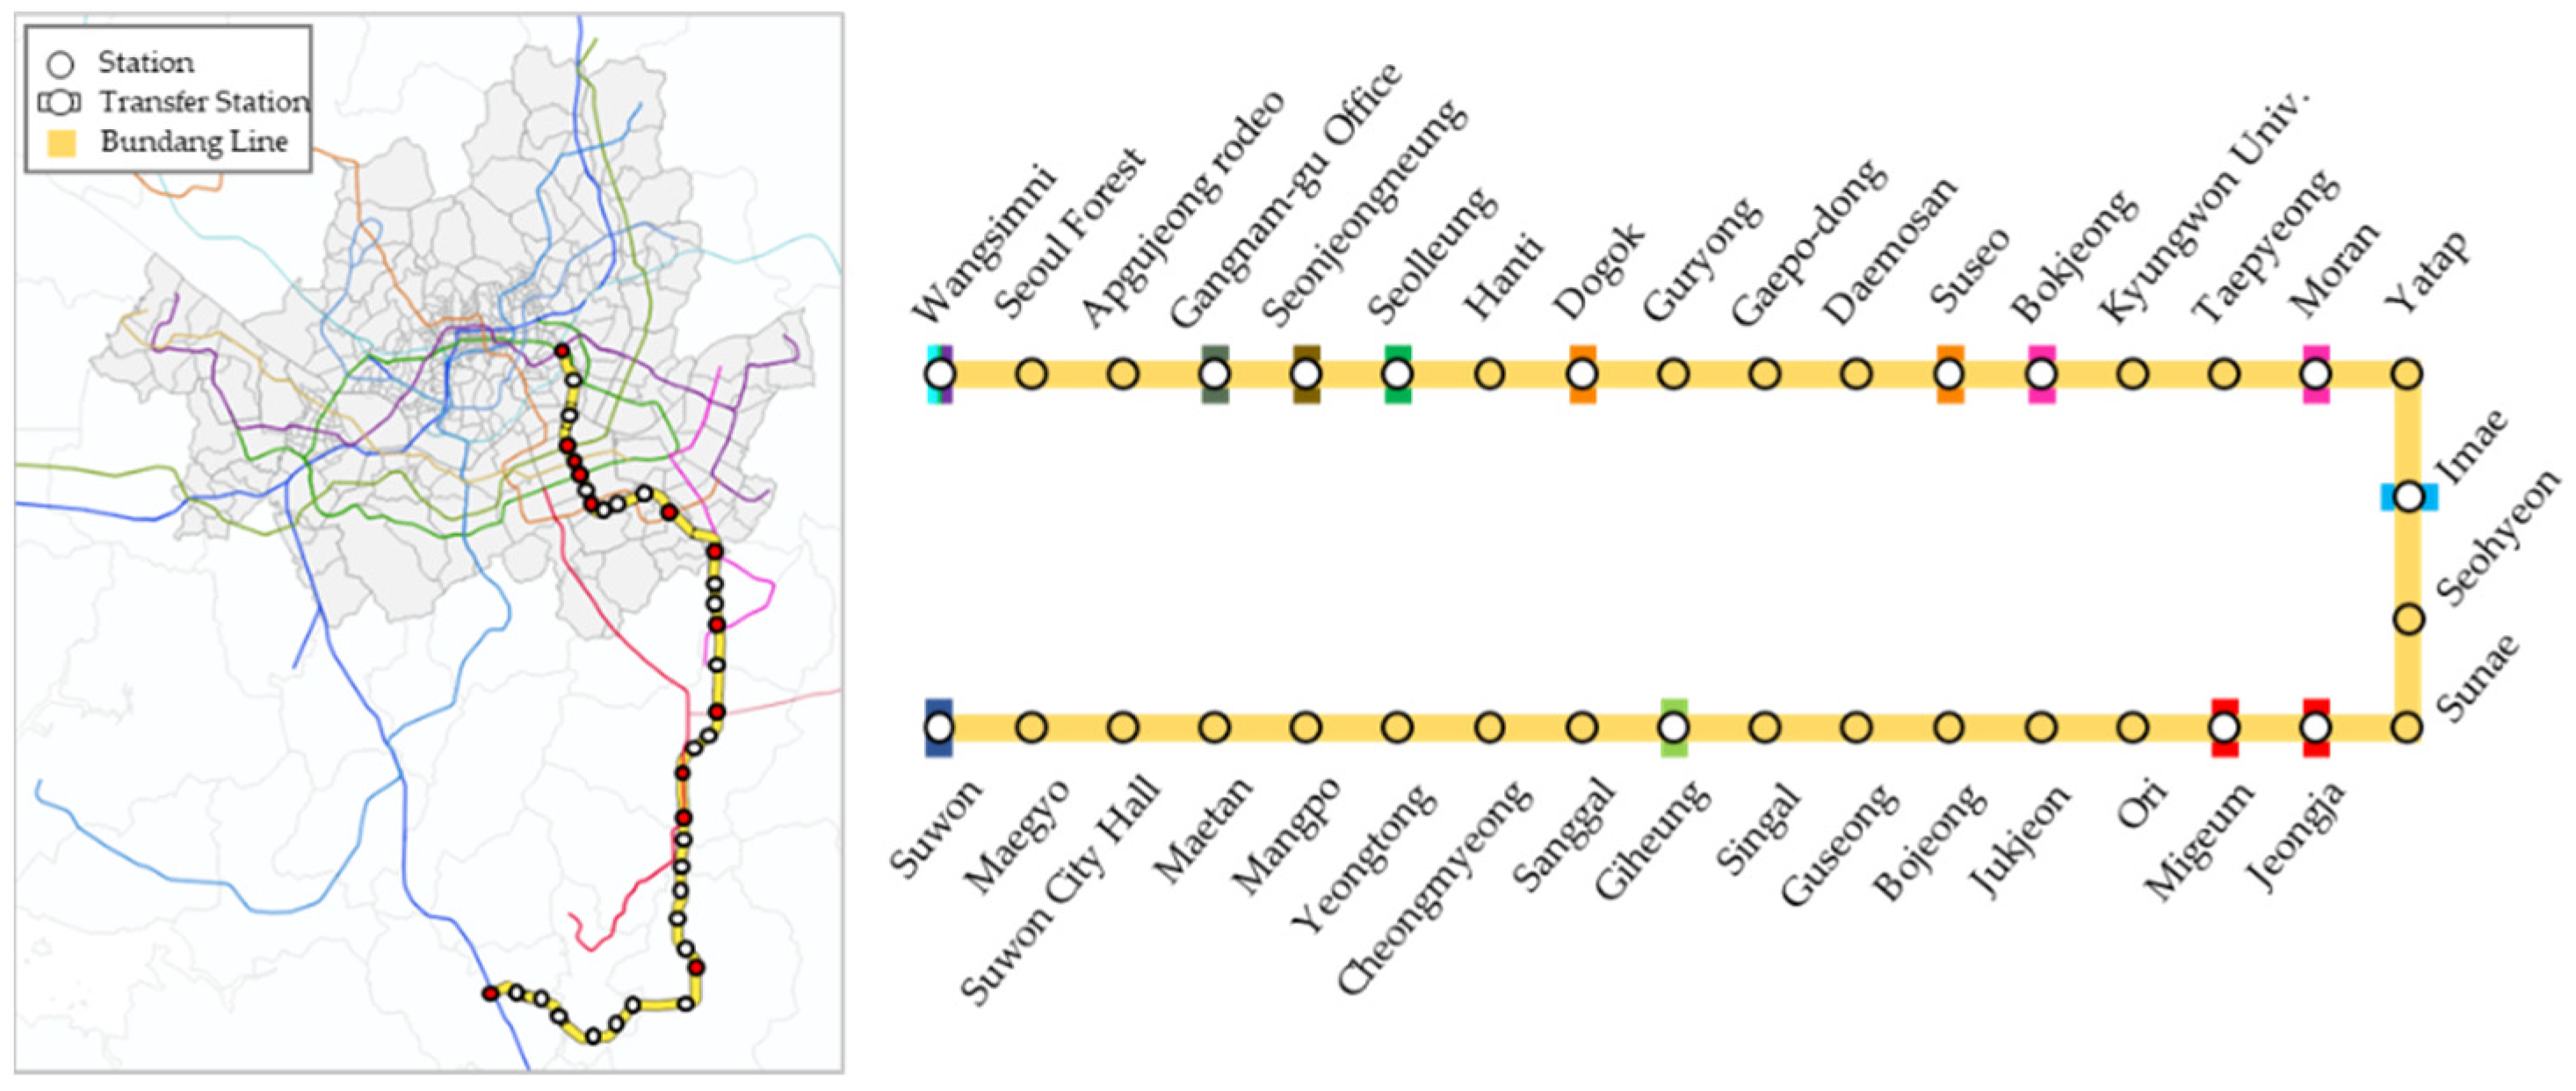
In 2017, The Ministry of Land, Infrastructure, and Transport announced a master plan for the metropolitan railway to apply the skip-stop strategy. The Bundang railway line was one of the major lines mentioned in the plan, as it connected the outer district, the city of Suwon, to Seoul. Bundang railway line introduced the skip-stop strategy from the Suwon-to-Jukjeon section in 2013, and it operated only 12 times a day by designating five express stations (i.e., Suwon, City Hall, Mangpo, Kiheung, and Jukjeon stations). The local train took 86 min through the start-to-end station of a total of 36 stations, i.e., 52.9 km. The express train took 75 min through the start-to-end station of a total of 28 stations. The expansion of the express stations was under consideration since there was only a 11 min difference between taking the local train and taking the express train. There was a plan to introduce the skip-stop strategy in 2022 for the entire Bundang railway line. Since some sections already operated using the skip-stop strategy, it was essential to designate additional express stations. As mentioned above, the Bundang railway line was a good example of the application of the skip-stop strategy, which was modeled in this study. The network of Bundang railway was shown in Figure 4.
3.2. Description of the Smartcard Data
The government of Seoul introduced automatic toll collection (AFC) based on smartcards in 2004. The smartcard data of Seoul contained individual information for about 14.5 million trips per day, providing 99% of individual transit passenger trip information. Since the smartcards used in Seoul include traffic information for all passengers of public transit, the smartcard data were suitable for analyzing passengers’ travel behaviors [28,29,30]. In the case of the urban railway trip information, the smartcard data only recorded the origin and destination station of the passenger trip. For this reason, estimating the traveled train and route of the urban railway related study has been conducted in recent years.
In this study, we analyzed the optimal skip-stop strategy for minimizing the passengers’ total travel time using smartcard data, which provides the opportunity for considering travel behaviors. To analyze the optimal skip-stop strategy, we developed an O-D matrix of all stations in the Bundang line using smartcard data, and the ratio of train choice behavior was also estimated based on the smartcard data. The smartcard data used in this study was from 31 October 2017. It contains 24 columns of information, of which, eight indices were selected, i.e., card ID, boarding station ID, boarding time, alighting station ID, alighting time, total travel distance, total travel time. The data extracted from the smartcard were used to construct the primary dataset, i.e., individual travel time and ridership of the O-D matrix. The eight indices of smartcard data used in this study are shown in Table 1.
3.3. Estimation of Parameters of Passengers’ Mode Choice Behavior
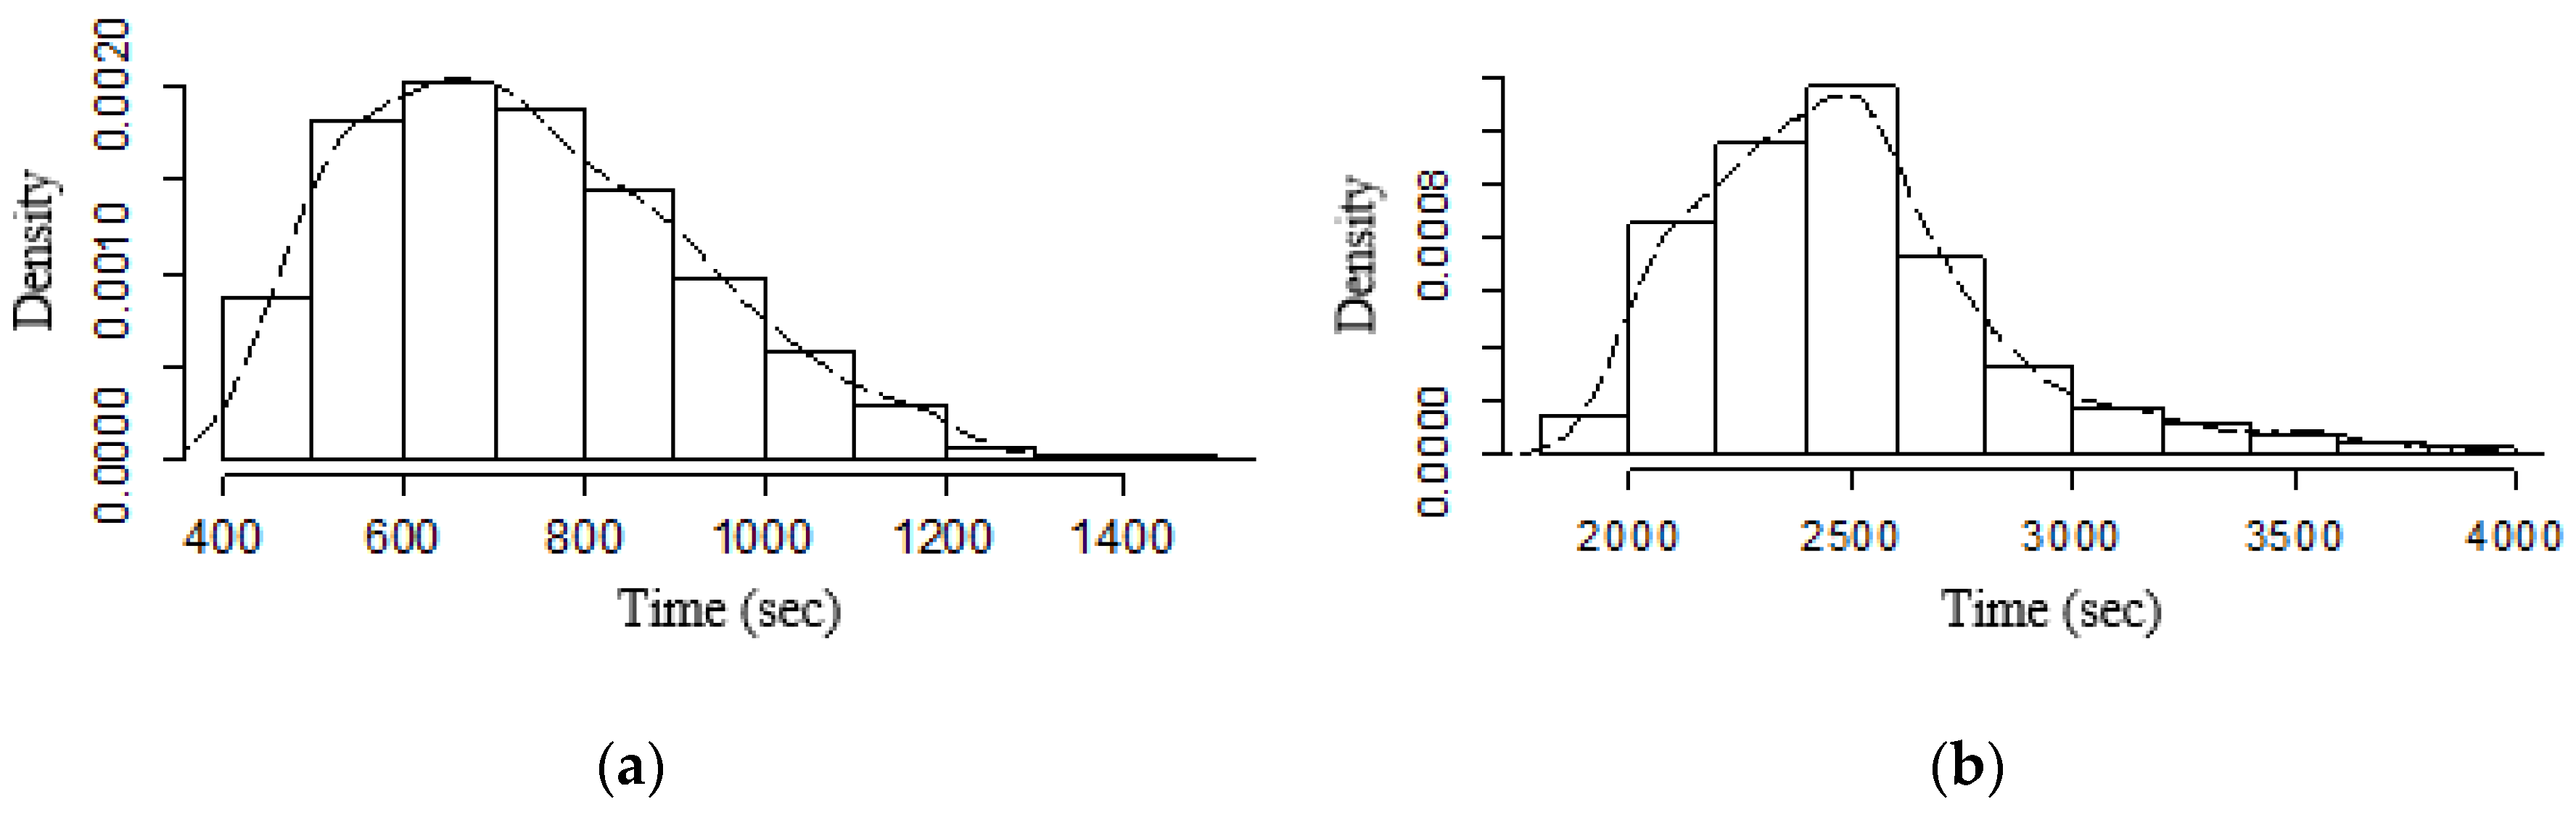
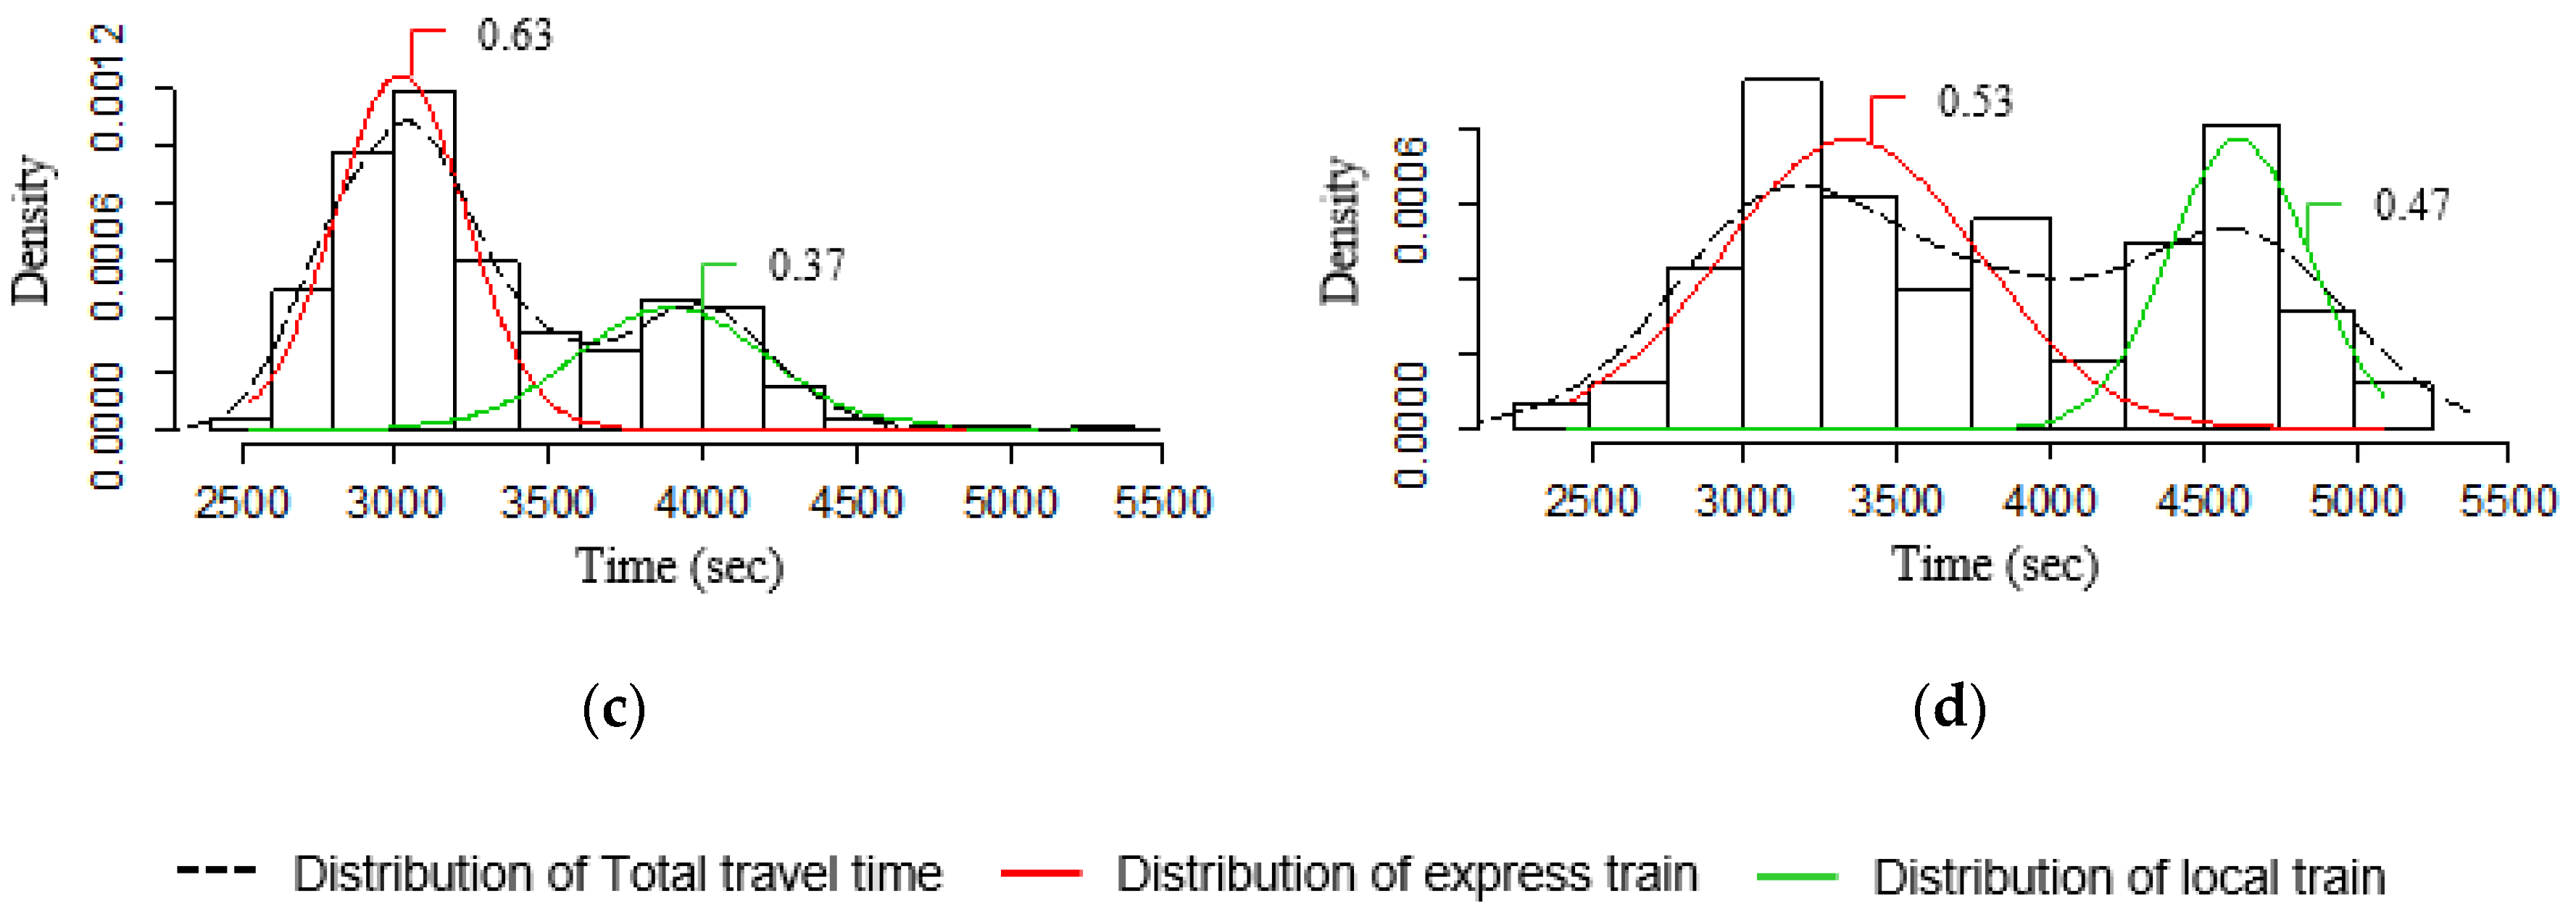
The travel time was calculated considering the ratio of four passengers’ choice behaviors. GMM indicated that the train choice probabilities varied depending on the distance and the travel time between station and station . Figure 5 illustrated the train choice probabilities according to the four passenger travel behaviors. Two overlapping distribution curves were drawn, except for the station O-D pairs connected by passengers that rode one type of train. Figure 5a,b represented a single peak travel time distribution of the passengers that take one type of train only. Figure 5c,d conversely showed the double peak distribution of train choice probabilities. For the one transfer trips of Figure 5c, the choice probabilities of the express and the local train by GMM were estimated to be 0.63 and 0.37, respectively. For the two transfer trips of Figure 5d, GMM estimated the choice probabilities of the express and the local train as 0.53 and 0.47, respectively. According to the passengers’ train choice behaviors, the graph showed the apparent total frequency of local trains and express trains.
Based on the individual smartcard data, the train choice ratio varied according to the distance and the travel time between stations. Utility parameters of MNL were estimated by the GMM results using 0.6 million individual trips extracted from the smartcard data of railway line 9, where the skip-stop strategy has been already been operational. The parameters were applied to estimate the train choice probability of each station O-D pair in the Bundang line. The parameters of the utility functions are shown in Table 2. As a result of the utility function, the parameter of travel time () was estimated to be −0.03. Since the utility increases as the travel time decreases, the minus sign (-) of the estimated parameter of travel time was shown to be reasonable. The p-value is estimated to be less than 0.001, which is statistically significant at the 99% confidence level. The Pseudo is estimated to be 0.41, which is about 41% explanatory power:
where, is the utility function for each type of train, is the type of train (express train: , local train: ), and is the travel time of each train between station to station .
3.4. Results of Designating Express Stations for the Skip-Stop Strategy
The performance of the proposed passenger travel behavior-based strategy was evaluated by comparing two empirical strategies which were used in the practical field, i.e., transfer station-based strategy and the high ridership-based strategy. The transfer station-based strategy was a widely used method for designing the skip-stop strategy. It designated all of the transfer stations as express stations. The Korea Rail Network Authority also arranged the stations by high ridership order and designated the stations with high ridership as express stations up to the station with the most significant difference in ridership.
As a result of the transfer station-based strategy (TBS), 13 stations were designated as express stations. Regarding the connectivity of the transfer stations, it was reasonable to designate transfer stations as express stations. The travel time of the transfer station-based strategy was estimated to be 21.2 min/person, and it saved as much as 5.8% of the travel time compared to the current system of the Bundang Line. With the results of the high ridership-based strategy (RBS), nine stations were designated as express stations, shown in Table 3. Seven transfer stations within the designated express stations had more than 59,687 daily trips. The other two express stations also had more than 61,217 daily trips. The travel time was estimated to be 19.7 min/person. Compared to that of the current system, this saved as much as 12.2% of the total travel time.
In the passenger travel behavior-based strategy (PBS) which was proposed in this study, the express stations were found using mathematical formulations of Equations (4) through (13). The primary objective of this model was to minimize passengers’ total travel time while taking into consideration their actual behaviors. The express stations were designated based on minimizing the passengers’ total travel time as shown in Equation (4). Passenger behavior on train choice was reflected in constraint Equation (7). The train choice probability of the local and the express train was estimated based on the utility parameters of Equation (13), which is estimated by GMM and MNL. As a result of the travel behavior-based strategy, 12 stations were designated as express stations, and the travel time was estimated to be 18.7 min/person. The ratio of saved travel time was analyzed as 17.9%, in comparison to the current system. The PBS strategy showed notable performance among the other empirical strategies, i.e., TBS, RBS. Among the 12 designated express stations, nine stations were identical to the results of TBS and RBS. The newly designated express stations were only three stations, i.e., station number 24, 32, and 34. Compared to the local stations, the features of express stations are totally different, particularly given the low density and mono-functional land use of the first ones. Since the PBS optimized the skip-stop strategy based on the O-D pattern, many of the transfer stations and high ridership stations with active urban activities were included in the express stations. Figure 6 shows the designated express stations using the proposed strategies, and Table 4 shows the performance of each strategy.
The energy consumption was measured to evaluate the sustainability of the PBS strategy, which is the optimal strategy in this study. The evaluation was performed by comparing the energy consumption of the PBS strategy to that of the current system. The energy consumption data was generated by referring to the data of Line 5 and Line 8, since the statistics of Bundang line was not provided. There are two considerations for energy consumption in the railway strategy, i.e., energy consumption of train and system maintenance. The energy consumption of a train consists of powering, and regenerated energy. Powering energy is the power consumed when the train accelerates and the regenerated energy is the power stored during braking. That is, the train consumes energy at the time of accelerating and stores the energy power at the time of braking. The energy consumption of maintenance is the power consumed to operate the railway system, such as rail road. The total energy consumption of the strategy, therefore, is calculated by subtracting the regenerated energy from the sum of the powering and maintenance energy. The most crucial factor of the energy consumption of train is the ratio of the regenerated energy from the powering energy. The ratio of the regenerated energy of Seoul metro is about 45.8% from the powering energy [31]. The mathematical expression of the total energy consumption is shown in Equation (14):
where, is total energy consumption of the train, is the number of stations, is the powering energy of the strategy, is the regenerated energy of the strategy, is the maintenance energy of the strategy, and is the distance of the station to .
As a result of energy consumption evaluation of the Bundang line, total energy consumption of the PBS strategy was estimated to be 305,437 (kWh), which is about 12.7% lower than the current system. Since the trains of the current system stop at 36 stations with 35 links, the consumption of the powering energy occurs 35 times. However, the express trains of PBS strategy stop at 12 stations with 11 links. With the PBS strategy, the energy consumption could be decreased, since 33% of the local trains were switched to the express trains.
In order to estimate the GHG emissions, the conversion factors of 0.459 of CO2 (t/MWh), 0.0052 of CH4 (kg/MWh), 0.004 of N2O (kg/MWh), and 0.46 of CO2e (t/MWh) were applied in this study. These factors are provided by the National Institute of Environmental Research (NIER) of South Korea. As results of the GHG emissions from the PBS strategy, the CO2, CH4, N2O, and CO2e were estimated to be 140.2 ton/day, 1.6 kg/day, 1.2 kg/day, 140.5 ton/day, respectively. These results were also shown to be 12.7% lower than the current system. The environmental conversion cost of CO2, $20.11/ton, is also provided by NIER. The environmental cost of the current system and the PBS strategy were estimated to be $3230 per day and $2819 per day, respectively. These results indicate that the sustainability of the proposed skip-stop strategy is significant enough with the 12.7% reduced environmental cost. The results of the sustainability performances are shown in Table 5.
4. Discussion
4.1. Statistical Difference Test of Saved Travel Time between Current System and PBS
Statistical difference test was performed to determine the significance of the saved travel time produced by the passenger travel behavior-based strategy against those of the current system. We analyzed the differences in travel time by comparing the travel time of the proposed strategy to that of the current system for each of the 664,572 passengers. In-vehicle time was calculated as the sum of the maximum speed time of the moving train, dwelling time, safety time, acceleration time, deceleration time, and overtaking time. Waiting time was the time required for the passenger to wait for the coming train or transfer to the train. The total travel time was the sum of in-vehicle time and waiting time multiplied by the number of passengers of each O-D pair.
Figure 7 represented the travel time distributions of 664,572 passengers on the Bundang line for the current and the proposed strategy, e.g., in-vehicle time, waiting time, and total travel time. The distributions of in-vehicle time represented the shorter time in passenger based- model than that of the current network due to the applying for the express train system. Since the passenger-based model applied the different waiting time in the express and local train, the distribution of waiting time in the passenger-based model had the shape of a bimodal distribution. Due to the in-vehicle and waiting time, the distribution of total travel time in the passenger-based model was derived for more positively skewed distribution than that of the current network. It was possible to identify the characteristics of applying for the express train system from the distributions of travel time of individual passengers.
We performed the t-test to analyze the statistical significance for the difference of the mean of the in-vehicle time and waiting time. Statistical significance was also confirmed using the chi-squared test to verify the distribution of variations for 42,090 h of the total saved travel time between the passenger travel behavior-based strategy and the current system. The results of t-test show that the average in-vehicle time was decreased by 4.2 min while the average waiting was slightly increased by 0.4 min for the 664,572 passengers. The t-statistics and the p-value of the saved in-vehicle time were estimated to be 352.7 and 0.001 respectively, with statistical significance. The waiting time was slightly increased, and statistically significant, since the t-statistics and the p-values were estimated to be −495.2 and 0.001 respectively. By the t-test for the total travel time, the t-statistics and the p-value were estimated to be 383.8 and 0.001, respectively. The statistical significance of the travel time difference between the passenger travel behavior-based strategy and the current system was also verified with the significance level of 0.001. By the chi-squared test the variation of the total travel time distributions between the passenger travel behavior-based strategy and the current system was also verified with the significance level of 0.001. Based on the statistical difference test, it was possible to confirm that the trade-off relationship between in-vehicle time and waiting time was established in the skip-stop strategy. The results of the statistical difference test are shown Table 6.
4.2. Comparison with Other Strategies
In order to identify the performance of the proposed model, we conducted a comparison with the strategy developed in the previous studies. Since the analysis environment for each model is different, a direct comparison is difficult. However, the evaluation could be indirectly compared through a comparison of the same measures of effectiveness. The four-comparison model was selected from the previously reviewed studies, which have objective functions to minimize the travel times [12,13,14,15].
The strategy for the Seoul subway Line 5 was designed for minimizing the total travel time and the waiting time, and the travel time was reduced by about 12.9% [12]. The strategy for the Seoul subway Line 4 was minimizing the total travel time and the travel time was reduced by about 17.1% [13]. Two strategies for the Shenzhen Metro developed models were to minimize total travel time, reducing travel time by 4.8% and 16.2%, respectively [14,15]. The proposed model in the study showed the 17.9% saved travel time of Bundang line in Seoul.
As results of comparisons to other studies [12,13,14,15], PBS demonstrated the best performance which saved travel time of approximately 17.9%. In the comparative models, it is assumed that the passengers are rational in travel and this model does not take into account the passengers’ probabilistic traffic behavior. On the other hand, in reality, the passenger’s irrational passages are probabilistic. Many studies have designed the objective function to minimize the passenger’s travel time for skip-stop optimization, but have limitations in not considering the passenger’s traffic behavior. The proposed model reflects the passengers’ travel behavior, which is not taken into account in other previous studies and is derived as a more beneficial strategy in terms of passengers. Although the proposed model considers the behavior of the passenger, it is necessary to consider other factors such as operating costs and environmental costs. Table 7 shows the comparison results between PBS and other strategies of previous studies.
5. Conclusions
The skip-stop strategy allows for the simultaneous operation of both express and local trains on the same railway line in the urban railway network. The main idea of the skip-stop approach is to reduce the total travel time by allowing express trains to skip the local stations which have low ridership along a railway line
In this study, we proposed an optimal skip-stop strategy that considers four types of travel behaviors. We analyzed the optimal solution to derive the stations of the skip-stop, applying a genetic algorithm. The mixed travel time distribution of O-D pairs from the smartcard data was decomposed by two distributions for express trains and local trains based on the GMM. The performance of the passenger travel behavior-based strategy which is proposed in this study was evaluated by comparing the two empirical strategies. Results indicated the travel time of the transfer-based strategy and the high ridership-based strategy were estimated to be 21.2 and 19.7 min/person respectively. It was shown to save as much as 5.8% and 12.2% of the travel time compared to the current system. In the travel behavior-based strategy, the express stations were designated based on minimizing the passengers’ total travel time. The choice probabilities of the local and the express train were calculated based on the utility parameters estimated by GMM and MNL. The average travel time of 664,571 passengers was estimated to be 18.7 min, and the ratio of saved travel time was analyzed as 17.9% compared to the current system. It showed that the passenger travel behavior-based strategy had the most notable performance among the proposed strategies. A statistical test was also performed to determine the significance of the saved travel time produced by the passenger-based strategy against those of the current system. We performed the t-test to analyze the statistical significance for mean differences of riding and waiting time. The results showed that the average in-vehicle time was decreased by 4.2 min, while the average waiting was slightly increased by 0.4 min for the passengers. Based on the test of statistical difference, we confirmed that the trade-off relationship between in-vehicle time and waiting time was established in the skip-stop strategy. In terms of sustainability, the PBS also saved the energy consumption and GHG about 12.7%, compared to the current system. Although our optimal strategy accomplished what others have not done before, such as reflecting travel behaviors in optimizing the skip-stop strategy, there were still many considerations that were not taken into account. Those include the capacities of the trains, time-dependent operation, individual passenger’s waiting time, transfer time, toll gate-to-platform access time, and so on. Future work is on-going to include train/time conditions and more specific components of the travel behaviors to the skip-stop strategy. Regarding sustainability, it is also possible to optimize the skip-stop strategy which minimizes the energy consumption and GHG emissions.
Author Contributions
Conceptualization, E.H.L., D.-K.K.; methodology, E.H.L., S.-H.C., and D.-K.K.; validation E.H.L. and I.L.; formal analysis, E.H.L., S.-H.C., and S.-Y.K.; data curation, S.-H.C. and I.L.; writing-original draft preparation, E.H.L., S.-H.C. and I.L.; writing—review and editing, D.-K.K. and S.-Y.K.; supervision, D.-K.K.; project administration, D.-K.K.; funding acquisition, D.-K.K. All authors reviewed the results and approved the final version of the manuscript.
Funding
This research was supported by a grant from R&D Program of the Korea Railroad Research Institute, Republic of Korea.
Conflicts of Interest
The authors declare no conflict of interest.
References
- Yu, X.; Lang, M.; Gao, Y.; Wang, K.; Su, C.H.; Tsai, S.B.; Li, S. An Empirical Study on the Design of China High-Speed Rail Express Train Operation Plan—From a Sustainable Transport Perspective. Sustainability 2018, 10, 2478. [Google Scholar] [CrossRef]
- Wang, H.; Yang, X.; Wu, J.; Sun, H.; Gao, Z. Metro timetable optimisation for minimising carbon emission and passenger time: A bi-objective integer programming approach. IET Intell. Transp. Syst. 2018, 12, 673–681. [Google Scholar] [CrossRef]
- Wang, Y.; De Schutter, B.; van den Boom, T.J.; Ning, B.; Tang, T. Efficient bilevel approach for urban rail transit operation with stop-skipping. IEEE Trans. Intell. Transp. Syst. 2014, 15, 2658–2670. [Google Scholar] [CrossRef]
- Vuchic, V.R. Urban Transit Systems and Technology; Wiley: Hoboken, NJ, USA, 2007. [Google Scholar]
- Lee, Y.-J.; Vuchic, V.R. Transit Network Design with Variable Demand. J. Transp. Eng. 2005, 131, 1–10. [Google Scholar] [CrossRef]
- Lin, D.-Y.; Ku, Y.-H. Using Genetic Algorithms to Optimize Stopping Patterns for Passenger Rail Transportation. Comput. Aided Civ. Infrastruct. Eng. 2013, 29, 264–278. [Google Scholar] [CrossRef] [Green Version]
- Nachtigall, K.; Voget, S. Minimizing waiting times in integrated fixed interval timetables by upgrading railway tracks. Eur. J. Oper. Res. 1997, 103, 610–627. [Google Scholar] [CrossRef]
- Chakroborty, P.; Wivedi, T. Optimal Route Network Design for Transit Systems Using Genetic Algorithms. Eng. Optim. 2002, 34, 83–100. [Google Scholar] [CrossRef]
- Niu, H.; Zhou, X. Optimizing urban rail timetable under time-dependent demand and oversaturated conditions. Transp. Res. Part C Emerg. Technol. 2013, 36, 212–230. [Google Scholar] [CrossRef]
- López-Ramos, F.; Codina, E.; Marín, Á.; Guarnaschelli, A. Integrated approach to network design and frequency setting problem in railway rapid transit systems. Comput. Oper. Res. 2017, 80, 128–146. [Google Scholar] [CrossRef]
- Suh, W.; Chon, K.-S.; Rhee, S.-M. Effect of Skip-Stop Policy on a Korean Subway System. Transp. Res. Rec. 2002, 1793, 33–39. [Google Scholar] [CrossRef]
- Lee, Y.-J.; Shariat, S.; Choi, K. Optimizing Skip-Stop Rail Transit Stopping Strategy using a Genetic Algorithm. J. Public Transp. 2014, 17, 135–164. [Google Scholar] [CrossRef] [Green Version]
- Zhang, P.; Sun, Z.; Liu, X. Optimized Skip-Stop Metro Line Operation Using Smart Card Data. J. Adv. Transp. 2017, 2017, 3097681. [Google Scholar] [CrossRef]
- Luo, Q.; Hou, Y.; Li, W.; Zhang, X. Stop Plan of Express and Local Train for Regional Rail Transit Line. J. Adv. Transp. 2018, 2018, 3179321. [Google Scholar] [CrossRef]
- Niu, H. Determination of the Skip-Stop Scheduling for a Congested Transit Line by Bilevel Genetic Algorithm. Int. J. Comput. Intell. Syst. 2011, 4, 1158. [Google Scholar] [CrossRef]
- Pham, D.; Karaboga, D. Intelligent Optimisation Techniques: Genetic Algorithms, Tabu Search, Simulated Annealing and Neural Networks; Springer Science & Business Media: Berlin, Germany, 2012. [Google Scholar]
- Bashiri, M.; Rezanezhad, M.; Tavakkoli-Moghaddam, R.; Hasanzadeh, H. Mathematical modeling for a p-mobile hub location problem in a dynamic environment by a genetic algorithm. Appl. Math. Model. 2018, 54, 151–169. [Google Scholar] [CrossRef]
- Hwang, J.; Lee, J.S.; Kho, S.Y.; Kim, D.K. Hierarchical hub location problem for freight network design. IET Intell. Transp. Syst. 2018, 12, 1062–1070. [Google Scholar] [CrossRef]
- Lao, Y.; Zhang, G.; Corey, J.; Wang, Y. Gaussian Mixture Model-Based Speed Estimation and Vehicle Classification Using Single-Loop Measurements. J. Intell. Transp. Syst. 2012, 16, 184–196. [Google Scholar] [CrossRef]
- Lee, M.; Sohn, K. Inferring the route-use patterns of metro passengers based only on travel-time data within a Bayesian framework using a reversible-jump Markov chain Monte Carlo (MCMC) simulation. Transp. Res. Part B Methodol. 2015, 81, 1–17. [Google Scholar] [CrossRef]
- Lee, E.H.; Lee, H.; Kho, S.Y.; Kim, D.K. Evaluation of Transfer Efficiency between Bus and Subway based on Data Envelopment Analysis using Smart Card Data. KSCE J. Civ. Eng. 2019, 23, 788–799. [Google Scholar] [CrossRef]
- Park, J.Y.; Kim, D.-J.; Lim, Y. Use of Smart Card Data to Define Public Transit Use in Seoul, South Korea. Transp. Res. Rec. 2008, 2063, 3–9. [Google Scholar] [CrossRef]
- Kroon, L.; Maróti, G.; Helmrich, M.R.; Vromans, M.; Dekker, R. Stochastic improvement of cyclic railway timetables. Transp. Res. Part B Methodol. 2008, 42, 553–570. [Google Scholar] [CrossRef] [Green Version]
- Fan, A.; Chen, X.; Wang, Y.; Kou, W. All-stop, skip-stop, or transfer service: An empirical study on preferences of bus passengers. IET Intell. Transp. Syst. 2018, 12, 1255–1263. [Google Scholar] [CrossRef]
- Lu, X.S.; Liu, T.L.; Huang, H.J. Pricing and mode choice based on nested logit model with trip-chain costs. Transp. Policy 2015, 44, 76–88. [Google Scholar] [CrossRef]
- Thrane, C. Examining tourists’ long-distance transportation mode choices using a Multinomial Logit regression model. Tour. Manag. Perspect. 2015, 15, 115–121. [Google Scholar] [CrossRef]
- Kim, K.M.; Hong, S.-P.; Ko, S.-J.; Min, J.H. Predicting Express Train Choice of Metro Passengers from Smart Card Data. Transp. Res. Rec. 2016, 2544, 63–70. [Google Scholar] [CrossRef]
- Song, J.Y.; Eom, J.K.; Lee, K.S.; Min, J.H.; Yang, K.Y. Public transportation service Evaluations utilizing Seoul transportation card data. Procedia Comput. Sci. 2015, 52, 178–185. [Google Scholar] [CrossRef]
- Jang, W. Travel Time and Transfer Analysis Using Transit Smart Card Data. Transp. Res. Rec. 2010, 2144, 142–149. [Google Scholar] [CrossRef]
- Hong, S.-P.; Min, Y.-H.; Park, M.-J.K.; Kim, M.; Oh, S.M. Precise Estimation of Connections of Metro Passengers from Smart Card Data. Transportation 2016, 43, 749–769. [Google Scholar] [CrossRef]
- Kim, G.; Lee, H. A Study on the Application of ESS on SeoulMetro Line 2. In Proceedings of the 2009 International Conference on Information and Multimedia Technology, Jeju City, Korea, 18–19 December 2009; IEEE: Piscataway, NJ, USA, 2009. [Google Scholar]
Figure 1.
Conceptual diagram of a skip-stop network.

Figure 2.
Process of the genetic algorithm for optimal skip-stop strategy.

Figure 3.
Example of travel time distribution of express and local train passengers.

Figure 4.
Network of the Bundang railway line.

Figure 5.
Train choice probability estimated by Gaussian mixture model (GMM): (a) Local train passengers; (b) Express train passengers; (c) Local and express train passengers (one transfer); (d) Local and express train passengers (two transfers).
Figure 5.
Train choice probability estimated by Gaussian mixture model (GMM): (a) Local train passengers; (b) Express train passengers; (c) Local and express train passengers (one transfer); (d) Local and express train passengers (two transfers).


Figure 6.
Optimal skip-stop strategies on the Bundang line: (a) Current system; (b) Transfer station-based strategy; (c) High ridership-based strategy; (d) Travel behavior-based strategy.
Figure 6.
Optimal skip-stop strategies on the Bundang line: (a) Current system; (b) Transfer station-based strategy; (c) High ridership-based strategy; (d) Travel behavior-based strategy.

Figure 7.
Travel time distributions of 664,572 passengers on the Bundang line (current system versus the travel behavior-based strategy): (a) In-vehicle time; (b) Waiting time; (c) Total travel time.
Figure 7.
Travel time distributions of 664,572 passengers on the Bundang line (current system versus the travel behavior-based strategy): (a) In-vehicle time; (b) Waiting time; (c) Total travel time.


Table 1.
Smart Card Data Information.
| No. | Data Information | No. | Data Information |
|---|---|---|---|
| 1 | Card ID * | 13 | Boarding station ID * |
| 2 | Transaction ID * | 14 | Boarding penalty |
| 3 | Passenger code | 15 | Boarding time * |
| 4 | Vehicle ID | 16 | Alighting date |
| 5 | Zone code | 17 | Alighting fare |
| 6 | Line ID | 18 | Alighting station ID * |
| 7 | Mode code | 19 | Alighting penalty |
| 8 | Company code | 20 | Alighting time * |
| 9 | Starting time | 21 | Number of transfers |
| 10 | Ending time | 22 | The number of passengers |
| 11 | Boarding date | 23 | Total travel distance * |
| 12 | Boarding fare | 24 | Total travel time * |
* represents data information used in this study.
Table 2.
Utility parameters for travel time.
| Variable | Coefficient | Standard Deviation | p-Value | Pseudo |
|---|---|---|---|---|
| Constant () | 9.19 | 0.31 | <0.01 | 0.41 |
| Travel time () | −0.03 | 0.01 | <0.01 |
Table 3.
Express Stations of the Optimal Skip-Stop Strategies.
| St. # | Ridership Trip/Day | Designated Express Station | St. # | Ridership Trip/Day | Designated Express Station | St. # | Ridership Trip/Day | Designated Express Station | ||||||
|---|---|---|---|---|---|---|---|---|---|---|---|---|---|---|
| TBS | RBS | PBS | TBS | RBS | PBS | TBS | RBS | PBS | ||||||
| 1 * | 94,250 | O | O | O | 13 * | 59,687 | O | O | 25 | 6283 | ||||
| 2 | 18,461 | 14 | 29,969 | 26 | 12,801 | |||||||||
| 3 | 37,322 | 15 | 32,175 | 27 | 10,947 | |||||||||
| 4 * | 61,164 | O | O | 16 * | 62,011 | O | O | O | 28* | 38,654 | O | O | ||
| 5 * | 31,714 | O | 17 | 65,377 | O | 29 | 13,063 | |||||||
| 6 * | 83,477 | O | O | O | 18 * | 32,356 | O | 30 | 11,119 | |||||
| 7 | 32,335 | 19 | 61,217 | O | O | 31 | 25,259 | |||||||
| 8 * | 40,166 | O | O | 20 | 32,941 | 32 | 34,819 | O | ||||||
| 9 | 5606 | 21 * | 84,478 | O | O | O | 33 | 22,211 | ||||||
| 10 | 7922 | 22 * | 50,453 | O | 34 | 30,389 | O | |||||||
| 11 | 7209 | 23 | 30,492 | 35 | 7913 | |||||||||
| 12 * | 38,128 | O | O | 24 | 42,871 | O | 36 | 83,280 | O | O | O | |||
*: 13 transfer stations of the Bundang line.
Table 4.
Performances of the optimal skip-stop strategies.
| Items | Current System | Empirical Strategy | Proposed Strategy | |
|---|---|---|---|---|
| TBS | RBS | PBS | ||
| Number of express stations | 5 | 13 | 9 | 12 |
| Total travel time (hours) (Saved travel time) | 249,214 ( - ) | 234,815 (▽14,399) | 218,201 (▽31,013) | 207,124 (▽42,090) |
| Travel time (min/person) | 22.5 | 21.2 | 19.7 | 18.7 |
| Saved travel time ratio (%) | - | 5.8 | 12.2 | 17.9 |
Table 5.
Sustainability performances of the optimal skip-stop strategies.
| Items | Current System | Proposed Strategy (PBS) | |||||
|---|---|---|---|---|---|---|---|
| Local | Express | Total | Local | Express | Total | ||
| Energy consumption (kWh/day) | Powering | 465,456 | 14,934 | 480,390 | 338,513 | 59,738 | 398,251 |
| Regenerated | 213,179 | 6,840 | 220,019 | 155,039 | 27,360 | 182,399 | |
| Maintenance | - | - | 82,120 | - | - | 82,120 | |
| Total | 334,397 | 15,560 | 349,957 | 243,198 | 62,240 | 305,437 | |
| Saved ratio (%) | - | - | - | - | - | 12.7 | |
| GHG emissions (per day) | CO2 (t) | 153.5 | 7.1 | 160.6 | 111.6 | 28.6 | 140.2 |
| CH4 (kg) | 1.7 | 0.1 | 1.8 | 1.3 | 0.3 | 1.6 | |
| N2O (kg) | 1.3 | 0.1 | 1.4 | 1.0 | 0.2 | 1.2 | |
| CO2e (t) | 153.8 | 7.2 | 161.0 | 111.9 | 28.6 | 140.5 | |
| Environmental cost ($/day) | Cost of CO2 | 3087 | 144 | 3230 | 2245 | 575 | 2819 |
Conversion factor: 0.459 of CO2 (t/MWh), 0.0052 of CH4 (kg/MWh), 0.004 of N2O (kg/MWh), and 0.46 of CO2e (t/MWh).
Table 6.
Results of the statistical difference test.
| Difference Test | Mean (min/person) | Standard Deviation | t-Statistics/ Pearson | Degrees of Freedom | p-Value | |
|---|---|---|---|---|---|---|
| t-test | Differences of in-vehicle time | 4.2 | 8.7 | 352.7 | 664,571 | <0.001 |
| Differences of waiting time | −0.4 | 0.7 | −495.1 | 664,571 | <0.001 | |
| Differences of Total travel time | 3.8 | 8.0 | 383.8 | 664,571 | <0.001 | |
| -test | Differences of Total travel time | 3.8 | - | 38,000,000 | 520,968 | <0.001 |
Table 7.
Performance of optimal skip-stop strategy comparing to the previous studies. (Unit: Minute/person, %).
Table 7.
Performance of optimal skip-stop strategy comparing to the previous studies. (Unit: Minute/person, %).
| Author (year) | Current Travel Time (A) | Proposed Travel Time (B) | Saved In-Vehicle Time | Saved Waiting Time | Saved Travel Time Ratio [(A − B)/A*100] |
|---|---|---|---|---|---|
| Suh et al. (2002) | 16.9 | 14.9 | 2.7 | −0.7 | 12.9% |
| Lee et al. (2014) | 21.8 | 18.1 | 4.1 | −0.3 | 17.1% |
| Zhang et al. (2017) | 16.5 | 15.7 | 0.9 | 0.1 | 4.8% |
| Luo et al. (2018) | 12.3 | 10.3 | - | - | 16.2% |
| This study (2019) | 22.5 | 18.7 | 4.2 | −0.4 | 17.9% |
© 2019 by the authors. Licensee MDPI, Basel, Switzerland. This article is an open access article distributed under the terms and conditions of the Creative Commons Attribution (CC BY) license (http://creativecommons.org/licenses/by/4.0/).
Share and Cite
MDPI and ACS Style
Lee, E.H.; Lee, I.; Cho, S.-H.; Kho, S.-Y.; Kim, D.-K. A Travel Behavior-Based Skip-Stop Strategy Considering Train Choice Behaviors Based on Smartcard Data. Sustainability 2019, 11, 2791. https://doi.org/10.3390/su11102791
AMA Style
Lee EH, Lee I, Cho S-H, Kho S-Y, Kim D-K. A Travel Behavior-Based Skip-Stop Strategy Considering Train Choice Behaviors Based on Smartcard Data. Sustainability. 2019; 11(10):2791. https://doi.org/10.3390/su11102791
Chicago/Turabian StyleLee, Eun Hak, Inmook Lee, Shin-Hyung Cho, Seung-Young Kho, and Dong-Kyu Kim. 2019. "A Travel Behavior-Based Skip-Stop Strategy Considering Train Choice Behaviors Based on Smartcard Data" Sustainability 11, no. 10: 2791. https://doi.org/10.3390/su11102791
Note that from the first issue of 2016, this journal uses article numbers instead of page numbers. See further details here.