How Social Status Contributes to Sustainable Livelihoods? An Empirical Analysis in Ethiopia


1
College of Business and Economics, Mekelle University, 231 Mekelle, Ethiopia
2
School of Social and Behavioral Sciences, Tilburg University, 90153 5000 Tilburg, The Netherlands
3
Department of Geography, Ghent University, 9000 Ghent, Belgium
4
ISUMADECIP, Faculty of Environmental Science and Engineering, Babeş-Bolyai University, 400084 Cluj-Napoca, Romania
5
Department of Geography, University of Tartu, 50090 Tartu, Estonia
6
College of Civil Aviation, Nanjing University of Aeronautics and Astronautics, Nanjing 210016, China
*
Author to whom correspondence should be addressed.
Sustainability 2019, 11(1), 68; https://doi.org/10.3390/su11010068
Submission received: 4 November 2018
/
Revised: 8 December 2018
/
Accepted: 13 December 2018
/
Published: 22 December 2018
(This article belongs to the Section Sustainability in Geographic Science)
Abstract
:This paper scrutinized the links between social status and income of rural households to provide insight into how social status is indicated and used as a strategy for improving livelihood income. It also provides a brief look into some selected key determinants of livelihood income. We applied a two-stage least-squares estimation to household-level data from rural areas in the Tigray regional state of Ethiopia. We also proposed the latent class analysis model to identify the number of classes for the variable “social status”. The results indicate that livelihood income is significantly affected by households’ social status, indicating that high status household heads tend to enhance their participation in different social networks with the intention of strengthening the social bonds that they have and improving their status in the community, which in turn has an economic payback. Apart from this, household heads’ access to off-farm work, size of owned land, exposure to multimedia, livestock ownership and spatial proximity to towns were the variables that have significant positive effects on livelihood income.
1. Introduction
Social status is viewed as the degree of honor or prestige attached to one’s position in a society [1,2]. It generally implies social stratification on a vertical scale. Most societies in the world have some form of social ladder with some individuals in stronger, more dominant positions and other people in lower positions [3].
Most often the individuals having a relatively better position within a society tend to use their status for various purposes. For example, households in rural Ethiopia use their status as a means to attain a diverse range of critical social and economic outcomes, such as improving their asset possessions and income [4,5]. Basically, the different aspects of the effects of status on the livelihoods of rural people are critical in addressing recent endeavors of rural economic development. In this context, social status can be used as a signal, which is socially and economically important for the rural poor in using different livelihood strategies [6].
The theoretical and empirical work for understanding and assessing status and its effects on different socioeconomic activities tends to vary with social context. In the past decades, economists and sociologists used to treat the economic and social aspects of social status independently. Consequently, the issue of how to mainstream social status in economic analysis has remained a mystery [7,8]. Thanks to the growing amount of socioeconomic literature, these days, the issues of social status in an economic sense and the mechanisms to attain it, specifically in a developed countries context, are becoming centers of policy debate in diverse sociological- and economics-related undertakings. Accordingly, various factors are at play in indicating and determining one’s status in a society. These may comprise occupation, education, infrastructure, income and wealth [9,10,11,12,13,14,15,16,17,18].
Notwithstanding this, little evidence has been documented to address its economic implications and the factors affecting it from the developing countries’ perspective. Given this gap, it is compelling to identify what variables are likely to manifest status in a developing countries context other than those indicators attributed to developed nations. The prologue of this consideration in an economic analysis demands preliminary knowledge and careful consideration of different contexts [19].
Within this perspective, the paper aimed at empirically testing the household-level data on how social status is important for the ability of livelihoods to generate income and what specific variables are used to indicate status in a developing countries context. While attention was given to the economic paybacks of some key variables such as proximity to towns, the focus remained on scrutinizing the economic benefits earned from status. For this purpose, first, a set of theoretically tested key variables that potentially have a relation with status and livelihood income were identified. Second, primary data was collected using a structured questionnaire from the sample households selected from the six study hinterlands of the Tigray regional state of Ethiopia, namely Micheal Abiye, Selam, Limeat, Amanit, Mizan Berhan and Endaselassei. Extra information was also gathered from 12 focus group discussants selected from the six hinterlands.
2. Literature Reviews
Livelihood thinking dates back to the work of Robert Chambers in the mid-1980s. The conventional development concepts failed in achieving the desired effects, and still humankind was facing an enormous population pressure. To solve this problem, Chambers developed the idea of “Sustainable Livelihoods”. His main goal was to enhance the efficiency of development cooperation. His concepts constitute the basics for the Sustainable Livelihoods Approach (SLA), as it was developed by the British Department for International Development (DFID). Since 1999, DFID [20] has integrated the approach in its program for development cooperation.
Farrington and others (2002) [21] believe that sustainable livelihoods refer to more than income. Therefore, based on Farrington et al. (2002) [21] livelihood refers to:
The capabilities, assets (stores, resources, claims and access) and activities required for a means of living: a livelihood is sustainable which can cope with and recover from stress and shocks, maintain or enhance its capabilities and assets, and provide sustainable livelihood opportunities for the next generation; and which contributes net benefits to other livelihoods at the local and global levels and in the long and short terms.
In contrast to the counterproductive development practices and segregation associated with the old Apartheid-governed South Africa, the new South African constitution encourages public participation in government policy to ensure that the implementation of poverty reduction strategies meet the ends of truly sustainable development. In this regards, the government’s achievement should not be overlooked from post-1994, but many people still struggle to escape the relentless grip of poverty. According to the (2007: 126) General Household Survey findings, approximately 50% of Black Africans depend on remittances, pensions and grants, nonfarm and farm products as their main sources of income while others have no income at all [22].
Grootaert and van Bastelaer (2002: 2) [23] define social capital broadly as the “institutions, relationships, attitudes, and values that govern interaction among people and contribute to economic and social development.” They believe the strength of this broad definition lies in its ability to include micro, meso and macro levels of social capital. They also differentiate between structural social capitals, which refer to networks, linkages and practices within and between communities/groups. Then they differentiate between cognitive social capitals, which refer to values, beliefs, attitudes, social norms and behavior that exist within communities/groups (i.e., social trust and norms of solidarity and reciprocity). Bayat (2005: 4) [24] added that the structural dimension (which facilitates social interaction) and the cognitive/attitudinal dimension (which predisposes people to act in a socially beneficial manner) work interactively, and are mutually reinforcing. This was followed by a number of studies on livelihoods, especially on the sustainable livelihoods approach over the last couple of decades [25,26]. Ellis (2000) [26] emphasized livelihoods as something which seeks to convey the noneconomic attributes of survival that includes social relationships and institutions that mediate people’s access to different assets and income streams. Livelihoods are context specific. Unlike their counterparts in the West, rural livelihoods in developing countries are based on a mix of occupations from multiple sources that include farming, wage earnings, remittances, livestock rearing etc. [27]. In the fourth, and more academic, version of the Livelihoods Resource Book, Datta et al. (2014) [28] emphasize livelihoods, as a way of life, not only includes employment, income and a means of living, but one that also provides an identity and a place in society. De Haan (2012) [29] focused on the livelihoods approach with regards to the poor, the way people organize their lives, concentrating more on opportunities than on their living conditions.
3. Background Information: Stories from Households
Keeping in mind the end goal, to appropriately address the study’s focus, it is essential to note the foundation data on what social status in the selected hinterlands looks like and how it affects individuals’ income. To do this, initially an arrangement of precisely composed questions was readied. At that point a focus group of 12 rural households made up of two households from each of the six rural hinterlands was formed. In doing so, some determination criteria, such as gender, age and other demographic elements were contemplated. The main purpose of the focus group discussion was to provide detailed empirical background information about the households in the study hinterlands and to clear up few key points about the quantitative investigation. Hence, this part of the paper presents the background information collected through the focus group discussion and provides some stories from the households.
Status, Social Networks and Livelihood Income
The information collected using the focus group discussion revealed that social status in the study hinterlands refers to one’s standing in the community and his position in the social hierarchy. In other words, it refers to the relative rank an individual holds in a social hierarchy based upon honor or prestige. The majority of the focus group discussants noted that individuals having a relatively higher status earn better income compared to the low status ones. According to their replies, basically one’s status in their communities is mainly determined by their degree of participation in social networks. They underlined that participation in social networks is the chief indicator for defining one’s status because almost all of them share similar status indicator variables such as education, occupation and wealth. A majority of them explained that households’ active participation in different social networks, as an individual characteristic and as an interaction between individuals, is an essential factor in improving their status and income. They noted that, along with other economic reasons embedded within the social networks, participation in social networks is motivated by the desire to achieve higher status. On top of this, they strongly believe that active participation in social networks paves the way for them to be positively perceived by the society and builds their esteem within their society, which in turn yields economic benefits, namely an improvement in income. The main reason for this is that these households manage to receive higher respect and love from the society because they are viewed as loyal representatives in various social and economic matters in the community. Consequently, they would potentially get a chance to influence different transactions and thereby improve their livelihood income. A 62-year-old household head, demonstrates the point as follows:
“…… here in our community there are some household heads whom we see as high-status ones. Besides their own personal life these people are exceedingly dedicated in tending to a lot of local issues credited to our locality, for example, by speaking to us and seeking to tend to our issues with administrative authorities, giving reliable information identified with the market, new government rules and most recent improvements that have an immediate and circuitous impact on our livelihoods, and by settling diverse social issues like marriage related issues, clashes among people, and others. The majorities of them are financially better and earn higher income contrasted with different household units living in our locality. We cherish and regard them highly, as they are regularly on the front line of managing our regular social and economic matters by actively participating in different social organizations that we have in our community. That is the reason we normally choose them to lead and aide us in distinctive occasions and affiliations. For example, it is these households that we choose to arrange and lead neighborhood credit affiliations called Equbii. We believe in them, and a greater part of households in our community are intrigued to join forces with them to do business-related activities that are critical for livelihoods……”
It is worthwhile to see in the story that household heads’ status, in the perception of others, is crucial in improving livelihood income and is associated with the degree of participation in social networks. A similar understanding is also observed from the focus group discussants that active participation in social networks, as an individual characteristic and as an interaction between individuals, enabled them to improve their status within the society and thereby improve their livelihood income. The story of one high status of 55-year-old household head from one of the nearest hinterlands illustrates the point as follows:
“…… other than the family obligation that I have, these days I am taking part in different social networks. For instance, I am serving as the head of the local credit affiliation called the Equb. This credit association was initially organized by farmers who are involved in irrigation farming. Moreover, I am a board member of the irrigation cooperative and construction project of a new church. It is my third time to be elected as a committee member. In recent times I learned that the respect and positive perception that people in our community have of me has improved. This motivates me to be curious more in my activities and involvement in the community. I am proud to be part of this community. They always show me affection and regard, and in many transactions, they often ask me to deal on their behalf. This gives me a chance to have a direct contact with the agricultural traders and intermediaries who come from urban areas and get the latest and most timely information about the market. Indeed, this is improving my livelihood significantly and guiding me to strictly adhere to a market-led livelihood that could potentially boost my income….”
The abovementioned empirical cases highlighted that household heads’ status is an important factor in improving livelihood income. Moreover, household heads’ participation in social networks appears to be related with status. This suggests that household heads’ status could be indicated and instrumented using the relational aspect of social capital, i.e., their degree of participation in social networks. Theoretically, the social capital literature elucidates the concept of social capital as an individual characteristic [30] and as a social interaction between individuals [7]. As an individual characteristic, individuals can own social capital. As a relational aspect, individuals cannot own social capital because it is the outcome of social interactions [31,32]. Capturing the relational perspective and the foregoing empirical evidence thus, it can be argued that social status in an economic sense (i.e., improving income) does address the relational aspect of social capital. The idea can be further complicated by the debate over whether livelihood income, along with other variables such as proximity to towns, is affected by status. This gives a clue as to how to indicate status, on the one hand, and how it affects livelihood income, on the other hand. To this end, it is of paramount importance to properly model and statistically test the aforementioned initial findings in order to obtain unbiased results. Doing so would make it easier to develop a rational platform to enrich the literature of social capital using the concept of social status.
4. A Theoretical Framework
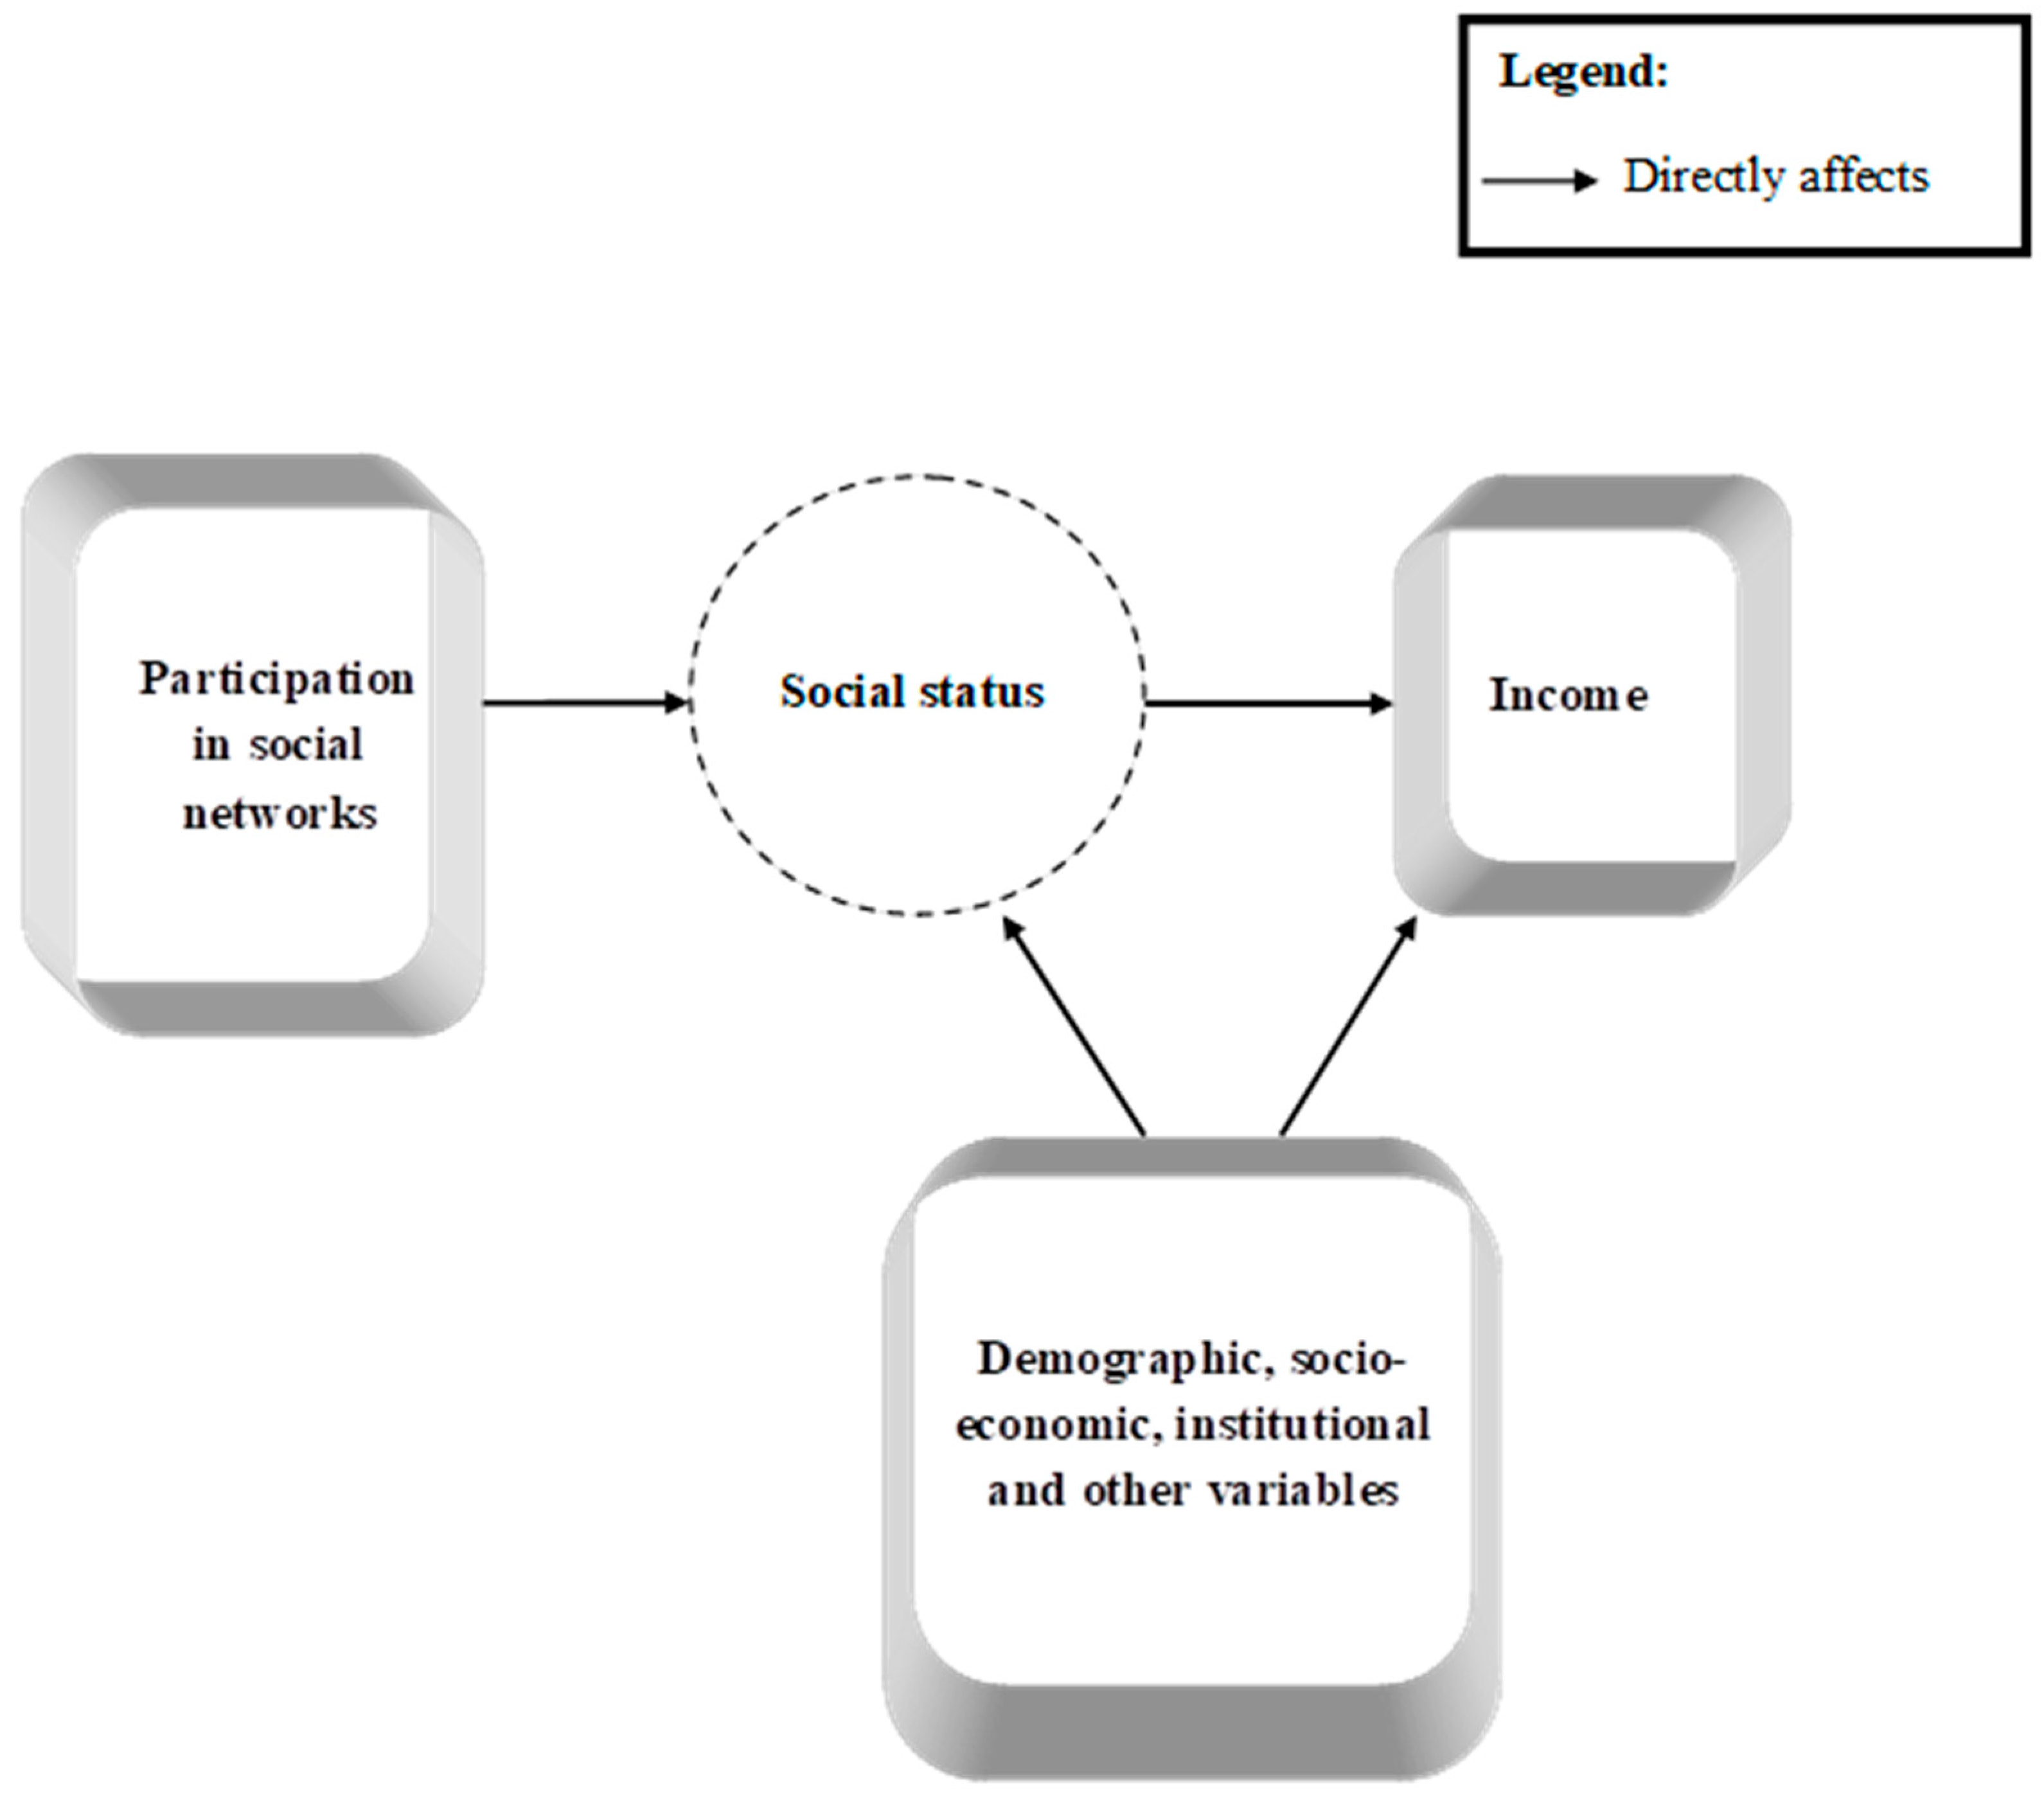
The conceptual framework in Figure 1 is constructed mainly on the theory that a latent variable, rural households’ social status as instrumented by their degree of participation in social networks, is seminal in improving their livelihood income. To tackle this, first, a theoretical foundation is provided to address how participation in social networks helps in attaining better status. Thereafter, an effort is made to examine theoretically how the paybacks of status from an economic perspective are specified. The evidence in the subsequent paragraphs thus provides a more detailed theoretical explanation on how status is related to social networks and how it affects livelihood income.
To begin with, the concept of social status is defined from different perspectives at different times [10,33,34,35]. The vast literature on sociology agreeably defined social status as a ranking of individuals/groups of individuals in a given society, based on their traits, assets and actions [6,36]. Theoretically, it is imperative to see how status is viewed in the context of social capital literature and assess how it gives access to the resources embedded in different social networks even with the networks that have weaker ties. Different findings at different times tried to underpin the relationship between the resources embedded in social networks and status attainment. One of the influential findings was associated with the prominent works of [37], Lin et al. [38] and Burt [34] that served as launching pad toward understanding the relationship between social capital and status, which then resulted in the formulation of a seminal theory, that of social capital [39]. The theory of social capital is formulated with the basic proposition that social networks enhance status and economic performance because they create opportunities to access the resources embedded in the networks of others even without direct connections [37,40,41]. Social capital research has been providing reliable support to this proposition that social capital, in the form of social networks, makes a noteworthy contribution to status attainment and thereby income. In supporting this argument, substantiated with the review of social networks studies, Lin [42] examined a two-process theory, naming it a “mobilized social capital model”. The first process focuses on the access to the resources embedded in the social networks. The second one accentuates the enlistment of social capital in the process of status attainment. According to him, along with other key variables such as education, social capital, in terms of both access and mobilization of embedded resources, augments the probability of attaining better status. Likewise, Boxman et al. [40], Marsden and Hurlbert [43] and Lin et al. [38], noted that the effect of social capital is directly proportional with status attainment and argued that when social capital is high, attained status will be high, regardless of other types of capital such as human capital. Thus, the arguments support the clue that status can potentially be indicated by the extent to which one decides to participate in networks.
Notwithstanding this, in the literature of social status, various studies at different times have tried to indicate and instrument status using various factors such as education, occupation, income and wealth. Weiss and Fershtman [19], for instance, used income and occupation as an indicator of status. De Graaf and Luijkx [44] identified educational performance as a key variable of the status attainment model. Similarly Duncan [15] and Nam and Powers [45] measure status based on education. Robson [46] and Bagwell and Bernheim [47] tried to indicate status based on wealth. Though these findings revealed that status indeed could be indicated by the aforementioned variables, it is hard to say that these indicators really work in rural areas of developing countries, where many people have similar socio-economic characteristics such as education and wealth. This gap suggests a need to search for further indicators and instruments of status such as participation in social networks, and to empirically measure the effect that it has on livelihood income. Accordingly, in this paper an effort is made to indicate the latent variable social status using factors such as the household head’s level of participation in social networks, their ability of getting new and valuable information from the networks, their exposure to multimedia and their access to market information. The reason for using these factors is that the initial findings in the foregoing background information in Section 3 of this paper proved that along with other factors, rural households’ status is mainly related to their level of participation in social networks and the resources embedded within the networks.
In a broad sense, individuals in a society often consider status to be linked with various assets, positions or actions that are crucial for their livelihoods. Resting on this, studies in sociology and economics have related the concept with a wide array of variables. The focus of economists has been on monetary motives that are exchanged through market transactions, whereas sociologists have recognized various social aspects, including social status [6]. Weber [48], for instance, tried to relate social status with power. Harsanyi [49] argued that status bestows some advantages, such as a sense of sanctuary within the group and a better opportunity to come together with other groups, which money cannot buy and which of course eventually have an economic payoff. Bernheim [50] treated social status, indicated by popularity, as a reconciling factor in a variety of economic activities. Likewise, Smith [51] and Yovits [52] associated social status, measured by honor and esteem, with crucial motives of human actions, including economic decisions. Rao [53], in his empirical work on celebrations as social investments in rural India, suggested that organizing events and actively participating in local festivals is a crucial factor in improving one’s status and income. He argued that households who participate more in festivals and other local events obtain higher social status and gain access to larger networks, through which they get lower prices on food and thereby achieve better income. These findings thus substantiate the idea that participation in social networks improves household heads’ status and status in turn can reinforce preferences for economic actions, including improving livelihood income at a given time and place. This sheds light on how status within a given social context is gained and to what extent it affects livelihood income.
5. Methodology
5.1. The Data, Sampling and Survey Design
The study is based on the data collected from a survey conducted in Degua Tembien, a district in the Tigray regional state of the Federal Democratic Republic of Ethiopia. To do this, one small town, namely Hagereselam, and six rural hinterlands, namely Micheal Abiye, Selam, Limeat, Amanit, Mizan Berhan and Endaselassei, were chosen as study areas. Purposive sampling was used to select the small town. In selecting the rural hinterlands cluster random sampling technique was used by applying a cutoff distance of 2 h from the small town. Accordingly, two clusters (comprising three randomly drawn hinterlands each), were labeled as “nearest” and “farthest.” The nearest cluster consists of the hinterlands Micheal Abiye, Selam and Limeat, whereas the farthest one comprises the hinterlands Amanit, Mizan Berhanand Endaselassei (see Table 1, Figure 2 and Figure 3). Thereafter, a total of 260 household heads comprising 114 from the “nearest” cluster and 146 from the “farthest” cluster was drawn purposively. To select households from each hinterland within a given cluster, the Probability Proportionate to Size (PPS) technique was used. Simultaneously, in selecting the sample household heads, emphasis was also given to their level of participation in social networks. Consequently, the households that participated in the study survey were composed of both those having heads with active participation in social networks and those without. In doing so, questions such as “Are you a member of any groups, organizations, or associations?” and “To what extent do you consider yourself to be actively participating in the group, (such as by attending events, volunteering your time in other ways, or leading the group, etc....?)” were asked to determine households’ level of participation in social networks. This strategy provides us with an opportunity to generate the variable social status in a way that is mainly related to participation in social networks and model its effect that it has on livelihood income from a spatial perspective.
5.2. Data Types, Data Collection and Analysis
5.2.1. Data Type and Collection
The data for the study were collected from both primary and secondary sources. The primary data were collected using household-level survey questionnaires, focus group discussions, and personal observations. Prior to the data collection process, the questionnaire was pre-tested in a number of randomly selected households. It basically solicited data on demographic, socioeconomic characteristics and the income-generating activities of the sample households. Focus group discussions and observations were also employed to triangulate and support the primary data that was obtained through the questionnaire. The main function of the focus group discussion was to give an empirical background of the study areas. Also, an effort was made to measure social status based on some indicators obtained from the empirical data that was collected using questionnaire and focus group discussion. To do this, factors such as household heads’ degree of participation in social networks, access to market information, ability to learn something valuable by participating in social networks, ability to get new information by participating in social networks and exposure to multimedia were chosen as indicators. Based on these indicators, a latent class analysis (LCA) was done to determine the number of social status classes and to assign households to these latent classes. Moreover, to empirically test the relation between social status and livelihood income, we proposed applying the two-stage least-squares (2SLS) estimation to household-level data from the selected hinterlands. In contrast with the ordinary least square (OLS) method, this 2SLS estimation method enables us to capture the measurement error by introducing the so-called instrumental variable (IV). Lastly, based on the results of the estimates for regression coefficients, critical analysis was done to test and measure the extent to which social status affects income of rural households. Based on such information, it would be possible to slot in social status considerations in an economic analysis and thereby stimulate the policy debate in the respective fields.
Moreover, secondary data were collected by reviewing different published and unpublished research works, books and theses and by consulting different records and reports of governmental and nongovernmental organizations. The secondary data were used mainly to strengthen the key arguments and theories discussed and to supplement the primary data.
5.2.2. Data Analysis
The analysis was carried out in two steps. First, a latent class analysis (LCA) was done using Latent Gold 5.0 software [55] to determine the number of social status classes and to assign households to these latent classes. The latent class model assumes that the observations can be divided into a finite number of groups, or classes, according to some combination of characteristics [56]. A class is characterized by a pattern of conditional probabilities that point out the likelihood that variables take on certain values [57]. Thus, class membership is assumed to be probabilistic so that each individual can, in theory, have characteristics of each class to varying degrees, according to their class membership probabilities [58,59]. This method allows us to create classes for the latent variable “social status” based on the similar characteristics obtained post hoc from the analysis of the indicator variables, rather than classes based on such easily definable a priori categories.
Second, the data were analyzed using both descriptive statistical analysis and an advanced econometric model. The descriptive analysis was applied to scrutinize the socioeconomic and demographic characteristics of the sample households via summary statistics such as percentages, means, standard deviations and bar charts. The estimates for the effects that the explanatory variables have on livelihood income of the households been obtained by applying a two-stage least-squares model (2SLS) estimation. As we explain later in detail, the 2SLS method provides a powerful way to deal with the problem of OLS in the presence of mis-measured repressors. Statistical analyses were performed using STATA version 13.
5.3. Econometric Modeling
Variable and Model Specification
This paper aims to estimate the effects of social status on households’ income. Specifically, it is intended to analyze which of the hypothesized repressors were associated with households’ income and by how much. As discussed in the preceding theoretical framework, it was shown that the status-income relationship is characterized by the measurement problem associated with the variable social status and the fact that this measurement problem leads to a regressor correlated stochastic term. Here, livelihood income is the dependent variable. Social status becomes an endogenous latent variable in an income equation if unobserved factors in the error term are correlated with both income and status or if status is influenced by income. In this case, the end result will be the introduction of both bias and inconsistency in all the parameters to be estimated through a correlation between the scalar errors. To correct this, several estimation methods accommodating bi-causal relationships can be used as remedies. For this particular case, a 2SLS model accompanied by an instrumental variable [60] was chosen. This model is the extension of the ordinary least squares (OLS) method. It is used when the dependent variable’s error term is correlated with the independent variable. In obtaining the 2SLS estimates, first, the endogenous variable in the equation to be estimated on all exogenous variables, including the instrumental variable should be regressed in the simultaneous equation model using the OLS estimator. Thereafter, in the equation to be estimated using the OLS estimator, the endogenous variable should be replaced by its fitted value variable. The estimation strategy at this point is to estimate a two-equation system consisting of equations for social status and livelihood income. The details are presented here:
where the endogenous variables and denote the household’s livelihood income and social status, respectively; the β’s and α’s are the parameters to be estimated, and and are the stochastic disturbances term for the endogenous variables and , respectively. The variable “household head’s degree of participation in social networks” is chosen as an instrumental variable. An instrumental variable is a variable that is outside the explanatory variables and is correlated with the endogenous explanatory variable. In order to correctly handle the problem of OLS, this instrumental variable must be correlated with the endogenous variable (social Status) but uncorrelated with the error term .
As we discussed in the theoretical section, a considerable number of related theories support the idea of using the variable degree of participation in social networks as an instrument for status. For instance, Lin [42], in his work on social networks and status attainment, supported this proposition, arguing that social capital, in terms of both access and mobilization of embedded resources, augments the chances of achieving better status. This potentially gave us a clue that households’ social capital, indicated by participation in social networks, would have a direct relation with social status (see more details on Section 3 and Section 4).
6. Results
6.1. Latent Class Analysis
The latent class modeling was conducted to identify the number of classes and assign cases to the latent variable social status. Items such as household heads’ degree of participation in social networks, access to market information, ability to learn something valuable by participating in social networks, ability to get new information by participating in social networks and exposure to multimedia were chosen as indicators for LCA.
Table 2 summarizes the results for the 1-, 2- and 3-class solutions. These different solutions are compared based on statistical information criteria like the Bayesian information criteria (BIC) and Akaike information criteria (AIC). Both the BIC and AIC penalize the log-likelihood function, but they do so differently. Whereas the AIC adds the penalty for the number of parameters [61,62], the BIC includes this penalty for the number of parameters as well as the number of observations [63,64].
When comparing model fits using these information criteria, the decision guide is to select the model with the lowest AIC and BIC values [64]. Accordingly, the 2-class solution was selected. More specifically, the results show that compared to other solutions, the 2-class solution seems more parsimonious and justifiable. This provides a reasonable statistical platform for the identification of proper classes for the latent variable.
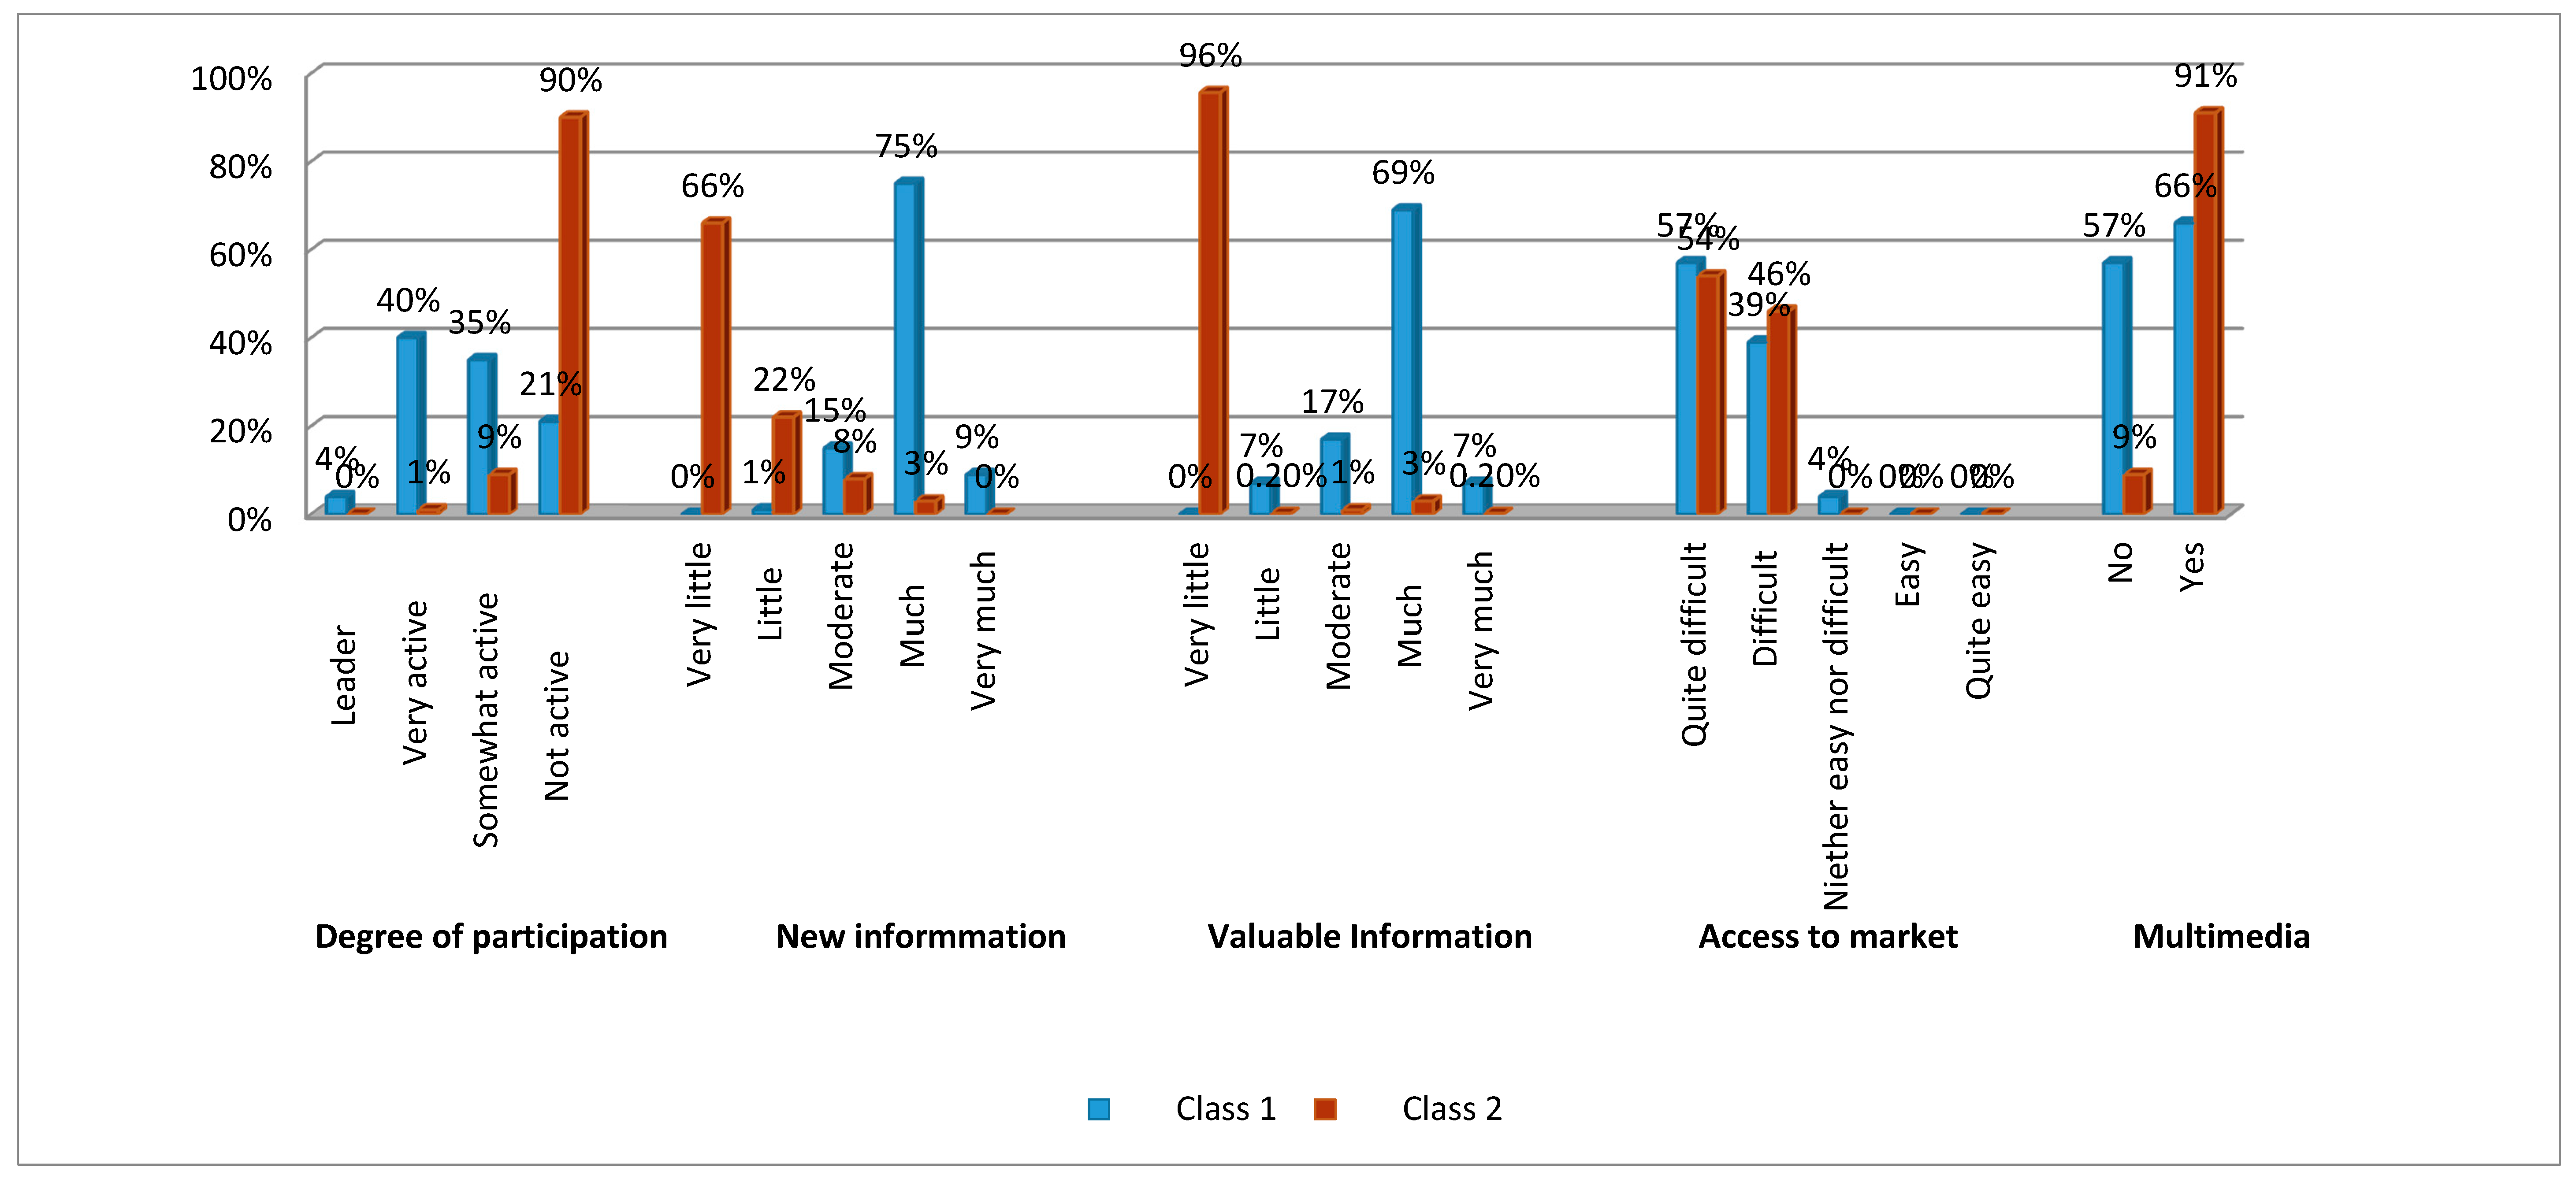
Figure 4 summarizes the results of the 2-class solution. Given the conditional probabilities of the responses in class 2, it tends to be associated with households that don’t have active participation in social networks and that benefit least from getting new and valuable information from social networks. The results show that 90% of the households in this class do not have active participation in social networks. Similarly, the percentage for the probabilities of having very little chance of getting new and valuable information from social networks in this class are 66% and 96%, respectively. Though the households in this class seem to have good multimedia exposure, all of them have serious difficulty in accessing market information. This is similar to the results of class 1, where 66% of them have multimedia exposure and 96% face difficulty in accessing market information.
Contrary to this, with 35% somewhat active participants, 40% very active participants and 4% leaders, households in class 1 appear to be highly linked with active participation in social networks. Unlike class 2, the probabilities of having much chance of getting new and valuable information from social networks in this class are 75% and 69%, respectively. As one would expect from the attributes embedded in this class, they are closely related with the better status households mentioned in the background part of Section 3 of this paper. Hence it seems logical to label class 1 as high/medium social status and class 2 as low social status.
6.2. Descriptive Analysis
Table 3 presents the measurement attributes and summary of the descriptive statistics of the selected key variables derived from the sampled households, which were later regressed in the econometric model. To begin with, the average household’s income is found to be 9731.63 ETB (468 USD) per year from all income sources. This is similar and comparable to the national average of 9776 ETB (470 USD) in Ethiopia [65]. The mean age of the household heads in the sample is 53, and about 11% of them are women. Out of the total sample households, 43% are from the nearest hinterlands closer to the case town and the remaining 57% are from the farthest ones. Though the sample households are located at different distances from the small town, 75% of the households have access to off-farm work found in the small town. This result indicates that the rural households realized that diversifying their income sources would be among the rational strategies they could use to improve their livelihoods. There has also been an increase in evidence indicating that rural households in developing countries rarely rely on agriculture alone, but often maintain a diversified portfolio of income-generating activities in which off-farm activities are major components [66,67].
Moreover, Table 3 shows that the mean size of farm land owned by households is 0.46 hectares, which is smaller than the regional average of 0.8 hectares [68]. The average livestock ownership in Tropical Livestock Units (TLU) is reported as 3.56. The access variables also show that 65% of the households have access to credit. This appears to show progress because a majority of rural households in developing countries have been characterized by limited access to credits. Notwithstanding this, during our interview with the households, we observed that some concerns were raised regarding the issues of collateral and loan maturity period. Likewise, the results show that 66% of the households in some way or another have access to multimedia. This should partially enable them to exploit information about the market and other aspects of their livelihoods.
Apart from this, the bar chart in Figure 5 provides a general picture of the relationship between the four core variables—households’ income, social status, spatial proximity to a town and degree of participation in social networks.
As can be seen from Figure 5, household income differs with social status and degree of participation in social networks. Apparently, households with a higher degree of participation in social networks and better status have higher livelihood income compared to those having a relatively lower degree of participation and status. This evidence may suggest that, apart from other reasons, the households make a considerable effort to actively participate in social networks to strengthen and maintain their status in the society, which then ultimately enables them to influence transactions that are crucial for their livelihood income improvement. The result is in line with the findings of Weiss and Fershtman [6], who pointed out that status has an implication for households’ economic performance.
We also see from the same figure that a higher level of income is attributed to the households living in the closer hinterlands, as compared with households living in the farthest hinterlands. This further supports the contention that households closer to towns have a relatively higher income than those farthest away. A possible explanation for this can be that it is easier for the households who live in the closer hinterlands to frequently visit the small town to benefit from the urban services. This enables them to directly interact with service providers to do business transactions (selling and buying) and collect information that is vital for their livelihoods [69,70,71].
Overall, the foregoing descriptive results give a general insight into the different key variables that should be addressed and serve as a take-off point for the econometric analysis presented below.
6.3. Econometric Analysis
In order to achieve the objectives of the study, after a thorough review of literature, a total of 11 variables consisting of one dependent variable, one endogenous variable, one instrumental variable and eight exogenous variables were identified. Based on the p-value test for regression coefficients of the 2SLS, six variables are shown to significantly affect the dependent variable livelihood income. In further analysis below, we focus on these six significant variables. First, let us look at the assumptions and tests that the econometric models make in the 2SLS estimation.
6.3.1. Multicollinearity
Before estimating the model parameters using the 2SLS with an instrumental variable, the explanatory variables were checked for a problem of multicollinearity. Several statistical measures are suggested to detect the presence of multicollinearity and measure its extent. Gujarati [72] suggested the Variance Inflation Factor (VIF), which we define as:
where Ri2 is the coefficient of determination obtained by regressing xi on all the other explanatory variables. The larger the value of VIF [73] the more collinear the variable xi with other x’s is. As a rule of thumb, for a given variable xi a VIF of 10 or above indicates a serious problem of multicollinearity. As can be seen from Table 4, the VIF values computed for each explanatory variable are far less than 10, which indicate that there is no problem of multicollinearity.
6.3.2. Test of Endogeneity
To empirically evaluate the use of an instrumental variable, a test for endogeneity was done using Durbin–Wu–Hausman test. The test checks whether the regressor is an exogenous or endogenous variable. In other words, this test compares the OLS and IV estimates to check for significant differences. If there are significant differences, then the regressor is endogenous. Accordingly, the results in Table 5 revealed that there is a problem of endogeneity because the outputs show significant differences. Hence the use of an instrumental variable in our analysis is compelling.
6.3.3. Test of Validity of Instrument
It should be noted that a low correlation between the instrument and the endogenous variable would indicate a weak instrument. The instrument is weak if the partial F-statistic testing the significance of the coefficient of the instrument is less than 10. In our case, the F-statistic result in Table 6 shows that it is higher than 10, indicating that the chosen instrumental variable is strongly correlated with the endogenous variable.
6.4. Main Results of the Econometric Model Analysis
The results of the first stage estimation in Table 7 show the relevance of the instrument variable, i.e., degree of participation in social networks. Certainly, the instrument variable is relevant because it is found to be statistically significant at a 1% probability level.
Moreover, the second-stage results of the IV estimation of the variable “household’s income” in Table 7 show that household heads’ exposure to multimedia and spatial proximity to a town were found to be significant at a 1% probability level with a positive regression coefficient, indicating that households closer to towns having exposure to multimedia are more likely to have better income than those farthest households who have no exposure to multimedia.
Likewise, according to the results in Table 7, the corresponding p-values of the variables “household head’s social status”, “size of land owned” and “livestock ownership” show that they are statistically significant at a 5% probability level with a positive regression coefficient. This indicates that household heads having better status and owning relatively more land and a higher number of livestock are more likely to have better income than those low status households having less livestock and land. Similarly, the corresponding p-value of the variable “household’s access to off-farm work” shows that it is statistically significant at a 10% probability level with a positive regression coefficient, indicating that household heads with access to off-farm work are more likely to earn a significantly higher income than those households who don’t have access to off-farm work.
Finally, while household heads’ age, sex and access to credit describe the sample respondents, none of them were found to be significant in affecting the variable “livelihood income”.
7. Discussion
Household livelihood strategy is the choice of livelihood activities carried out by households in meeting their needs. The attainment’ strategy in fulfilling the shortfall of the household needs is dominated by the strategy of utilizing the social network of family by receiving remittances from family members who work as service providers overseas. If there is a delay in remittances sent by their household head, they will take another strategy like enhancing their access to off-farm works. Focusing on the significant variables, the obtained findings corroborate that rural households’ social status, instrumented by degree of participation in social networks, has a significantly positive effect on livelihood income. This implies that high status households have significantly higher income than low status ones. This scenario is the reality in the case area of this study, where high status rural household heads are highly capable of influencing rural market dealings and various social activities of their hinterlands, which then enable them to use this as a base to claim a relatively higher income. This is also a common trend in the other rural parts of Ethiopia and perhaps some other parts of the world, where community ties are widespread. But how is participation in social networks related to social status and how does social status in turn affect livelihood income? The results suggest that social status as instrumented by households’ participation in social networks plays a key role in regulating business transactions affecting livelihood income. To compare this study findings with other similar research, Zhang et al. (2018) [17] argued that rural livelihood strategies are primarily a matter of choice, while the characteristics of the household and village may affect the decision-making process. They aimed to apply multi-level modeling approach to model rural livelihood strategies in Henan Province, China. Same as the current study the focused on rural income inequality and their results revealed the Chinese government should design effective policies to make farming an appealing livelihood choice, particularly for the young generation.
According to the gained results, high status households tend to enhance their participation in different social networks with the intention of strengthening the social bonds that they have and improving their status in the community, which in turn has an economic payback. In other words, households’ active participation in social networks, as an individual characteristic, is a critical factor in enhancing their status within the society, as it enables them to be positively perceived by the society. This eventually has an economic benefit for their livelihoods. However, considering that the social capital remains strong in Degua Tembien district, when a community member faces difficulties in fulfilling his/her household needs, the family members tends to enhance their participation in different social networks to improve their livelihood income. These results are in line with Yuliati and Isaskar study (2018) [74]. They aimed to analyze the social capital and other livelihood resources/assets of Surah and Surowiti villagers in Indonesia and explore the livelihood strategies preferred by the villagers to keep their life sustainable. To compare another similar study, Eneyew and Bekele (2012) [75] argued that econometric analysis of determinants of rural household’s choice of livelihood strategies in Ethiopia has received little attention. To fill this gap, they used a multinomial logit model to identify determinants of livelihood strategies in Wolaita, Southern Ethiopia. A two-stage stratified random sampling technique was employed to select 120 household heads. Their data analysis revealed that agriculture has a leading contribution to the total income of sample households (64.1%) followed by nonfarm (22.8%) and off farm. Also, their findings suggest that policymakers need to reflect on the most suitable ways of supporting livelihood diversity.
The abovementioned empirical cases highlighted that household heads’ status is an important factor in improving livelihood income. The story of one household head illustrates the following points:
There is a 54-year-old man who is a high-status household head in the Mizan Birhan hinterland, in the Degua Tembien district of the regional state of Tigray, Ethiopia. Like any other rural household in his community, agriculture remains central to his family’s survival. He, in his society, is seen as one of the most highly regarded household heads due to his active and leadership role in different societal affairs and events. According to him, not only does his active involvement in different social networks enhance his status within the society, but it also emphatically adds to his livelihood. He says: “Besides improving the perception that other people have about me, taking part in these networks on a very basic level helped me reinforce my economic condition.” Having been well respected by his society, he has been using his status as one means to regulate and minimize the costs associated with accessing markets: “As successive contact with merchants coming about because of my status clears me an approach to come to know the most recent information about the market, I might lessen the market-related costs.” He is convinced that not only does his status enable him to minimize the market transaction costs, it also strengthens his bargaining power and economic condition. “I managed to increase my bargaining power and save the market related costs that would have been incurred. As a result, I could be able to significantly boost my livelihood income”. The potential for applications of the sustainable livelihood are manifold and not restricted to livelihood thinking only, as the approach includes ideas of other recent theoretical approaches. Its flexible design and openness to changes makes it adaptable to diverse local settings, where it can be applied to different extents associated to the development research or project objectives. From the aforementioned story, it is imperative to notice how status is highly associated with participation in social networks and used by household heads to influence transactions and activities that affect their livelihood’s income. These empirical findings are in line with findings of Weiss and Fershtman [6] and Bernheim [50] studies, who considered status as a useful factor that can be used to influence individuals’ behavior, which then may influence economic decisions and livelihood income. Hence, it is apparent in the foregoing theories and empirical evidence that social status paves a way for individuals to obtain advantages in economic transactions that have plausible positive effects on their livelihood income. Moreover, it is apparent in the findings that rural households’ spatial proximity to a town has a positive effect on livelihood income, most likely since the closer households can easily visit the town and exploit the different town functions and services that are vital for their livelihoods. This finding is in line with other studies that suggest the importance of proximity as a key feature in rural development [69,71]. The results of these studies [69,71] revealed that the effects of different particulars of the linkage such as spatial proximity to small towns on income of the rural households have been less explored. Also, it is outlined that assessing the household heads’ access to off-farm work, size of owned land, exposure to multimedia, livestock ownership and spatial proximity to towns were the variables that have significant positive effects on livelihood income. Finally, the family welfare is a condition when all the physical and psychological needs of a household can be fulfilled based on the living standard. The welfare status or level can be measured based on the proportion of family expenses.
8. Conclusions
The literature on sustainable livelihoods provides a much-needed adjustment in bringing the poor, their institutions, strategies and perspectives in dealing with the multidimensional aspects of poverty. One the main implication of the current study is that the provided framework in this study enables the attention of policy makers and planners towards building assets and capabilities of the poor toward more income using social status. Continuing to examine the significant variables, our findings show clear links between key assets and livelihood income. Particularly, another implication of the current study is revealing that households’ livestock and land ownership are positively linked with livelihood income. This infers that land and livestock are still the essential components of asset portfolios that rural households rely on. Likewise, access to off-farm work and exposure to multimedia appear to be positively associated with livelihood income, implying that off-farm employment opportunities and exposure to multimedia have a tendency to improve the livelihoods of rural households by strengthening their income and information base, which are decisive for their livelihoods.
With regards to the role of government; the choice of livelihoods often has been predetermined by the government with the poor not being involved. The programs are implemented in a top down manner, ignoring the participatory approach as envisaged in the design. Evaluation studies have highlighted how delays in releasing of funds had been a major institutional constraint in effective implementation. Therefore, the current study tries to explore/enhance economic transactions that have plausible positive effects on their livelihood income.
To sum up, our empirical findings contribute to filling in the literature gap on social status and its relationship with participation in social networks as they pertain to the effects of social status on livelihood income of rural households in the context of developing countries. The study is successful to highlight rarely used indicators such as households’ degree of participation in social networks as an instrument for social status. This creates a fertile ground on which to build a universal set of standard indicators of status that would help to indicate social status in any context and thereby to enrich the literature of social capital using the concept of social status.
While the findings of the current study contribute empirically to the ongoing debate on livelihoods, there are a few limitations which could be considered in the further studies. First of all, since our empirical analysis is based on cross-sectional data set, it is not successful to capture the patterns changes over time. In this regard, studies based on longitudinal data could convey much richer findings on the topic. Second, contrary to the indicators attributed to the developed world, our study is limited to estimate livelihood effects of status as it is indicated by few key variables. However, there could be other indicators attributed to different countries’ contexts other than those known to the literature. Hence, comparative studies of social status in different countries’ contexts would help in identifying additional indicators of status. Thereby, it would help constructing standard indicators that could be valid in any context. Third, our review of literature has been limited only to those writings made in English. Therefore, it could be considered as another limitation.
Apart from that, in future studies, sustainable livelihood strategies could be applied in the form of a livelihood analysis to assess how development activities ‘fit’ with the livelihoods of the poor, whilst the social status framework might be of use as a checklist or means of structuring ideas. The uses of the sustainable livelihood strategies are diverse and adaptable to many settings. But these strategies do not act as a magic tool, to eliminate problems of poverty with a single sign. Also, these strategies are not revolutionary new ideas to change the development research and cooperation. Still, the social status framework delivers a good tool to structure development research and increase the efficiency of development projects.
Overall, the foregoing findings are noteworthy, since they offer a new roadmap for further studies in the enduring rich debate about social status in the context of developing countries. Specifically, understanding the social status as a strategy for improving livelihood and exploring the implementation challenges by researchers can provide new knowledge and insights for policy makers as well as practitioners and academics interested in poverty reduction and livelihood enhancement.
Notes
- To maintain the privacy of the discussants, we use fake names throughout the case study. This applies to all case stories stated in the paper.
- Informal credit association where group of individuals agree to meet for a defined period of time in order to save money together. It is a rotating fund.
- The region is an ethnic-based administrative territoriality of Ethiopia that is larger than hinterlands and districts.
- Wereda refers to an administrative unit of Ethiopia larger than tabia, similar to district.
- Tabia is the smallest administrative unit of Ethiopia, similar to a ward or hinterland.
Author Contributions
A.G.A. performed the study and developed the main text; R.R. provided instruction and comments for the research design and approaches, H.A. and F.W. read the first draft, enriched and helped the others to address the reviewers’ comments.
Funding
This research was financed by The Netherlands Organization for International Cooperation in Higher Education (Nuffic), under grant No. NICHE/ETH/020, and coordinated by Bertha Vallejo of Tilburg University, CentER.
Acknowledgments
We are grateful to Paul M. de Graaf and Dereje W. Gudicha for all their supports, comments and suggestions during the course of this research, although any errors are our own and should not tarnish the reputations of this esteemed scholar.
Conflicts of Interest
The authors declare no conflicts of interest.
References
- Brown, T.C.; Bergstrom, J.C.; Loomis, J.B. Defining, valuing, and providing ecosystem goods and services. Nat. Resour. J. 2007, 47, 329–376. [Google Scholar]
- Davis, K.; Moore, W.E. Some principles of stratification. Am. Sociol. Rev. 1945, 10, 242–249. [Google Scholar] [CrossRef]
- Maiese, M. Interests, Positions, Needs, and Values; Beyond Intractability: New York, NY, USA, 2004. [Google Scholar]
- Briggs, P.; Blatt, B. Ethiopia. In Addis Ababa: Bradt Travel Guides; The Globe Pequot Press Inc.: Connecticut, CT, USA, 2009. [Google Scholar]
- Ephraim, I. Social structure of the Ethiopian church. Ethiop. Obs. 1971, 14, 240–288. [Google Scholar]
- Weiss, Y.; Fershtman, C. Social status and economic performance: A survey. Eur. Econ. Rev. 1998, 42, 801–820. [Google Scholar] [CrossRef]
- Coleman, J. Foundations of Social Theory; Belknap Press: Cambridge, UK, 1990. [Google Scholar]
- Smelser, N.J.; Swedberg, R. The Handbook of Economic Sociology; Princeton University Press: Oxfordshire, UK, 2010. [Google Scholar]
- Adler, N.; Stewart, J. The MacArthur scale of subjective social status. MacArthur Research Network on SES & Health. 2007. Available online: https://macses.ucsf.edu/research/psychosocial/subjective.php (accessed on 20 March 2008).
- Barratt, W. The Barratt Simplified Measure of Social Status (BSMSS): Measuring SES; Indiana State University: Indiana, IN, USA, 2006. [Google Scholar]
- Blau, P.M.; Duncan, O.D. The American Occupational Structure; John Wiley & Sons, Inc.: New York, NY, USA, 1967. [Google Scholar]
- Blishen, B.R. The construction and use of an occupational class scale. Can. J. Econ. Political Sci./Rev. Can. Econ. Sci. Politiq. 1958, 24, 519–525. [Google Scholar] [CrossRef]
- De Graaf, P.M.; Ganzeboom, H.B.; Kalmijn, M. (Eds.) Cultural and Economic Dimensions of Occupational Status. In Similar or Different?: Continuities in Dutch Research on Social Stratification and Social Mobility; SISWO: Amsterdam, The Netherlands, 1989; pp. 55–73. [Google Scholar]
- Diemer, M.A.; Mistry, R.S.; Wadsworth, M.E.; López, I.; Reimers, F. Best practices in conceptualizing and measuring social class in psychological research. Anal. Soc. Issues Public Policy 2013, 13, 77–113. [Google Scholar] [CrossRef]
- Duncan, O.D. A socioeconomic index for all occupations. In Class: Critical Concepts; Board of Regents of the University of Wisconsin System: Wisconsin, WI, USA, 1961; Volume 1, pp. 388–426. [Google Scholar]
- Pineo, P.O.; Porter, J. Occupational prestige in Canada. Can. Rev. Sociol./Rev. Can. Sociol. 1967, 4, 24–40. [Google Scholar] [CrossRef]
- Zhang, L.; Liao, C.; Zhang, H.; Hua, X. Multilevel Modeling of Rural Livelihood Strategies from Peasant to Village Level in Henan Province, China. Sustainability 2018, 10, 2967. [Google Scholar] [CrossRef]
- Perz, S.; Leite, F.; Griffin, L.; Hoelle, J.; Rosero, M.; Carvalho, L.; Castillo, J.; Rojas, D. Trans-Boundary Infrastructure and Changes in Rural Livelihood Diversity in the Southwestern Amazon: Resilience and Inequality. Sustainability 2015, 7, 12807–12836. [Google Scholar] [CrossRef] [Green Version]
- Fershtman, C.; Weiss, Y. Social status, culture and economic performance. Econ. J. 1993, 103, 946–959. [Google Scholar] [CrossRef]
- DFID. Sustainable Livelihoods Guidance Sheets; Emergency Nutrition Network (ENN): Oxford, UK, 1999.
- Farrington, J.; Ramasut, T.; Walker, J. Sustainable Livelihoods Approaches in Urban Areas: General Lessons, with Illustrations from Indian Cases; Overseas Development Institute: London, UK, 2002; Available online: www.odi.org.uk/resources/doc/2706 (accessed on 20 November 2011).
- Statistics South Africa. General Household Survey, Statistical Release P0318; Statistics South Africa: Pretoria, South Africa, 2007.
- Grootaert, C.; Van Bastelaer, T. Understanding and Measuring Social Capital: A Multi-Disciplinary Tool for Practitioners; The World Bank: Washington, DC, USA, 2002. [Google Scholar]
- Bayat, A. Defining Social Capital: A brief overview of the key aspects and debates. Presented at the Workshop on Social Capital Held at the Economics and Management Sciences Faculty, University of the Western Cape, Cape Town, South Africa, 17 February 2005. [Google Scholar]
- Bebbington, A. Capitals and Capabilities: A Framework for Analyzing Peasant Viability, Rural Livelihoods and Poverty. World Dev. 1999, 27, 2021–2044. [Google Scholar] [CrossRef] [Green Version]
- Ellis, F. Rural Livelihoods and Diversity in Developing Countries; Oxford University Press: Oxford, UK, 2000. [Google Scholar]
- Conway, G. Exploring sustainable livelihoods. In Revolutionizing Development: Reflections on the Work of Robert Chambers; Cornwal, A., Scoones, I., Eds.; Earthscan: London, UK; Washington, DC, USA, 2011; pp. 85–92. [Google Scholar]
- Datta, S.; Kandarpa, R.; Mahajan, V. Resource Book for Livelihood Promotion; Institute of Livelihood Research and Training: Hyderabad, India, 2014. [Google Scholar]
- De Haan, L. The livelihood approach: A critical exploration. Erdkunde 2012, 66, 345–357. [Google Scholar] [CrossRef]
- Bourdieu, P.; Wacquant, L. An Invitation to Reflexive Sociology; The University of Chicago Press: Chicago, IL, USA; London, UK, 1992. [Google Scholar]
- Rutten, R.; Westlund, H.; Boekema, F. The spatial dimension of social capital. Eur. Plan. Stud. 2010, 18, 863–871. [Google Scholar] [CrossRef]
- Westlund, H.; Bolton, R. Local social capital and entrepreneurship. Small Bus. Econ. 2003, 21, 77–113. [Google Scholar] [CrossRef]
- Adams, J.; Weakliem, D.L.; August, B. Hollingshead’s “Four Factor Index of Social Status”: From unpublished paper to citation classic. Yale J. Sociol. 2011, 8, 11–20. [Google Scholar]
- Burt, R.S. The gender of social capital. Ration. Soc. 1998, 10, 5–46. [Google Scholar] [CrossRef]
- Haug, M.R.; Sussman, M.B. The indiscriminate state of social class measurement. Soc. Forces 1971, 49, 549–563. [Google Scholar] [CrossRef]
- Weiss, Y.; Fershtman, C. On the stability of occupational rankings. Ration. Soc. 1992, 4, 221–233. [Google Scholar] [CrossRef]
- Granovetter, M. The strength of weak ties. Am. J. Sociol. 1973, 78, 1360–1380. [Google Scholar] [CrossRef]
- Lin, N.; Ensel, W.M.; Vaughn, J.C. Social resources and strength of ties: Structural factors in occupational status attainment. Am. Sociol. Rev. 1981, 393–405. [Google Scholar] [CrossRef]
- Kanas, A.; Chiswick, B.R.; van der Lippe, T.; Van Tubergen, F. Social Contacts and the Economic Performance of Immigrants: A Panel Study of Immigrants in Germany. Int. Migr. Rev. 2012, 46, 680–709. [Google Scholar] [CrossRef] [Green Version]
- Boxman, E.A.; De Graaf, P.M.; Flap, H.D. The impact of social and human capital on the income attainment of Dutch managers. Soc. Netw. 1991, 13, 51–73. [Google Scholar] [CrossRef]
- Mouw, T. Racial differences in the effects of job contacts: Conflicting evidence from cross-sectional and longitudinal data. Soc. Sci. Res. 2002, 31, 511–538. [Google Scholar] [CrossRef]
- Lin, N. Social networks and status attainment. Ann. Rev. Sociol. 1999, 25, 467–487. [Google Scholar] [CrossRef]
- Marsden, P.V.; Hurlbert, J.S. Social resources and mobility outcomes: A replication and extension. Soc. Forces 1988, 66, 1038–1059. [Google Scholar] [CrossRef]
- De Graaf, P.M.; Luijkx, R. Trends in status attainment in the Netherlands from ascription to achievement. Solidar. Gener. 1993, 437–467. [Google Scholar]
- Nam, C.B.; Powers, M.G. The Socioeconomic Approach to Status Measurement. North America. 1983. Available online: https://www.popline.org/node/418614 (accessed on 20 December 2018).
- Robson, A.J. Status, the distribution of wealth, private and social attitudes to risk. Econom. J. Econom. Soc. 1992, 60, 837–857. [Google Scholar] [CrossRef]
- Bagwell, L.S.; Bernheim, B.D. Conspicuous Consumption, Pure Profits, and the Luxury Tax; National Bureau of Economic Research, Stanford University: Stanford, CA, USA, 1992. [Google Scholar]
- Weber, M. Economy and Society: An Outline of Interpretive Sociology; University of California Press: California, CA, USA, 1978; Volume 1. [Google Scholar]
- Harsanyi, J.C. A bargaining model for social status in informal groups and formal organizations. Behav. Sci. 1966, 11, 357–369. [Google Scholar] [CrossRef] [PubMed]
- Bernheim, B.D. A theory of conformity. J. Political Econ. 1994, 102, 841–877. [Google Scholar] [CrossRef]
- Smith, A. The Wealth of Nations [1776]; Random House: New York, NY, USA, 1937. [Google Scholar]
- Yovits, M.C.; Jacobi, G.T.; Goldstein, G. Self-Organizing Systems; Spartan Books: Washington, DC, USA, 1962. [Google Scholar]
- Rao, V. Celebrations as social investments: Festival expenditures, unit price variation and social status in rural India. J. Dev. Stud. 2001, 38, 71–97. [Google Scholar] [CrossRef]
- Woreda Kola Tembien Finance and Economic Development Office. Annual Performance Report; Woreda Planning and Programming Unit: Abiy Addi, Tigray, Ethiopia, 2015.
- Vermunt, J.K.; Magidson, J. Technical Guide for Latent GOLD 5.0: Basic, Advanced, and Syntax; Statistical Innovations Inc.: Belmont, MA, USA, 2013. [Google Scholar]
- Goodman, L.A. Latent class analysis: The empirical study of latent types, latent variables and latent structures. In Applied Latent Class Analysis; Cambridge University Press: Cambridge, UK, 2002. [Google Scholar]
- McCutcheon, A.L. Latent Class Analysis; Sage: California, CA, USA, 1987. [Google Scholar]
- Cleveland, M.J.; Collins, L.M.; Lanza, S.T.; Greenberg, M.T.; Feinberg, M.E. Does individual risk moderate the effect of contextual-level protective factors? A latent class analysis of substance use. J. Prev. Interv. Community 2010, 38, 213–228. [Google Scholar] [CrossRef] [PubMed]
- Lazarsfeld, P.; Henry, N. Latent Structure Analysis; Houghton Mifflin Company: Boston, MA, USA, 1968. [Google Scholar]
- Williamson, O.E. The economics of organization: The transaction cost approach. Am. J. Sociol. 1981, 87, 548–577. [Google Scholar] [CrossRef]
- Aho, K.; Derryberry, D.; Peterson, T. Model selection for ecologists: The worldviews of AIC and BIC. Ecology 2014, 95, 631–636. [Google Scholar] [CrossRef] [PubMed]
- Burnham, K.P.; Anderson, D.R. Multimodel inference: Understanding AIC and BIC in model selection. Sociol. Methods Res. 2004, 33, 261–304. [Google Scholar] [CrossRef]
- Bhat, H.S.; Kumar, N. Markov tree options pricing. In Proceedings of the 2009 SIAM Conference on “Mathematics for Industry” the Art of “Mathematics for Industry”; SIAM: Philadelphia, PA, USA, 2010; pp. 162–173. [Google Scholar]
- Kass, R.E.; Wasserman, L. A reference Bayesian test for nested hypotheses and its relationship to the Schwarz criterion. J. Am. Stat. Assoc. 1995, 90, 928–934. [Google Scholar] [CrossRef]
- Clements, M.B.J.; Coady, D.; Fabrizio, M.S.; Gupta, M.S.; Alleyne, M.T.S.C.; Sdralevich, M.C.A. Energy Subsidy reform: Lessons and Implications; International Monetary Fund: Washington, DC, USA, 2013. [Google Scholar]
- Barrett, C.B.; Reardon, T.; Webb, P. Nonfarm income diversification and household livelihood strategies in rural Africa: Concepts, dynamics, and policy implications. Food Policy 2001, 26, 315–331. [Google Scholar] [CrossRef]
- Ellis, F.; Freeman, H.A. Rural livelihoods and poverty reduction strategies in four African countries. J. Dev. Stud. 2004, 40, 1–30. [Google Scholar] [CrossRef]
- CSA. Population and Housing Census of Ethiopia; Central Statistical Agency of Ethiopia (CSA): Addis Ababa, Ethiopia, 2007.
- Abbay, A.G.; Rutten, R. Does spatial proximity to small towns matter for rural livelihoods? A propensity score matching analysis in Ethiopia. Lett. Spat. Resour. Sci. 2016, 9, 287–307. [Google Scholar] [CrossRef]
- Baker, J. Small Town Africa: Studies in Rural-Urban Interaction; Nordic Africa Institute: Uppsala, Sweden, 1990; Volume 23. [Google Scholar]
- Tacoli, C. The Earthscan Reader in Rural-Urban Linkages; Earthscan: London, UK, 2006. [Google Scholar]
- Gujarati, D.N.; Porter, D.C. Basic Econometrics, 4th ed.; McGraw-Hill: New York, NY, USA, 2003. [Google Scholar]
- Dillon, A.; Sharma, M.; Zhang, X. Estimating the impact of rural investments in Nepal. Food Policy 2011, 36, 250–258. [Google Scholar] [CrossRef]
- Yuliati, Y.; Isaskar, R. Vocial capital and sustainable livelihood strategies in downstream Area of bengawan solo river, East Java, Indonesia. J. Sustain. Sci. Manag. 2018, 13, 201–209. [Google Scholar]
- Eneyew, A.; Bekele, W. Determinants of livelihood strategies in Wolaita, southern Ethiopia. Agric. Res. Rev. 2012, 1, 153–161. [Google Scholar]
- Wooldridge, J.M. Estimation and inference for dependent processes. In Handbook of Econometrics; Elsevier B.V.: New York, NY, USA, 1994; Volume 4, pp. 2639–2738. [Google Scholar]
- Asteriou, D.; Hall, S.G. Applied Econometrics; Palgrave Macmillan: New York, NY, USA, 2011. [Google Scholar]
Figure 1.
A theoretical framework showing the effect of social status on income. Source: Constructed by the authors.
Figure 1.
A theoretical framework showing the effect of social status on income. Source: Constructed by the authors.

Figure 2.
The study area of Degua Tembien district.

Figure 3.
Degua Tembien district/Weredaiv and the study hinterlands/Tabiasv. Source: The Central Statistical Agency of Ethiopia.
Figure 3.
Degua Tembien district/Weredaiv and the study hinterlands/Tabiasv. Source: The Central Statistical Agency of Ethiopia.

Figure 4.
Summary of indicators by classes. Source: Authors’ computations.

Figure 5.
Bar chart of household income by social status, degree of participation in social networks and spatial proximity to a town. Source: Authors’ computations based on original analysis.
Figure 5.
Bar chart of household income by social status, degree of participation in social networks and spatial proximity to a town. Source: Authors’ computations based on original analysis.


Table 1.
Demographic data of the study hinterlands. Source [54].
Table 1.
Demographic data of the study hinterlands. Source [54].
| Study Hinterlands | Total Population | Number of Households | Number of Sample Households | Clusters | ||||
|---|---|---|---|---|---|---|---|---|
| Male | Female | Total | Male Headed | Female Headed | Total | |||
| Micheal Abiye | 2854 | 2635 | 5489 | 995 | 252 | 1247 | 43 | Nearest |
| Limeat | 2444 | 2723 | 5167 | 952 | 232 | 1184 | 41 | |
| Selam | 1958 | 1756 | 3714 | 678 | 166 | 844 | 30 | |
| Amanit | 1559 | 1641 | 1641 | 684 | 143 | 827 | 47 | Farthest |
| Mizan Berhan | 2077 | 2069 | 4146 | 791 | 151 | 942 | 54 | |
| Endaselassei | 1732 | 1643 | 3375 | 462 | 327 | 789 | 45 | |
| Grand total | 12,624 | 12,467 | 23,532 | 4562 | 1271 | 5833 | 260 | |
Table 2.
Summary of the latent class models.
| Models | No. of Classes | BIC | AIC | Npar |
|---|---|---|---|---|
| Model 1 | Class 1 | 2522.8096 | 2481.8387 | 16 |
| Model 2 | Class 2 | 2495.7854 | 2411.2829 | 33 |
| Model 3 | Class 3 | 2548.357 | 2420.3229 | 50 |
Source: Authors’ computations. Note: BIC = Bayesian Information Criterion; Npar = Number of parameters; AIC = Akaike Information Criterion.
Table 3.
Summary of the descriptive statistics.
| Variables | Measurement Attributes | Symbols | Valid N | Mean | SD | Min | Max |
|---|---|---|---|---|---|---|---|
| Dependent variable: Livelihood income |
| 260 260 | 9.06 9731.638 | 0.47 5324.157 | 7.93 2800 | 10.77 48,000 | |
| Endogenous variable: Social status | 1 = Low, 2 = Middle/High | 260 | — | — | 1 | 2 | |
| Instrumental variable: Degree of participation in social networks | 1 = Not active, 2 = Somewhat active, 3 = Very active, 4 = Leader | degreeParticipation | 260 | 2.20 | .85 | 1 | 4 |
| Explanatory variables: | |||||||
| Age of household head | Continuous variable measured in number of years | 260 | 53.51 | 8.07 | 40 | 80 | |
| Household’s spatial proximity to small town | 1 if nearest, 0 if farthest | 260 | — | — | 0 | 1 | |
| Off-farm work | 1 if yes, 0 if no | 260 | — | — | 0 | 1 | |
| Land size | Total land size measured in acres | 260 | 0.46 | 0.42 | 0.125 | 2 | |
| Ability to get new information by being a member | 1 = No/Very little, 2 = Little, 3 = Moderate, 4 = Much, 5 = Very much | newInformation | 259 | 3.8 | 0.74 | 1 | 5 |
| Learned something valuable by being a member | 1 = No/Very little, 2 = Little, 3 = Moderate, 4 = Much, 5 = Very much | valuableInformation | 259 | 3.61 | 0.88 | 1 | 5 |
| Livestock ownership | The number of livestock in Tropical livestock units (TLU) | 260 | 3.56 | 0.93 | 1.12 | 7.16 | |
| Credit | 1 if yes, 0 if no | 260 | — | — | 0 | 1 | |
| Exposure to multimedia | 1 if yes, 0 if no | 260 | — | — | 0 | 1 | |
| Access to market information | 1 = Quite difficult, 2 = Difficult, 3 = Neither, 4 = Easy, 5 = Quite easy | marketInformation | 260 | 1.46 | 0.57 | 1 | 3 |
Table 4.
VIF test for explanatory variables.
| Variable | VIF | 1/VIF |
|---|---|---|
| Sex of household head | 1.45 | 0.691390 |
| Off-farm work | 1.40 | 0.711872 |
| Household’s spatial proximity to small town | 1.18 | 0.847634 |
| Age of household head | 1.29 | 0.776973 |
| Exposure to multimedia | 1.16 | 0.858754 |
| Social status | 1.03 | 0.970332 |
| Land size | 1.05 | 0.948546 |
| Livestock ownership | 1.02 | 0.979453 |
| Credit | 1.01 | 0.987488 |
| Mean VIF | 1.18 |
Table 5.
Test of endogeneity.
| Tests of Endogeneity Ho: Variables Are Exogenous | ||
|---|---|---|
| Durbin (Score) Chi2(1) | Wu–Hausman F (1249) | p-Value |
| 14.55 | 14.76 | 0.00 |
Table 6.
Test of validity of instrument.
| First-Stage Regression Summary Statistics | |||||||
|---|---|---|---|---|---|---|---|
| Variable | R2 | Adjusted R2 | Partial R2 | Robust F (1250) | Prob > F | ||
| Social status | 0.12 | 0.08 | 0.09 | 14.44 | 0.00 | ||
| Minimum eigen value statistic = 26.07 Critical values Ho: Instruments are weak | Endogenous regressors: 1 Excluded instruments: 1 | ||||||
| 5% | 10% | 20% | 30% | ||||
| 2SLS relative bias | (not available) | ||||||
| 10% | 15% | 20% | 25% | ||||
| 2SLS Size of nominal 5% Wald test | 16.38 | 8.96 | 6.66 | 5.53 | |||
| LIML Size of nominal 5% Wald test | 16.38 | 8.96 | 6.66 | 5.53 | |||
Table 7.
2SLS estimates of the regression coefficients.
| Variables | Estimation | |
|---|---|---|
| Social Status | Income | |
| Estimates of 1st Stage 2SLS | Estimates of 2nd Stage 2SLS | |
| Constant | 1.65 (12.22) | 6.84 *** (10.05) |
| Social status | 0.75 ** (2.23) | |
| Age of household head | 0.001 (1.03) | −0.00007 (−0.02) |
| Sex of household head | 0.009 (0.20) | 0.13 (1.58) |
| Off-farm work | 0.01 (0.41) | 0.11 * (1.83) |
| Land size | 0.05 (1.70) | 0.14 ** (2.48) |
| Exposure to multimedia | −0.05 (−2.02) | 0.14 *** (2.68) |
| Credit | 0.002 (0.07) | −0.03 (−0.67) |
| Household’s spatial proximity to small town | 0.02 (0.90) | 0.66 *** (13.29) |
| Livestock ownership | 0.001 (0.13) | 0.05 ** (2.43) |
| Instrument | ||
| Degree of participation in social networks | 0.08 *** (5.11) | |
| R2 | 0.12 | 0.41 |
| F-statistic | 3.84 | |
| Wald chi2 | 274.61 | |
N = 260, Figures in the bracket are t-values in the 1st stage and Z-ratios in the 2nd stage. p-values where: *** Significant at 1% probability level; ** Significant at 5% probability level; * Significant at 10% probability level.
© 2018 by the authors. Licensee MDPI, Basel, Switzerland. This article is an open access article distributed under the terms and conditions of the Creative Commons Attribution (CC BY) license (http://creativecommons.org/licenses/by/4.0/).
Share and Cite
MDPI and ACS Style
Gebrekidan Abbay, A.; Rutten, R.; Azadi, H.; Witlox, F. How Social Status Contributes to Sustainable Livelihoods? An Empirical Analysis in Ethiopia. Sustainability 2019, 11, 68. https://doi.org/10.3390/su11010068
AMA Style
Gebrekidan Abbay A, Rutten R, Azadi H, Witlox F. How Social Status Contributes to Sustainable Livelihoods? An Empirical Analysis in Ethiopia. Sustainability. 2019; 11(1):68. https://doi.org/10.3390/su11010068
Chicago/Turabian StyleGebrekidan Abbay, Aradom, Roel Rutten, Hossein Azadi, and Frank Witlox. 2019. "How Social Status Contributes to Sustainable Livelihoods? An Empirical Analysis in Ethiopia" Sustainability 11, no. 1: 68. https://doi.org/10.3390/su11010068
Note that from the first issue of 2016, this journal uses article numbers instead of page numbers. See further details here.