Predicting Corporate Financial Sustainability Using Novel Business Analytics


1
Department of Management Information Systems, Dongguk University-Seoul, Seoul 04620, Korea
2
Department of Industrial Engineering, Hanyang University, Seoul 04763, Korea
3
Graduate School of Business IT, Kookmin University, Seoul 02707, Korea
*
Author to whom correspondence should be addressed.
Sustainability 2019, 11(1), 64; https://doi.org/10.3390/su11010064
Submission received: 7 November 2018
/
Revised: 13 December 2018
/
Accepted: 13 December 2018
/
Published: 22 December 2018
(This article belongs to the Special Issue Expert Systems: Applications of Business Intelligence in Big Data Environments)
Abstract
:Measuring and managing the financial sustainability of the borrowers is crucial to financial institutions for their risk management. As a result, building an effective corporate financial distress prediction model has been an important research topic for a long time. Recently, researchers are exerting themselves to improve the accuracy of financial distress prediction models by applying various business analytics approaches including statistical and artificial intelligence methods. Among them, support vector machines (SVMs) are becoming popular. SVMs require only small training samples and have little possibility of overfitting if model parameters are properly tuned. Nonetheless, SVMs generally show high prediction accuracy since it can deal with complex nonlinear patterns. Despite of these advantages, SVMs are often criticized because their architectural factors are determined by heuristics, such as the parameters of a kernel function and the subsets of appropriate features and instances. In this study, we propose globally optimized SVMs, denoted by GOSVM, a novel hybrid SVM model designed to optimize feature selection, instance selection, and kernel parameters altogether. This study introduces genetic algorithm (GA) in order to simultaneously optimize multiple heterogeneous design factors of SVMs. Our study applies the proposed model to the real-world case for predicting financial distress. Experiments show that the proposed model significantly improves the prediction accuracy of conventional SVMs.
1. Introduction
The financial sustainability of a company is one of the most important factors in maintaining the soundness of the state and society. In particular, the financial sustainability of the borrowers directly affects the sustainability of financial institutions. Thus, measuring and managing the financial sustainability of the borrowers has been an important role for those institutions. Financial institutions evaluate the sustainability of the borrowers by using the corporate financial distress prediction model. That is, the corporate financial distress prediction model plays an essential role for risk management of the financial institutions [1,2]. As a result, corporate financial distress prediction has long been an important research topic in finance and management literature. Financial distress prediction models proposed in previous studies have applied various statistical and artificial intelligence techniques like discriminant analysis (DA), logistic regression (LOGIT), decision tree (DT), case-based reasoning (CBR), and artificial neural network (ANN) [3,4,5,6,7,8]. Among them, ANN has been one of the most frequently used techniques because of its high prediction accuracy. However, in reality, many financial institutions still hesitate to adopt ANN due to its inherent limitations, such as the possibility of overfitting, difficulty in understanding the model (i.e., black box modeling), and the requirement of large data samples.
Under this background, support vector machines (SVMs) are being considered as an alternative to ANN [9,10]. ANN is based on the principle of empirical risk minimization, which means it is designed to seek to minimize misclassification error or deviation from the correct solution of each training datum. Thus, it is easy to fall into a local optimal solution in ANN. Contrast to ANN, SVMs are based on the principle of structural risk minimization, so it searches a decision boundary to minimize an upper bound of the generalization error. Therefore, overfitting is unlikely to occur with SVMs. Moreover, SVMs use only a small portion of training dataset, which is called ‘support vectors.’ For these reasons, a number of the recent studies on corporate financial distress prediction have used SVMs or SVM-based hybrid techniques as a classifier. Furthermore, most of them have shown that SVMs outperform other techniques, including ANN, for predicting corporate financial distress see [9,10,11,12,13,14,15,16,17,18,19].
Although SVMs have many advantages, the application of SVM is not quite simple because it requires the proper setting of some design factors. For example, selecting an appropriate kernel function and its parameters (e.g., C, d, ) and selecting an appropriate feature subset in SVMs may substantially affect the prediction performance. In addition, selecting proper instance selection (that is, prototype selection) may also improve the classification accuracy by eliminating irrelevant and distorting training samples. Nonetheless, these design factors were set by heuristics in most prior studies on SVMs.
Several studies have tried to apply a ‘grid-search’ algorithm to SVMs to search for the optimal parameters of the kernel function, but the method has been criticized because it may cause inferior efficiency problems [20,21]. There have also been some attempts to optimize feature subset selection, kernel parameters, or both of them. However, optimal instance subset selection has seldom been applied to SVMs, although it has proven to be effective for improving the prediction performance of other classifiers like CBR and ANN [8,19,22]. In particular, there have been no attempts to achieve a totally optimized SVM model that optimizes feature selection, instance selection, and kernel parameters all at once in the domain of financial distress prediction.
Therefore, this paper suggests a novel hybrid SVM model, which simultaneously optimizes feature subsets, instance subsets, and kernel parameters in order to raise the prediction accuracy of the financial distress. For the simultaneous optimization of multiple heterogeneous factors, this study adopts genetic algorithm (GA), which has been applied by numerous prior studies as an optimization tool [8,22,23,24]. To validate the effectiveness of the proposed model, this paper applies the proposed model to a real-world case for corporate financial distress prediction and reviews the experimental results from the application.
The rest of this paper is organized as follows. The following section briefly introduces related works on corporate financial distress prediction and reviews two main techniques of our proposed model—SVMs, GA, and the combination of these two techniques. Section 3 proposes our research model, the simultaneous optimization of feature subset, instance subset, and kernel parameters via the GA approach. The following section provides research design and experiments. In Section 5, the experimental results and their meanings are presented. In the final section, the conclusions and limitations of the study are presented.
2. Literature Review
We propose the combined model of two artificial intelligence techniques, SVMs and GA for achieving effective corporate financial distress prediction. Thus, we first review prior studies on corporate financial distress prediction and examine their limitations. Next, we examine the basic concepts of SVMs and GA, which are the core algorithms of this study. Finally, we review previous studies that attempted to optimize SVM and GA.
2.1. Prior Studies on Financial Distress Prediction
Since predicting corporate financial distress is critical for risk management in companies and financial institutions, there has been substantial research in this area by academics. Most prior studies have tried to predict corporate financial distress using the signals of financial data or ratios. To do this, they adopted various data-driven techniques including DA, LOGIT, DT, CBR and ANN.
For example, Altman [3] tried to predict corporate financial distress using DA. A more recent study by Ohlson [4] used LOGIT and PROBIT to predict the financial distress. Falbo [25] proposed a modified DA model for credit scoring in order to improve discriminatory power by reflecting trend and stability of multiple year financial/operating ratios.
In contrast to early studies that had applied statistical techniques in corporate financial distress prediction, modern studies started to apply artificial intelligence (AI) techniques to predict financial distress. For example, Odom and Sharda [5] and Tam and Kiang [6] proposed ANN as a classifier for predicting corporate financial distress. Tam [26] and Malhotra and Malhotra [27] also applied ANN to predict bank financial distress and problem consumer loans, respectively. Several later studies further investigated the use of AI or data mining techniques in financial distress prediction. A large portion of these studies mainly applied ANN and tested its feasibility in predicting corporate financial distress because of its high prediction accuracy. However, ANN has many drawbacks, including the risk of overfitting problems, the need to determine the value of the control parameters and the number of processing elements in the layer. In addition, training ANN generally requires a large sized training dataset. Thus, SVMs have recently attracted increasing attention. SVMs are known to mitigate the limitations of ANN, and numerous prior studies report that SVMs outperform ANN from the perspective of prediction accuracy. As a result, several recent studies on predicting financial distress have adopted SVMs as an alternative to ANN [9,10,11,12,14].
2.2. SVM and its Application to Financial Forecasting
The basic SVM concept, proposed by Vapnik [28], was designed for mitigating typical binary (two-class) classification problems. It is based on two main ideas—(1) maximum margin classification, and (2) nonlinear mapping of the input vectors into a high-dimensional feature space.
Basically, SVMs are designed to use a special kind of linear model for classification, which is called ‘the maximum margin hyperplane.’ Given a training dataset, SVMs seek to find an optimal separating hyperplane with the maximum-margin separation between the decision classes. At this time, the training samples closest to the maximum margin hyperplane are called support vectors. In SVMs, only support vectors are used for defining the class boundary. Thus, when the number of training samples is not enough, SVMs are known to be more robust compared to ANN.
In order to implement nonlinear classification using a linear model, SVM adopts nonlinear mapping of the input vectors into a higher dimension. It means that SVM transforms inputs into the high-dimensional feature space and constructs a linear model in order to implement nonlinear class boundaries. The function , termed ‘kernel function,’ is used for this transformation. There are several types of kernel functions, but among them, two types are generally adopted in applications [21]. They are (1) the polynomial kernel and (2) the Gaussian radial basis function (RBF) , where d is the degree of the polynomial kernel and is the bandwidth of the Gaussian RBF kernel. Among these two kernel types, the Gaussian RBF is known to be superior to the polynomial kernel in terms of accuracy and efficiency [21,29,30].
The SVM described above works properly only for the separable case, that is, the case where the training data is linearly separable. However, in reality, the most cases are linearly inseparable. For these non-separable cases, SVM has to adopt an additional penalty function associated with misclassification. This leads to the use of an additional parameter C, which is the upper bound of the Lagrange multipliers for finding the optimal hyperplane. The parameter C should be set to reflect the knowledge of the noise on the data, but it is mostly set by heuristics since it is difficult to seize the distribution of noise in the data in advance [10,22,28,30]. For more details on how the SVM algorithm works, readers may refer to Gunn [31].
SVMs have many advantages over ANN. First, the parameters of SVMs to be tuned are few. Except for the upper bound for the non-separable cases, and some parameters (e.g., or ) contained in the kernel functions, there are no parameters to be determined in SVMs [32]. Overfitting is also unlikely to occur with SVMs. Overfitting lies in excessive flexibility in the decision boundary, but the maximum hyperplane of SVMs is relatively robust and allows for little flexibility [33].
There have been some studies on applying SVMs to financial forecasting. Mukherjee et al. [34] and Tay and Cao [35] examined the predictability of financial time-series data with SVMs. Especially, Tay and Cao [35] showed that SVM is superior to ANN according to the several criteria including normalized mean square error, directional symmetry and so on. Similar to Tay and Cao [35], Kim [36] used SVMs to forecast the future direction (up or down) of the stock market index in Korea. In this study, the author compared the performance of SVMs with that of other techniques like ANN and CBR, and reported that SVMs showed the best prediction accuracy.
Several recent studies investigated the applicability of SVMs to corporate financial distress prediction. Fan and Palaniswami [9] showed that SVMs outperformed other traditional techniques, such as DA, multi-layer perceptron (MLP), and learning vector quantization (LVQ), in predicting corporate financial distress. Shin et al. [10] empirically showed that the accuracy and generalization performance of SVMs were better than those of ANN, as the training set size decreased. Min and Lee [11] also showed that SVMs outperformed LOGIT, DA, and ANN in predicting corporate financial distress. Other than these studies, Ahn et al. [24], Chen and Hsiao [21], Huang et al. [37], Wu et al. [38], and Zhou et al. [39] also empirically validated the superiority of SVMs or SVM-based hybrid techniques for predicting financial distress.
2.3. Genetic Algorithm (GA)
GA is known as an efficient and effective search method that attempts to simulate the biological evolution phenomenon. It is popularly employed to find near-optimal solutions for large search spaces [40]. With the application of genetic operations, it is designed to gradually improve the search results. In particular, a mechanism like mutation prevents GA from falling into the local optima, and a mechanism like crossover can reduce search time. The general evolution process of GA proceeds as follows.
First, a set of solutions is randomly created. This set is called a population. Additionally, each solution in the population is called a chromosome. A chromosome should be designed to represent a solution, and it is designed in most cases as the form of a binary string.
After generating the initial population, genetic operators are applied to the population. There are many kinds of genetic operators, but selection, crossover, and mutation are popularly used. The selection operator selects the fittest chromosomes by evaluating the fitness value of each chromosome. Here, the fitness value of each chromosome is calculated from a user-defined function, called fitness function. In general, accuracy is used as a fitness function for the classification problems. The crossover operator exchanges the genes of two parent chromosomes to obtain new offspring to achieve better solutions. In the mutation operator, the bits that are arbitrarily selected with very low probability are inverted. By applying these genetic operators, a new population is formed, consisting of the fittest chromosomes as well as offspring of these chromosomes, based on the philosophy of survival of the fittest.
2.4. Optimization of SVM Using GA
Until now, many researchers have proposed various ways for optimizing the design factors of SVMs using GA. Their approaches can be classified into four categories. The first category is to apply GA to optimize ‘the kernel function and its parameters.’ For example, Pai and Hong [29] used GA to optimize free parameters used in the kernel function of SVMs. In particular, they used Gaussian RBF as the kernel function, proposed a novel SVM model that used optimized , ε parameters through GA.
Wu et al. [38] also proposed a GA based SVM model to optimize some parameters of SVM, C and , for obtaining the highest accuracy and generalization ability. They used a real-valued GA to optimize two parameters of SVMs for predicting financial distress. They compared the accuracy of the proposed model with that of other models including DA, LOGIT, PROBIT, ANN, and conventional SVMs. The paper showed that the proposed model outperformed the other comparative models.
Chen and Hsiao [21] integrated GA and SVMs to create a model to diagnose the business crisis of Taiwan firms by optimizing and of SVMs. They compared the prediction performance of the integrated GA-SVM with all available variables and that of the GA-SVM with the selected variables from DA. The results showed that the GA-SVM with the selected variables from DA performed better than the other models including the GA-SVM with all variables and conventional DA.
Gu et al. [43] proposed a hybrid of GA and SVM (termed ‘G-SVM’) approaches in housing price forecasting. In their study, SVMs were proven to be a robust and competent algorithm for both classification and regression in many applications. They also applied GA to simultaneously optimize the parameters of SVMs and compared the results with those of the grey model. The experimental results showed that the forecasting accuracy of the G-SVM approach was superior to that of the grey model.
Howley and Madden [44] tried to extend the targets of optimization. Specifically, they proposed a new GA-SVM model that the optimized kernel parameters as well as kernel function. As a result, they could present the globally-optimized kernel function and parameters.
The second category of GA-optimization of SVM is ‘feature (subset) selection.’ Feature selection is to select only a small subset of features that are relevant to the dependent variable. The proper selection of the input features may enhance classification performance by characterizing each sample more accurately [37,45]. Moreover, it reduces the space of input vectors, so it makes the classification work more efficiently. For these reasons, studies on feature selection have been conducted for a long time, and many of them have adopted GA as a tool for achieving optimal feature selection regardless of their classifiers. At an early stage, feature selection using GA was mainly applied to the classifiers like CBR or ANN. However, some recent studies have tried to optimize the feature selection of SVMs using GA in order to solve various problems. For example, Lee and Byun [46] and Sun et al. [47] applied this technique for identification of the images and Li et al. [23] employed it for detecting cancer. It is also applied in gear fault detection [48], abnormal keystroke detection [49], direct marketing [50], and stock market prediction [51].
The third category is the ‘simultaneous optimization of kernel parameters and feature subset selection.’ Since both kernel parameters and appropriate feature selection affect the classification performance of SVMs, it is more reasonable to optimize these factors all at once. Nonetheless, there are only a few prior studies that tried this approach.
Kim et al. [23] applied this technique for detecting network intrusion and Jack and Nandi [52] used this for detection of machinery faults. Zhao et al. [53] suggested that this approach can improve protein sequence classification. Additionally, Min et al. [12] used this approach for corporate financial distress prediction. All of them reported that the prediction performance of their proposed models are superior to other comparative models.
Huang and Wang [20] tried several real-world datasets using GA-based simultaneous optimization model of kernel parameters and feature selection. They found that their proposed approach significantly improved the classification accuracy as well as decreased the number of the input features for SVMs compared with the grid algorithm—a traditional method of performing parameters searching.
Huang et al. [37] tested the usability of the hybrid GA-SVM model in the context of credit scoring area. They proposed three SVM-based modes: The first mode is to optimize the model parameters using the grid search, the second is to calculate the F-score to select the input features, and the last mode is to simultaneously optimize model parameters and input features using genetic algorithms. The experimental results showed that SVMs with the GA model outperformed the other two models for two real-world credit datasets. They concluded that the hybrid GA-SVM model achieved good classification performance with a small feature subset.
The final category is to simultaneously optimize feature selection, instance selection, and kernel parameters. Similar to feature selection, instance (subset) selection is the method of selecting an appropriate subset of the training samples. It is also called ‘editing’ or ‘prototype selection’ [8]. It may enhance the quality of prediction by avoiding the selection of noisy or distorted training samples as support vectors. Due to its advantages, it has long been applied to various classification techniques, including ANN [54] and CBR [55]. However, there have been few studies that introduced instance selection using GA for SVMs. Only a few premature studies like our preliminary study [24], Tahayna et al. [56] and Tahayna et al. [57] tried to adopt the simultaneous optimization of the design factors in SVMs including instance selection by using GA. Especially, as far as we know, there have been no attempts to simultaneously optimize all of the design factors in SVMs using GA in order to build a better financial distress prediction model. From this perspective, we propose a global optimization model that optimizes the selection of proper features, instances, and kernel parameters of SVMs using GA for financial distress prediction.
3. Global Optimization Model of SVM using GA
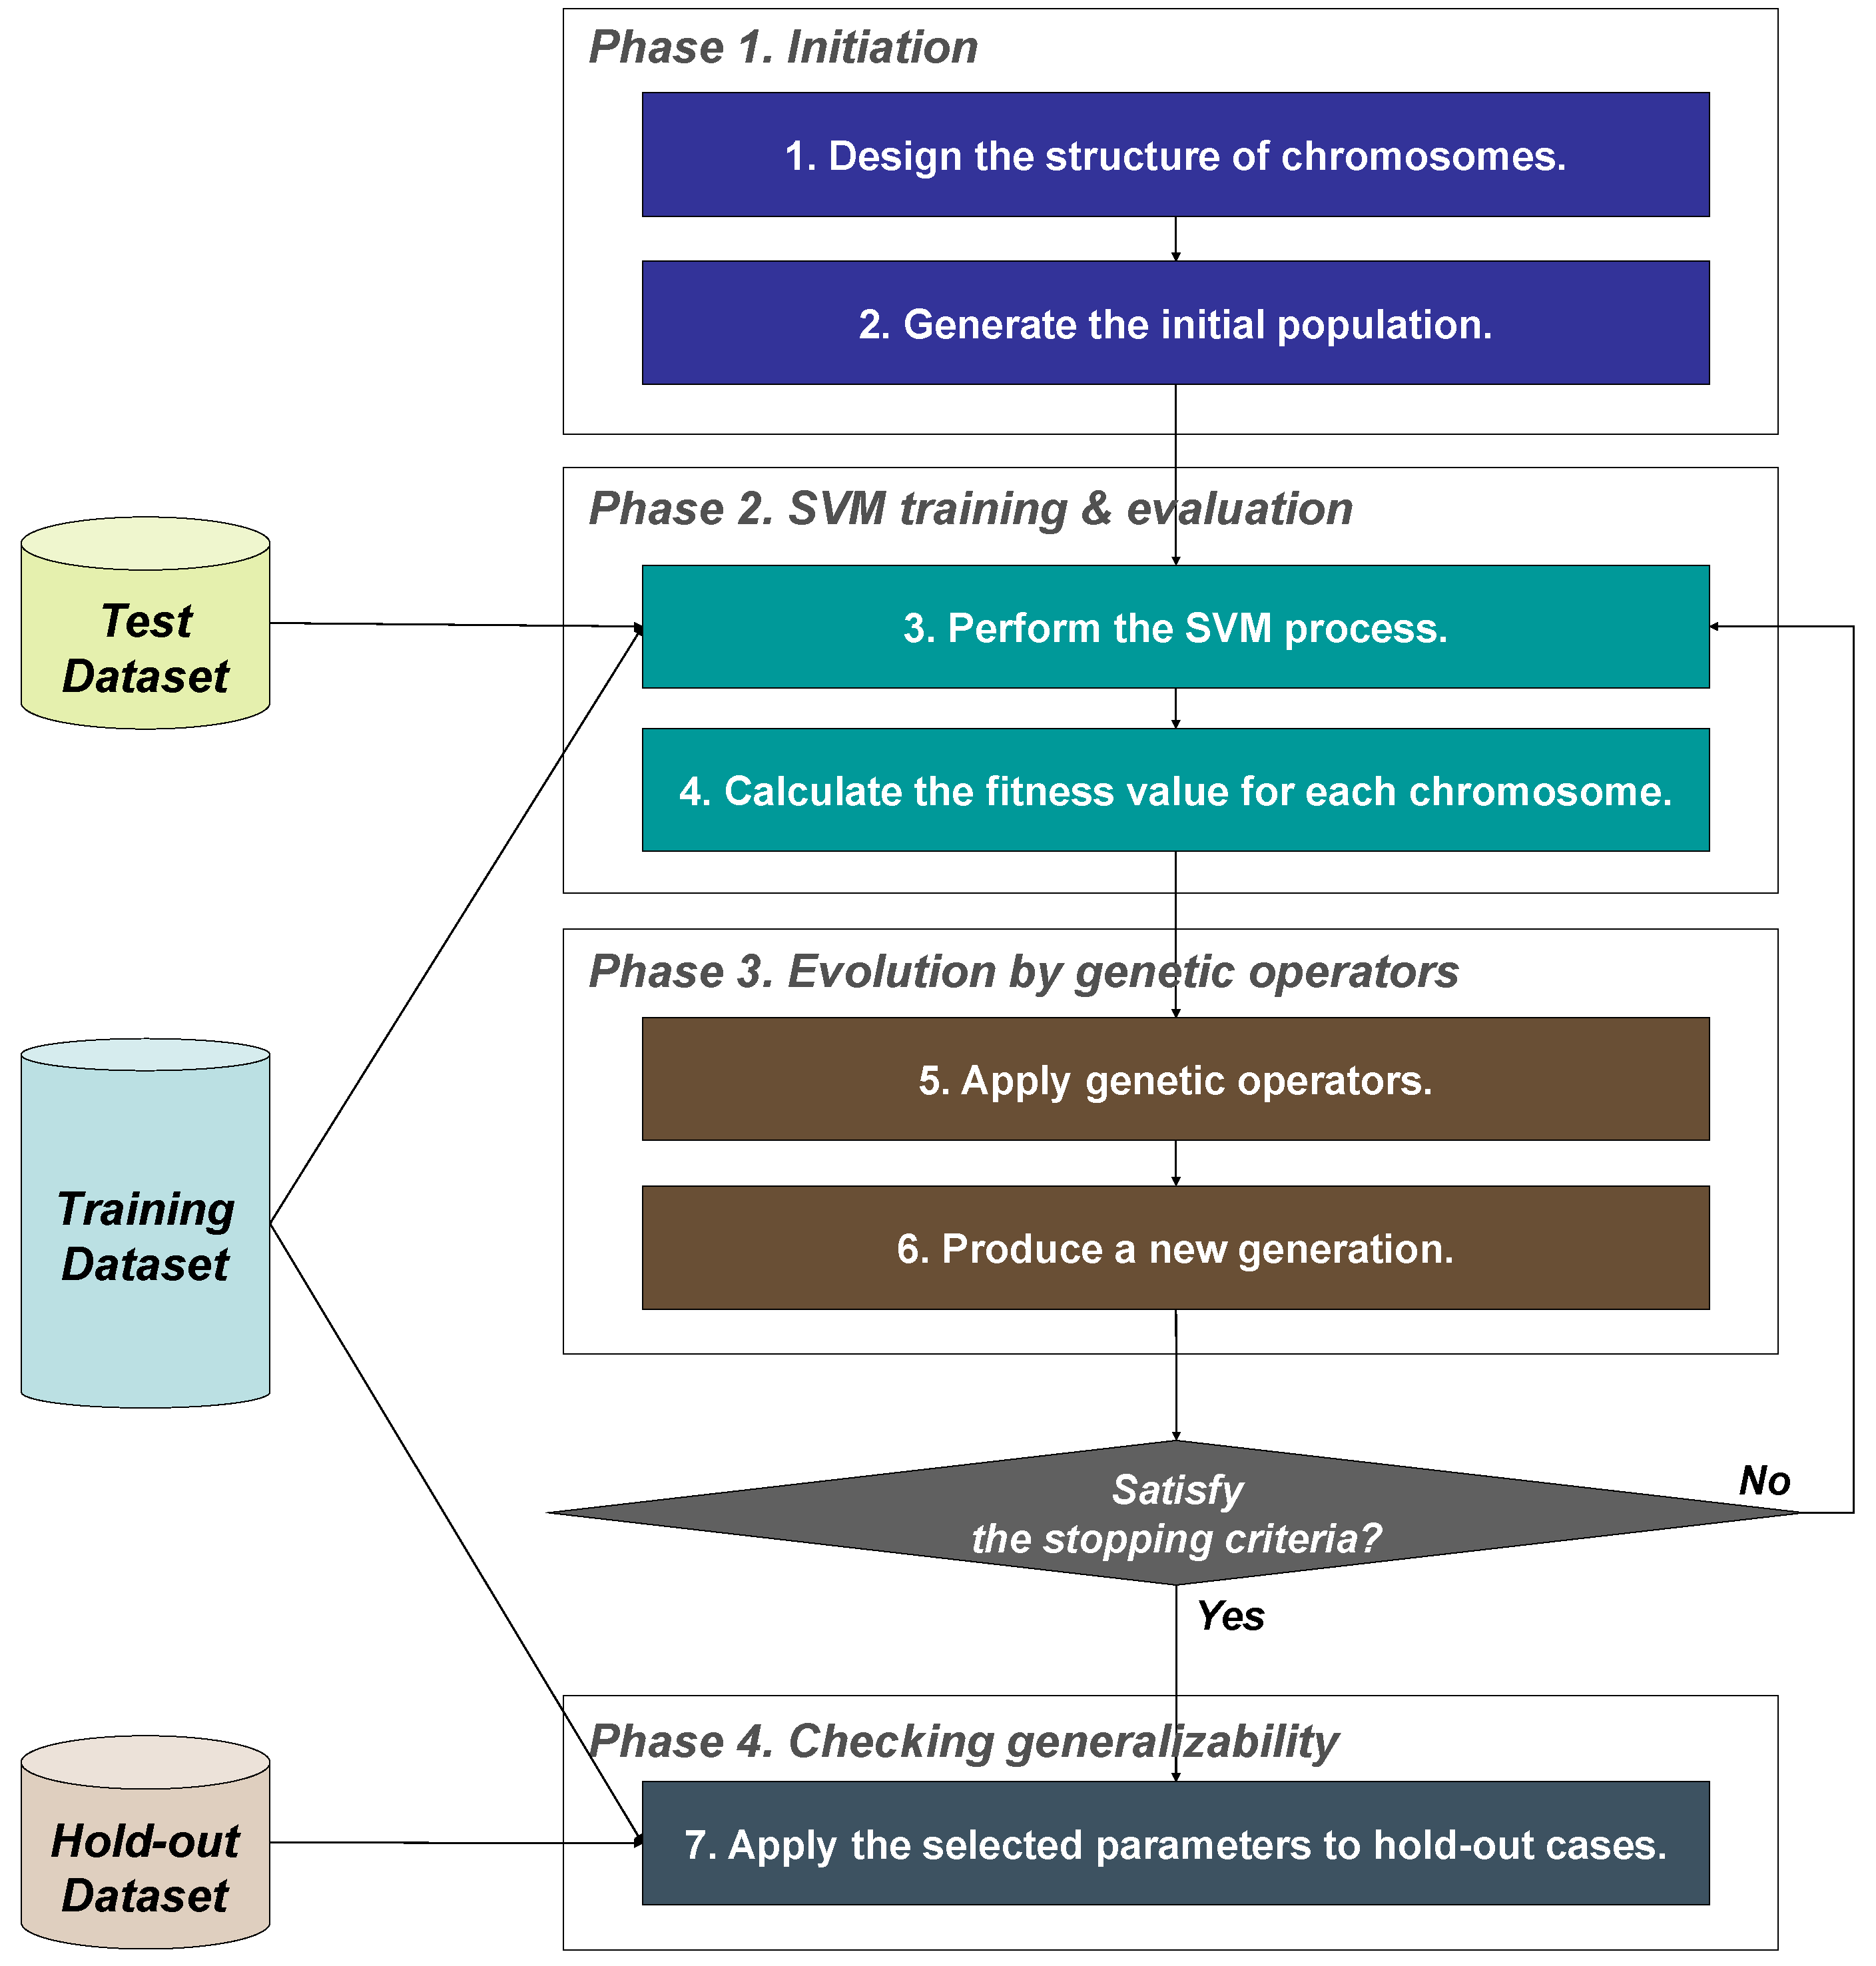
As mentioned before, we propose a novel SVM model, which simultaneously optimizes feature selection, instance selection, and kernel parameter settings by using GA. We will hereafter call our model GOSVM, which denotes Globally Optimized SVM model. This section describes how GOSVM works. Figure 1 represents the process that shows how GOSVM works. The detailed explanation for each step of GOSVM is presented as follows.
3.1. Phase 1. Initiation
The goal of the first phase is to generate the initial population of the GA search. To do this, the structure of a chromosome should be designed first. In order to apply the genetic operators, the values to be encoded into a chromosome should be transformed into binary strings. Each chromosome in GOSVM has to contain all the information on feature selection, instance selection, and kernel parameter settings. As the values of the codes for feature selection and instance selection are set to “0” or “1,” the selection is usually easily encoded as a binary string, where “0” indicates that the feature or instance is not selected and “1” indicates that the feature is selected. For kernel parameters, their values are converted to binary. The bits assigned to the values of kernel parameters determine the precision level. In this study, we assign eight bits per parameter so that, for one kernel parameter within an interval of , the encoded value from 6-bits codes is linearly mapped to . Additionally, GOSVM applies the Gaussian RBF as the kernel function because it has been proven to be the best performing kernel function in some prior studies [21,29,30]. Tay and Cao [35] presented that the upper bound C and the kernel parameter σ2 are important for SVM performance for the Gaussian RBF kernel function. Thus, the chromosome of GOSVM is designed to optimize the two kernel parameters (C, σ2) of the Gaussian RBF kernel function. Finally, the length of each chromosome becomes m + n + 12 bits, where m is the number of features and n is the number of instances.
After finishing the design of chromosome structure, GOSVM generates the initial population. At this point, the values of the chromosomes in the population must be assigned random values prior to the search process.
3.2. Phase 2. SVM Training and Evaluation
In this phase, GOSVM repeatedly performs a typical SVM process according to the assigned value of the factors in the chromosomes. Then, it evaluates the fitness value of each chromosome. The main objective of the GA search in GOSVM is to find the optimal or near-optimal design factors that lead to the most accurate prediction. From this perspective, we use the prediction accuracy of the test dataset as the fitness function of GOSVM [41,58,59]. However, one can choose performance measures other than prediction accuracy.
3.3. Phase 3. Evolution by Genetic Operators
In the third phase, GOSVM applies genetic operators, such as selection, crossover, and mutation, to the current population based on the evaluation results produced in Phase 2. By doing this, a new generation of the population is generated in this phase.
After the production of a new generation, Phase 2—the SVM training process with the evaluation of the fitness values—is processed again in order to evaluate the newly generated population. The next generation is then created in Phase 3. That is, from this point, Phases 2 and 3 are iterated until the stopping conditions are satisfied. Once the stopping condition is satisfied, the chromosomes representing the best fitness value in the last population is finally selected and the optimal values of the design elements of the GOSVM (i.e., feature selection, instance selection, and kernel parameters) are determined by the values encoded on the chromosome.
3.4. Phase 4. Checking for Generalization
The optimized design factors determined by GA generally fit well into the test data because the GA search of GOSVM is guided by the prediction accuracy of the test dataset. However, they occasionally show poor prediction performance when applied to an unknown dataset. The reason this phenomenon occurs is due to the choosing of an inappropriate model, lack of observations, and overfitting to name a few. Among them, we can deal with overfitting in practice as follows. That is, if the design factors of GOSVM fit too well with the given test dataset, they may lose general applicability. To avoid the danger of overfitting and check for the generalization of the determined factors, GOSVM applies the finally selected design factors—the optimal feature and instance subset and kernel parameters—to the hold-out set in the last phase.
4. The Research Design and Experiments
4.1. Application Data
To empirically validate the usefulness of GOSVM, we applied it to a real-world case of predicting the corporate financial distresses. The experimental data were provided from H commercial bank in Korea. The data consisted of 1548 randomly chosen, heavy industry companies. Among them, 774 cases filed for financial distress between 1999 and 2002, and the remaining 774 cases were non-bankrupt in the same period. The data contained detail values from financial statements as well as the status of bankruptcy or non-bankruptcy of the corresponding companies. The status of financial distress (i.e., the dependent variable of the experiment) was categorized as “0” or “1”. Here, “0” denoted that the corporate was in financial distress, and “1” denoted solvent.
To create appropriate independent variables for the prediction model, we generated 162 financial ratios from the raw values of the financial statements and used them as the candidates for independent variables. Based on the results of statistical analyses and the expert opinion of those responsible for approving and managing loans in the bank, we finally selected 41 financial ratios as the independent variables. To evaluate GOSVM with the evaluation function described in the previous section, we split the whole data into three subsets: Training, test, and hold-out datasets in the proportions of 60% (928 companies), 20% (310 companies) and 20% (310 companies), respectively.
4.2. Comparative Models
To test the effectiveness of the proposed model, we also applied five different SVM models to our experimental datasets. The first comparative model, labeled COSVM (COnventional SVM model), performs the conventional approach of SVMs. COSVM uses all the available features and all available instances. That is, there is no special process of feature subset selection or instance subset selection here. The kernel parameters in this model were determined by varying their values manually.
The second model, labeled GSSVM (SVM model with Grid Search), is almost the same as COSVM, except that it uses the grid search technique to determine the values of kernel parameters. Grid search creates combinations of the possible values of the kernel parameters first. It then applies each combination to an SVM model, and evaluates the model using cross-validation to find the best combination. Similar to COSVM, GSSVM contains no mechanism for selecting an optimal feature subset or an instance subset.
In the third model, GA seeks the optimal kernel parameters. We term this model KPSVM (Kernel Parameter optimized model of SVM by GA). Similar to COSVM and GSSVM, KPSVM also does not contain any function of feature selection or instance selection. The studies Pai and Hong [29], Wu et al. [38], Chen and Hsiao [21], and Gu et al. [43] proposed a similar model.
The fourth model is designed to select relevant features and to determine the optimal kernel parameters using GA. However, similar to the prior comparative models, FSSVM is also unconcerned with instance selection. We call this model FSSVM (Feature Selection optimized model of SVM by GA). The prior studies of Jack and Nandi [52], Zhao et al. [53], Min et al. [12], Huang and Wang [20], Huang et al. [37], Kim et al. [60] used this approach.
The fifth comparative model is ISSVM (Instance Selection optimized model of SVM by GA). In ISSVM, GA is used to select an appropriate instance subset, and determine the proper value of kernel parameters. However, it differs from GOSVM since it does not consider feature subset selection.
In addition, we applied four other comparative models to the given datasets in order to examine the prediction performances of GOSVM. They include LOGIT, DA, ANN, and CBR. For LOGIT, we used a forward and backward selection procedure, and set the probability for stepwise entry to 5%. For DA, we applied a stepwise method, which selected input variables based on Wilk’s λ. In addition, F values were used as the criterion for entry or removal of the input variables for DA. For ANN, we adopted a standard three-layer backpropagation network (BPN) with a standard hidden layer. The learning rate and momentum rate of the ANN were set at 10% and the sigmoid function was used as the transfer function of the hidden and output nodes. We repeatedly experimented with changing the number of nodes in the hidden layer to n/2, n, 3n/2, and 2n, where n is the number of the input variables. In addition, we finally selected the number of nodes in the hidden layer which showed the best prediction accuracy for the hold-out dataset. A total of 150 learning epochs were set as the stopping condition of ANN. For CBR, we applied k-Nearest Neighbor (k-NN) algorithm, and selected k that showed the best performance in the range from 1 to 10.
4.3. Experimental Settings and System Development
For all the SVM models that use GA search (that is, KPSVM, FSSVM, ISSVM and GOSVM), the population size for the GA search was set to 200 organisms, and the crossover and mutation rates were set to 70% and 10%. As a stopping condition, 200 generations were permitted. The experiments for those SVM models were conducted using our proprietary experimental software designed to perform SVM training using the design factors optimized by GA. This software was developed on a Java platform, and the class for SVM training was based on LIBSVM, public software for SVMs [61]. Moreover, COSVM and GSSVM were done using LIBSVM. The implementation was uploaded to a public repository, https://github.com/skylee1020/gasvm.
In the case of other comparative models such as LOGIT, DA, CBR, ANN and SVM, we used different professional software for each model. To apply statistical models like LOGIT and DA, we used IBM SPSS for Windows Version 19.0. The experiments of ANN were done by using Ward System’s Neuroshell2 R4.0. Additionally, CBR was experimented using our proprietary experimental software, which implemented k-NN algorithm using VBA (Visual Basic for Applications) of Microsoft Excel 2013. For SVM-based comparative models including COSVM and GSSVM, LIBSVM v2.5 was used. Grid search of GSSVM was experimented using “grid.py”, a Python program included in the LIBSVM package. The search scopes of the parameters and in GSSVM were set to 8–128 (23–27), and 0.0078–1 (2−7–20) respectively. In addition, the step sizes of grid searches for and in GSSVM were set to 0.5 each.
5. Experimental Results
In this section, we compare the prediction performances of GOSVM and other comparative models. The detailed experimental results of some comparative models including CBR, ANN and COSVM are presented in Appendix A. Table 1 summarizes the average prediction accuracy of GOSVM and SVM-based comparative models (COSVM, GSSVM, KPSVM, FSSVM, and ISSVM), and Table 2 summarizes the average prediction accuracy of GOSVM and conventional classification models (LOGIT, DA, CBR and ANN). As shown in these tables, the prediction accuracy of GOSVM is the highest.
As shown in Table 1, GOSVM achieves the highest prediction accuracy for the hold-out dataset by 5.8%, 6.1%, 3.8%, 2.9%, and 0.9% compared to COSVM, GSSVM, KPSVM, FSSVM, and ISSVM, respectively. Though the difference of prediction accuracy between GOSVM and ISSVM is quite marginal, the differences with other comparative SVM models are obvious. Additionally, it is interesting that ISSVM outperforms FSSVM by 2%. That is, the selection of appropriate instances is more important than proper selection of the input features for this dataset. This experimental result can be interpreted as the evidence that the optimal instance selection is very important for improving not only CBR and ANN, but also SVM. In addition, FSSVM selected 25 features (61%) of a total of 41 features, and ISSVM selected 492 samples (53%) of a total of 928 training samples. GOSVM only used 80% (33 features) of the total features, and 62% (571 samples) of the total training samples. This implies that the optimal feature and instance selection leads to the efficiency of SVM training by reducing the number of features and instances to be trained.
It is also interesting that the performance of GSSVM is poorer than that of COSVM. The grid search as a technique for determining the optimal kernel parameters has already been criticized in some prior studies [20,21]. The result of our study corresponds with the results from these studies.
In Table 2, GOSVM outperforms LOGIT, DA, CBR and ANN by 5.5%, 7.7%, 11.9%, and 10.0%, respectively. Among the conventional classification models, LOGIT showed the best prediction accuracy, but the gap between LOGIT and GOSVM is wide. Thus, we can conclude that SVM-based models are generally better than traditional classification models, and among these SVM-based models, the proposed model—GOSVM—is the best.
To test whether or not the differences shown in Table 1 and Table 2 are statistically significant, this study used the two-sample test for proportions. With this test, we can check if there is a difference between the two probabilities when the prediction accuracy of the left-vertical method is compared to the right-horizontal methods [62]. Since we compared prediction accuracy that can be interpreted as probability, applying this test to our experimental results was reasonable. In the test, the null hypothesis was set to , while the alternative hypothesis was where and . Here, pk denotes the classification accuracy of the kth model, and n denotes the total number of models to be tested. Table 3 shows the Z values of the pairwise comparison between models.
As shown in Table 3, GOSVM outperforms DA, CBR and ANN at the 1% statistical significance level and LOGIT, COSVM, and GSSVM at the 5% statistical significance level. GOSVM also outperforms all other comparative models, except for ISSVM at the 10% statistical significance level. Thus, we may conclude that our proposed approach achieves better prediction performance as a whole. However, ISSVM which optimizes the instance selection also shows promising prediction accuracy that is as good as our model in practice.
To verify the results of this study further, we additionally reviewed several non-parametric multi-pairwise statistical tests. In particular, we reviewed Diebold and Mariano [63], Derrac et al. [64], and Fan et al. [65], but the tests presented in the references are found to be not suitable for this study because they require ranking of the results. This was impossible because only the binary classification values that classify the defaults and non-defaults could be calculated in this study. Therefore, we additionally employed the McNemar test, a non-parametric statistical test that has widely been used in the field of corporate financial distress prediction. In contrast to the two-sample test for proportions which is parametric, McNemar test is a non-parametric statistical test used on paired dichotomous observations to test the differences between proportions [8]. Table 4 presents McNemar values to compare the prediction accuracies of ten models for the hold-out data. As shown in the table, GOSVM is better than DA, CBR, ANN, COSVM and GSSVM at the 1% statistical significance level, and better than LOGIT at the 5%, and KPSVM at the 10%. However, it does not outperform FSSVM and ISSVM with statistical significance.
6. Conclusions
Prediction of financial distress or bankruptcy risks by employing the appropriate model with high accuracy has become an important research issue in the area of business analytics [1,2,66]. In this study, we have suggested a new kind of hybrid SVM and GA model, termed GOSVM, in order to improve the performance of the typical SVM algorithm for financial distress prediction. This paper proposed GA as a tool for simultaneously optimizing multiple design factors such as feature selection, instance selection, and kernel parameters. From the experiment results, we found that GOSVM, our proposed model, outperformed SVM-based comparative models as well as conventional classification models in terms of predicting financial distress. Additionally, we found proper instance selection might influence the prediction performance of SVMs more than appropriate feature selection.
The major contribution of our study is that we proposed a new way for improving the performance of SVMs and validated it empirically by applying it to the real-world financial distress dataset. Since the misclassification cost is very huge, it is very important to improve accuracy when building the financial distress prediction model. We expect that our proposed method will be able to contribute to the performance enhancement of financial distress prediction models.
Though the main idea of this study is quite technical, its main goal (i.e. proposal of the solution for better financial distress prediction) is closely related to financial sustainability. Inaccurate credit rating based on poor financial distress prediction can cause improper asset pricing, which threatens the financial sustainability of our society. A representative example is the global financial crisis in 2007 to 2008. It began with a crisis in the subprime mortgage market in the U.S., which happened due to wrong asset pricing based on inaccurate credit rating. As we saw in 2007 to 2008, poor risk management of financial institutions may lead to the collapse of the state or society. Thus, our study can contribute to the domain of sustainability, especially financial sustainability.
In addition, until now instance selection has received less attention than feature selection in prior studies on SVMs. However, our experimental results imply instance selection may play a more critical role in improving prediction performance. This can be another academic contribution of our study. We expect that our study will lead to more future studies on the application of proper instance selection to SVM.
The limitations of this study are as follows. First, GOSVM requires too many computational resources to obtain optimal design factors of SVMs. Generally, GA-based optimization models have this limitation in common because they find the optimal solution using iterations. In the case of GOSVM, it should repeat SVM training tens of thousands of times. Although SVMs are originally a very efficient algorithm and takes a short time for training, such iteration may cause too much time consumption. Consequently, efforts to make the training of GOSVM more efficient should be pursued in the future.
Second, further investigation is needed to select the optimization technique for SVM in future studies. In this study, we just adopted GA, and did not considered other alternatives because it is the most popular technique in our domain. However, there are various optimization techniques such as simulated annealing (SA), tabu search (TS), and particle swarm optimization (PSO) other than GA. Proper selection of the optimization technique may lead to better prediction accuracy. Thus, the effectiveness of other optimization techniques should be tested in the future.
Third, the generalization of GOSVM should be tested further. Our study did not adopt k-fold cross-validation, but it may lead to less biased (i.e. more generalized) experimental results. Additionally, GOSVM can be applied to any type of classification problems that require accurate prediction, though we applied it to the corporate financial distress prediction here. Thus, in the future, we need to validate the general applicability of GOSVM further by applying it to other classification domains.
Author Contributions
Conceptualization, Kyoung-jae Kim and Hyunchul Ahn; Data curation, Hyunchul Ahn; Investigation, Kichun Lee; Project administration, Kyoung-jae Kim; Software, Kichun Lee; Writing—original draft, Kyoung-jae Kim and Hyunchul Ahn; Writing—review & editing, Kyoung-jae Kim and Hyunchul Ahn.
Acknowledgments
This research was supported by the grant (2015S1A5A2A03047963) funded by the Ministry of Education and National Research Foundation of Korea.
Conflicts of Interest
The authors declare no conflict of interest.
Appendix A. Detailed Experimental Results
(1) CBR(k-NN)
| k of k-NN | 1 | 2 | 3 | 4 | 5 | 6 | 7 * | 8 | 9 | 10 |
| Prediction accuracy (%) for hold-out data | 60.6 | 56.8 | 63.5 | 62.6 | 67.1 | 66.8 | 68.4 * | 64.5 | 66.8 | 65.2 |
| * The best prediction accuracy. | ||||||||||
(2) ANN
| The number of nodes in the hidden layer | 21 | 42 * | 63 | 84 | |
| Prediction Accuracy | Training data | 72.0% | 72.8% | 71.4% | 72.7% |
| Test data | 71.6% | 71.9% | 70.6% | 71.3% | |
| Hold-out data | 69.7% | 70.3% * | 69.0% | 68.4% | |
| * The best prediction accuracy. | |||||
(3) COSVM
| Kernel function and its parameters | Train data | Hold-out data | ||
| Linear function | C = 1 | 75.9% | 74.5% | |
| C = 10 | 77.6% | 73.2% | ||
| C = 33 | 78.2% | 72.3% | ||
| C = 55 | 78.7% | 73.2% | ||
| C = 78 | 78.6% | 72.9% | ||
| C = 100 | 78.8% | 73.5% | ||
| Polynomial function | C = 1 | d = 1 | 69.7% | 69.7% |
| d = 2 | 69.1% | 69.7% | ||
| d = 3 | 65.8% | 66.1% | ||
| d = 4 | 50.0% | 50.0% | ||
| d = 5 | 50.0% | 50.0% | ||
| C = 10 | d = 1 | 74.2% | 74.5% | |
| d = 2 | 73.3% | 71.3% | ||
| d = 3 | 70.3% | 71.3% | ||
| d = 4 | 68.9% | 70.0% | ||
| d = 5 | 53.2% | 54.8% | ||
| C = 33 | d = 1 | 75.1% | 74.5% | |
| d = 2 | 74.9% | 73.5% | ||
| d = 3 | 72.7% | 72.3% | ||
| d = 4 | 70.6% | 71.0% | ||
| d = 5 | 65.5% | 66.5% | ||
| C = 55 | d = 1 | 76.3% | 74.2% | |
| d = 2 | 75.5% | 72.9% | ||
| d = 3 | 73.9% | 71.3% | ||
| d = 4 | 71.3% | 71.0% | ||
| d = 5 | 68.9% | 70.6% | ||
| C = 78 | d = 1 | 76.6% | 74.5% | |
| d = 2 | 76.9% | 72.6% | ||
| d = 3 | 75.4% | 72.6% | ||
| d = 4 | 71.9% | 70.6% | ||
| d = 5 | 70.3% | 70.6% | ||
| C = 100 | d = 1 | 76.7% | 74.2% | |
| d = 2 | 77.3% | 72.3% | ||
| d = 3 | 75.6% | 71.9% | ||
| d = 4 | 72.4% | 70.3% | ||
| d = 5 | 70.4% | 70.6% | ||
| Gaussian Radial Basis Function * | C = 1 | σ2 = 1 | 87.2% | 72.9% |
| σ2 = 25 | 72.8% | 71.6% | ||
| σ2 = 50 | 71.0% | 69.4% | ||
| σ2 = 75 | 70.0% | 70.0% | ||
| σ2 = 100 | 69.6% | 70.3% | ||
| C = 10 | σ2 = 1 | 97.8% | 71.3% | |
| σ2 = 25 | 77.0% | 73.5% | ||
| σ2 = 50 | 75.4% | 74.2% | ||
| σ2 = 75 | 74.7% | 74.5% | ||
| σ2 = 100 | 74.2% | 73.5% | ||
| C = 33 | σ2 = 1 | 99.7% | 69.0% | |
| σ2 = 25 | 79.4% | 73.9% | ||
| σ2 = 50 | 77.3% | 74.2% | ||
| σ2 = 75 | 75.9% | 74.2% | ||
| σ2 = 100 | 75.8% | 73.9% | ||
| C = 55 | σ2 = 1 | 99.9% | 68.1% | |
| σ2 = 25 | 81.7% | 74.5% | ||
| σ2 = 50 | 78.0% | 73.9% | ||
| σ2 = 75 | 77.5% | 73.9% | ||
| σ2 = 100 | 76.4% | 73.9% | ||
| C = 78 | σ2 = 1 | 99.9% | 68.4% | |
| σ2 = 25 | 82.9% | 73.9% | ||
| σ2 = 50 | 79.5% | 73.9% | ||
| σ2 = 75 | 77.5% | 73.9% | ||
| σ2 = 100 | 77.0% | 73.5% | ||
| C = 100 * | σ2 = 1 | 100.0% | 67.4% | |
| σ2 = 25 * | 82.7% * | 74.5% * | ||
| σ2 = 50 | 80.1% | 74.5% | ||
| σ2 = 75 | 77.8% | 73.9% | ||
| σ2 = 100 | 77.5% | 74.2% | ||
| * The best prediction accuracy. | ||||
References
- Hu, H.; Sathye, M. Predicting Financial Distress in the Hong Kong Growth Enterprises Market from the Perspective of Financial Sustainability. Sustainability 2015, 7, 1186–1200. [Google Scholar] [CrossRef] [Green Version]
- Valaskova, K.; Kliestik, T.; Svabova, L.; Adamko, P. Financial risk measurement and prediction modelling for sustainable development of business entities using regression analysis. Sustainability 2018, 10, 2144. [Google Scholar] [CrossRef]
- Altman, E.I. Financial ratios, discriminant analysis and the prediction of corporate bankruptcy. J. Financ. 1968, 23, 589–609. [Google Scholar] [CrossRef]
- Ohlson, J. Financial ratios and the probabilistic prediction of bankruptcy. J. Account. Res. 1980, 18, 109–131. [Google Scholar] [CrossRef]
- Odom, M.; Sharda, R. A neural network model for bankruptcy prediction. In Proceedings of the International Joint Conference on Neural Networks, San Diego, CA, USA, 17–21 June 1990; pp. 163–168. [Google Scholar]
- Tam, K.Y.; Kiang, M.Y. Managerial applications of the neural networks: The case of bank failure predictions. Manag. Sci. 1992, 38, 926–947. [Google Scholar] [CrossRef]
- Jo, H.; Han, I. Integration of case-based forecasting, neural network and discriminant analysis for bankruptcy prediction. Expert Syst. Appl. 1996, 11, 415–422. [Google Scholar] [CrossRef]
- Ahn, H.; Kim, K.-J. Bankruptcy prediction modeling with hybrid case-based reasoning and genetic algorithms approach. Appl. Soft Comput. 2009, 9, 599–607. [Google Scholar] [CrossRef]
- Fan, A.; Palaniswami, M. Selecting bankruptcy predictors using a support vector machine approach. In Proceedings of the IEEE-INNS-ENNS International Joint Conference on Neural Networks, Como, Italy, 27–27 July 2000; pp. 354–359. [Google Scholar]
- Shin, K.-S.; Lee, T.S.; Kim, H.-J. An application of support vector machines in bankruptcy prediction model. Expert Syst. Appl. 2005, 28, 127–135. [Google Scholar] [CrossRef]
- Min, J.H.; Lee, Y.-C. Bankruptcy prediction using support vector machine with optimal choice of kernel function parameters. Expert Syst. Appl. 2005, 28, 603–614. [Google Scholar] [CrossRef]
- Min, S.-H.; Lee, J.; Han, I. Hybrid genetic algorithms and support vector machines for bankruptcy prediction. Expert Syst. Appl. 2006, 31, 652–660. [Google Scholar] [CrossRef]
- Hua, Z.; Wang, Y.; Xu, X.; Zhang, B.; Liang, L. Predicting corporate financial distress based on integration of support vector machine and logistic regression. Expert Syst. Appl. 2007, 33, 434–440. [Google Scholar] [CrossRef]
- Ding, Y.; Song, X.; Zen, Y. Forecasting financial condition of Chinese listed companies based on support vector machine. Expert Syst. Appl. 2008, 34, 3081–3089. [Google Scholar] [CrossRef]
- Chaudhuri, A.; De, K. Fuzzy Support Vector Machine for bankruptcy prediction. Appl. Soft Comput. 2011, 11, 2472–2486. [Google Scholar] [CrossRef]
- Li, H.; Sun, J. Predicting business failure using support vector machines with straightforward wrapper: A re-sampling study. Expert Syst. Appl. 2011, 38, 12747–12756. [Google Scholar] [CrossRef]
- Lin, F.; Yeh, C.C.; Lee, M.Y. The use of hybrid manifold learning and support vector machines in the prediction of business failure. Knowl.-Based Syst. 2011, 24, 95–101. [Google Scholar] [CrossRef]
- Yang, Z.; You, W.; Ji, G. Using partial least squares and support vector machines for bankruptcy prediction. Expert Syst. Appl. 2011, 38, 8336–8342. [Google Scholar] [CrossRef]
- Tsai, C.-F.; Cheng, K.-C. Simple instance selection for bankruptcy prediction. Knowl.-Based Syst. 2012, 27, 333–342. [Google Scholar] [CrossRef]
- Huang, C.L.; Wang, C.J. A GA-based feature selection and parameters optimization for support vector machines. Expert Syst. Appl. 2006, 31, 231–240. [Google Scholar] [CrossRef]
- Chen, L.H.; Hsiao, H.D. Feature selection to diagnose a business crisis by using a real GA-based support vector machine: An empirical study. Expert Syst. Appl. 2008, 35, 1145–1155. [Google Scholar] [CrossRef]
- Kim, K.-J.; Ahn, H. Simultaneous optimization of artificial neural networks for financial forecasting. Appl. Intel. 2012, 36, 887–898. [Google Scholar] [CrossRef]
- Li, L.; Tang, H.; Wu, Z.; Gong, J.; Gruidl, M.; Zou, J.; Tockman, M.; Clark, R.A. Data mining techniques for cancer detection using serum proteomic profiling. Artif. Intel. Med. 2004, 32, 71–83. [Google Scholar] [CrossRef] [PubMed]
- Ahn, H.; Lee, K.; Kim, K.-J. Global optimization of support vector machines using genetic algorithms for bankruptcy prediction. In Neural Information Processing; Lecture Notes in Computer Science; Springer: Berlin/Heidelberg, Germany, 2006; Volume 4234, pp. 420–429. [Google Scholar]
- Falbo, P. Credit-scoring by enlarged discriminant models. Omega 1991, 19, 275–289. [Google Scholar] [CrossRef]
- Tam, K.Y. Neural network models and the prediction of bank bankruptcy. Omega 1991, 19, 429–445. [Google Scholar] [CrossRef]
- Malhotra, R.; Malhotra, D.K. Evaluating consumer loans using neural networks. Omega 2003, 31, 83–96. [Google Scholar] [CrossRef]
- Vapnik, V.N. Statistical Learning Theory; Wiley: Hoboken, NJ, USA, 1998. [Google Scholar]
- Pai, P.-F.; Hong, W.-C. Forecasting regional electricity load based on recurrent support vector machines with genetic algorithms. Electr. Power Syst. Res. 2005, 74, 417–425. [Google Scholar] [CrossRef]
- Smola, A.J. Learning with Kernels. Ph.D. Thesis, Department of Computer Science, Technical University Berlin, Germany, 1998. [Google Scholar]
- Gunn, S.R. Support Vector Machines for Classification and Regression; Technical Report; University of Southampton: Southampton, UK, 1998. [Google Scholar]
- Drucker, H.; Wu, D.; Vapnik, V.N. Support vector machines for spam categorization. IEEE Trans. Neural Netw. 1999, 10, 1048–1054. [Google Scholar] [CrossRef] [PubMed] [Green Version]
- Witten, I.H.; Frank, E. Data Mining: Practical Machine Learning Tools and Techniques with Java Implementations; Morgan Kaufmann Publishers: Burlington, MA, USA, 2000. [Google Scholar]
- Mukherjee, S.; Osuna, E.; Girosi, F. Nonlinear prediction of chaotic time series using support vector machines. In Proceedings of the IEEE Workshop on Neural Networks for Signal Processing, Amelia Island, FL, USA, 24–26 September 1997; pp. 511–520. [Google Scholar] [Green Version]
- Tay, F.E.H.; Cao, L. Application of support vector machines in financial time series forecasting. Omega 2001, 29, 309–317. [Google Scholar] [CrossRef]
- Kim, K.-J. Financial forecasting using support vector machines. Neurocomputing 2003, 55, 307–319. [Google Scholar] [CrossRef]
- Huang, C.L.; Chen, M.C.; Wang, C.J. Credit scoring with a data mining approach based on support vector machines. Expert Syst. Appl. 2007, 33, 847–856. [Google Scholar] [CrossRef] [Green Version]
- Wu, C.H.; Tzeng, G.H.; Goo, Y.J.; Fang, W.C. A real-valued genetic algorithm to optimize the parameters of support vector machine for prediction bankruptcy. Expert Syst. Appl. 2007, 32, 397–408. [Google Scholar] [CrossRef]
- Zhou, L.; Lai, K.K.; Yu, L. Credit scoring using support vector machines with direct search for parameters selection. Soft Comput. 2009, 13, 149–155. [Google Scholar] [CrossRef]
- Chung, H.; Shin, K.-S. Genetic algorithm-optimized long short-term memory network for stock market prediction. Sustainability 2018, 10, 3765. [Google Scholar] [CrossRef]
- Fu, Y.; Shen, R. GA based CBR approach in Q&A system. Expert Syst. Appl. 2004, 26, 167–170. [Google Scholar]
- Han, J.; Kamber, M. Datamining: Concepts and Techniques; Morgan Kaufmann Publishers: Burlington, MA, USA, 2001. [Google Scholar]
- Gu, J.; Zhu, M.; Jiang, L. Housing price forecasting based on genetic algorithm and support vector machine. Expert Syst. Appl. 2011, 38, 3383–3386. [Google Scholar] [CrossRef]
- Howley, T.; Madden, M.G. The Genetic Kernel Support Vector Machine: Description and Evaluation. Artif. Intel. Rev. 2005, 24, 379–395. [Google Scholar] [CrossRef] [Green Version]
- Pai, P.-F.; Hsu, M.-F.; Wang, M.-C. A support vector machine-based model for detecting top management fraud. Knowl.-Based Syst. 2011, 24, 314–321. [Google Scholar] [CrossRef]
- Lee, K.; Byun, H. A new face authentication system for memory-constrained devices. IEEE Trans. Consum. Electron. 2003, 49, 1214–1222. [Google Scholar]
- Sun, Z.; Bebis, G.; Miller, R. Object detection using feature subset selection. Pattern Recognit. 2004, 37, 2165–2176. [Google Scholar] [CrossRef] [Green Version]
- Samanta, B. Gear fault detection using artificial neural networks and support vector machines with genetic algorithms. Mech. Syst. Signal Process. 2004, 18, 625–644. [Google Scholar] [CrossRef]
- Yu, E.; Cho, S. Keystroke dynamics identity verification: Its problems and practical solutions. Comput. Secur. 2004, 23, 428–440. [Google Scholar] [CrossRef]
- Yu, E.; Cho, S. Constructing response model using ensemble based on feature subset selection. Expert Syst. Appl. 2006, 30, 352–360. [Google Scholar] [CrossRef]
- Yu, L.; Wang, S.; Lai, K.K. Mining stock market tendency using GA-based support vector machines. In International Workshop on Internet and Network Economics; Lecture Notes in Computer Science; Springer: Berlin/Heidelberg, Germany, 2005; Volume 3828, pp. 336–345. [Google Scholar]
- Jack, L.B.; Nandi, A.K. Fault detection using support vector machines and artificial neural networks, augmented by genetic algorithms. Mech. Syst. Signal Process. 2002, 16, 373–390. [Google Scholar] [CrossRef]
- Zhao, X.-M.; Cheung, Y.-M.; Huang, D.-S. A novel approach to extracting features from motif content and protein composition for protein sequence classification. Neural Netw. 2005, 18, 1019–1028. [Google Scholar] [CrossRef] [PubMed]
- Reeves, C.R.; Taylor, S.J. Selection of training sets for neural networks by a genetic algorithm. In Parallel Problem-Solving from Nature; Eiden, A.E., Back, T., Schoenauer, M., Schwefel, H.-P., Eds.; Springer: Berlin/Heidelberg, Germany, 1998. [Google Scholar]
- Babu, T.R.; Murty, M.N. Comparison of genetic algorithm based prototype selection schemes. Pattern Recognit. 2001, 34, 523–525. [Google Scholar] [CrossRef]
- Tahayna, B.; Belkhatir, M.; Alhashmi, S.M.; O’Daniel, T. Optimizing support vector machine based classification and retrieval of semantic video events with genetic algorithms. In Proceedings of the 2010 IEEE seventeenth International Conference on Image Processing (ICIP 2010), Hong Kong, China, 26–29 September 2010; pp. 1485–1488. [Google Scholar]
- Tahayna, B.; Belkhatir, M.; Alhashmi, S.M.; O’Daniel, T. Human action detection and classification using optimal bag-of-words representation. In Proceedings of the 2010 IEEE Sixth International Conference on Digital Content, Multimedia Technology and its Applications (IDC 2010), Seoul, Korea, 16–18 August 2010; pp. 75–80. [Google Scholar]
- Kim, K.-J. Toward global optimization of case-based reasoning systems for financial forecasting. Appl. Intel. 2004, 21, 239–249. [Google Scholar] [CrossRef]
- Kim, K.-J. Artificial neural networks with evolutionary instance selection for financial forecasting. Expert Syst. Appl. 2006, 30, 519–526. [Google Scholar] [CrossRef]
- Kim, D.S.; Nguyen, H.-N.; Park, J.S. Genetic algorithm to improve SVM based network intrusion detection system. In Proceedings of the 19th International Conference on Advanced Information Networking and Applications, Taipei, Taiwan, 28–30 March 2005; pp. 155–158. [Google Scholar]
- Chang, C.-C.; Lin, C.-J. LIBSVM: A library for support vector machines. ACM Trans. Intel. Syst. Technol. 2011, 2, 27:1–27:27. Available online: http://www.csie.ntu.edu.tw/~cjlin/libsvm (accessed on 7 November 2018). [CrossRef]
- Harnett, D.L.; Soni, A.K. Statistical Methods for Business and Economics; Addison-Wesley: Boston, MA, USA, 1991. [Google Scholar]
- Diebold, F.X.; Mariano, R.S. Comparing predictive accuracy. J. Bus. Econom. Stat. 1995, 13, 134–144. [Google Scholar]
- Derrac, J.; García, S.; Molina, D.; Herrera, F. A practical tutorial on the use of nonparametric statistical tests as a methodology for comparing evolutionary and swarm intelligence algorithms. Swarm Evolut. Comput. 2011, 1, 3–18. [Google Scholar] [CrossRef]
- Fan, G.F.; Peng, L.L.; Hong, W.C. Short term load forecasting based on phase space reconstruction algorithm and bi-square kernel regression model. Appl. Energy 2018, 224, 13–33. [Google Scholar] [CrossRef]
- Iotti, M.; Bonazzi, G. Analysis of the Risk of Bankruptcy of Tomato Processing Companies Operating in the Inter-Regional Interprofessional Organization “OI Pomodoro da Industria Nord Italia”. Sustainability 2018, 10, 947. [Google Scholar] [CrossRef]
Figure 1.
The procedure of Globally Optimized Support Vector Machine (GOSVM) method.

Table 1.
Average prediction accuracies of the SVM-based models.
| Model | Train | Test | Hold-out | Optimal | Portion of the Selected | ||
|---|---|---|---|---|---|---|---|
| σ2 | C | Features | Instances | ||||
| COSVM | 82.7% | - | 74.5% | 25 | 100 | 100% | 100% |
| GSSVM | 80.2% | - | 74.2% | 22.6 | 32 | 100% | 100% |
| KPSVM | 84.8% | 77.4% | 76.5% | 13.0 | 55.9 | 100% | 100% |
| FSSVM | 82.6% | 77.8% | 77.4% | 8.8 | 93.3 | 61% | 100% |
| ISSVM | 84.6% | 80.0% | 79.4% | 12.7 | 36.8 | 100% | 53% |
| GOSVM | 84.6% | 80.3% | 80.3% | 18.3 | 90 | 80% | 62% |
Table 2.
Average prediction accuracies of the other classification models.
| Model | Train | Test | Hold-out | Remarks for Finally Selected Model |
|---|---|---|---|---|
| LOGIT | 78.6% | - | 74.8% | Backward conditional, The number of the selected features = 37 |
| DA | 75.0% | - | 72.6% | Stepwise, The number of the selected features = 16 |
| CBR | - | - | 68.4% | k of k-NN = 7 |
| ANN | 72.8% | 71.9% | 70.3% | The number of the nodes in the hidden layer = 42 |
| GOSVM | 84.6% | 80.3% | 80.3% | Gaussian RBF kernel, = 18.3, = 90 |
Table 3.
Z values of the two-sample test for proportions.
| DA | CBR | ANN | COSVM | GSSVM | KPSVM | FSSVM | ISSVM | GOSVM | |
|---|---|---|---|---|---|---|---|---|---|
| LOGIT | −0.639 | −1.781 ** | −1.260 * | −0.092 | −0.184 | 0.468 | 0.754 | 1.338 ** | 1.637 ** |
| DA | −1.145 * | −0.622 | 0.546 | 0.454 | 1.106 * | 1.391 ** | 1.974 ** | 2.272 *** | |
| CBR | −0.523 | 1.690 ** | 1.598 ** | 2.247 *** | 2.530 *** | 3.108 *** | 3.403 *** | ||
| ANN | 1.168 * | 1.076 * | 1.727 ** | 2.011 ** | 2.591 *** | 2.888 *** | |||
| COSVM | −0.092 | 0.560 | 0.846 * | 1.430 ** | 1.729 ** | ||||
| GSSVM | 0.652 | 0.938 * | 1.522 ** | 1.820 ** | |||||
| KPSVM | 0.286 | 0.871 * | 1.171 * | ||||||
| FSSVM | 0.585 | 0.885 * | |||||||
| ISSVM | 0.300 |
* significant at the 10% level, ** significant at the 5% level, *** significant at the 1% level.
Table 4.
McNemar values for the hold-out data.
| DA | CBR | ANN | COSVM | GSSVM | KPSVM | FSSVM | ISSVM | GOSVM | |
|---|---|---|---|---|---|---|---|---|---|
| LOGIT | 1.091 | 2.347 | 3.924 ** | 0.000 | 0.036 | 0.516 | 1.361 | 4.024 ** | 5.020 ** |
| DA | 0.554 | 1.618 | 0.694 | 0.485 | 3.184 * | 4.780 ** | 8.889 *** | 9.121 *** | |
| CBR | 0.347 | 2.215 | 1.891 | 4.836 ** | 7.603 *** | 9.851 *** | 31.858 *** | ||
| ANN | 3.904 ** | 15.858 *** | 7.291 *** | 8.890 *** | 12.375 *** | 13.935 *** | |||
| COSVM | 3.440 * | - | 2.370 | 6.759 *** | 7.605 *** | ||||
| GSSVM | - | - * | 7.031 *** | 7.200 *** | |||||
| KPSVM | 0.148 | 2.370 | 3.184 * | ||||||
| FSSVM | 0.625 | 1.362 | |||||||
| ISSVM | 0.093 |
* significant at the 10% level, ** significant at the 5% level, *** significant at the 1% level.
© 2018 by the authors. Licensee MDPI, Basel, Switzerland. This article is an open access article distributed under the terms and conditions of the Creative Commons Attribution (CC BY) license (http://creativecommons.org/licenses/by/4.0/).
Share and Cite
MDPI and ACS Style
Kim, K.-j.; Lee, K.; Ahn, H. Predicting Corporate Financial Sustainability Using Novel Business Analytics. Sustainability 2019, 11, 64. https://doi.org/10.3390/su11010064
AMA Style
Kim K-j, Lee K, Ahn H. Predicting Corporate Financial Sustainability Using Novel Business Analytics. Sustainability. 2019; 11(1):64. https://doi.org/10.3390/su11010064
Chicago/Turabian StyleKim, Kyoung-jae, Kichun Lee, and Hyunchul Ahn. 2019. "Predicting Corporate Financial Sustainability Using Novel Business Analytics" Sustainability 11, no. 1: 64. https://doi.org/10.3390/su11010064
Note that from the first issue of 2016, this journal uses article numbers instead of page numbers. See further details here.