Informal Food Deserts and Household Food Insecurity in Windhoek, Namibia

1
Balsillie School of International Affairs, Waterloo, ON N2L 6C2, Canada
2
University of Western Cape, Robert Sobukwe Drive, Cape Town 7535, South Africa
3
Faculty of Science, University of Namibia, 340 Mandume Ndemufayo Avenue, Windhoek 13301, Namibia
4
Department of Population and Statistics, University of Namibia, 340 Mandume Ndemufayo Avenue, Windhoek 13301, Namibia
*
Author to whom correspondence should be addressed.
Sustainability 2019, 11(1), 37; https://doi.org/10.3390/su11010037
Submission received: 1 November 2018
/
Revised: 14 December 2018
/
Accepted: 15 December 2018
/
Published: 21 December 2018
(This article belongs to the Special Issue Urban Food Deserts: Perspectives from the Global South)
Abstract
:Informal settlements in rapidly-growing African cities are urban and peri-urban spaces with high rates of formal unemployment, poverty, poor health outcomes, limited service provision, and chronic food insecurity. Traditional concepts of food deserts developed to describe North American and European cities do not accurately capture the realities of food inaccessibility in Africa’s urban informal food deserts. This paper focuses on a case study of informal settlements in the Namibian capital, Windhoek, to shed further light on the relationship between informality and food deserts in African cities. The data for the paper was collected in a 2016 survey and uses a sub-sample of households living in shack housing in three informal settlements in the city. Using various standard measures, the paper reveals that the informal settlements are spaces of extremely high food insecurity. They are not, however, food deprived. The proximity of supermarkets and open markets, and a vibrant informal food sector, all make food available. The problem is one of accessibility. Households are unable to access food in sufficient quantity, quality, variety, and with sufficient regularity.
1. Introduction
With the rapid growth of Africa’s urban population, has come an explosion of informal settlements on the fringes of most cities, what Doug Saunders optimistically refers to as “transitional spaces” or “arrival cities” and UN Habitat more pessimistically designates as “slums” [1,2]. These impoverished residential areas of cities have been seen as the product of “disjointed modernization” in which urban population growth outpaces urban economic and institutional development as well as government failures to proactively manage urbanization [3]. In sub-Saharan Africa as a whole, nearly 60% of the total urban population now lives in informal settlements. However, there is considerable inter-country variation [2]. At one extreme there are countries such as Sudan and Central African Republic with over 90% of the urban population living in informal settlements. In Southern Africa, Mozambique has the highest proportion of its urban population in informal settlements, at 80% [4]. South Africa, with a long history of informal settlement demolition in the apartheid era, is one of the lowest at 23% [5]. The country of Namibia, which was controlled by South Africa until independence in 1991 and had a similar history of draconian controls on urbanization, now has 39% of its urban population residing in informal settlements [6,7].
Informal settlements in African cities are urban and peri-urban spaces with high rates of formal unemployment, grinding poverty, heavy reliance on the informal economy, poor health outcomes, very limited basic services provision, and heightened vulnerability to climate change [8,9,10,11,12,13,14,15]. They are also generally areas with high levels of individual, household, and community food insecurity [16,17,18,19]. One study of 12 African countries, for example, found that at least 40% of the urban population was energy-deficient [20]. The prevalence of hunger was highest in Ethiopia, at 90%. Another study of 6,453 low-income households in 11 African cities conducted by the African Food Security Urban Network (AFSUN) found that 57% were severely food insecure and only 17% were completely food secure [21]. In some of the cities over 70% of households were severely food insecure. Studies of informal settlements in other cities have also found extremely high rates of food insecurity. In two large Nairobi informal settlements, for example, only 16% of households were food secure [22,23]. In Maputo’s informal settlements in Mozambique, just 5% of households were completely food secure [24,25].
In this paper, household and community food security is defined, following the recommendation of the 1996 World Food Summit, as follows: “Food security, at the individual, household, national, regional and global levels (exists) when all people, at all times, have physical and economic access to sufficient, safe and nutritious food to meet their dietary needs and food preferences for an active and healthy life” [26]. There is considerable debate in the literature on how best to measure food security [27,28,29,30,31]. Here we adopt the well-tested non-anthropometric measures and methodology of the FANTA Project [32,33,34]. The concept of food deserts is both more recent and much less expansive geographically. The concept emerged in the United Kingdom and North America in the 1990s to describe food-deprived inner-city neighborhoods [35,36]. In this context, food deserts are conventionally defined as “areas of relative exclusion where people experience physical and economic barriers to accessing healthy food” [37]. In much of the literature on food deserts in European and North American cities, however, the presence of a food desert has come to be associated with the absence or presence of supermarkets. This narrowing of the concept makes it clearly inappropriate for informal areas of cities in the Global South for at least three reasons.
First, residents of informal settlements rely on a variety of informal market and non-market sources of food both within and outside their residential areas. Supermarkets are far from being the only, or even the main, source of food in African cities [38]. Where they do exist, they tend to be located in more affluent parts of cities [39,40]. Second, despite their distant geographical location, upwards of 90% of the residents of poor areas of Southern African cities purchase food at supermarkets [41]. The typical purchasing pattern is to travel to more distant supermarkets to purchase staples in bulk (especially cereals such as maize flour and rice) once per month. In other words, supermarket patronage meets a basic daily staple food need but does not necessarily lead to a more diverse or nutritious diet. Third, the association of food deserts with the physical absence of supermarkets ignores the fact that most African cities have vibrant and dynamic local informal food sectors [42,43,44]. Households in informal settlements tend to rely on informal food vendors for most of their immediate food needs. In this paper, we therefore use an expanded definition of food deserts which links them to the definition of food security above, and defines them as poor, often informal, neighborhoods characterized by high food insecurity and lows dietary diversity, with multiple market and non-market food sources but limited household access to food [45].
This paper focuses on a case study of the informal settlements of the African city of Windhoek, the capital and largest city in Namibia. In this paper, we analyze data from a 2016 household survey of Windhoek to examine the current state of the city’s urban food deserts, with a focus on the food purchasing behavior of households in the city’s informal settlements. The first section describes the growth and location of informal settlements in Windhoek, as well as the demography and socio-economic status of the residents of the settlements. The second section presents the survey methodology and describes the sub-sample of informal housing households used in the analysis. The ensuing sections present the results of the survey. The first looks at levels of food security and shows that like many informal settlements in African cities, the residents survive in a situation of extreme vulnerability to food insecurity. The second shows that these food insecure households in the informal settlements have high rates of supermarket patronage. The apparent contradiction is because they are largely target shoppers, only patronizing supermarkets to buy staple cereals in bulk at monthly intervals. The final section addresses the role of the informal food sector in the informal settlements, arguing that although it improves accessibility to more nutritious foods, households remain mired in the city’s food deserts.
2. Windhoek’s Informal Settlements
Namibia is urbanizing at a rapid rate and outpacing formal housing delivery [6]. Informal settlements are growing quickly in all urban centres [7]. Nationally, at the time of the 2011 Census, there were approximately 80,000 urban households in shacks, a number projected to grow to over 530,000 by 2031 [7]. Windhoek had a total population of 322,500 in 2011, a 36% increase from the previous census in 2001. Shack housing made of corrugated iron predominates in all the informal settlements. One third (or 27,000) of all residential units in Windhoek were shacks, a 90% increase from 2001. Windhoek’s informal settlements are located in the four north-western constituencies of Tobias Hainyeko, Moses Garoëb, Samora Machel, and parts of Khomasdal North. Between 2001 and 2011, the population increase was as high as 77% in Moses Garoëb and 69% in Samora Machel, primarily as a result of in-migration from rural areas [46].
Table 1 provides basic information on demography and service provision in the three main areas of informal settlement. The total number of households was nearly 40,000 with 143,000 household members. Nearly 30% of the population were children under the age of 15 while over two-thirds were working age adults. In the informal settlements, the proportion of households in shacks varied from 37% in Samora Machel to 71% in Tobias Hainyeko. The informal settlements continue to grow through spatial expansion and densification [47,48]. Between 2012 and 2016, an additional 15,000 shacks were built, i.e., around 3,500 new structures per year [49,50]. While most households have access to public piped water, accessibility to electricity, private toilets, and garbage removal is much more limited [51].
Formal unemployment in all three areas was close to 40% in 2011. Levels of unemployment were highest for females and poverty is most severe for female-headed households [47]. Males have higher rates of formal employment than females, but work primarily as manual laborers in sectors like construction [52]. Jobs in the formal sector are sparse for women, so many turn to the informal sector to earn income. Previous studies of the quality of life in the informal settlements indicate that levels of absolute and lived poverty are extremely high and that this, in turn, is related to poor health outcomes (including child stunting and underweight) and a high incidence of food insecurity including a diet deficient in both quantity and quality [52,53,54]. A survey in 2007–2008, for example, found that three-quarters of households in the city’s low-income areas were severely food insecure and only 6% were food secure [52]. Dietary diversity was also very low with foods eaten from an average of less than 5 of 12 possible food groups in the 24 h prior to the survey. A more recent survey of a sample of over 400 households in various informal settlements found that two-thirds were food insecure [53].
Windhoek’s burgeoning informal settlements certainly qualify as urban food deserts in terms of the revised Africa-specific definition provided above: i.e., they are poor, informal, urban neighborhoods characterized by high food insecurity and low dietary diversity. What is less clear is whether they have multiple market and non-market food sources as per the definition. In terms of the main food sources, previous studies suggest that low-income households in Windhoek purchase most of their food from a combination of formal and informal retail outlets—including supermarkets, informal markets, street vendors, and tuck shops [52]. With urban agriculture almost non-existent, the primary non-market source of food is rural-urban food transfers [55].
3. Research Methods
The data for this study comes from a city-wide household survey of the City of Windhoek conducted in August 2016 as part of the ongoing research program of the African Urban Network (AFSUN) and the Hungry Cities Partnership (HCP). The survey instrument was developed by AFSUN and HCP and mounted on tablets through a modified computer-assisted personal interviewing open data toolkit (ODK). The city-wide survey interviewed a total of 863 households, drawn from all 10 constituencies, using a two-stage cluster sampling design. First, a total of 35 primary sampling units (PSU) were randomly selected with probability proportional to size (PPS). The PSUs were selected from a master frame developed and demarcated for the 2011 Population and Housing Census. The second stage involved systematic sampling of 25 households in each of the selected PSUs. In each household, the head or their representative was interviewed after informed consent. For the purposes of this paper, a sub-sample of 431 households in informal settlements was extracted from the overall sample of over 800. All these households were resident in informal (shack) housing in the relevant constituencies.
The survey collected data on household demography and economics, levels of food security, the type and location of food sources, and the purchasing strategies of households. To assess the prevalence and levels of household food insecurity, the survey used three indicators developed by the Food and Nutrition Technical Assistance (FANTA) project [28] as follows: (a) the Household Food Insecurity Access Score (HFIAS) which is a continuous measure of the degree of food insecurity in the household [32]. An HFIAS is calculated based on answers to nine frequency-of-occurrence questions and ranges from 0 (completely food secure) to 27 (completely food insecure); (b) the Household Food Insecurity Access Prevalence (HFIAP) measure uses a scoring algorithm to categorize households into one of four categories: food secure, mildly food insecure, moderately food insecure, and severely food insecure (Coates et al. 2007); and (c) the Household Dietary Diversity Score (HDDS) which captures how many food groups from 0 to 12 were consumed within the household in the previous 24 h [33]. Household food purchasing patterns were identified using the Hungry Cities Food Purchase Matrix (HCFPM) which identifies where households normally purchase a range of up to 30 common food items, the frequency of purchase, and the geographical location of the source [56].
4. Food Insecurity in Windhoek’s Food Deserts
4.1. Levels of Food Insecurity
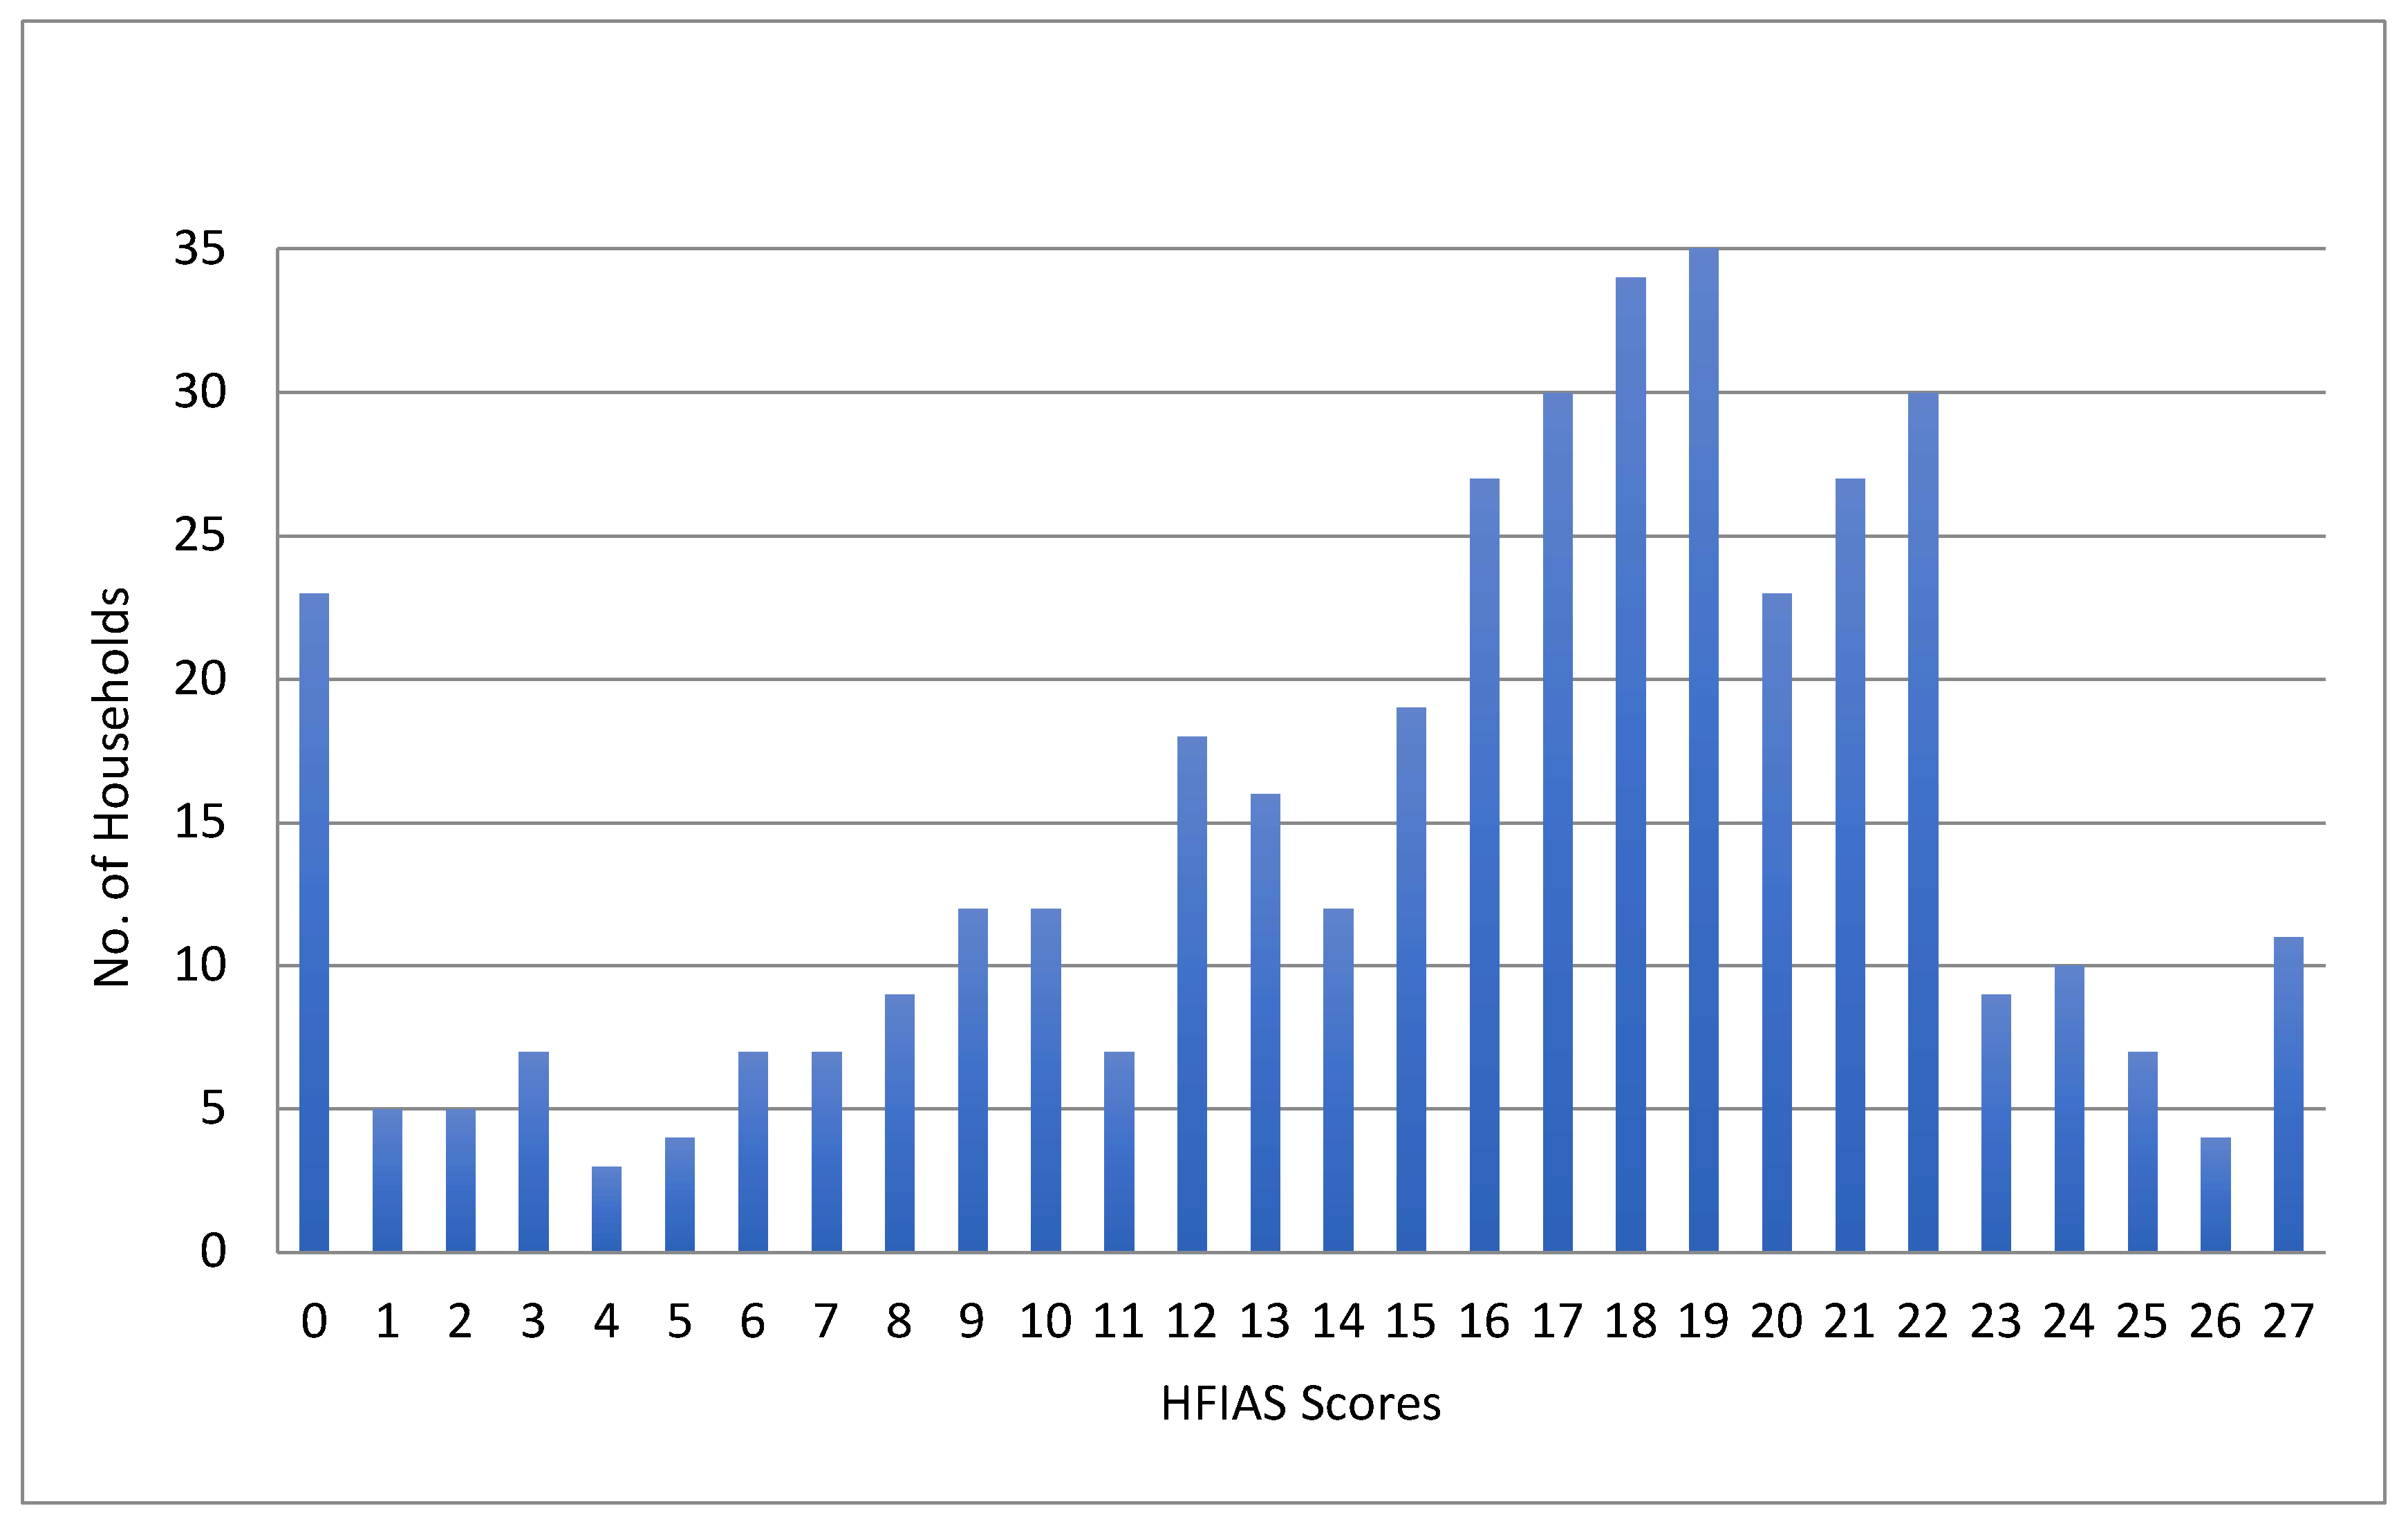
The survey results reveal extremely high rates of food insecurity amongst households living in shack housing in Windhoek’s informal settlements. The mean household HFIAS score was 15.4 which is very high by most standards. For example, a study of over 6000 households in low-income neighborhoods in 11 African cities by AFSUN found an average HFIAS of 10.0. Even Harare in Zimbabwe which was in the middle of a severe economic crisis at the time had a mean HFIAS of 14.7 [57]. In Windhoek, the mean HFIAS was 9.3. In another study of Lilongwe in Malawi also focused exclusively on informal settlements, the mean HFIAS was only 10.3 [58]. Two-thirds of the households in the Windhoek informal settlements had an HFIAS of 15 or greater, and a quarter an HFIAS of 20 or greater (Figure 1).
The high HFIAS scores translate into very high prevalence of food insecurity on the HFIAP classification. Only 6.2% of households classified as completely food secure, while 81.2% were severely food insecure. To put these extremely high levels of food insecurity into context, Table 2 compares the Windhoek findings with those for the whole Windhoek sample (including the informal settlements) which found that 16.4% were food secure and 67.1% were severely food insecure. Other comparative benchmarks include the AFSUN study in which 57% of low-income households were food insecure [21]. The Lilongwe informal settlements study also found high levels of severe food insecurity, but the proportion of severely food insecure households was lower (at 72%) [58].
Of the four basic types of household structure, nuclear households were the most food insecure with an HFIAS = 16.9, followed by female-centered households (HFIAS = 15.6), extended households (HFIAS = 14.9), and finally male-centered households (HFIAS=13.9) (Table 3). Nuclear households are the most food insecure because they tend to be larger in size with more young dependents. However, while there are variations in the prevalence of food security by household type, the overall picture is of ubiquitous food insecurity with well over 80% of households severely food insecure in each category. As many as 77% of the household heads said that they worry about not having sufficient food and 60% that in the previous month there had been times when there was no food of any kind in the house due to a lack resources to purchase it. Nearly half had experience of going to bed hungry because there was no food in the house and 40% had gone a whole day and night without eating anything. Food shortages led to eating fewer meals (71%) and eating smaller meals (70%).
4.2. Quality of Household Diets
In addition to insufficient food, the quality of the diet in the informal settlements is very poor. The mean HDDS for all the households in the informal housing sub-sample was only 2.6, meaning that on average households had eaten food from less than three food groups in the previous 24 h. A total of 63% of the households had an HDDS of 2 or less and 97% had an HDDS of 5 or less (Table 4). An HDDS of 5 is generally considered the absolute minimum for a nutritionally adequate diet. While there was some variation by household structure, from a low of 2.5 for female-centered households to 3.0 for extended households, the values for all four groups indicate extremely limited dietary diversity (Table 3).
Table 5 shows which food groups had been accessed by the households. The overwhelming majority (95%) had consumed one of the staple cereals that are core to the daily diet—maize meal, rice, pearl millet, pasta, or wheat (in the form of bread). Around a third were able to supplement the staple with meat (beef, chicken, or offal) and nearly a third had eaten some fish. Around 22% had been able to consume some vegetables but apart from non-nutritious commodities such as sugar and tea/coffee and food made with oil, little else had been consumed by many households. Dairy had only been consumed in 8% of households and fruit in only 2%.
5. Sources of Food in the Deserts
5.1. Supermarkets
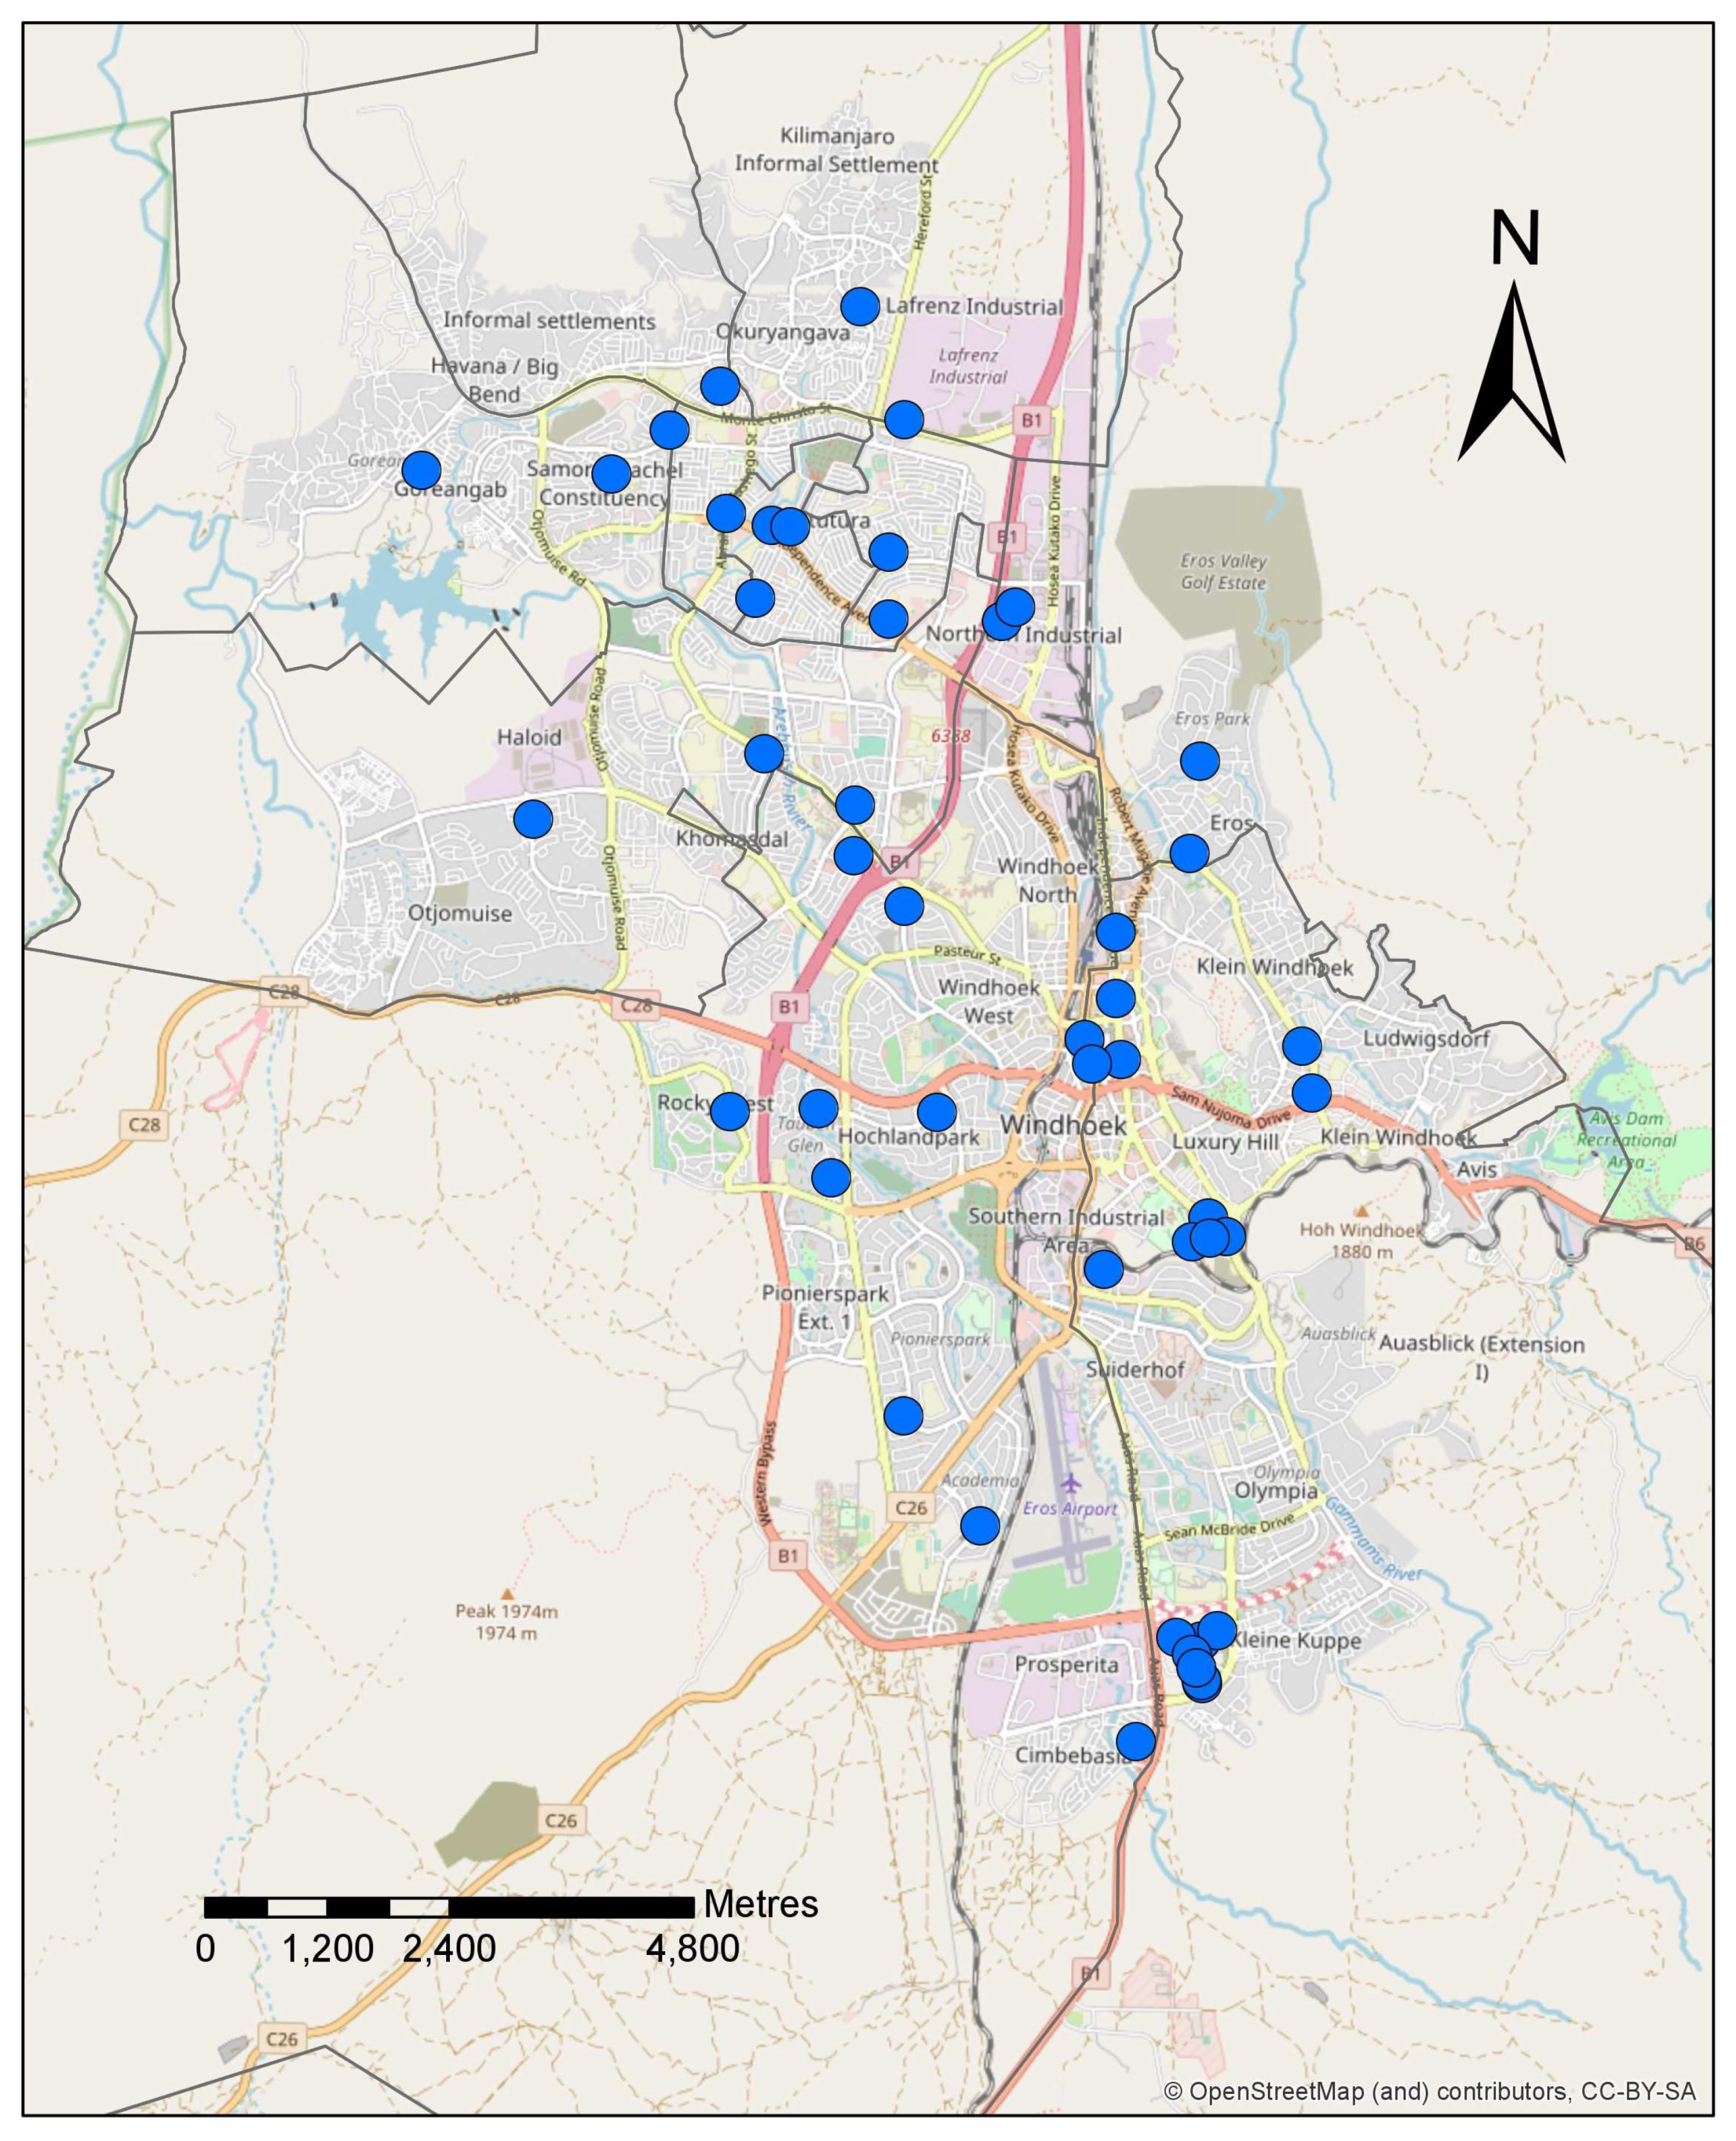
A classic western city food deserts argument would implicate the absence of supermarkets as a key culprit in the state of food insecurity and poor diets of households in the informal settlements of Windhoek. However, the city has undergone a mini-supermarket revolution in the last two decades and there are now over 30 supermarkets (Figure 2) [59]. The majority of the supermarkets are owned by companies from the neighboring country of South Africa, with one local chain, Woermann Brock (WB Supermarkets). While most supermarkets are located in higher-income areas in the center and south of the city, there are a number of budget outlets towards the north of the city. There are no supermarkets within the informal settlements per se but this does not necessarily mean that they are inaccessible to residents of these areas.
As Table 6 shows, the vast majority of households in the informal settlements purchase food at supermarkets (at 93% of surveyed households, far more than for any other type of formal or informal outlet). The importance of spatial proximity is confirmed by the fact that the most patronized supermarkets are virtually all located in the northern part of the city. The spatial accessibility of supermarkets to residents of Windhoek’s food deserts suggests that their presence is having little impact on the high levels of food insecurity and dietary diversity. The reasons for this are threefold. First, budget supermarkets close to low-income areas carry a very limited range of products including minimal fresh produce. Second, while supermarkets are spatially accessible, their products may be economically inaccessible to the majority of households on limited income. Third, households tend to target shop at supermarkets on an infrequent basis. Nearly three-quarters of the surveyed households patronize supermarkets on a monthly basis. Only 10% of households shop at supermarkets with any regularity (weekly or more frequently).
This raises the question of what foodstuffs these informal settlement households are buying when they go to supermarkets. The HCFPM provides a product-by-product analysis which shows exactly where households purchase various foodstuffs [56]. Table 7 shows the top 10 food products (i.e., purchased by the greatest number of households in the month prior to the survey). What stands out is that all of these products were bought by at least 20% of purchasing households at supermarkets. Supermarkets were also the primary source for healthy foods such as fruit (76%) and vegetables (56%). However, the proportion of households buying these products is low. Supermarkets completely dominate the purchase of cereals—including mealie meal, rice, and pasta—with over 90% of households buying these staples at supermarkets. The pattern of monthly shopping suggests that they buy these products in bulk. Thus, most households rely on supermarkets for their staple food and while this may mean that they are more food secure than they might otherwise have been, the quantities purchased certainly do not ensure food security, and they certainly do not guarantee a diverse and nutritious daily diet.
5.2. Informal Food Sector
The informal food sector has been identified in many African cities as a playing a key role in delivering affordable food to low-income households [45]. In Windhoek, informal retailing has expanded in volume and complexity with the rapid growth of the city. The sector is characterized by several different types of enterprise including: (a) tuck shops which are small informal shops in fixed structures located primarily in informal settlements; (b) mobile vendors selling door-to-door or from the back of small trucks; (c) street vendors on sidewalks, at transport hubs, and outside supermarkets. Clusters of street vendors in various areas are known as informal markets; and (d) open markets which are formally established and approved by the city authorities. The municipality is responsible for fee collection from informal vendors who pay rent for market stands, security, cleaning, sanitation facilities, and maintenance.
Of these various sources, open markets were patronized by almost 60% of surveyed households in the informal settlements in the month prior to the survey, street sellers (including informal market vendors) by just over a quarter and tuck shops by 14% (Table 6). The city’s nine open markets are located in close proximity to the informal settlements. One of them, Tukondjeni, is the preferred market for 46% of the informal households. Other well-patronized markets include Single Quarter (preferred by 25% of households), Soweto (by 10%) and Okahandja (by 8%). Almost half of those who shop at open markets do so on a weekly basis and another 15% almost daily. The main products bought at the open markets are meat, fish, and vegetables (Table 7). They therefore do play an important role in making more nutritious foods available for those households that can afford the products.
Street sellers and tuck shops are patronized much more frequently than either supermarkets or open markets, on an almost daily basis in many cases (Table 7). This is mainly because they make food available within walking distance in the informal settlements themselves, break bulk to sell in small and affordable quantities, and offer food on credit to trusted customers. Tuck shops meet local demand for bread and for offal, while street sellers provide fish, meat, and offal. Both of these informal retailers therefore play a role in making a greater range of food available and accessible within the informal settlements. However, their presence is insufficient to mitigate chronic food insecurity as households are only able to patronize these outlets when they have sufficient income or do not have enough income to purchase enough to lift themselves out of a situation of severe food insecurity.
5.3. Absent Urban Agriculture
In some African cities, poor households are able to mitigate food insecurity through non-market mechanisms such as urban agriculture, urban livestock, rural-urban food remittances, and food sharing. In theory, urban agriculture has the potential to mitigate food insecurity and diversify diets in Africa’s urban food deserts. However, the evidence on the success of urban agriculture in achieving these goals is extremely mixed. In many Southern African cities, rates of participation in urban agriculture by the urban poor are extremely low [60,61]. In informal settlements, where land is at a premium, urban agriculture is even less feasible. An earlier study of urban agriculture in Windhoek gave the impression that the city was an exception [62]. However, the study only interviewed a small sample of households that were practicing urban agriculture. While this provided insights into some of the challenges faced by these households in growing food in the city, it provided no sampling frame and therefore no sense of how typical these households were. Other studies suggest that participation rates in urban agriculture are very limited in Windhoek due to land shortages, the arid climate, and lack of inputs [52].
In our 2016 survey of Windhoek’s informal settlements, less than 10% said they grow any of their own food or keep livestock for food in the city. Seeking to understand why urban agriculture is not greening Windhoek’s informal food deserts, respondents were asked to agree or disagree with a set of statements about the obstacles to growing their own food. Interestingly, as Table 8 shows, the threat of theft or produce proved to be the biggest impediment (with 69% in agreement). More conventional disincentives were also cited by most respondents including land shortage (68%), a lack of inputs (64%) and poor soil quality (51%). Half of the respondents agreed that they lacked the skills to grow food and a similar proportion said it was easier to buy food than grow it. There was uncertainty about whether municipal regulations allowed them to practice urban agriculture. A significant minority (45%) had no interest in growing food or did not have the time or labor (39%).
A few households grew some food in rural areas or received food from relatives in rural areas. While there is some food sharing in the informal settlements, the number of beneficiaries is small (less than 10%). This may not be because households are unwilling to share but rather that they barely have enough for their own survival. None of these coping mechanisms have any significant impact on overall levels of food insecurity in Windhoek’s informal urban food deserts.
6. Conclusions
Much of the literature on informal settlements in African cities focuses on housing, sanitation, and infrastructure. Food receives much less attention despite its central importance to daily survival. UN-Habitat’s list of key urban challenges does not even mention food security as a concern, for example [63]. Similarly, while Sustainable Development Goal (SDG) 11 provides a list of targets for the achievement of sustainable cities by 2030, food security is absent. The reasons for the neglect of urban food deserts in the international food security agenda relates to the pervasive anti-urban bias in the global food security agenda [64]. Rapid urbanization in Africa is leading to the explosive growth of informal settlements which are particularly intense and chronic spaces of deprivation and vulnerability. They are also sites of high levels of food insecurity despite the ubiquitous presence of food. In terms of the Africa-appropriate definition used in this paper, informal settlements also qualify as food deserts.
The traditional conception of food deserts was developed to describe the lack of physical access to healthy food in poorer areas of UK and North American cities. The inaccessibility of supermarkets is seen as a key driver of food desertification. Critics of the food deserts concept have argued that it is inappropriate for Africa, not least because supermarkets have a marginal presence in most African cities. This characterization is not true of many cities in the southern part of the continent where urban food systems are dominated by supermarkets and their supply chains. In the case of Windhoek, Namibia, supermarkets command a majority share of the food retail market and are also physically accessible to the residents of the city’s burgeoning informal settlements. However, as we show in this paper, supermarket patronage by households in the city’s food deserts is targeted at monthly bulk purchase of key staples. Other healthier foods are available but are unaffordable for the majority.
In addition to the supermarkets, there are numerous formal and informal food outlets both within and near the informal settlements. However, urban agriculture is unviable, leaving households reliant on occasional transfers of food from the rural north to diversify their diet. The high levels of food insecurity in Windhoek’s informal settlement food deserts documented here are therefore not a function of the lack or physical inaccessibility of food. Rather, they are due to economic inaccessibility and the inability of most households to secure sufficient income to meet their basic needs, and to purchase food in sufficient quantity and of sufficient diversity to ensure a balanced and nutritious diet for all household members.
Author Contributions
Conceptualization, J.C., N.N., and L.K.; Methodology, J.C., N.N., and L.K.; Formal Analysis, J.C., N.N., and L.K.; Investigation, N.N. and L.K.; Resources, N.N. and L.K.; Data Curation, J.C.; Writing—Original Draft Preparation, J.C.; Writing—Review & Editing, N.N. and L.K.; Project Administration, N.N. and L.K.; Funding Acquisition, J.C.
Funding
This research was funded by the Open Society of South Africa (OSF-SA), grant number 03414; the International Development Research Centre (IDRC), grant number 107775-001; the Social Sciences and Humanities Research Council of Canada (SSHRC) grant number 895-2013-3005; and the Canadian Queen Elizabeth II Diamond Jubilee Scholarships: Advanced Scholars Project.
Acknowledgments
The authors wish to thank Gareth Haysom for facilitating the research, Cameron McCordic and Zhenzhong Si for assistance with data analysis, Maria Salamone for grant management, and Raghav Sethi for the supermarket map.
Conflicts of Interest
The authors declare no conflict of interest.
References
- Saunders, D. Arrival City: The Final Migration and Our Next World; Knopf, A.A., Ed.; Vintage Books: Toronto, ON, Canada, 2010. [Google Scholar]
- UN-Habitat. World Cities Report, 2016, Urbanization and Development: Emerging Futures; UN-Habitat: Nairobi, Kenya, 2016. [Google Scholar]
- Fox, S. The political economy of slums: Theory and evidence from sub-Saharan Africa. World Dev. 2014, 54, 191–203. [Google Scholar] [CrossRef]
- Jachnow, A.; Keunen, E.; Lunetta, C.; Mazzolini, A.; Brilhante, O. Urbanization in Mozambique: Assessing Actors, Processes, and Impacts of Urban Growth; Cities Alliance: Brussels, Belgium, 2017. [Google Scholar]
- Huchzermeyer, M.; Karam, A. (Eds.) Informal Settlements: A Perpetual Challenge? UCT Press: Cape Town, South Africa, 2006. [Google Scholar]
- Idongo, N. The effect of urbanisation on housing conditions in Namibia. Int. J. Humanit. Soc. Sci. Educ. 2015, 2, 1–8. [Google Scholar]
- Weber, B.; Mendelsohn, J. Informal Settlements in Namibia: Their Nature and Growth; Occasional Papers No. 1; Development Workshop Namibia: Windhoek, Namibia, 2017. [Google Scholar]
- Gulyani, S.; Talukdar, D. Inside informality: The links between poverty, microenterprises, and living conditions in Nairobi’s slums. World Dev. 2010, 38, 1710–1726. [Google Scholar] [CrossRef]
- Medina, L.; Jonelis, A.; Cangul, M. The Informal Economy in Sub-Saharan Africa: Size and Determinants; IMF Working Paper WP/17/156; International Monetary Fund: Washington, DC, USA, 2017. [Google Scholar]
- Sverdlik, A. Ill-health and poverty: A literature review on health in informal settlements. Environ. Urban. 2011, 23, 123–155. [Google Scholar] [CrossRef]
- Ezeh, A.; Oyebode, O.; Satterthwaite, D.; Chen, Y.-F.; Ndugwa, R.; Sartori, J.; Mberu, B.; Melendez-Torjres, G.; Haregu, T.; Watson, S.; et al. The history, geography, and sociology of slums and the health problems of people who live in slums. Lancet 2017, 389, 4–10. [Google Scholar] [CrossRef]
- Satterthwaite, D.; Sverdlik, A.; Brown, D. Revealing and responding to multiple health risks in informal settlements in sub-Saharan African cities. J. Urban Health 2018. [Google Scholar] [CrossRef] [PubMed]
- Myers, G. Garbage, Governance and Sustainable Development in Urban Africa; Routledge: London, UK, 2005. [Google Scholar]
- Okurut, K.; Kulubako, R.N.; Chenoweth, J.; Charles, K. Assessing demand for improved sustainable sanitation in low-income informal settlements of urban areas: A critical review. Int. J. Environ. Health Res. 2015, 25, 81–95. [Google Scholar] [CrossRef]
- Scovronick, N.; Lloyd, S.; Kovats, R. Climate and health in informal urban settlements. Environ. Urban. 2015, 27, 657–678. [Google Scholar] [CrossRef] [Green Version]
- Crush, J.; Frayne, B. Feeding African cities: The growing challenge of urban food insecurity. In Africa’s Urban Revolution; Parnell, S., Pieterse, E., Eds.; Zed Books: London, UK, 2014; pp. 110–132. [Google Scholar]
- Ruel, M.; Garrett, J.; Yosef, S.; Olivier, M. Urbanization, food security and nutrition. In Nutrition and Health in a Developing World; de Pee, S., Tareen, D., Bloem, M., Eds.; Springer Nature: Basel, Switzerland, 2017; pp. 705–735. [Google Scholar]
- Tacoli, C. Food (in)security in rapidly urbanising, low-income contexts. Int. J. Environ. Res. Public Health 2017, 14, 1554. [Google Scholar] [CrossRef]
- Frayne, B.; Crush, J.; McCordic, C. (Eds.) Food and Nutrition Security in Southern African Cities; Routledge: London, UK, 2018. [Google Scholar]
- Smith, L.; Alderman, H.; Aduayom, D. Food Insecurity in Sub-Saharan Africa: New Estimates from Household Expenditure Surveys; Research Report No. 146; International Food Policy Research Institute: Washington, DC, USA, 2006. [Google Scholar]
- Frayne, B.; Crush, J.; McLachlan, M. Urbanization, nutrition and development in southern African cities. Food Secur. 2014, 6, 101–112. [Google Scholar] [CrossRef]
- Faye, O.; Baschiere, A.; Falkingham, J.; Muindi, K. Hunger and food insecurity in Nairobi’s slums: An assessment using IRT models. J. Urban Health 2011, 88, 235–255. [Google Scholar] [CrossRef] [PubMed]
- Mohamed, S.; Mberu, B.; Amendah, D.; Kimai-Murage, E.; Ettarh, R.; Schofield, L.; Egondi, T.; Wekesah, F.; Kyobutungi, C. Poverty and uneven food security in urban slums. In Rapid Urbanisation, Urban Food Deserts and Food Security in Africa; Crush, J., Battersby, J., Eds.; Springer International Publishing: Basel, Switzerland, 2016; pp. 97–112. [Google Scholar]
- Raimundo, I.; Crush, J.; Pendleton, W. Food insecurity, poverty and informality. In Rapid Urbanisation, Urban Food Deserts and Food Security in Africa; Crush, J., Battersby, J., Eds.; Springer International Publishing: Basel, Switzerland, 2016; pp. 71–84. [Google Scholar]
- Raimundo, I.; Crush, J.; Pendleton, W. The State of Food Insecurity in Maputo, Mozambique; AFSUN Urban Food Security Series No. 20; African Food Security Urban Network: Cape Town, South Africa, 2014. [Google Scholar]
- FAO. Rome Declaration on World Food Security; FAO: Rome, Italy, 1996. [Google Scholar]
- Calogero, C.; Zezza, A.; Bannerjee, R. Towards better measurement of household food security: Harmonizing indicators and the role of household surveys. Glob. Food Secur. 2013, 2, 30–40. [Google Scholar]
- Coates, J. Build it back better: Deconstructing food security for improved measurement and action. Glob. Food Secur. 2013, 2, 188–194. [Google Scholar] [CrossRef]
- Jones, A.; Ngure, F.; Pelto, G.; Young, S. What are we assessing when we measure food security? A compendium and review of current metrics. Adv. Nutr. 2013, 4, 481–505. [Google Scholar] [CrossRef] [PubMed]
- Leroy, J.; Ruel, M.; Frongillo, E.; Harris, J.; Ballard, T. Measuring the food access dimension of food security: A critical review and mapping of indicators. Food Nutr. Bull. 2015, 36, 167–195. [Google Scholar] [CrossRef]
- Haysom, G.; Tawodzera, G. Measurement drives diagnosis and response”: Gaps in transferring food security assessment to the urban scale. Food Policy 2018, 74, 117–125. [Google Scholar] [CrossRef]
- Coates, J.; Swindale, A.; Bilinsky, P. Household Food Insecurity Access Scale (HFIAS) for Measurement of Food Access: Indicator Guide Volume; Food and Technical Assistance Project (FANTA): Washington DC, USA, 2007. [Google Scholar]
- Swindale, A.; Bilinsky, P. Household Dietary Diversity Score (HDDS) for Measurement of Household Food Access: Indicator Guide; Food and Technical Assistance Project (FANTA): Washington, DC, USA, 2005. [Google Scholar]
- McCordic, C.; Frayne, B. Measuring urban food security. In Food and Nutrition Security in Southern African Cities; Frayne, B., Crush, J., McCordic, C., Eds.; Routledge: London, UK, 2018; pp. 24–33. [Google Scholar]
- Cummins, S.; Macintyre, S. ‘Food deserts’: Evidence and assumption in health policy making. BMJ 2002, 325, 436–438. [Google Scholar] [CrossRef] [PubMed]
- Shannon, J. Food deserts: Governing obesity in the neoliberal city. Prog. Hum. Geogr 2013, 38, 244–266. [Google Scholar] [CrossRef]
- Shaw, H. Food deserts: Towards the development of a classification. Geogr. Ann. B 2006, 88, 231–247. [Google Scholar] [CrossRef]
- Crush, J.; Battersby, J. (Eds.) Rapid Urbanisation, Urban Food Deserts and Food Security in Africa; Springer: Basel, Switzerland, 2016. [Google Scholar]
- Battersby, J. Beyond the food desert: Finding ways to speak about urban food security in South Africa. Geogr. Ann. B 2012, 94, 141–159. [Google Scholar] [CrossRef]
- Peyton, S.; Moseley, W.; Battersby, J. Implications of supermarket expansion on urban food security in Cape Town, South Africa. Afr. Geogr. Rev. 2015, 34, 36–54. [Google Scholar] [CrossRef]
- Battersby, J.; Peyton, S. The spatial logic of supermarket expansion and food access. In Rapid Urbanisation, Urban Food Deserts and Food Security in Africa; Crush, J., Battersby, J., Eds.; Springer International Publishing: Basel, Switzerland, 2016; pp. 33–46. [Google Scholar]
- Crush, J.; Frayne, B. Supermarket expansion and the informal food economy in southern African cities: Implications for urban food security. J. S. Afr. Stud. 2011, 37, 781–807. [Google Scholar] [CrossRef]
- Kroll, F. Deflating the Fallacy of Food Deserts: Local Food Geographies in Orange Farm and Inner City Johannesburg; PLAAS Working Paper 38; Centre of Excellence on Food Security, University of Western Cape: Cape Town, South Africa, 2016. [Google Scholar]
- Battersby, J.; Crush, J. The making of urban food deserts. In Rapid Urbanisation, Urban Food Deserts and Food Security in Africa; Crush, J., Battersby, J., Eds.; Springer International Publishing: Basel, Switzerland, 2016; pp. 1–18. [Google Scholar]
- Skinner, C. Contributing and yet excluded? Informal food retail in African cities. In Urban Food Systems Governance and Poverty in African Cities; Battersby, J., Watson, V., Eds.; Routledge: London, UK, 2019; pp. 104–115. [Google Scholar]
- Nickanor, N.; Crush, J.; Pendleton, W. Migration, rural-urban linkages and food insecurity. In Rapid Urbanisation, Urban Food Deserts and Food Security in Africa; Crush, J., Battersby, J., Eds.; Springer International Publishing: Basel, Switzerland, 2016; pp. 127–142. [Google Scholar]
- Nickanor, N. Food Deserts and Household Food Insecurity in the Informal Settlements of Windhoek, Namibia. Ph.D. Thesis, University of Cape Town, Cape Town, South Africa, 2013. [Google Scholar]
- Ishimael, M. Understanding the Spatial Dynamics of Informal Settlements: A Spatial Analysis Case Study of Oohamho Dha Nehale in the City of Windhoek. Master’s Thesis, University of Namibia, Windhoek, Namibia, 2016. [Google Scholar]
- Weber, B. Addressing informal settlement growth in Namibia. Namib. J. Environ. 2017, 1B, 16–26. [Google Scholar]
- Newaya, T. Rapid Urbanization and Its Influence on the Growth of Informal Settlements in Windhoek, Namibia. Master’s Thesis, Cape Peninsular University of Technology, Cape Town, South Africa, 2010. [Google Scholar]
- Karuaihe, S.; Wandschneider, P. Limited access to services for the urban poor in Windhoek, Namibia. Dev. S. Afr. 2018, 35, 466–479. [Google Scholar] [CrossRef]
- Pendleton, W.; Nickanor, N.; Pomuti, A. The State of Food Insecurity in Windhoek, Namibia; AFSUN Urban Food Security Series No. 14; African Food Security Urban Network: Cape Town, South Africa, 2012. [Google Scholar]
- Mbongo, L. Food Insecurity and Quality of Life in Informal Settlements of Katatura, Windhoek, Namibia. Master’s Thesis, University of Namibia, Windhoek, Namibia, 2017. [Google Scholar]
- Nickanor, N.; Kazembe, L. Increasing levels of malnutrition with rapid urbanization in informal settlements of Katatura, Windhoek: Neighbourhood differentials and the effect of socio-economic disadvantage. World Health Popul. 2016, 16, 5–21. [Google Scholar] [CrossRef] [PubMed]
- Frayne, B. Migration and the changing social economy of Windhoek, Namibia. Dev. S. Afr. 2007, 24, 91–108. [Google Scholar] [CrossRef]
- Crush, J.; McCordic, C. The hungry cities food purchases matrix: Household food sourcing and food system interaction. Urban Forum 2017, 28, 421–433. [Google Scholar] [CrossRef]
- Tawodzera, G. Food insecurity in a state in crisis. In Rapid Urbanisation, Urban Food Deserts and Food Security in Africa; Crush, J., Battersby, J., Eds.; Springer International Publishing: Basel, Switzerland, 2016; pp. 85–96. [Google Scholar]
- Chilanga, E.; Riley, L.; Ngwira, J.; Chalinda, C.; Masitala, L. Food Insecurity in Informal Settlements in Lilongwe, Malawi; AFSUN Urban Food Security Series No. 25; African Food Security Urban Network: Cape Town, South Africa, 2017. [Google Scholar]
- Nickanor, N.; Kazembe, L.; Crush, J.; Wagner, J. The Supermarket Revolution and Food Security in Namibia; AFSUN Urban Food Security Series No. 26; African Food Security Urban Network: Cape Town, South Africa, 2017. [Google Scholar]
- Frayne, B.; McCordic, B.; Shilomboleni, H. The mythology of urban agriculture. In Rapid Urbanisation, Urban Food Deserts and Food Security in Africa; Crush, J., Battersby, J., Eds.; Springer International Publishing: Basel, Switzerland, 2016; pp. 19–32. [Google Scholar]
- Crush, J.; Hovorka, A.; Tevera, D. Farming the city: The broken promise of urban agriculture. In Food and Nutrition Security in Southern African Cities; Frayne, B., Crush, J., McCordic, C., Eds.; Routledge: London, UK, 2018; pp. 101–117. [Google Scholar]
- Dima, S.; Ogunmokun, A. Urban and periurban agriculture in Namibia. Urban Agric. Mag. 2004, 12, 36–37. [Google Scholar]
- Un-Habitat. Urban Themes. Available online: https://unhabitat.org/ (accessed on 15 July 2018).
- Crush, J.; Riley, L. Rural bias and urban food security. In Urban Food Systems Governance and Poverty in African Cities; Battersby, J., Watson, V., Eds.; Routledge: London, UK, 2018; pp. 42–58. [Google Scholar]
Figure 1.
Distribution of household HFIAS scores.

Figure 2.
Location of supermarkets in Windhoek.


Table 1.
Characteristics of constituencies with informal settlements, 2011 [47].
Table 1.
Characteristics of constituencies with informal settlements, 2011 [47].
| Moses Garoëb | Samora Machel | Tobias Hainyeko | |
|---|---|---|---|
| No. of Households | 13,800 | 13,200 | 12,600 |
| Population | 45,500 | 49,700 | 45,800 |
| Age 0–14 (%) | 25 | 29 | 27 |
| Age 15–59 (%) | 72 | 68 | 70 |
| Age 60+ | 1 | 1 | 1 |
| Employed (%) | 62 | 63 | 62 |
| Unemployed (%) | 38 | 37 | 38 |
| Public piped water (% of HH) | 99 | 99 | 98 |
| Private toilet (% of HH) | 44 | 77 | 33 |
| Electric lighting (% of HH) | 28 | 69 | 20 |
| Regular garbage collection (% of HH) | 28 | 69 | 20 |
| Shacks (%) | 64 | 37 | 71 |
| Brick houses (%) | 36 | 63 | 29 |
Table 2.
Windhoek informal settlement HFIAP in comparative context.
| % of Households in Informal Settlements in Windhoek, 2016 | % of all Households in Windhoek, 2016 | % of Households in Low-income Areas of 11 SADC Cities, 2007–2008 | % of Households in Informal Settlements in Lilongwe, Malawi, 2015 | |
|---|---|---|---|---|
| Food secure | 6.2 | 16.4 | 17.0 | 3.0 |
| Mildly food insecure | 1.2 | 3.4 | 7.0 | 6.0 |
| Moderately food insecure | 8.4 | 13.1 | 19.0 | 19.0 |
| Severely food insecure | 81.2 | 67.1 | 57.0 | 72.0 |
Table 3.
Levels of household food insecurity in Windhoek informal settlements by household type.
| Households | HFIAS | HFIAP | HDDS | |||||
|---|---|---|---|---|---|---|---|---|
| No. | % | Mean | Food Secure (%) | Mildly Food Insecure (%) | Moderately Food Insecure (%) | Severely Food Insecure (%) | Mean | |
| Female-centred (no husband/male partner, may include relatives, children, friends) | 114 | 28.2 | 15.6 | 5.1 | 0.8 | 7.6 | 86.5 | 2.5 |
| Male-centred (no wife/female partner, may include relatives, children, friends) | 100 | 24.8 | 13.9 | 9.9 | 2.0 | 6.9 | 81.2 | 2.6 |
| Nuclear (husband/male partner and wife/female partner with or without children) | 105 | 26.0 | 16.9 | 4.0 | 0.0 | 7.6 | 88.4 | 2.3 |
| Extended (husband/male partner and wife/female partner and children and other relatives) | 85 | 21.0 | 14.9 | 4.7 | 2.4 | 11.8 | 81.1 | 3.0 |
| Total | 404 | 100.0 | 15.4 | 6.2 | 1.2 | 8.4 | 84.2 | 2.6 |
Table 4.
Distribution of HDDS scores in Windhoek informal settlements.
| No. of Food Groups | No. of Households | % of Households | Cumulative % of Households |
|---|---|---|---|
| 0 | 11 | 2.6 | 2.6 |
| 1 | 33 | 7.9 | 10.5 |
| 2 | 220 | 52.5 | 63.0 |
| 3 | 68 | 16.2 | 79.2 |
| 4 | 43 | 10.3 | 89.5 |
| 5 | 24 | 5.7 | 95.2 |
| 6 | 8 | 2.9 | 98.1 |
| 7 | 4 | 1.0 | 99.1 |
| 8 | 3 | 0.7 | 99.8 |
| 9 | 1 | 0.2 | 100.0 |
| 10 | 0 | 0.0 | |
| 11 | 0 | 0.0 | |
| 12 | 0 | 0.0 | |
| 411 | 100.0 |
Table 5.
Food groups consumed in Windhoek informal settlements.
| Food Groups | No. of Households | % of Households |
|---|---|---|
| Cereals and food made from grains | 398 | 95.0 |
| Meat including beef, chicken, offal | 141 | 33.7 |
| Fresh or dried fish | 121 | 28.9 |
| Foods made with oil, fat, or butter | 101 | 24.1 |
| Vegetables | 93 | 22.2 |
| Sugar or honey | 89 | 21.2 |
| Other foods such as condiments, coffee, tea | 57 | 13.6 |
| Dairy products including milk and cheese | 33 | 7.9 |
| Foods made from beans, peas, lentils, or nuts | 19 | 4.5 |
| Potatoes and other tubers | 11 | 2.6 |
| Eggs | 10 | 2.4 |
| Fruit | 5 | 1.2 |
Note: Multiple-response question.
Table 6.
Food outlets patronized by residents of informal settlements.
| No. of Households | % of Households | At Least Five Days per Week | At Least Once per Week | At Least Once per Month | Less Frequent | |
|---|---|---|---|---|---|---|
| Formal Sources | ||||||
| Supermarkets | 389 | 93.1 | 1.0 | 10.0 | 72.8 | 16.2 |
| Small shops | 64 | 15.3 | 7.8 | 59.4 | 21.9 | 11.9 |
| Fast food/takeaways | 17 | 4.1 | 0.0 | 11.8 | 88.2 | 0.0 |
| Purchase at commercial farm | 4 | 1.0 | 0.0 | 25.0 | 75.0 | 0.0 |
| Restaurant | 2 | 0.5 | 0.0 | 50.0 | 50.0 | 0.0 |
| Informal Sources | ||||||
| Open markets | 243 | 58.1 | 14.9 | 46.3 | 16.9 | 21.9 |
| Street vendors | 113 | 27.0 | 62.2 | 21.6 | 8.1 | 8.1 |
| Tuck shops | 60 | 14.4 | 47.5 | 35.6 | 16.9 | 0.0 |
Note: Multiple-response question.
Table 7.
Foodstuffs purchased at different food retail outlets by residents of informal settlements.
Table 7.
Foodstuffs purchased at different food retail outlets by residents of informal settlements.
| Formal Outlets | Informal Outlets | ||||||
|---|---|---|---|---|---|---|---|
| % of Households | Super Market | Small Shop | Butchery | Open Market | Tuck Shop | Street Seller | |
| Mealie meal | 80.5 | 92.5 | 2.3 | 1.2 | 1.2 | 0.3 | |
| Bread | 79.3 | 39.7 | 19.0 | 2.7 | 31.5 | 1.1 | |
| Fish | 41.1 | 20.9 | 5.2 | 24.4 | 2.9 | 42.4 | |
| Rice | 37.8 | 98.8 | 1.2 | ||||
| Pasta | 35.0 | 98.6 | 0.7 | ||||
| Meat | 34.8 | 34.7 | 4.7 | 16.7 | 33.3 | 0.7 | 10.0 |
| Vegetables | 18.1 | 56.4 | 6.4 | 26.9 | 3.8 | 6.4 | |
| Mahangu | 16.2 | 92.1 | 3.9 | 1.3 | 2.6 | 1.3 | |
| Offal | 12.1 | 20.4 | 1.9 | 7.4 | 44.0 | 22.2 | |
| Fruit | 6.7 | 75.9 | 17.2 | 6.9 | |||
Table 8.
Reasons for not engaging in urban agriculture in Windhoek’s informal settlements.
| Reasons | Agree | Disagree | Neither |
|---|---|---|---|
| People would steal whatever we grow | 68.9 | 19.4 | 11.6 |
| We have no land on which to grow food | 67.9 | 23.7 | 8.4 |
| We do not have access to inputs | 63.9 | 24.6 | 11.6 |
| The soil is poor quality/rocky | 51.2 | 36.6 | 12.3 |
| We lack the skills to grow food | 50.9 | 41.7 | 7.4 |
| It is easier to buy our food than grow it | 50.7 | 42.9 | 6.4 |
| Municipal regulations do not allow us to grow food | 49.4 | 37.5 | 13.1 |
| We have no interest in growing food | 45.5 | 46.5 | 8.0 |
| We do not have the time or labor | 39.0 | 49.0 | 12.0 |
| Farming is for rural people only | 35.2 | 49.3 | 5.5 |
| The water is poor quality/brackish | 32.7 | 53.0 | 14.3 |
© 2018 by the authors. Licensee MDPI, Basel, Switzerland. This article is an open access article distributed under the terms and conditions of the Creative Commons Attribution (CC BY) license (http://creativecommons.org/licenses/by/4.0/).
Share and Cite
MDPI and ACS Style
Crush, J.; Nickanor, N.; Kazembe, L. Informal Food Deserts and Household Food Insecurity in Windhoek, Namibia. Sustainability 2019, 11, 37. https://doi.org/10.3390/su11010037
AMA Style
Crush J, Nickanor N, Kazembe L. Informal Food Deserts and Household Food Insecurity in Windhoek, Namibia. Sustainability. 2019; 11(1):37. https://doi.org/10.3390/su11010037
Chicago/Turabian StyleCrush, Jonathan, Ndeyapo Nickanor, and Lawrence Kazembe. 2019. "Informal Food Deserts and Household Food Insecurity in Windhoek, Namibia" Sustainability 11, no. 1: 37. https://doi.org/10.3390/su11010037
Note that from the first issue of 2016, this journal uses article numbers instead of page numbers. See further details here.