Implicit Secondary Authentication for Sustainable SMS Authentication


1
Department of Convergence Science, Graduate School of Kongju National University, Gongju 32588, Korea
2
Information Security Research Division, Electronics and Telecommunications Research Institute (ETRI), Daejeon 34129, Korea
3
Department of Medical Information, Kongju National University, Gongju 32588, Korea
*
Author to whom correspondence should be addressed.
Sustainability 2019, 11(1), 279; https://doi.org/10.3390/su11010279
Submission received: 7 November 2018
/
Revised: 20 December 2018
/
Accepted: 21 December 2018
/
Published: 8 January 2019
Abstract
:Short message service (SMS) is the most widely adopted multi-factor authentication method for consumer-facing accounts. However, SMS authentication is susceptible to vulnerabilities such as man-in-the-middle attack, smishing, and device theft. This study proposes implicit authentication based on behavioral pattern of users when they check an SMS verification code and environmental information of user proximity to detect device theft. User behavioral pattern is collected by using the accelerometer and gyroscope of a smart device such as a smartphone and smart watch. User environmental information is collected using device fingerprint, wireless access point, Bluetooth, and global positioning system information. To evaluate the performance of the proposed scheme, we perform experiments using a total of 1320 behavioral and environmental data collected from 22 participants. The scheme achieves an average equal error rate of 6.27% when using both behavioral and environmental data collected from only a smartphone. Moreover, it achieves an average equal error rate of 0% when using both behavioral and environmental data collected from a smartphone and smart watch. Therefore, the proposed scheme can be employed for more secure SMS authentication.
1. Introduction
Short message service (SMS) is the most widely adopted multi-factor authentication method for consumer-facing accounts. No additional tokens are necessary because it uses mobile devices that are usually carried at all times. SMS authentication, however, is susceptible to vulnerabilities such as man-in-the-middle (MTMA) [1,2], in which an attacker eavesdrops on the user’s verification code, and smishing, in which an attacker intercepts the user’s verification code through malicious applications installed carelessly by the user. Therefore, SMS authentication is excluded from the digital authentication guideline issued by the National Institute of Standards and Technology (NIST) [3]; instead, one-time password (OTP)-generating applications such as Google Authenticator and Authy, and biometric authentication such as fingerprint and iris authentication are recommended. However, an OTP-generating application does not prevent device theft and biometric authentication is not replaceable when leaked and is also vulnerable to smudge attacks [4,5]. To overcome these limitations, behavioral-based authentication techniques such as those using arm gestures when responding to calls or hand waving gestures have been studied.
Hand waving gesture-based behavioral authentication [6] uses a smartphone’s light and accelerometer sensors to detect malicious applications that eavesdrop on sensitive information such as calls and SMSs. However, because Ref. [6] requires explicit and specific behavior that need conscious participation of users. Ref. [7] proposed an authentication scheme that uses a behavioral pattern collected from accelerometer and gyroscope of a smartphone when a user receives a phone call and shape of the user’s ear collected from the front camera of the smartphone. This may be convenient for the user because Ref. [7] authenticates using a user’s natural behavior when the user receives a phone call and the shape of the user’s ear. However, the shape of a user’s ear is difficult to practically collect when the user receives a phone call; moreover, this scheme does not explicitly state in which situations it can be used.
This paper proposes an implicit secondary authentication scheme that uses a unconscious behavioral pattern of users when they check an SMS verification code, and information about the surrounding environment at that time. This behavioral pattern of users is collected by the accelerometer and gyroscope of a smart device such as a smartphone and smart watch, and the surrounding environmental information is collected using device fingerprints, wireless access points (AP), Bluetooth, and global positioning system (GPS) information. We employ peak detection to detect the behavioral starting point and use an autoencoder to generate an environmental model. We then perform experiments using data collected from 22 participants for each location of the smartphone. Unlike previous behavior-based authentication schemes, users can use this conveniently because the proposed scheme does not require conscious behavior of the user.
The main contributions of the paper are summarized as follows:
- We propose a user authentication scheme that combines a behavioral pattern when a user checks an SMS verification code, and environmental information using a device fingerprint, wireless AP, Bluetooth, and GPS to detect device theft. In addition, we analyze the feasibility and applicability of user authentication based on behavioral pattern and surrounding environmental information.
- The proposed scheme does not require any specific user behavior because user authentication is performed using natural user behavior when checking an SMS verification code. Therefore, users can use our authentication scheme without any inconvenience.
- We detect the behavioral starting point using peak detection to extract pure behavioral data when a user checks an SMS verification code. Thus, the proposed scheme does not use behavioral data until the user receives and checks the SMS verification code. To the best of our knowledge, this study is the first to detect behavioral starting point for behavior-based authentication.
- This study systematically evaluates user authentication on smartphones by analyzing behavior and environment; the proposed scheme can perform user authentication with high accuracy. These results suggest that the proposed scheme is sufficient to detect device theft when using SMS authentication.
The structure of the paper is as follows: Section 2 discusses related work. Section 3 describes the proposed scheme, which includes data acquisition, data preprocessing, and user registration and authentication. Section 4 describes the experiments conducted to evaluate the proposed scheme. Section 5 discusses usability, security, and limitations about the proposed scheme. Section 6 concludes the paper.
2. Related Work
Behavior-based authentication schemes have been employed in various studies; they use user behavior such as hand gestures, keystroke dynamic, signature dynamic, and touch gesture. In addition, we explore face recognition that can be applied to SMS authentication.
In 2013, Shrestha et al. [6] proposed an authentication scheme that uses hand gestures collected from light and accelerometer sensors of a smartphone to prevent attackers from eavesdropping using malicious software. Results of the experiment, in which data was collected from 20 participants, showed a false positive rate (FPR) of 0.08% and false negative rate (FNR) of 9.5%. In 2015, Yang et al. [8] proposed an authentication scheme that uses accelerometer of a smartphone to unlock the smartphone. Results of the experiment, in which a user model was generated using a support vector machine (SVM) for 22 participants, showed an FPR of 15% and FNR of 8%. However, hand gesture-based authentication schemes have a drawback that users are inconvenienced because they require specific user behavior.
In 2013, Trojahn et al. [9] proposed an authentication scheme that uses pressure and finger size for keystroke dynamics. Results of the experiment, in which multilayer perceptron was used from 16 participants, showed a false accept rate (FAR) of 2.52% and false rejection rate (FRR) of 3.0%. In 2014, Kambourakis et al. [10] proposed an authentication scheme that uses movement and speed of fingers when a user enters a password on a touch screen. Results of the experiment, in which a user model was generated using k-nearest neighbors for 20 participants, showed an FAR of 23.7% and FRR of 3.5%. Keystroke dynamic-based authentication schemes can be easily used in SMS authentication but have a drawback of generated user behavioral model for various devices such as smartphones, desktops, and laptops.
In 2014, Zheng et al. [11] proposed non-intrusive user verification that uses various sensors such as accelerometer, gyroscope, and pressure sensors when a user enters an 8-digit personal identity number (PIN). Results of the experiment using one-class classification algorithm for 80 participants showed an equal error rate (EER) of 3.65%. In 2014, Saravanan et al. [12] proposed LatentGesture that uses pressure, time, and touch coordinates when a user presses a button or check box. Results of the experiment using Lib-SVM for 20 participants showed an average accuracy of 97.9% with a smartphone and 96.79% with a tablet for single user classification. In 2013, Bo et al. [13] proposed a framework for smartphone authentication based on the dynamics of touch and movement. They extracted features from touch and movement behavior such as pressure, area, duration, position, velocity, and acceleration, and employed an SVM to perform the user authentication task in a lab scenario. Experimental results for 100 volunteers show that the user identification accuracy is over 99%. Shen et al. [14] developed a continuous smartphone authentication system based on user touch-sliding operations. The system analyzed four types of touch behavior such as sliding up, down, left, and right, and employed an SVM to learn the behavioral pattern of the user’s touch, which was later used for authentication decisions. Experimental results for 70 participants in the real world showed an EER between 1.72% and 9.01%. However, touch-based behavioral authentication schemes can only be used when a user enters an SMS verification code on a smartphone.
Nam et al. [15] proposed a signature dynamic that uses a user’s signature information such as accelerometer and signature coordinates. It generated a user model using an autoencoder after a feature vector was extracted by a convolutional neural network. Experimental results to evaluate the performance for 20 participants showed an EER of 2.7%. In 2014, Sun et al. [16] developed a two-factor authentication system for multitouch mobile devices by asking a user to draw a signature on the touchscreen with multiple fingers to unlock a smart device. Experimental results for 30 volunteers showed a true positive rate (TPR) of 99.3% and FPR of 2.2%. However, because it requires specific user behavior, a user may feel inconvenienced.
Mare et al. [17] proposed ZEBRA, which is a bilateral recurring authentication method. The signals sent from a bracelet on a user’s wrist are correlated with the terminal’s operations to confirm the continued presence of the user if the two movements correlate according to a few coarse-grained actions. Results of the experiment that uses random forest showed an accuracy of 85%. Lee et al. [18] proposed iAuth, which combined sensor information, such as that from accelerometer and gyroscope, from a smartphone and wearable devices. Results of the experiment that uses kernel ridge regression for 20 users showed an authentication accuracy of 92.1%.
In 2014, Taigman et al. [19] proposed a face recognition model using deep neural network, which is called DeepFace. Experimental results for labeled faces in a wild dataset indicated an accuracy of 97.35%. Such results approach human performance under the unconstrained condition for the first time. Since DeepFace [19], face recognition schemes using deep learning such as DeepID2 [20], DeepID3 [21], FaceNet [22], VGGFace [23], and SphereFace [24] have been studied. Although the accuracy of face recognition is high, a user’s face may not be captured when SMS authentication is performed. Furthermore, it is vulnerable to an adversarial example, which may result in misclassification through minimum modulation of the input image.
Unlike related works, we propose an implicit authentication scheme that does not depend on the device and does not require the user to perform a specific behavior.
3. Proposed Scheme
We propose an implicit secondary authentication scheme to prevent device theft in SMS authentication. The proposed scheme can be divided into data acquisition, data preprocessing, and user registration and authentication. Figure 1 shows the architecture of the authentication scheme proposed in this paper. In step 1, a user enters personal information such as name and phone number to use SMS authentication when identification is required. In step 2, an authentication server sends an SMS verification code to the user’s phone number and requests user’s behavioral and environmental data. In step 3, the user enters the SMS verification code, and the user’s smartphone sends behavioral and environmental data to the authentication server. The authentication server generates a user behavioral model for every location of the smartphone after preprocessing the previously collected behavioral data. The smartphone may be located on a table, in the user’s hand, or the user’s pocket. The authentication server generates a user environmental model by using the extracted feature vector. The authentication server verifies the SMS authentication code sent by the user and determines the location of the smartphone by inputting the first vector of the received behavioral data into the location decision classifier to determine the location of the smartphone. The received user behavioral data are compared with the user behavioral model of the determined location saved in the authentication server. The extracted feature of the user’s surrounding environmental data is input into the user environmental model. The confidence value output by the user environmental model is combined with the difference between the received user behavioral data and behavioral model. The combined score is compared with a predefined threshold. If the combined score is less than or equal to the threshold, authentication is successful; otherwise, authentication fails. In step 4, the authentication server sends the authentication result to the user. The proposed scheme is not different from the normal SMS authentication process. In addition, it does not make any additional requests to the user.
3.1. Data Acquisition
Behavioral and environmental data of a user are collected when identifying the user through SMS authentication. The behavioral and environmental data are collected for five seconds from the time the user receives an SMS verification code.
3.1.1. Behavioral Data Acquisition
Figure 2 shows the behavioral pattern when a user checks an SMS verification code on his/her smartphone, which is on a table. Users naturally pick up the smartphone for checking the code when the code the received. Figure 2a,b show that the speed with which and height at which users lift a smartphone are different. As shown in Figure 2c, a user with a smart watch checks the SMS verification code on the smart watch because the smart watch also receives the code. Table 1 provides a list of sensors used for user behavioral data acquisition. We collect accelerometer and gyroscope data from a smart device such as a smartphone and smart watch. The smartphone and smart watch have a built-in accelerometer and gyroscope. The smart watch is connected to the smartphone and behavioral data collected from the smart watch are sent to the smartphone through Bluetooth.
3.1.2. Environmental Data Acquisition
The proposed scheme collects environmental information about a user to verify whether the user is at a place where he/she has stayed for a long time at the time of authentication. Users are likely to perform identity verification at a place where they are staying for a long time such as home or workplace. Table 2 provides a list of used environmental information. We collect device fingerprints, wireless AP information, Bluetooth information from a smart device such as a smartphone and smart watch, and GPS information, which includes the latitude and longitude. The device fingerprint is a character string that includes brand, manufacturer, and model of the device. The wireless AP information includes the basic service set identifier (BSSID), which is the media access control (MAC) address, and received signal strength indication (RSSI), which is the measurement of power of a received signal. The GPS information includes latitude and longitude measured by a network sensor based on the location of the base station. The Bluetooth information of a smart device is collected as the Bluetooth MAC and RSSI of each device.
3.2. Data Preprocessing
3.2.1. Scaling Sensor Data and Detecting Behavioral Starting Point
We perform data scaling and detect the starting point of user behavior for preprocessing behavioral data when the user checks an SMS verification code. Because accelerometer and gyroscope sensor data on this behavior are different for each axis, we must perform data scaling. We preserve the shape of sensor data using min-max scaling and sensor data is transformed from a value of 0 to 1. It can be represented as follows:
where represent scaled sensor data and represent sensor data before scaling. The is separated as follows:
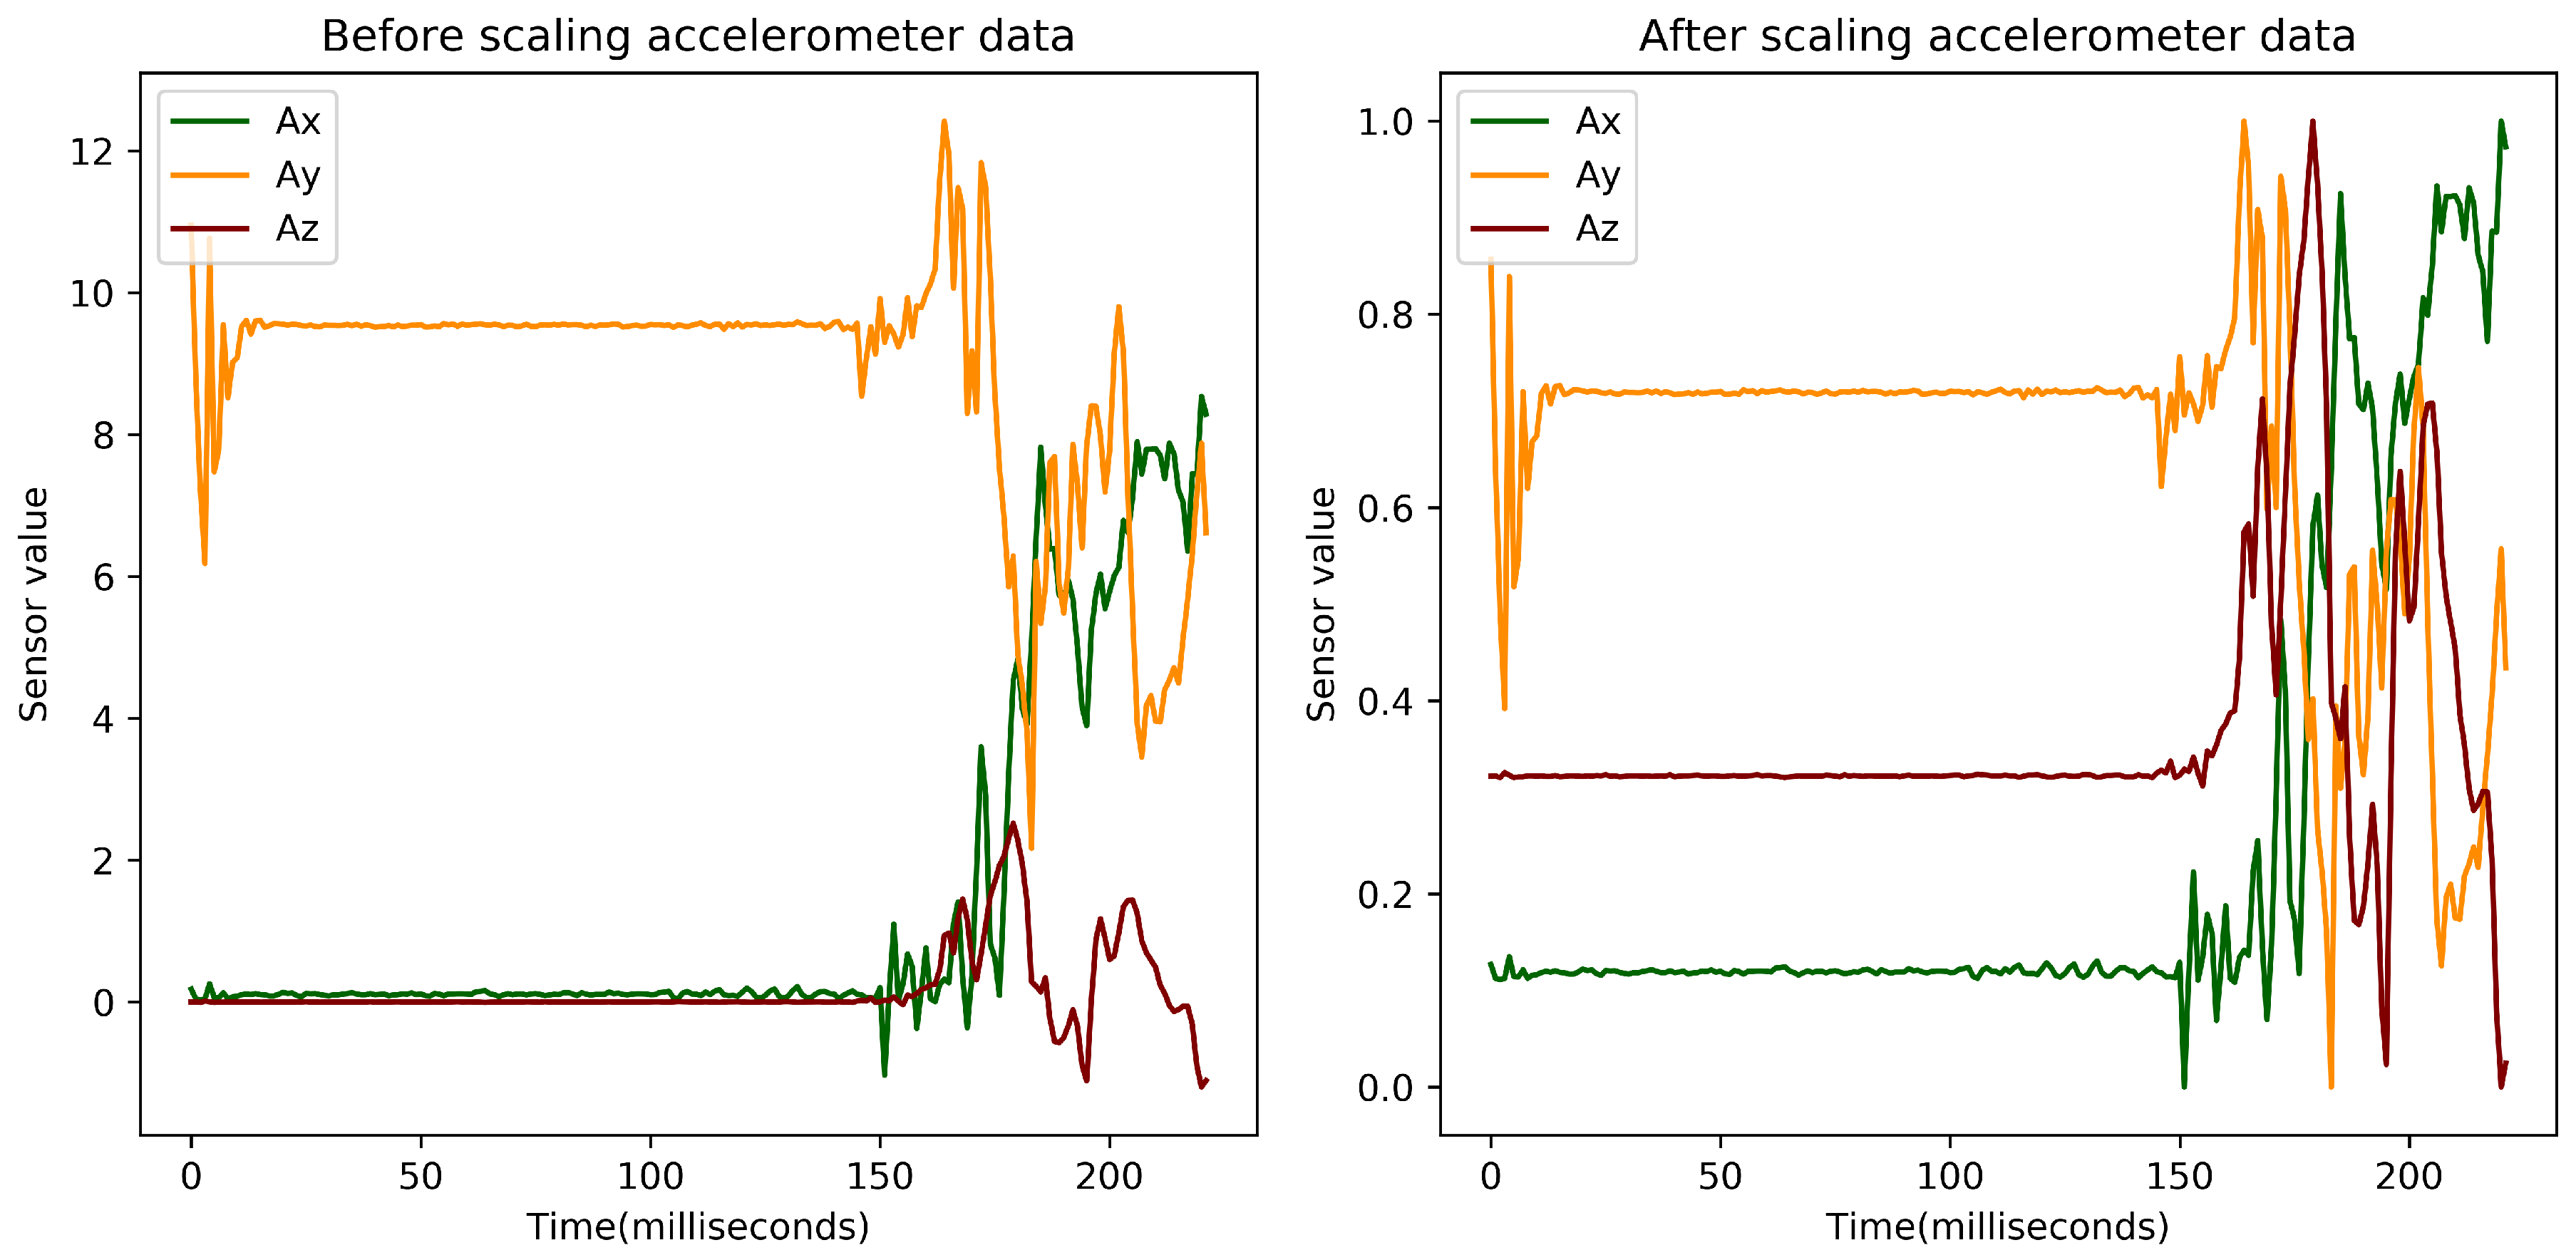
where represents the x-axis of each sensor, represents the y-axis of each sensor, and represents the z-axis of each sensor. Figure 3 shows accelerometer data before and after scaling.
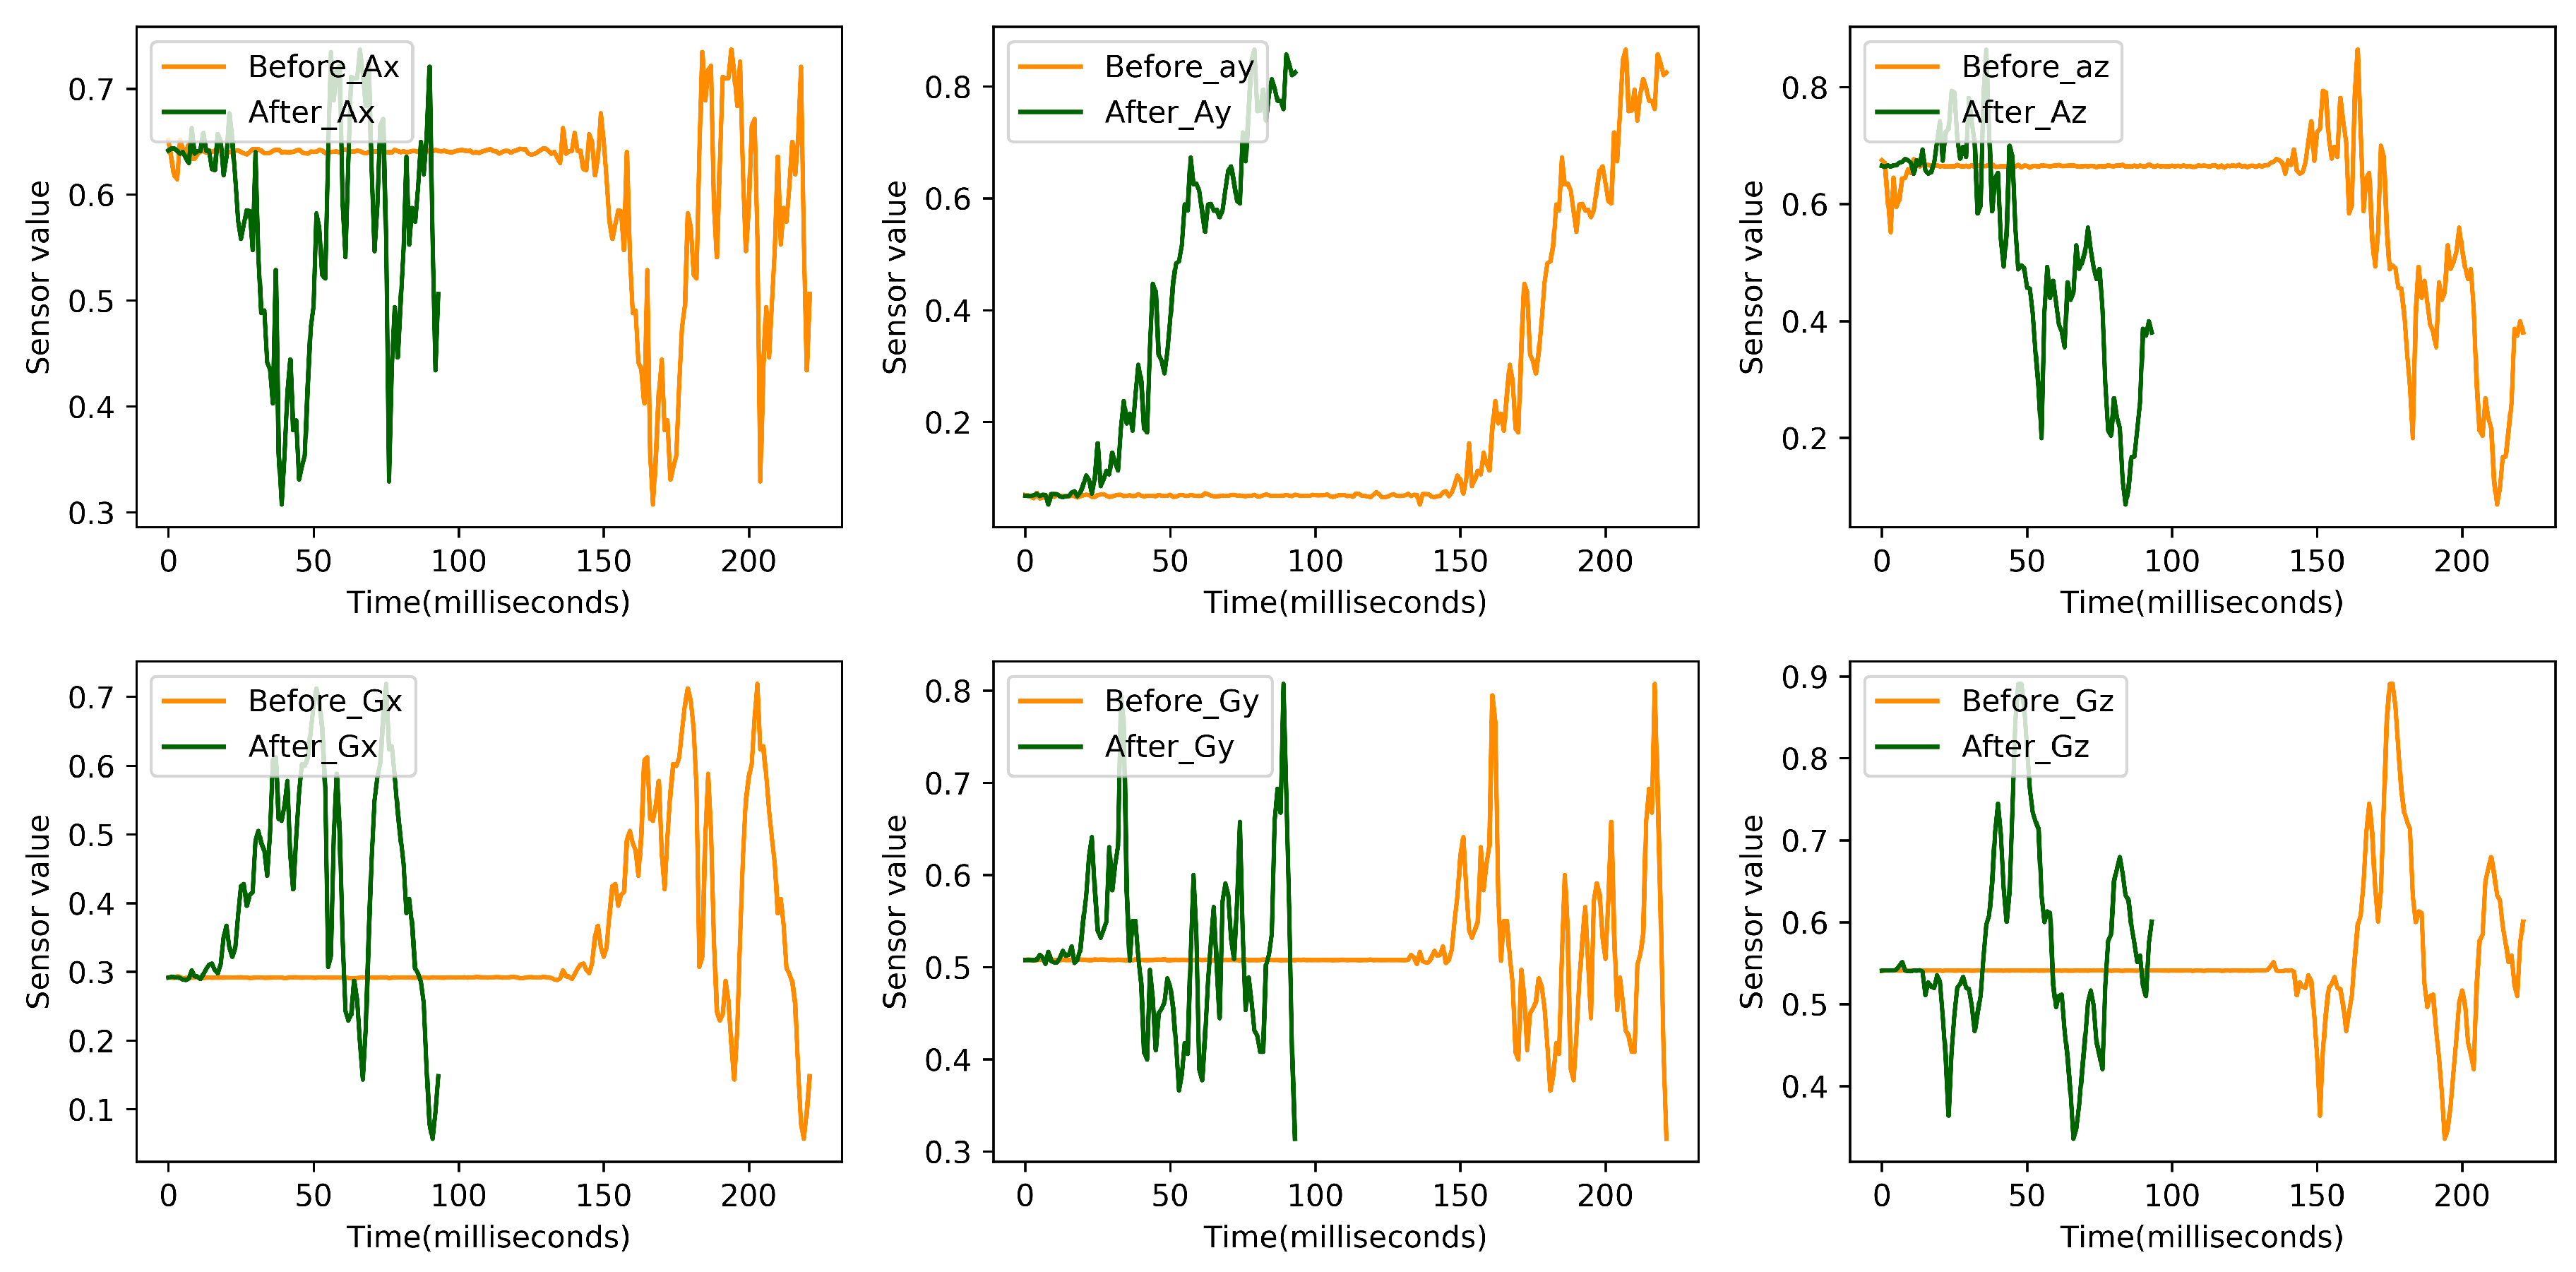
A static part exists in the sensor data starting from when the SMS verification code is received until checked by the user. To remove static data and use only dynamic data, we use peak detection [25] based on a threshold to detect the behavioral starting point. The peak detection based on the threshold is a method of detecting points where the rate of change of the time series data is equal to or higher than a pre-defined threshold value. We set the threshold value for peak detection as 0.01. It is represented as follows:
where returns indices of the detected peaks using the y-axis of the gyroscope sensor. We set the starting point as four indexes ahead of the index of the first peak because sensor values corresponding to the first peak index are already in progress. Pure sensor data on user behavior is when static sensor data, before the set starting point, is removed. It is represented as follows:
Figure 4 shows sensor data before and after detecting the behavioral starting point.
3.2.2. Extracting the Feature Vector for Environmental Data
First, environmental data to be used for training are registered in the authentication sever to extract the feature vector. The information to register with the authentication server includes the smartphone fingerprint of the user, BSSIDs of the top three wireless APs with a strong RSSI, and Bluetooth MAC address of the smart device. After registering environmental information, a feature vector is extracted by comparing the registered environmental information and inputted environmental data. For the smart device fingerprint, we assign 100 to the feature vector if the inputted fingerprint matches the registered fingerprint, and 0 if it does not. For the wireless AP information, we assign the average of RSSIs corresponding to BSSIDs if inputted BSSIDs are a part of the registered BSSIDs, and −100 if they are not. For Bluetooth information, we assign the average of RSSIs corresponding to MAC addresses if the inputted MAC address is a part of the registered MAC addresses, and −100 if it is not. For GPS, we assign the latitude and longitude values.
3.2.3. User Registration and Authentication
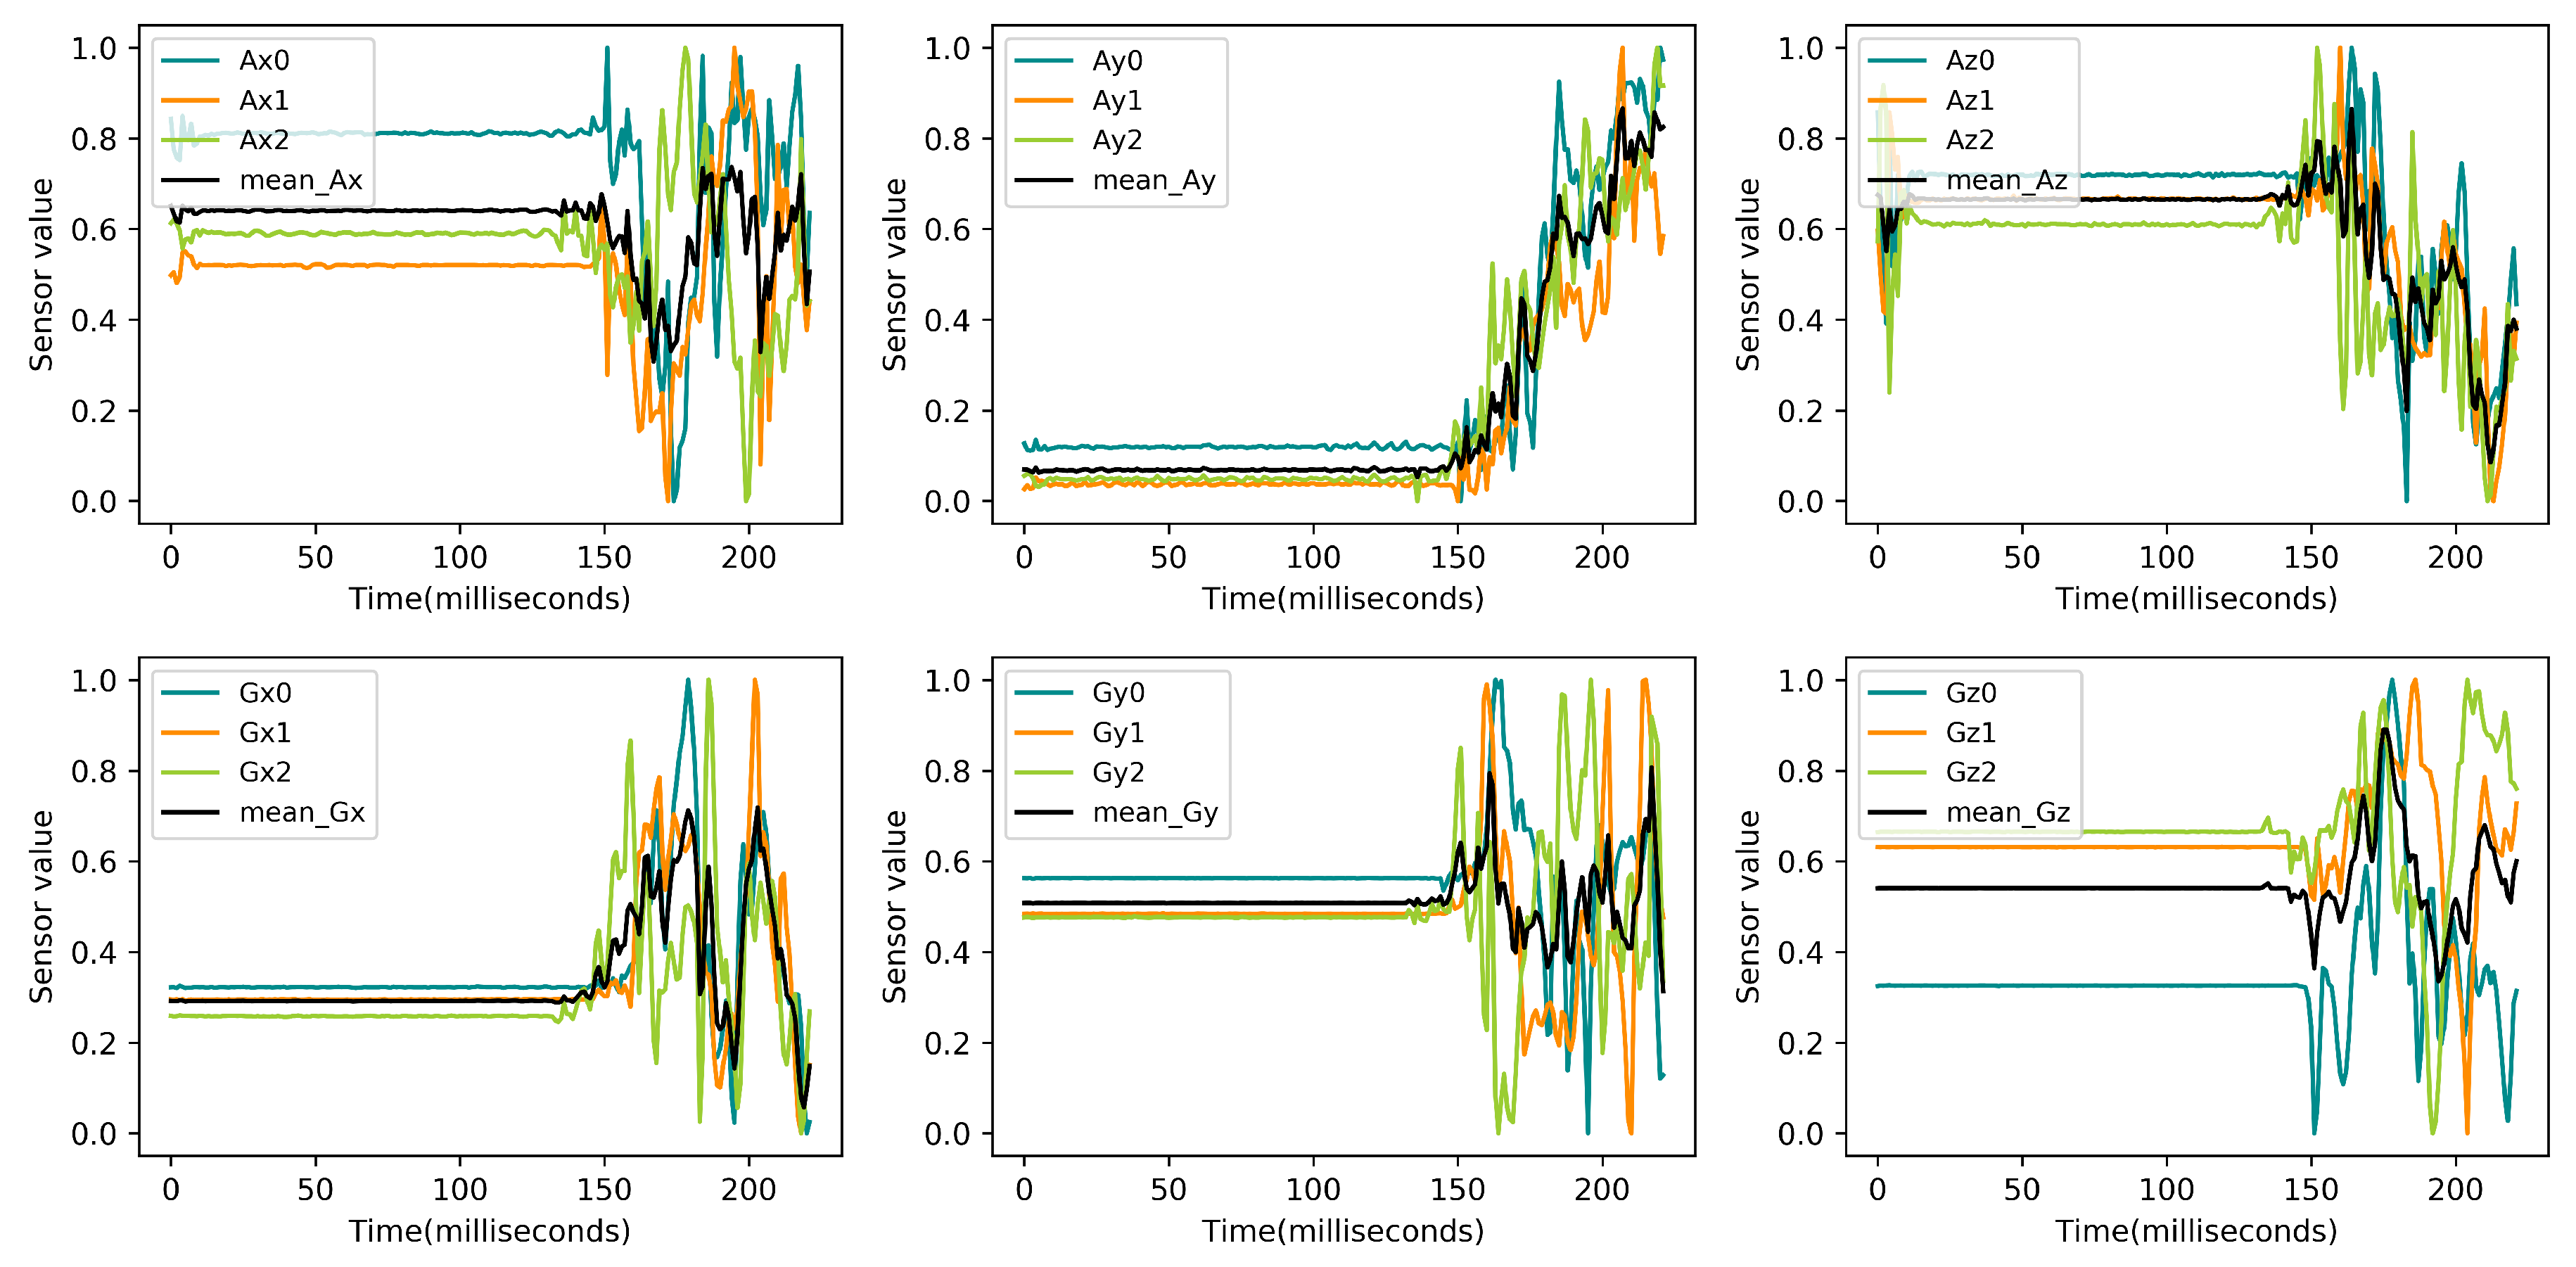
To register the user behavioral pattern, we use three behavioral data points to yield the average of each axis value at the same time for each location of the smartphone. Given three x-axis pieces of accelerometer data, corresponding to three different behavioral data, at time t, is calculated as . At time t, the average of each axis value from the accelerometer of the smartphone is represented as follows:
At time t, the average of sensor data of the smartphone is represented as follows:
Figure 5 shows scaled sensor data after calculating the average of three behavioral data points over the entire time period. The average of the sensor data obtained three times over the entire time period is calculated and then data scaling and the behavioral starting point calculation are performed as described in Section 3.2.1. As shown in Figure 4, sensor data, obtained after detecting the behavioral starting point, is registered as a behavioral model in the authentication server.
The user environmental model is trained by an autoencoder [26,27] after extracting the feature vector as described in Section 3.2.2. The autoencoder trains to reconstruct an output vector similar to the input feature vector and minimize , which is the mean square error between the output vector and the input feature vector. is represented as follows:
where X is the input feature vector and is the reconstructed output vector. The trained user environmental model is saved in the authentication server.
In the user authentication phase, we determine the location of the smartphone using the location decision classifier for the newly inputted sensor data. The saved user behavioral model of the determined location is then loaded in the authentication server. The newly inputted sensor data is compared with the loaded user behavioral model after min-max scaling and detecting a behavioral starting point as described in Section 3.2.1. We use the dynamic time warping (DTW) algorithm [8,28] to measure the similarity between the newly inputted sensor data and the loaded user behavioral model. The reason for using the DTW algorithm is that the similarity can be measured effectively even though the lengths of the two behavioral data are different. In this approach, suppose we have two x-axis pieces of accelerometer data points measured for users represented in time series and . Then, we need to construct an m-by-n matrix where the element of the matrix contains the distance between the two points and . Each element in the matrix corresponds to the alignment between the points and . A warping path P exists as a contiguous set of matrix elements that defines the mapping between R and S. The element of P is defined as such that we have that satisfies . There are many warping paths, but we will consider the path minimizing the warping cost as follows:
K in the denominator is used to compensate for the fact that warping paths may have different lengths. This path can be found very efficiently using dynamic programming to evaluate the following recurrence which defines the cumulative distance as the distance found in the current call and the minimum of cumulative distances of adjacent elements as follows:
We use cumulative distance in Equation (10) when we try to find and match loaded user behavioral model and newly inputted sensor data. The sum of the DTW cumulative distances of all axes for each sensor is represented as .
The feature vector for newly inputted environmental data is extracted as described in Section 3.2.2 The feature vector is inputted in the user environmental model and the confidence score of the user location is calculated as follows:
where is of the inputted feature vector using Equation (8), is maximum that can be obtained from the user environmental model by inputting the extracted feature vector into the model when all the newly inputted environmental data do not match the environmental information registered in the authentication server. and are combined as follows:
Successful user authentication occurs if the score is less than or equal to the predefined threshold; the user fails authentication if the score is greater than the predefined threshold.
4. Experiments
In this section, we describe the details of the experiments performed to evaluate the proposed scheme. We describe the data collection method, experimental method, which includes metrics to evaluate the performance of the proposed scheme, and experimental results.
4.1. Data Collection Method
For data collection, we recruited 22 students (8 females and 14 males; aged 18–24), who use an Android smartphone, from our university. Of those 22 participants, 18 used smartphones manufactured by Samsung, such as Galaxy S7, Galaxy S6 Edge, Galaxy Note 4, and Galaxy Note 5; the remaining four participants used smartphones manufactured by LG, namely the G3, V10, and V20. All participants were skilled smartphone users with an experience of at least one year. After obtaining prior approval from the 22 participants, an application for data collection was installed on their smartphone.
Before collecting behavioral data, we explained the way the application works for the data collection to all participants. We explained to the all participants that when the “Delay” button is pressed on the app screen, the smart device vibrates after 5 s, after which the participants were requested to check their smart watch first and then the smartphone to collect behavioral data from both devices at once. The sensor values from the accelerometer and gyroscope were collected at 20 ms intervals. The sensor values were collected for 2 s on the smart watch and 5 s on the smartphone. For each participant, two sets of the behavioral data were collected, with 10 iterations per set, for each smartphone location (table, hand, and pocket). The total number of the behavioral data points collected was 1320 for all participants. For collecting environmental data, we requested all participants to collect data at home three times a day for 20 days. The total number of the environmental data points collected was also 1320 for all participants.
4.2. Experimental Setting
Because the behavioral data of participants is registered for each location of the smartphone, three behavioral models are stored in the authentication server for each participant. To register the user’s behavior, we used the first three behavioral data collected for each location of the smartphone. To store the user environmental model, we used the first nine pieces of environmental information collected.
To perform the authentication experiment, we used the remaining data. To evaluate the security of the proposed scheme, we used all behavioral and environmental data for the 21 remaining people. We performed four experiments based on the set assumptions. The first experiment was performed using only behavioral data of participants who only have a smartphone. We performed the second experiment using both behavioral and environmental data of participants who only have a smartphone. The third experiment was performed by using only behavioral data of participants who have both a smartphone and smart watch. We performed the fourth experiment using both behavioral and environmental data of participants who have both a smartphone and smart watch.
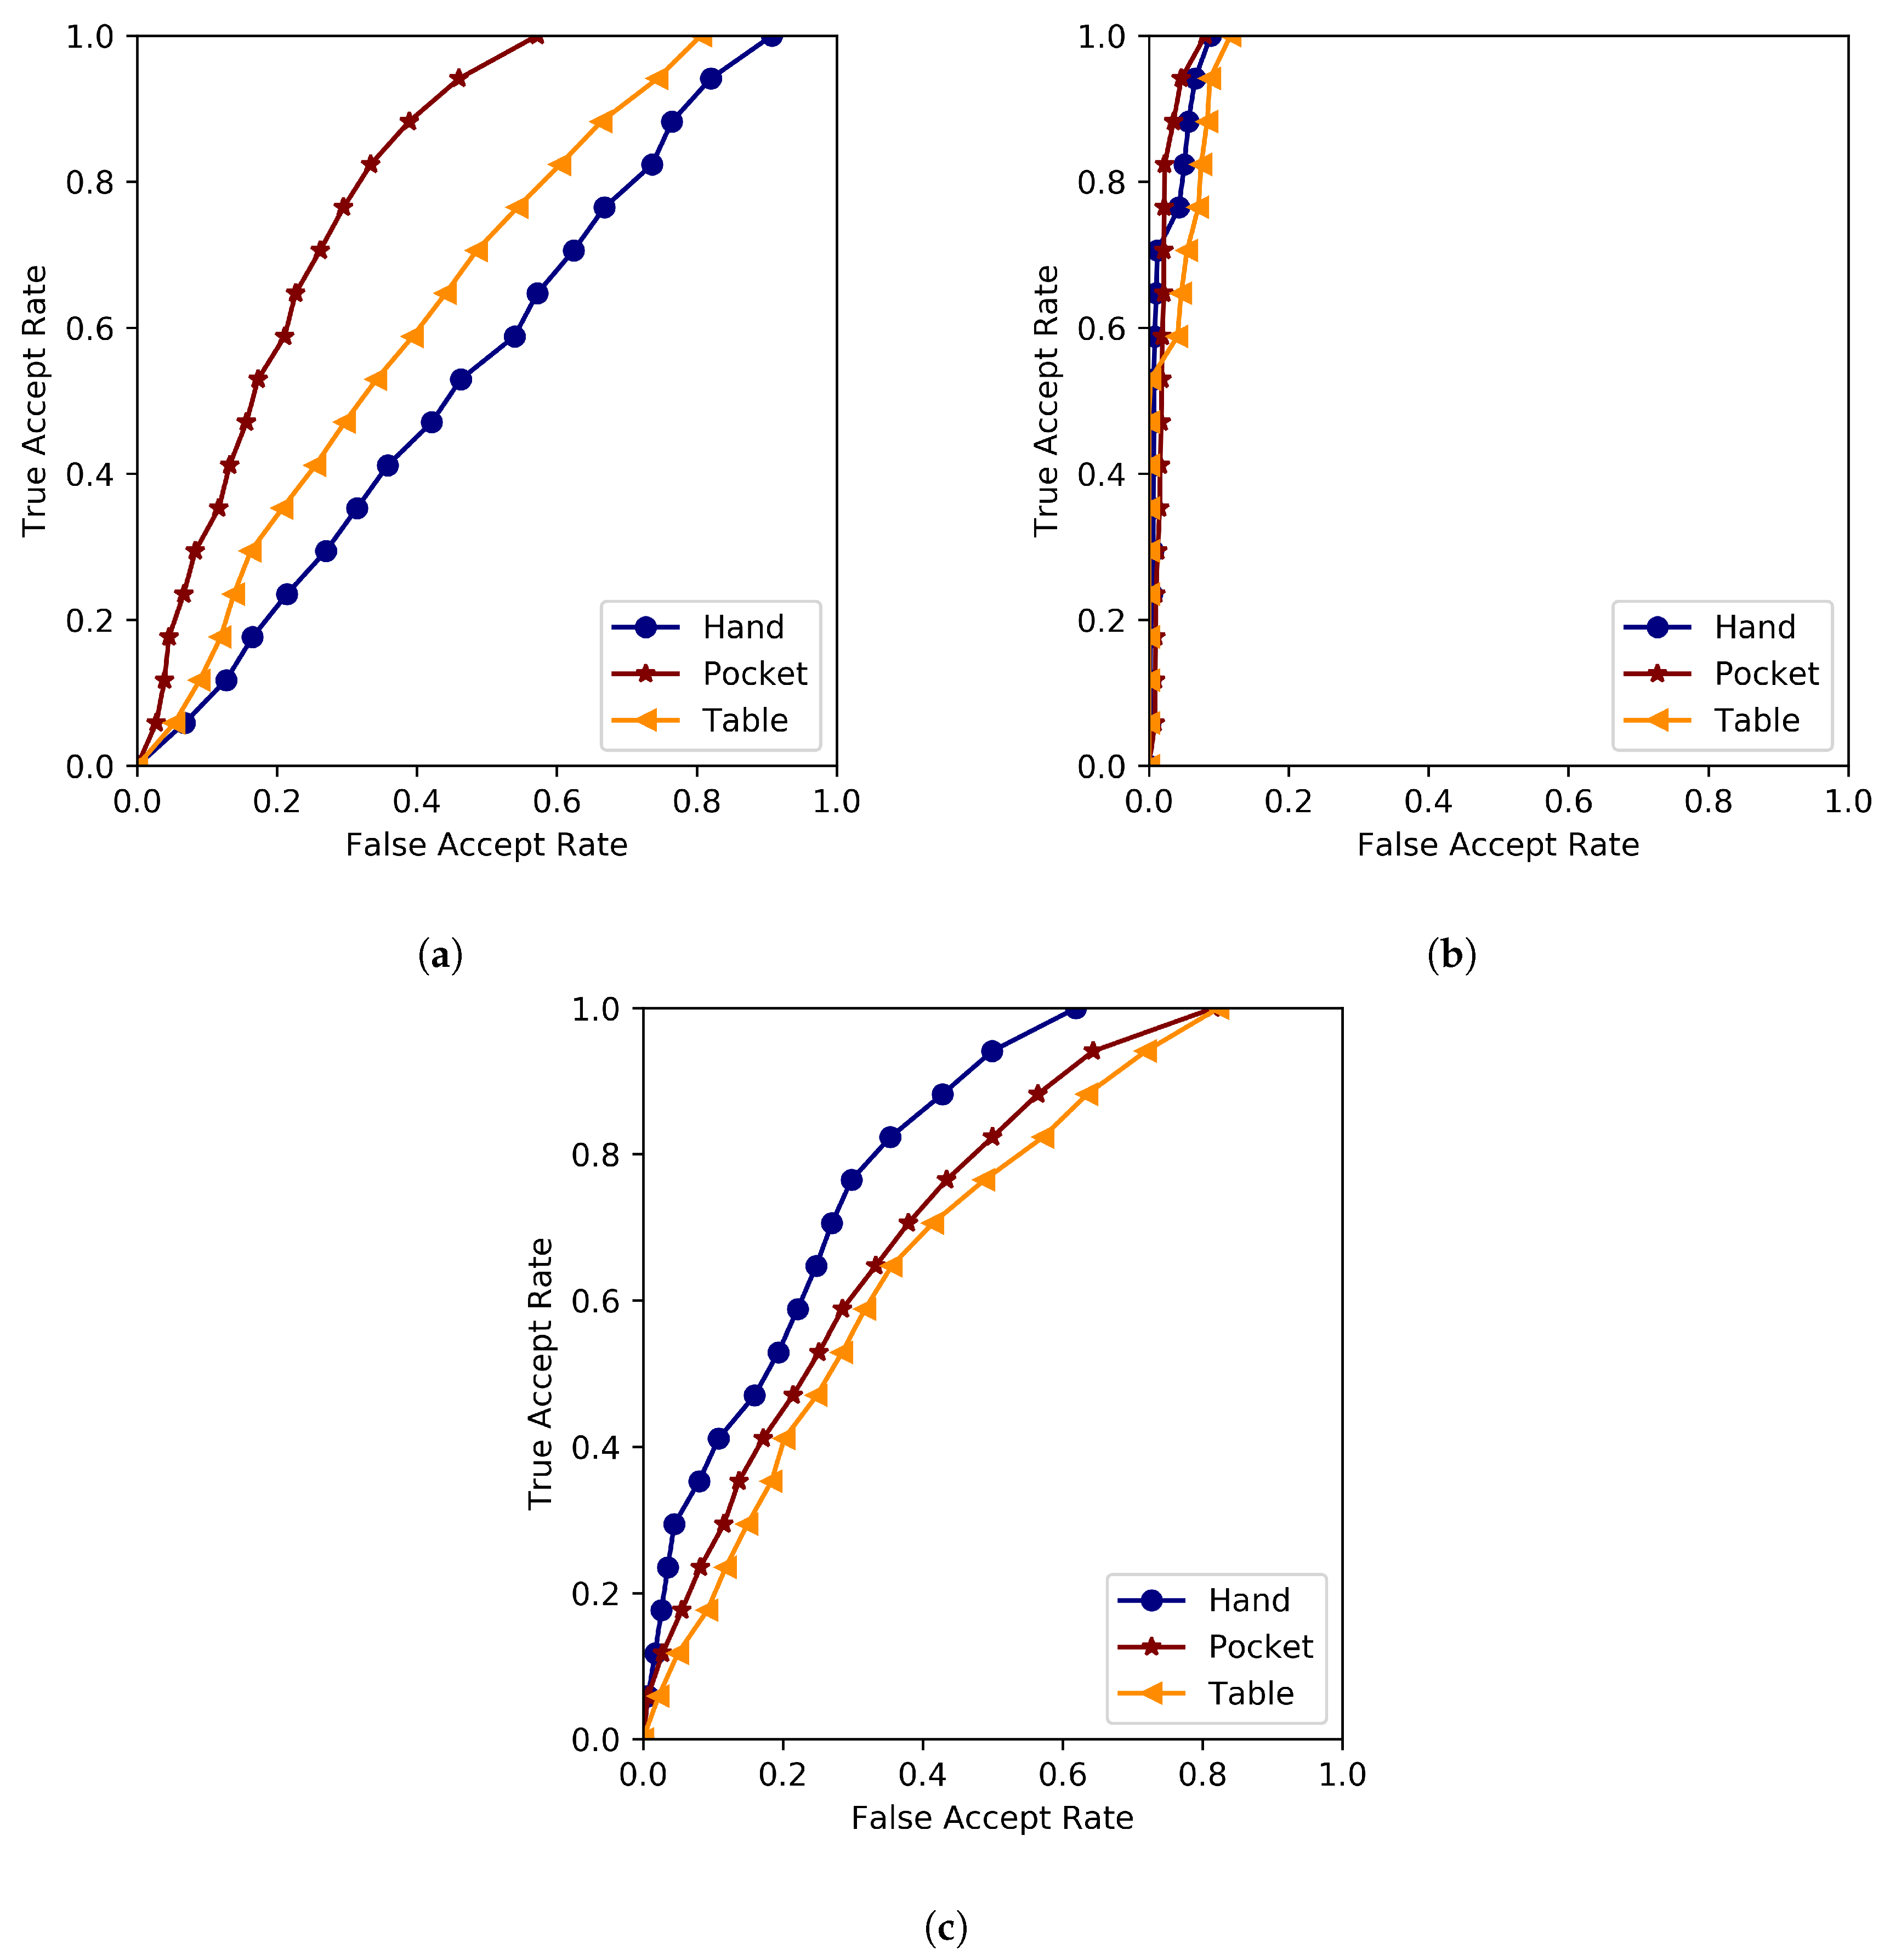
The metrics to verify the performance of the proposed scheme include FAR, which is the percentage of other participant’s data misclassified as legitimate user data, FRR, which is the percentage of legitimate user data misclassified as other people data, EER, which is the point at which FAR and FRR cross. In addition, we used receiver operating characteristic (ROC) curve and area under the ROC (AUROC) value to compare the performance by the location of the smartphone. If the ROC curve rises rapidly towards the upper-left-hand corner of the graph, it means that the FAR and FRR values are low; the closer the AUROC value is to 1.0, the better will be the performance.
4.3. Experimental Results
4.3.1. Experiments Using Only Behavioral Data Collected by a Smartphone
Experimental results showed an EER of 38.984% when the smartphone was on a table, EER of 46.66% when in the user’s hand, and EER of 25.33% when in the user’s pocket. The average EER for all locations of the smartphone was 36.99%. When the smartphone was in the user’s pocket, the EER was measured to be the lowest. Figure 6a shows the ROC curve for comparing performance based on the location of the smartphone in the experiments. The AUROC values were measured as 0.6503, 0.5542, and 0.8057 when the smartphone is on a table, in the user’s hand, and in the user’s pocket, respectively. The AUROC value was also measured to be the highest when the smartphone was in the user’s pocket.
4.3.2. Experiments Using Behavioral and Environmental Data Collected by a Smartphone
Experimental results showed an EER of 7.3% when the smartphone was on a table, EER of 6.24% when in the user’s hand, and EER of 5.26% when in the user’s pocket. The average EER for all locations of the smartphone was 6.27%. The EER was measured to be the lowest when the smartphone was in a user’s pocket. Figure 6b shows the ROC curve for each location of the smartphone when both behavioral and environmental data are used. The AUROC values were measured as 0.9695, 0.9802, and 0.9796 when the smartphone was on the table, in the user’s hand, and in the user’s pocket, respectively. Unlike EER, the AUROC value was measured to be highest when the smartphone was in the user’s hand. We can see that performance is better when environmental data is used along with behavioral data.
4.3.3. Experiments Using Only Behavioral Data Collected by a Smartphone and Smart Watch
We assumed that a user who wears a smart watch checks the SMS verification code on the smart watch itself because the code is sent to the smartphone and smart watch at the same time. Experimental results showed an EER of 36.16% when the smartphone was on a table, EER of 26.66% when in the user’s hand, and EER of 33.45% when in the user’s pocket. The average EER for all locations of the smartphone was 32.09%. The EER was measured to be the lowest when the user holds the smartphone in his/her hand. Figure 6c shows the ROC curve for this experiment. The AUROC values were measured as 0.6904, 0.8059, and 0.7289 when the smartphone was on the table, in the user’s hand, and in the user’s pocket, respectively. The AUROC value was also measured to be highest when the user holds a smartphone in his/her hand.
4.3.4. Experiment Using Behavioral and Environmental Data Collected by a Smartphone and Smart Watch
Experimental results showed all EERs of 0.0% when the smartphone was on a table, in the user’s hand, or user’s pocket. An EER of 0.0% means that the actual user can be completely distinguished from others. All AUROC values were also measured as 1.0.
4.4. Performance Comparison
The proposed scheme has higher EER when using both behavioral and environmental data collected by a smartphone than that in the study by Shrestha et al. that used a user’s hand gesture. However, the performance of the proposed scheme when using both behavioral and environmental data collected by both a smartphone and smart watch is better than that in the study by Shrestha et al. [6]. In the method proposed by Shrestha et al. [6], the users may feel inconvenienced because it requires specific user behavior. The proposed scheme shows better performance than that in the study by Andrea et al. [7] that used a behavioral pattern obtained when a user receives a phone call and the shape of the user’s ear. The study by Andrea et al. [7] is not suitable for SMS authentication because the behavioral pattern of a phone call is not applicable for SMS authentication. Table 3 summarizes the EER of the proposed scheme and other similar methods.
5. Discussion
In this paper, we proposed an authentication scheme that uses a behavioral pattern when a user checks a SMS verification code and surrounding environmental information of the user for detecting device theft. In this section, we discuss the usability, security, and limitations of the proposed scheme.
In terms of usability, the proposed scheme uses the most natural behavior of a user when checking an SMS verification code for SMS authentication. Therefore, the user is authenticated similar to the usual SMS authentication by inputting the received SMS verification code when the code is received on his/her smart device. Because the behavioral and surrounding environmental information of the user is automatically collected and transmitted in the background during SMS authentication, the user does not need to exhibit any specific behavior. Moreover, the user can select one of two registration methods. The first method is that an authentication server collects behavioral and environmental data when the user performs SMS authentication. The authentication server registers the user behavior model when three sets of behavioral data are collected for each location of the smartphone. The second method is that the authentication server sends an SMS verification code to the user three times for each location of the smartphone to register the user behavior model. The authentication server also generates a user environment model when nine or more sets of environmental data are collected.
In terms of security, an identity theft attack caused by device theft can result in the attacker performing SMS authentication using the user’s identity information. The attacker can obtain the user’s identity information on social networking services such as Facebook and Instagram. Therefore, in the case of applying the proposed scheme in SMS authentication, the attacker’s behavioral and environmental data will be collected during SMS authentication using the user’s smart device. If the attacker’s behavioral pattern is not the same as that of the user, the attacker will not be authenticated. Even if the attacker’s behavioral pattern is similar to that of the user, the attacker will be authenticated only when the user is at a place where they have stayed for a long time.
In terms of limitations, the average EER was measured to be higher than 30% when users were authenticated using only behavioral data. It means that the possibility that the user will fail authentication is approximately 30% if the user tries to authenticate at places other than where he/she stays for a long time. Therefore, it is necessary to improve the performance when using only behavioral data so that a user can be authenticated well at other places. In addition, we could see that the performance was significantly improved when environmental data was used along with behavioral data. This was because the places at which the participants stay for a long time are different. Therefore, it is necessary to collect environmental information to detect attackers that stay in similar places as the user.
6. Conclusions
In this study, we proposed an authentication scheme that uses typical behavioral data of a user checking an SMS verification code, and surrounding environmental information of the user at that time. The performance of our scheme was better when environmental data were used along with behavioral data rather than using behavioral data alone. Experiments with data collected using only a smartphone showed the lowest EER when the smartphone was in the user’s pocket; all EER measured was 0.0% when using data collected from both smartphones and smart watches. If the proposed scheme is applied for SMS authentication, it is expected that it will be more secure.
Author Contributions
All authors contributed to the design and development of the proposed scheme and the conceptualization of this research. G.R. performed data collection, conducted experiments, and wrote the manuscript. S.-H.K. conducted literature surveys and helped data analysis. D.C. was in charge of overall program administration and helped revise the manuscript.
Funding
This work was supported by Institute for Information and Communications Technology Promotion (IITP) grant funded by the Korea government (MSIT) (No. 2016-0-00173, Security Technologies for Financial Fraud Prevention on Fintech and No. 2017-0-00380, Development of Next Generation User Authentication).
Conflicts of Interest
The authors declare no conflict of interest.
References
- Schrittwieser, S.; Frühwirt, P.; Kieseberg, P.; Leithner, M.; Mulazzani, M.; Huber, M.; Weippl, E.R. Guess who’s texting you evaluating the security of smartphone messaging applications. In Proceedings of the Network and Distributed System Security Symposium, San Diego, CA, USA, 5–8 February 2012. [Google Scholar]
- Toorani, M.; Beheshti, A. SSMS—A Secure SMS Messaging Protocol for the M-Payment Systems. In Proceedings of the 2008 IEEE Symposium on Computers and Communications, Marrakech, Morocco, 6–9 July 2008. [Google Scholar]
- National Institute of Standards and Technology. Available online: https://pages.nist.gov/800-63-3/sp800-63b.html/ (accessed on 21 December 2018).
- Aviv, A.J.; Gibson, K.; Mossop, E.; Blaze, M.; Smith, J.M. Smudge attacks on smartphone touch screens. In Proceedings of the Fourth Usenix Workshop on Offensive Technologies, Washington, DC, USA, 9 August 2010; pp. 1–7. [Google Scholar]
- Lee, H.; Kwon, T. Fingerprint Smudge Attacks Based on Fingerprint Image Reconstruction on Smart Devices. J. Korea Inst. Inf. Secur. Cryptol. 2017, 27, 233–240. [Google Scholar] [CrossRef] [Green Version]
- Shrestha, B.; Saxena, N.; Harrison, J. Wave-to-access: Protecting sensitive mobile device services via a hand waving gesture. In Proceedings of the International Conference on Cryptology and Network Security, Paraty, Brazil, 20–22 November 2013; pp. 199–217. [Google Scholar]
- Andrea, A.F.; Nappi, M.; Ricciardi, S. I-Am: Implicitly Authenticate Me Person Authentication on Mobile Devices Through Ear Shape and Arm Gesture. IEEE Trans. Syst. Man Cybern. Syst. 2017, 99, 1–13. [Google Scholar] [CrossRef]
- Yang, L.; Guo, Y.; Ding, X.; Han, J.; Liu, Y.; Wang, C.; Hu, C. Unlocking smart phone through handwaving biometrics. IEEE Trans. Mob. Comput. 2015, 14, 1044–1055. [Google Scholar] [CrossRef]
- Trojahn, M.; Ortmeier, F. Toward mobile Authentication with keystroke dynamics on mobile phones and tablets. In Proceedings of the 2013 27th International Conference on Advanced Information Networking and Applications Workshops, Barcelona, Spain, 25–28 March 2013. [Google Scholar]
- Kambourakis, G.; Damopoulos, D.; Papamartzivanos, D.; Pavlidakis, E. Introducing touchstroke: Keystroke-based authentication system for smartphones. Secur. Commun. Netw. 2014, 9, 542–554. [Google Scholar] [CrossRef]
- Zheng, N.; Bai, K.; Huang, H.; Wang, H. You are how you touch: User verification on smartphones via tapping behaviors. In Proceedings of the The 22nd IEEE International Conference on Network Protocols, The Research Triangle, NC, USA, 21–24 October 2014; pp. 221–232. [Google Scholar]
- Saravanan, P.; Clarke, S.; Chau, D.H.P.; Zha, H. Latentgesture: Active user authentication through background touch analysis. In Proceedings of the Second International Symposium of Chinese CHI, Toronto, ON, Canada, 26–27 April 2014; pp. 110–113. [Google Scholar]
- Bo, C.; Zhang, L.; Li, X.Y.; Huang, Q.; Wang, Y. Silentsense: Silent user identification via touch and movement behavioral biometrics. In Proceedings of the Nineteenth Annual International Conference on Mobile Computing & Networking, Miami, FL, USA, 30 September–4 October 2013; pp. 187–190. [Google Scholar]
- Shen, C.; Zhang, Y.; Guan, X.H.; Maxion, R. Performance analysis of touch-interaction behavior for active smartphone authentication. IEEE Trans. Inf. Forensics Secur. 2016, 11, 498–513. [Google Scholar] [CrossRef]
- Nam, S.; Park, H.; Seo, C.; Choi, D. Forged Signature Distinction Using Convolutional Neural Network for Feature Extraction. Appl. Sci. 2018, 8, 153. [Google Scholar] [CrossRef]
- Sun, J.; Zhang, R.; Zhang, J.; Zhang, Y. Touchin: Sightless two-factor authentication on multi-touch mobile devices. In Proceedings of the IEEE Conference on Communications and Network Security, San Francisco, CA, USA, 29–31 October 2014; pp. 436–444. [Google Scholar]
- Mare, S.; Markham, A.M.; Cornelius, C.; Peterson, R.; Kotz, D. Zebra: Zero-effort bilateral recurring authentication. In Proceedings of the 2014 IEEE Symposium on Security and Privacy, San Jose, CA, USA, 18–21 May 2014; pp. 705–720. [Google Scholar]
- Lee, W.H.; Lee, R. Implicit sensor-based authentication of smartphone users with smartwatch. In Proceedings of the Hardware and Architectural Support for Security and Privacy, Seoul, Korea, 18–18 June 2016. [Google Scholar]
- Taigman, Y.; Yang, M.; Ranzato, M.A.; Wolf, L. Deepface: Closing the gap to human-level performance in face verification. In Proceedings of the IEEE Conference on Computer Vision and Pattern Recognition, Columbus, OH, USA, 24–27 June 2014; pp. 1701–1708. [Google Scholar]
- Sun, Y.; Chen, Y.; Wang, X.; Tang, X. Deep learning face representation by joint identification-verification. In Proceedings of the NIPS, Montreal, QC, Canada, 8–13 December 2014; pp. 1988–1996. [Google Scholar]
- Sun, Y.; Liang, D.; Wang, X.; Tang, X. Deepid3: Face recognition with very deep neural networks. arXiv, 2015; arXiv:1502.00873. [Google Scholar]
- Schroff, F.; Kalenichenko, D.; Philbin, J. Facenet: A unified embedding for face recognition and clustering. In Proceedings of the IEEE Conference on Computer Vision and Pattern Recognition, Boston, MA, USA, 8–10 June 2015; pp. 815–823. [Google Scholar]
- Parkhi, O.M.; Vedaldi, A.; Zisserman, A. Deep face recognition. In Proceedings of the 26th British Machine Vision Conference, Swansea, UK, 7–10 September 2015. [Google Scholar]
- Liu, W.; Wen, Y.; Yu, Z.; Li, M.; Raj, B.; Song, L. Sphereface: Deep hypersphere embedding for face recognition. In Proceedings of the IEEE Conference on Computer Vision and Pattern Recognition, Honolulu, HI, USA, 22–25 July 2017; pp. 212–220. [Google Scholar]
- Palshikar, G. Simple algorithms for peak detection in time-series. In Proceedings of the IIMA 1st International Conference on Advanced Data Analysis, Business, Analytics and Intelligence, Ahmedabad, India, 6–7 June 2009. [Google Scholar]
- Hinton, G.E.; Salakhutdinov, R.R. Reducing the dimensionality of data with neural networks. Science 2006, 313, 504–507. [Google Scholar] [CrossRef]
- Ryu, G.; Seo, C.; Choi, D. Location authentication based on wireless access point information to prevent wormhole attack in Samsung pay. Adv. Electr. Comput. Eng. 2017, 17, 71–77. [Google Scholar] [CrossRef]
- Berndt, D.J.; Clifford, J. Using dynamic time warping to find patterns in time series. In Proceedings of the KDD Workshop, Seattle, WA, USA, 31 July–1 August 1994; pp. 359–370. [Google Scholar]
Figure 1.
Architecture of the proposed authentication scheme to detect device theft in SMS authentication.
Figure 1.
Architecture of the proposed authentication scheme to detect device theft in SMS authentication.

Figure 2.
Example of user behavior when a smartphone is on a table.

Figure 3.
Examples before and after scaling the accelerometer data collected from smartphones.

Figure 4.
Before and after detecting behavioral starting point.

Figure 5.
Example of scaling sensor values after calculating the mean of three behavioral data points.
Figure 5.
Example of scaling sensor values after calculating the mean of three behavioral data points.

Figure 6.
(a) ROC curve when using behavioral data collected from only a smartphone; (b) ROC curve when using behavior and environmental data collected from only a smartphone; (c) ROC curve when using behavioral data collected from both a smartphone and smart watch.
Figure 6.
(a) ROC curve when using behavioral data collected from only a smartphone; (b) ROC curve when using behavior and environmental data collected from only a smartphone; (c) ROC curve when using behavioral data collected from both a smartphone and smart watch.


Table 1.
Collected behavioral data.
| Devices | Sensors | Axes |
|---|---|---|
| Smartphone | Accelerometer | x, y, z |
| Gyroscope | ||
| Smart Watch | Accelerometer | |
| Gyroscope |
Table 2.
Collected environmental data.
| Devices | Modalities | Contents |
|---|---|---|
| Smartphone | Fingerprint | Brand |
| Manufacturer | ||
| Model etc. | ||
| Wireless AP | BSSID | |
| RSSI | ||
| Bluetooth | MAC | |
| RSSI | ||
| GPS | Latitude | |
| Longitude | ||
| Smart Watch | Bluetooth | MAC |
| RSSI |
© 2019 by the authors. Licensee MDPI, Basel, Switzerland. This article is an open access article distributed under the terms and conditions of the Creative Commons Attribution (CC BY) license (http://creativecommons.org/licenses/by/4.0/).
Share and Cite
MDPI and ACS Style
Ryu, G.; Kim, S.-H.; Choi, D. Implicit Secondary Authentication for Sustainable SMS Authentication. Sustainability 2019, 11, 279. https://doi.org/10.3390/su11010279
AMA Style
Ryu G, Kim S-H, Choi D. Implicit Secondary Authentication for Sustainable SMS Authentication. Sustainability. 2019; 11(1):279. https://doi.org/10.3390/su11010279
Chicago/Turabian StyleRyu, Gwonsang, Seung-Hyun Kim, and Daeseon Choi. 2019. "Implicit Secondary Authentication for Sustainable SMS Authentication" Sustainability 11, no. 1: 279. https://doi.org/10.3390/su11010279
Note that from the first issue of 2016, this journal uses article numbers instead of page numbers. See further details here.