The Influence of Insulation Styles on the Building Energy Consumption and Indoor Thermal Comfort of Multi-Family Residences

1
School of Human Settlements and Civil Engineering, Xi’an Jiaotong University, Xi’an 710000, China
2
School of Architecture and Civil Engineering, Chengdu University, Chengdu 610106, China
3
Department of Architecture, the University of Kitakyushu, Kitakyushu 808-0135, Japan
*
Authors to whom correspondence should be addressed.
Sustainability 2019, 11(1), 266; https://doi.org/10.3390/su11010266
Submission received: 24 November 2018
/
Revised: 15 December 2018
/
Accepted: 31 December 2018
/
Published: 7 January 2019
Abstract
:The properties of building envelopes significantly affect indoor building energy consumption, indoor thermal comfort, and building durability. In the current standards for Japanese residential energy efficiency, insulation placement is not well regulated. Meanwhile, it is common in Japan to use air-conditioning intermittently, rather than having the units operate continuously. Therefore, considering specific Japanese lifestyles, we investigated insulation performance. In this research, we: (1) developed the interior insulation to include insulation on walls, ceilings and floors of building units (all of the interior surfaces) to achieve building energy savings by avoiding heat loss through thermal bridges; (2) discussed and demonstrated the effects of high heat capacitance for each of the building components and the thermal bridge by conducting building environmental simulations; (3) conducted simulations in seven cities in Japan and discussed the applicability of these different weather conditions; and (4) compared temperature distributions to investigate differences in indoor comfort with partial heating on winter nights. We demonstrated the energy saving and thermal comfort advantages of interior insulation. This research provides an innovative insulation style based on Japanese lifestyles that contributes to new energy-saving standards and formulations.
1. Introduction
In 1999, the Japanese Institute for Building Environment and Energy Conservation established the residential energy efficiency standard to specify the performance of building envelopes and overall thermal loss. The construction of insulation material was not investigated or regulated, however. After that, the “Act of the Rational Use of Energy” (May 2008) and the “Energy-Saving Standards for Houses and Buildings” (January 2009) were enacted [1]. These acts, however, were not proposed for improving energy saving levels at residential units. Therefore, it is necessary to clarify the properties of various insulation styles in apartment units and the mechanism of effects from insulation on thermal comfort and energy use [2]. Meanwhile, it shows that building envelopes with high insulation properties should be introduced to the building exterior walls, floor slabs and the other components of the building envelope [3]. This guideline does not indicate details about the differences between insulation styles with an environmental variation and does not mention the effects of thermal bridges. The indoor thermal environment should be coordinated, which is determined by thermal comfort [4].
Previous studies have demonstrated the influence of building envelope thermal mass. High thermal capacitance could maximize time lag and decrement factor values and temperature variations [5]. The effects of thermal mass are also reflected in indoor energy consumption. It has been found that increasing the thickness of the concrete external walls could lead to an increase in the cooling load [6]. The detailed insulation performance with various insulation types and thickness has been investigated [7]. Methods of using exterior wall-heating characteristics to decrease indoor energy consumption have also been developed and demonstrated [8].
By implementing an insulation layer at the inside or outside of external walls, it could be possible to control the effects from building envelope thermal mass. In research conducted in Hong Kong, it was found that an increase in thermal capacitance was beneficial to a reduction in peak cooling load. Moving the insulation from the inside to the outside of the external walls could lead to 1.8% reduction in peak cooling load. Annual cooling energy consumption, however, does not behave like the peak cooling load with respect to increases in effective thermal capacitance. Maximum savings were achieved when thermal capacitance was minimized by placing the insulation on the inner surface of the external wall [9]. The best thermal performance and lowest energy consumption were obtained when insulation was placed in both the outdoor surface and indoor surface of the external walls [10] or even in the middle of the walls [11]. An optimum insulation style could improve indoor thermal comfort and reduce building energy consumption. Many studies have discussed the thickness and the placement of insulation materials, but few of these studies have considered insulation implementation as a building insulation system.
Conversely, the presence of isolated thermal bridges in building envelopes, such as balconies and penetrating insulation layers, influence the energy consumption and thermal comfort of the residents [12]. The total impact of thermal bridges on the heating energy need can be as high as 30%. In Northern and Central Europe, all countries have national regulations that consider the influence of thermal bridges for new buildings. In Southern Europe, 75% of countries have these regulations [13]. Introducing a balcony thermal break either above or below balcony components in a high-rise building in Toronto could improve the overall U-value by 9–18%. The space heating energy consumption could be reduced by 5–13% and space-cooling energy consumption could be improved by less than 1% [14]. In Japan, mitigation methods for building thermal bridges were introduced in the residential energy-saving guidelines [1], but the effects from isolated thermal bridges have not been avoided completely. Meanwhile, the ratio of apartment to house energy used in a business-as-usual (BAU) scenario will reach 50.0% in 2025, which accounts for a significant portion of the energy consumption of Japanese dwellings [15]. The thermal bridges in apartment buildings is an important topic for building energy savings; however, the feasibility of insulation methods in various climate zones has been discussed separately [16]. The climate varieties should be considered when evaluating the method.
This research aimed to improve the indoor thermal environment and energy consumption by comparing insulation styles: external walls outside insulation; external walls inside insulation; and an innovative insulation style, interior insulation, focusing on mitigating the negative effects of the building envelope thermal mass and thermal bridges. We compared the three insulation styles using an indoor thermal environmental simulation. We used thermal load calculation software (THERB) to simulate room air temperature, interior wall surface temperature, and the unit operative temperature while adjusting conditions such as climate characteristics for various locations (e.g., Naha, Miyazaki, Tokyo, Toyama, Sendai, Hachinohe and Sapporo). This research contributes to the optimization of sustainable building standards in Japan, and also provides suggestions for other countries.
2. Materials and Methods
2.1. Environmental Simulation Method
To evaluate the indoor environmental performance, we introduced the THERB software for simulation. THERB is an environmental simulation program that can simulate sensible temperature, humidity, temperature, and air-conditioning (AC) energy use for housing units [17,18]. The features of THERB follow.
- Successive transition methods and a trapezoid hold function can adjust to a time-discrete domain.
- Dimensionless equations calculate convective heat transfer coefficients for every part of the unit under study.
- Longwave and shortwave absorption coefficients are considered to simulate the net absorption of radiant heat and transmitted solar radiation.
- A multilayer window model defines the overall transmittance, absorptance, and reflectance of solar radiation (not including window curtains.)
- A network airflow model calculates ventilation quantities.
2.2. Investigated Model
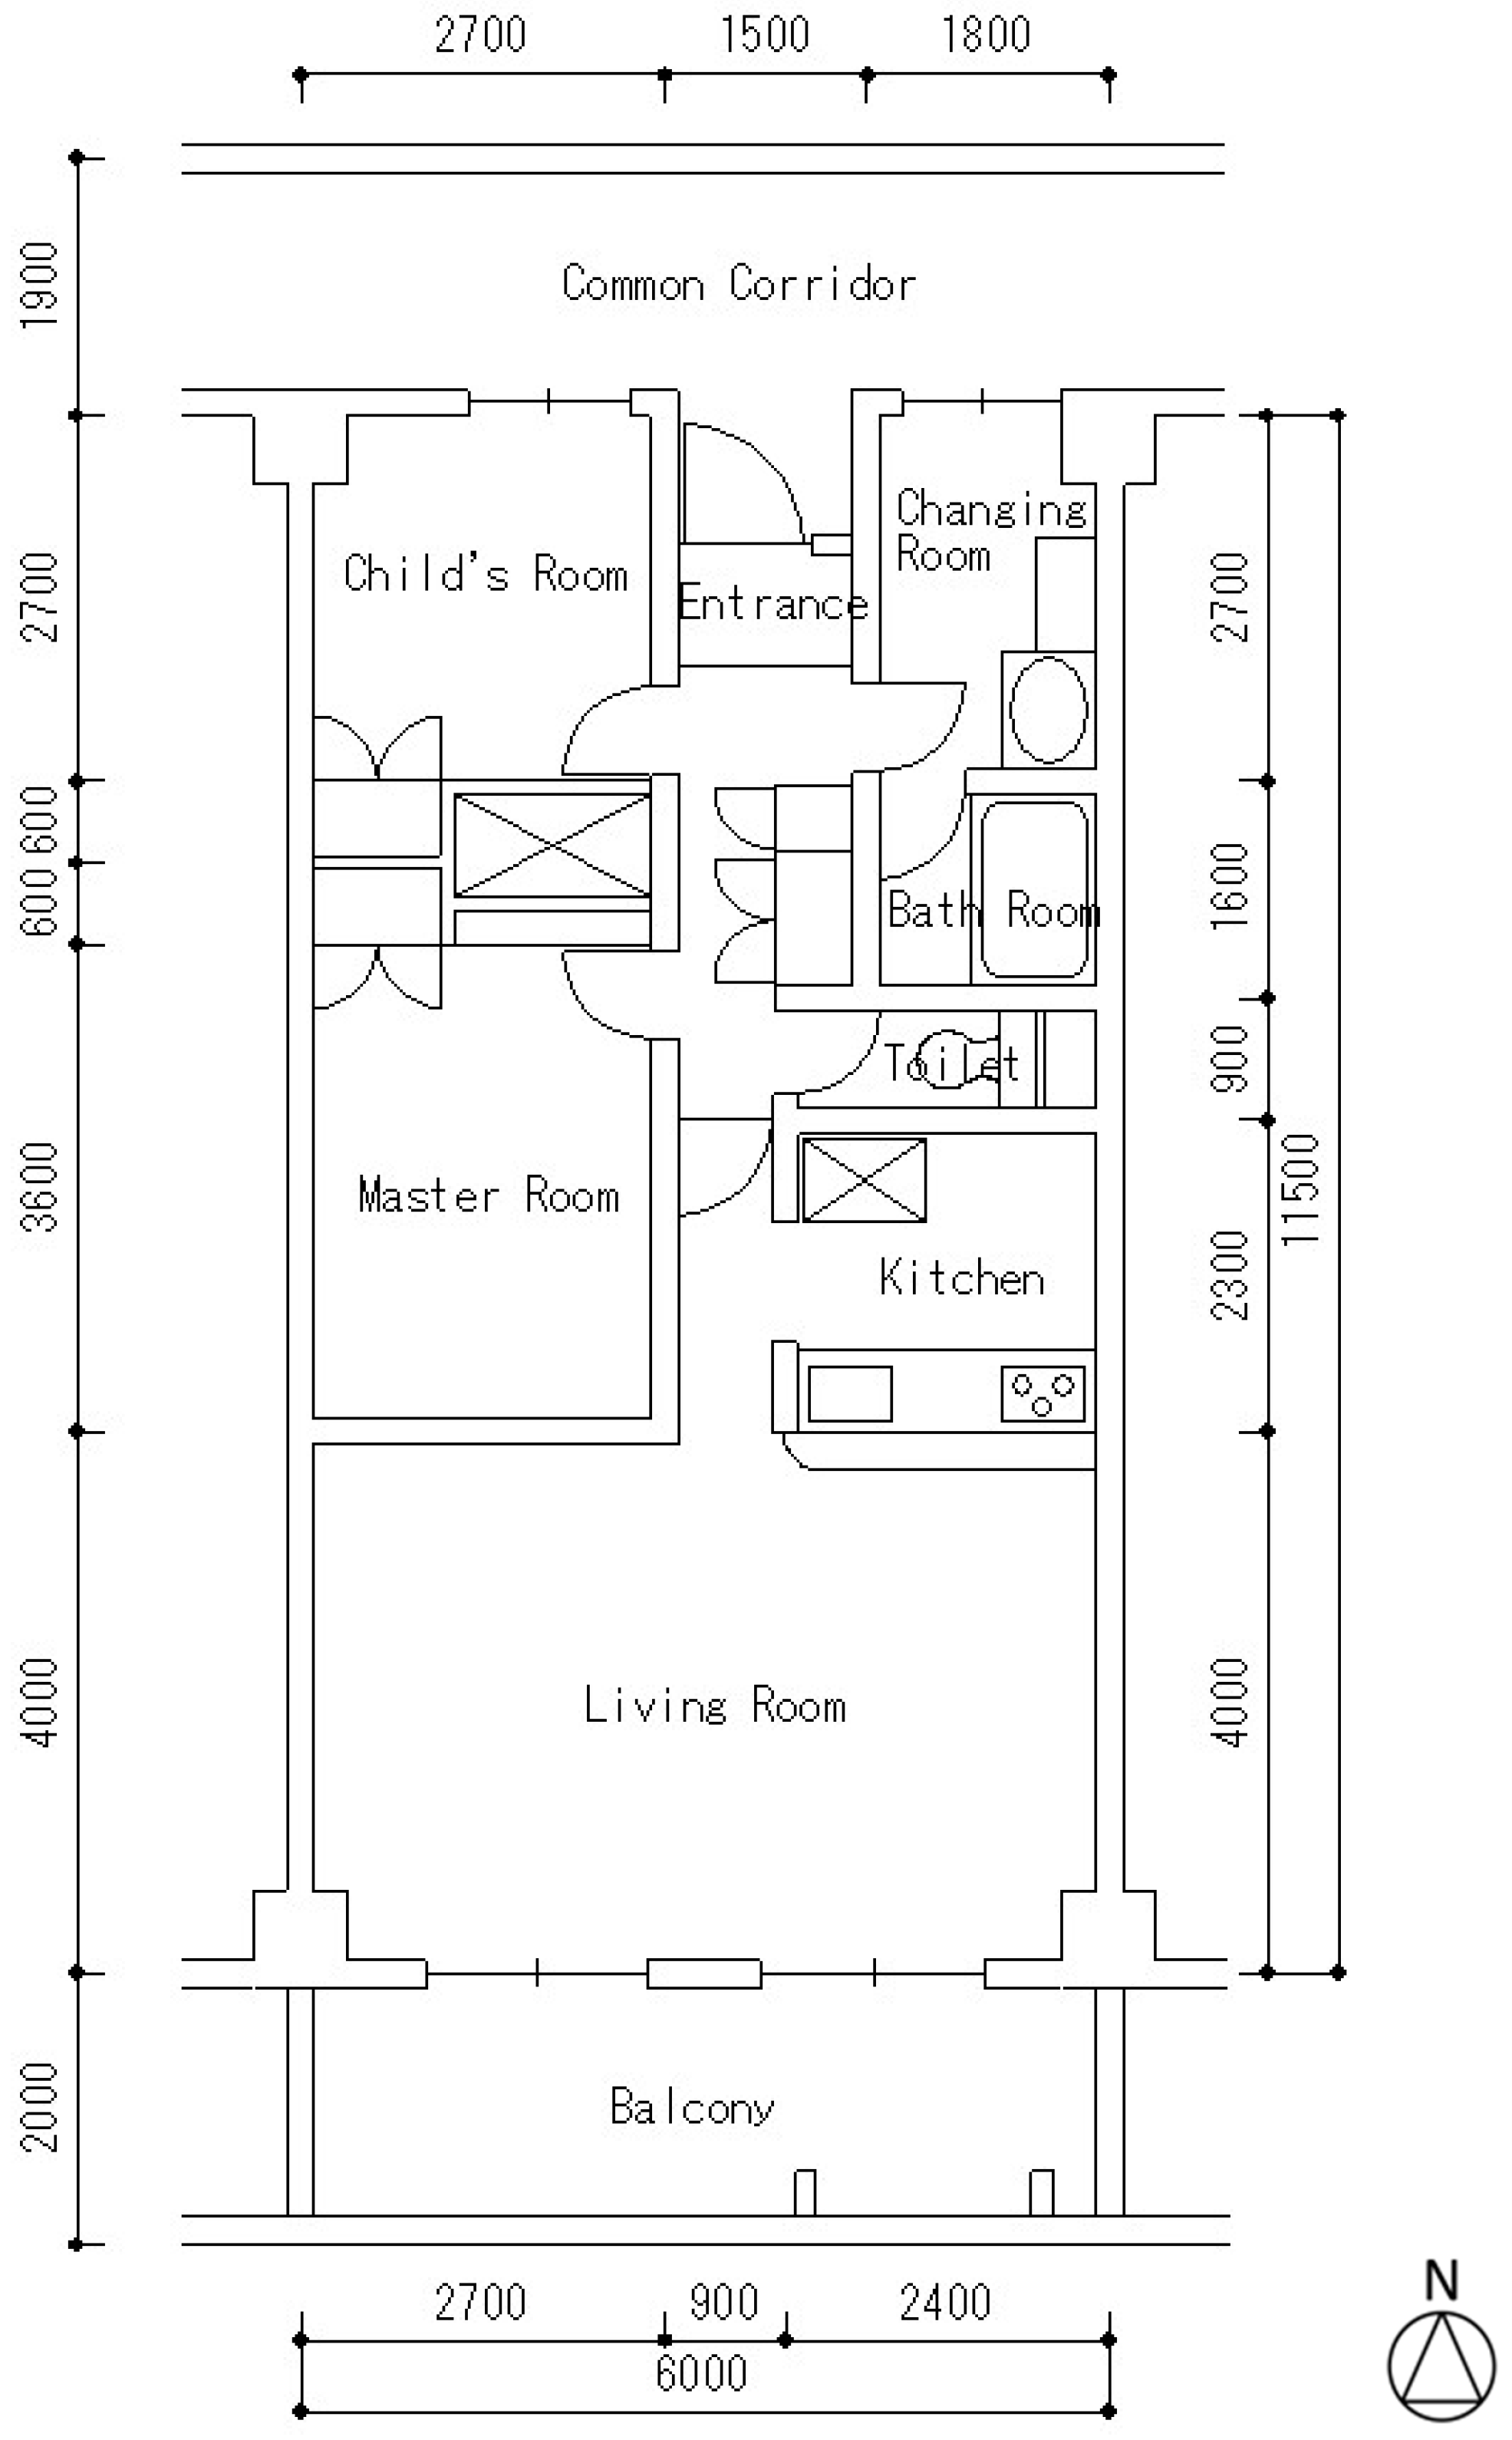
The apartment unit model for this simulation was a common dwelling in a residential complex in Tokyo, Japan. The model was presented in the Journal of Architectural Knowledge (2004) and represents a realistic layout of Japanese apartment housing. We selected a middle-floor unit located at the center of the floor for the simulation. The floor plan is shown in Figure 1, and the details of three insulation types are shown in Figure 2.
2.3. Wall Insulation Styles
Interior insulation on an exterior wall was the common insulation style in Japan during the 1980s. In most inside insulation, however, dewing occurred on the inside of the wall. This dewing occurred due to the low-quality construction of that time. Subsequently, outside insulation has become more common in Japan, but the performance of outside insulation relative to indoor thermal comfort and annual energy consumption in comparison with inside insulation styles is still debatable. Therefore, based on existing insulation styles, we proposed the promotion of interior insulation. In this research, we compared this insulation with the other two insulation styles.
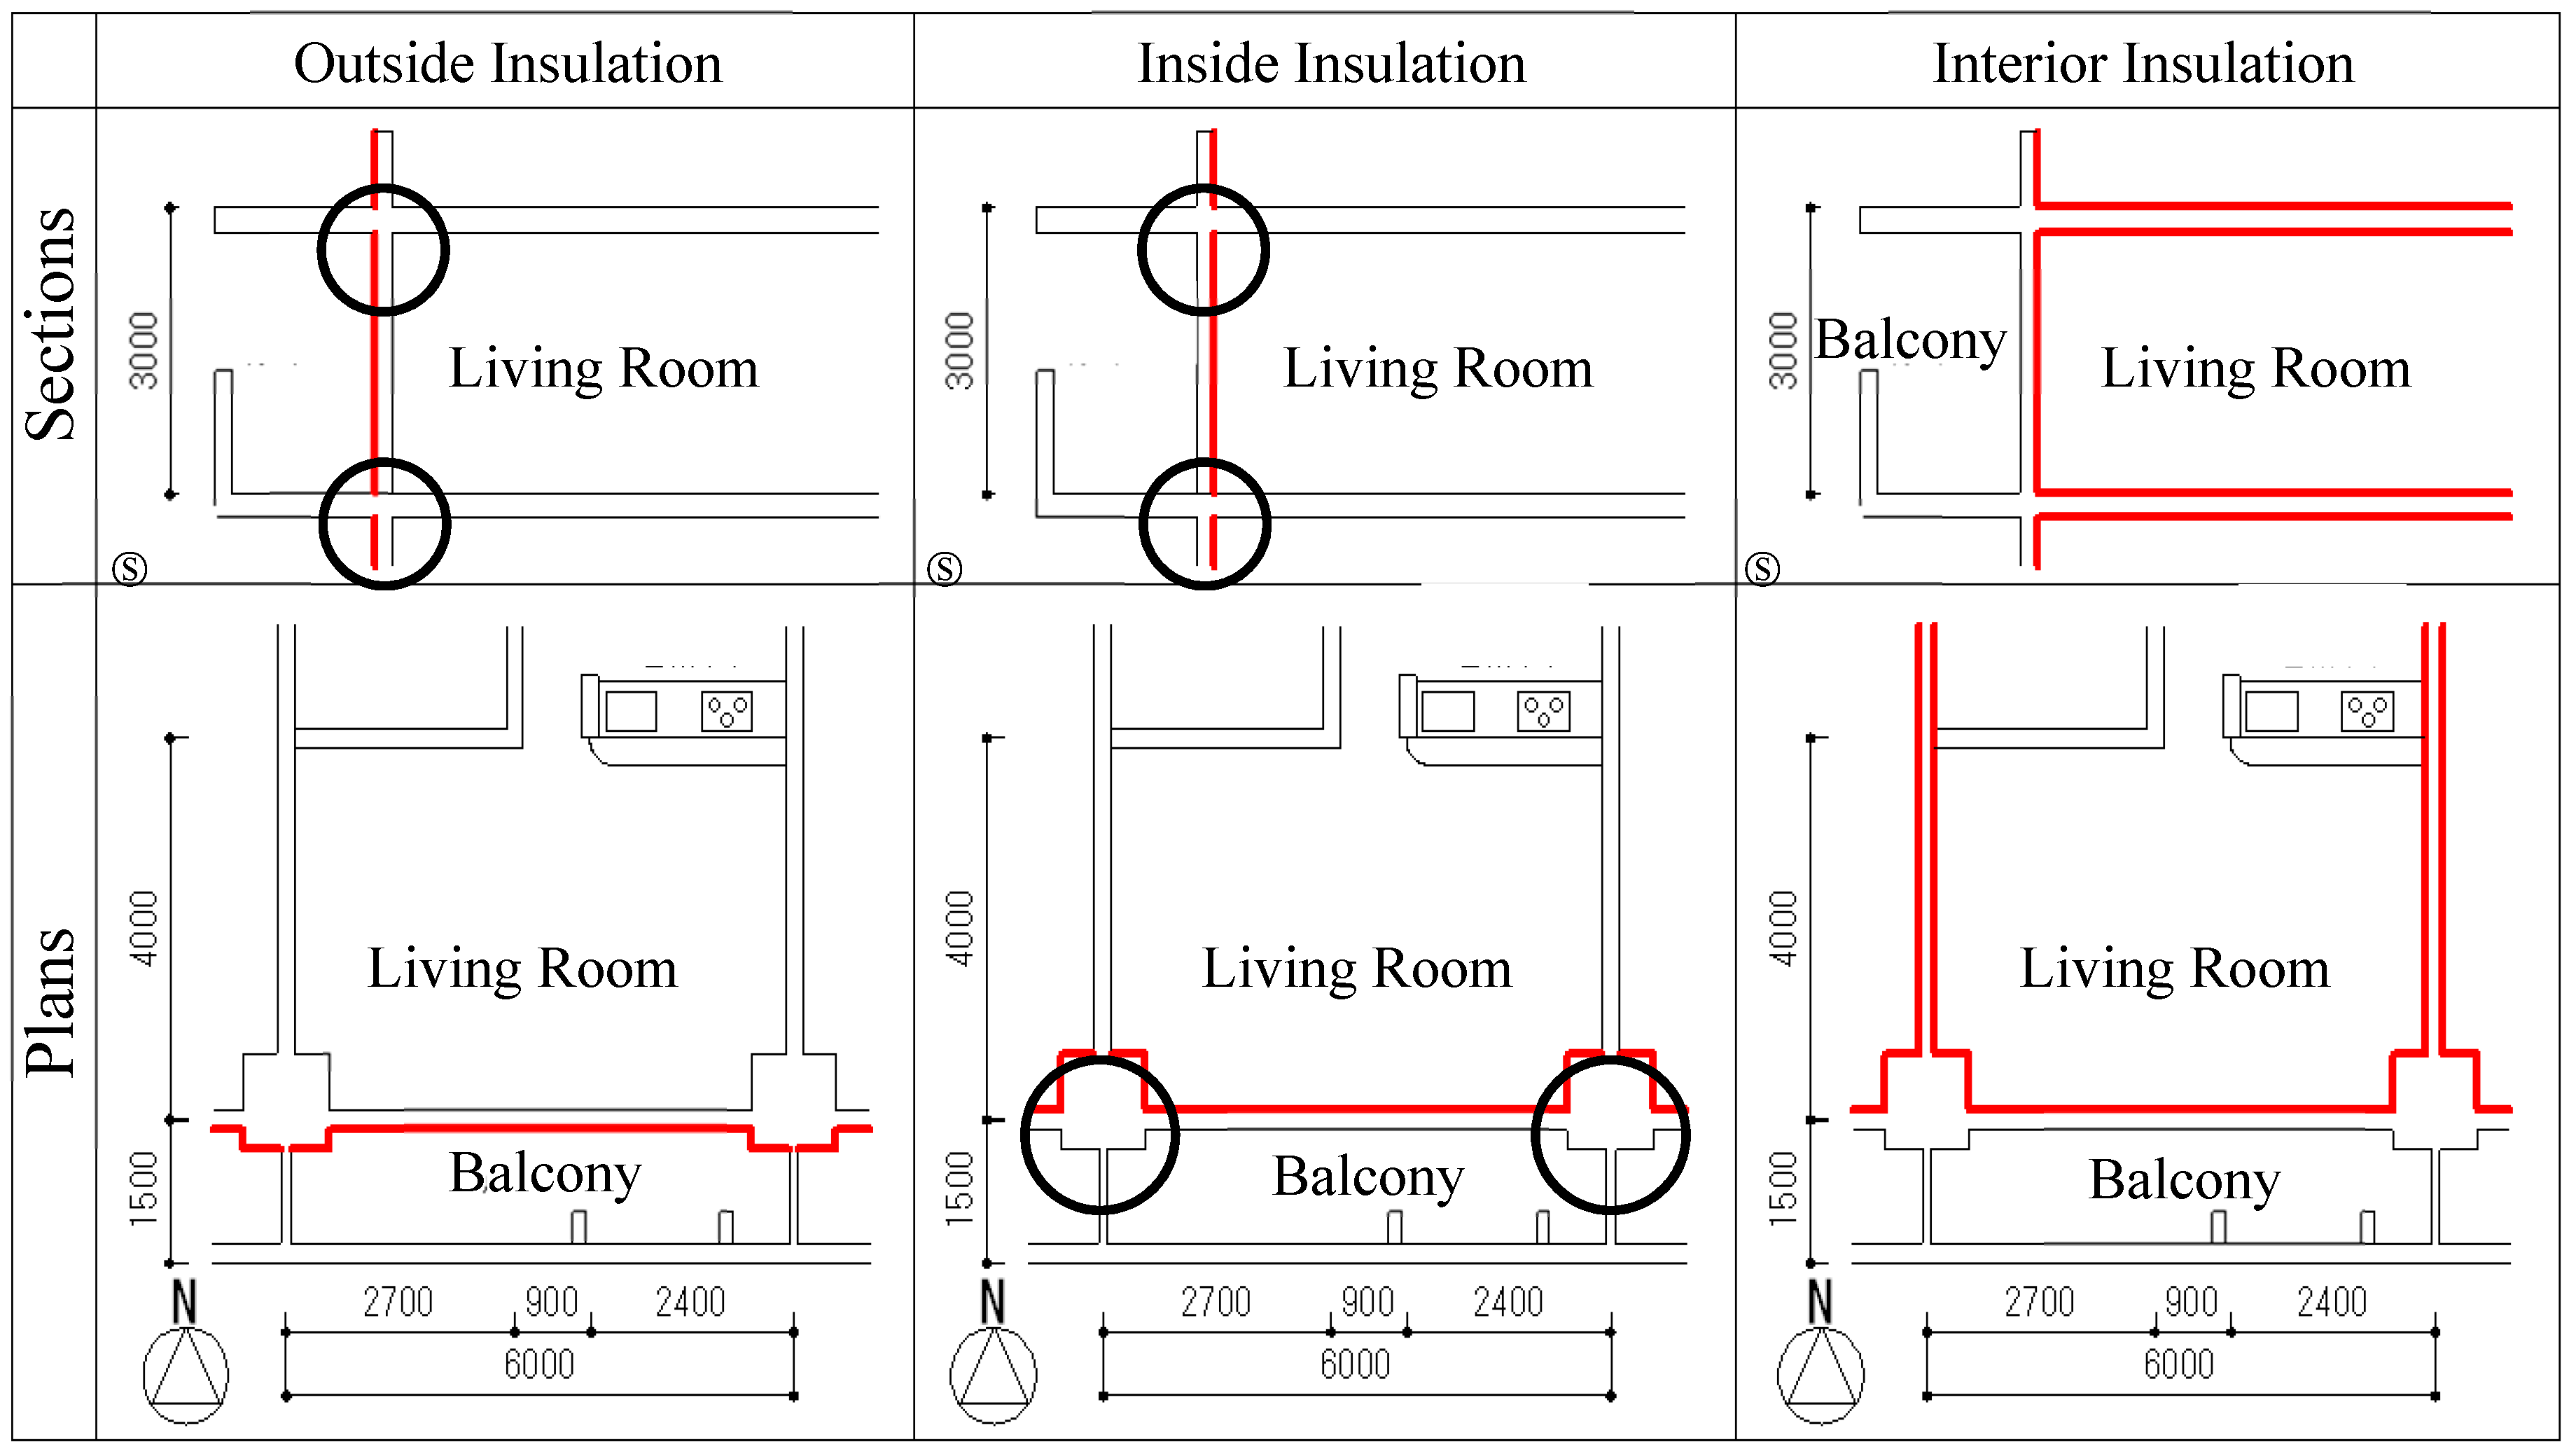
This style of interior insulation insulates the surfaces exposed to outdoor air and also insulates the whole inside of the building, including confining walls, flooring, and ceiling. Following the Next-Generation Energy-Saving Standards, we determined the thickness of the insulation according to materials and locations. We used three types of Class A Extruded Polystyrene Foam as the insulation materials in this research. The location and details of the insulation materials are shown in Figure 2 and Table 1.
3. Heat Loss Evaluation
In Japan, current standards only indicate the environmental property of insulation on floors and exterior walls. Related regulations, however, do not mention the interior walls and ceiling. Despite this, the high capacity of building components and thermal bridges affect the energy consumption and indoor thermal comfort. Therefore, we calculated the thermal transmittance and thermal resistance of the units, and the results are shown in Table 2. We also calculated and compared the total heat loss caused by thermal transmittance and the results are shown in Table 1.
As the results show in Table 1 and Table 2, the thermal transmittance through the thermal bridge is more than seven times that through the exterior walls. According to the thermal bridge locations identified in Figure 2, these thermal bridges can be found in the connections between the interior walls and pillars and between exterior walls and the floor. With interior insulation, no thermal bridge occurred because of the consecutive insulation on all interior surfaces. Compared with the amount of heat loss through the unit envelope of the three units, the inside insulation unit was slightly higher than the outside insulation unit. In the outside insulation unit, there is no thermal bridge between the interior walls and the pillars. Due to the optimization achieved in regard to this thermal bridge, the heat loss in the interior insulation unit was around 40% lower than the loss in the existing outside and inside insulation units. Heat loss through the exterior walls changed slightly with insulation thickness, which is shown in Table 3. In addition, the building envelope’s thermal properties of the whole unit and the complete insulation combination for each of the building components are important.
4. AC Energy Use in Different Climate Zones
4.1. Simulation Conditions
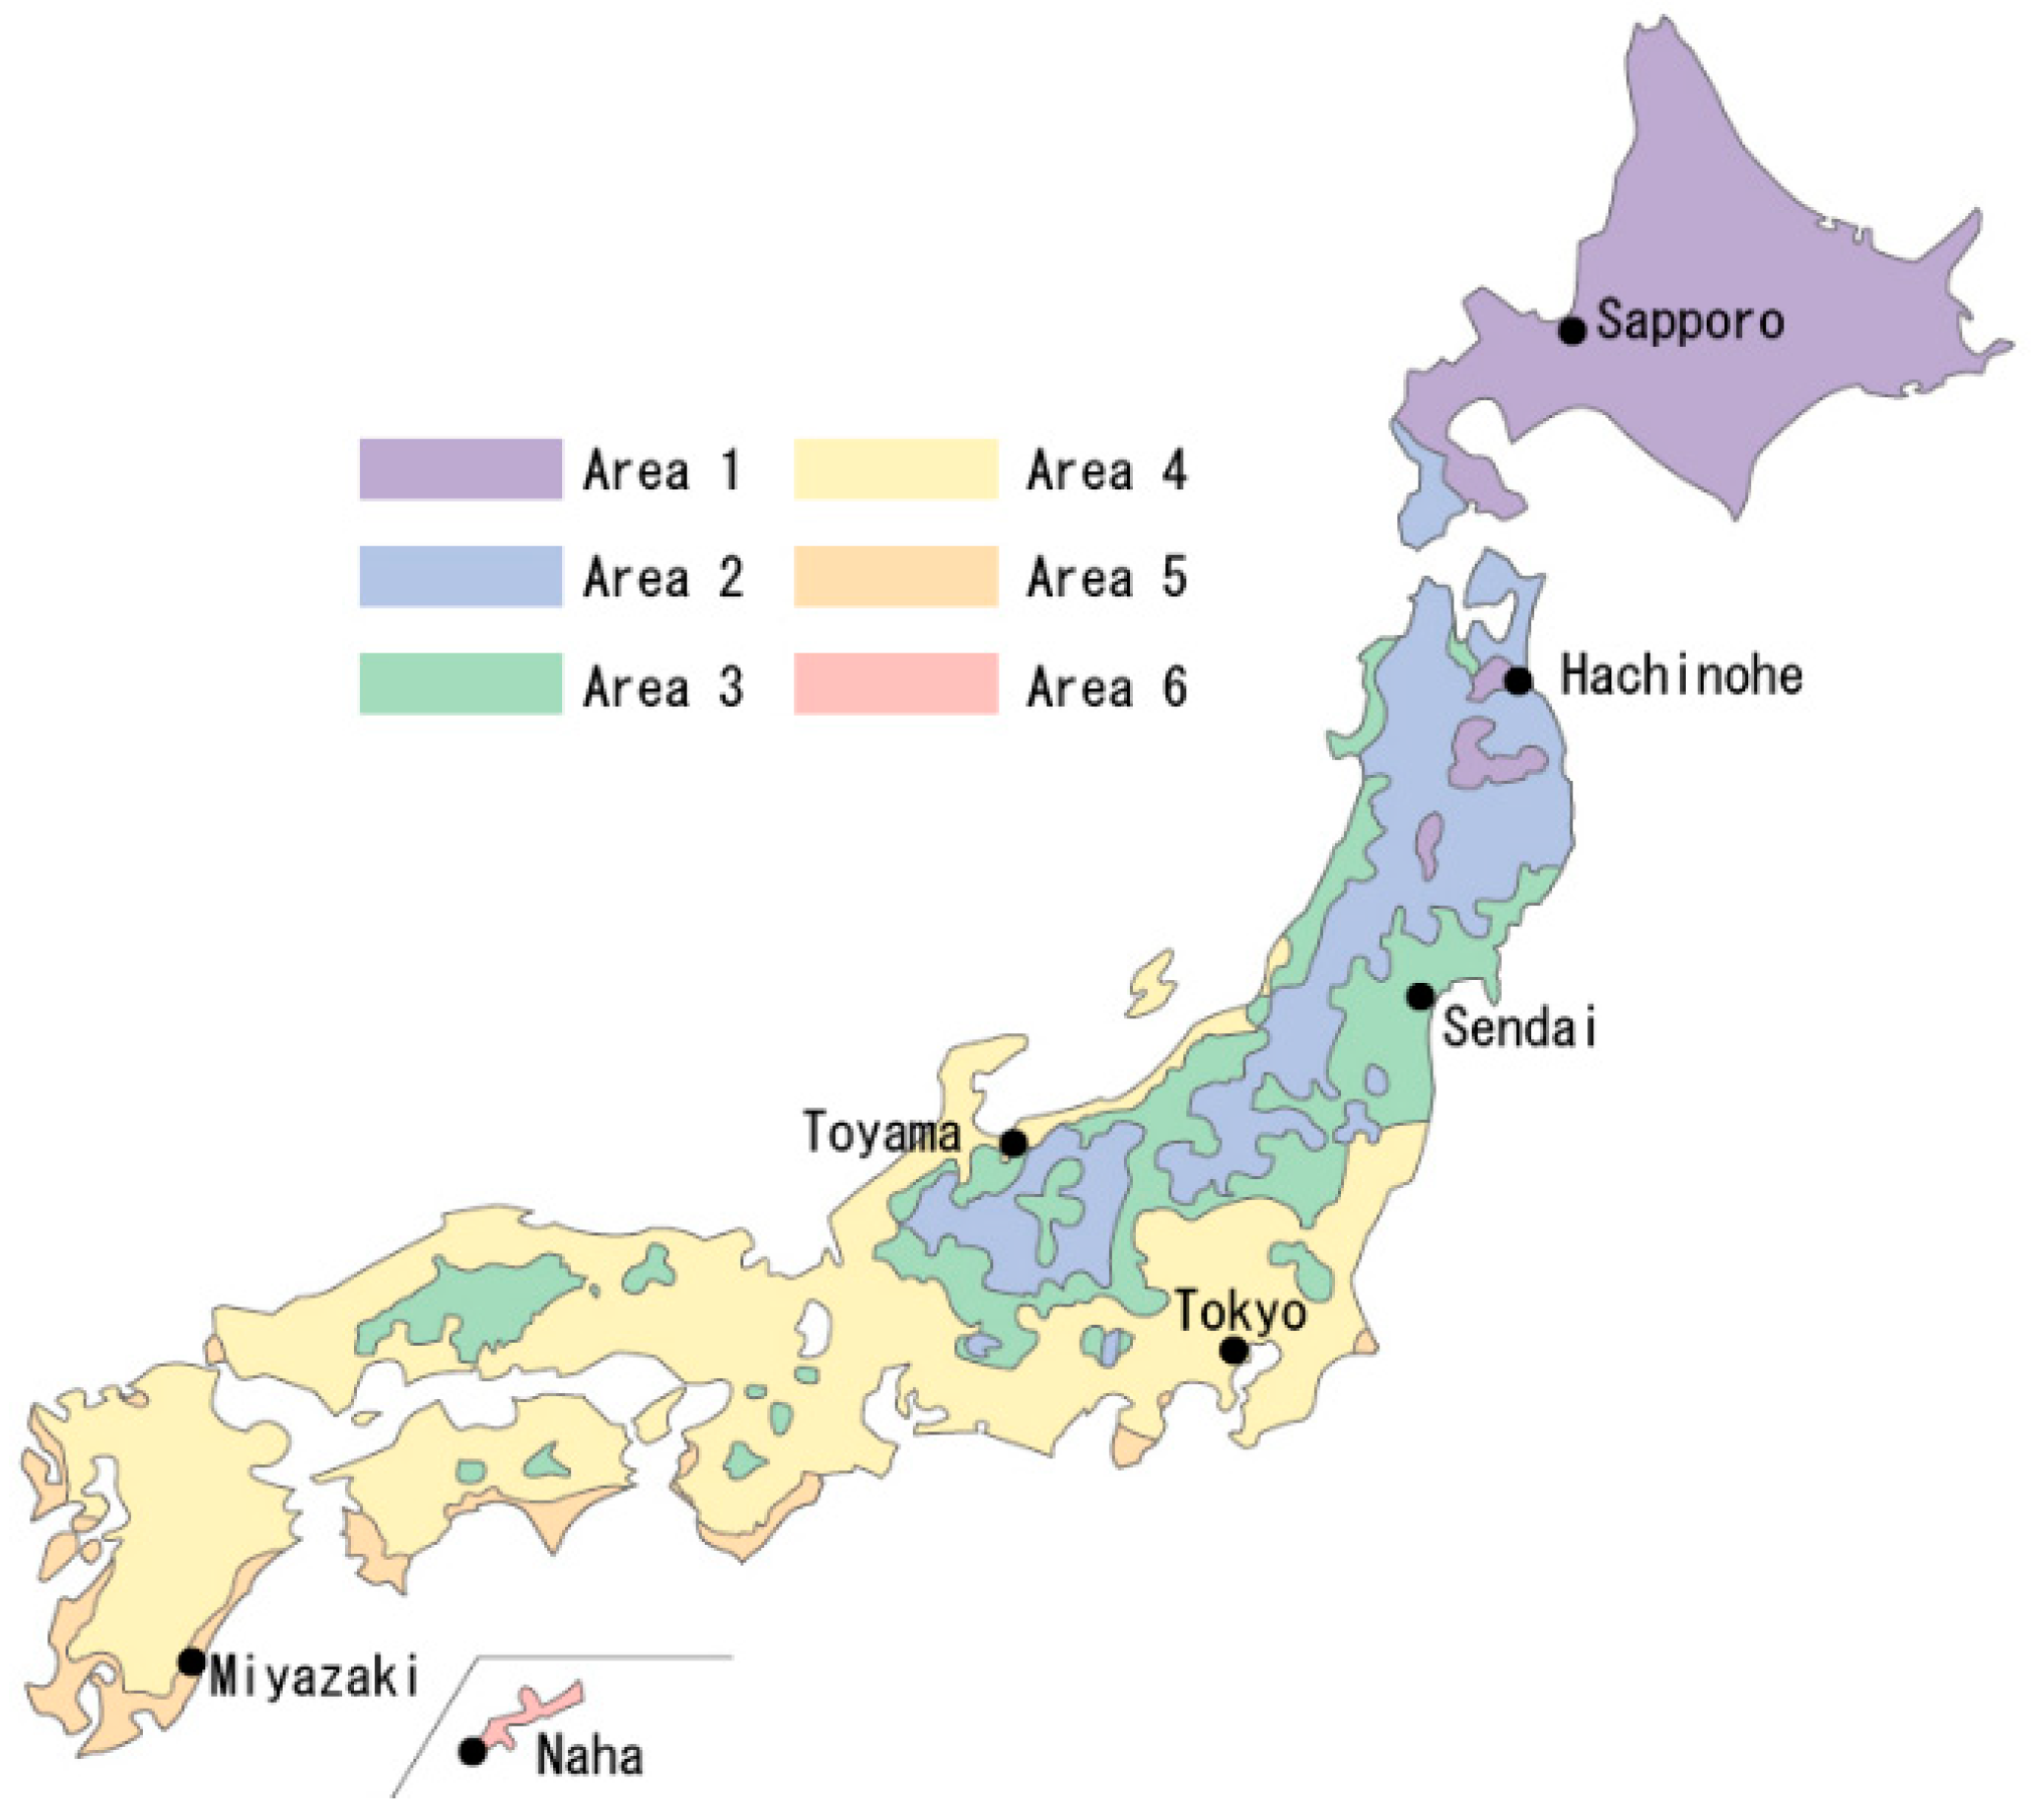
The input weather data for the simulation were from Expanded AMeDAS Weather Data [19]. We simulated and discussed the impacts of varied climate characters. As shown in Figure 3, six climate zones from north to south are indicated in Japanese Next-Generation Energy-Saving Standards, and we selected seven target cities located in six climate zones for discussion in this research.
According to the climate zones, the recommended insulation material thicknesses for the inside and outside of the exterior walls have been indicated in the housing energy-saving standards in Japan [1]. Details about the various insulation material thicknesses that were used in this research are given in Table 3. Heating and cooling periods varied according to the different weather characteristics of the seven cities. We identified the heating and cooling period according to the monthly average temperature (higher or lower than 15 °C). The setting temperature is 20 °C (heating) and 26 °C (cooling), respectively, and the percentage humidity is 40% (heating) and 60% (cooling) respectively. Table 4 shows various AC setting patterns in the seven cities.
For investigating how lifestyles affect AC load, we designed four different AC usage patterns to compare residents with different lifestyles. The internal heat generation is shown in Table 5, and the AC schedules are listed in Table 6. These usage patterns follow.
- No one was home during the day, and the AC was not used during sleeping hours (a couple with dual-income, no kids—DINK).
- No one was home during the day, and the AC was not used during sleeping hours (a family consisting of a husband, a full-time housewife, and a primary school child).
- No one was home during the day, and the AC was used during sleeping hours (an elderly couple).
- The AC was used 24 h a day.
Additionally, the ventilation system is operated every two hours in all of the rooms, and also the automatic ventilation on an as-needed basis in different rooms.
4.2. Energy Consumption Variation in Different Climate Zones
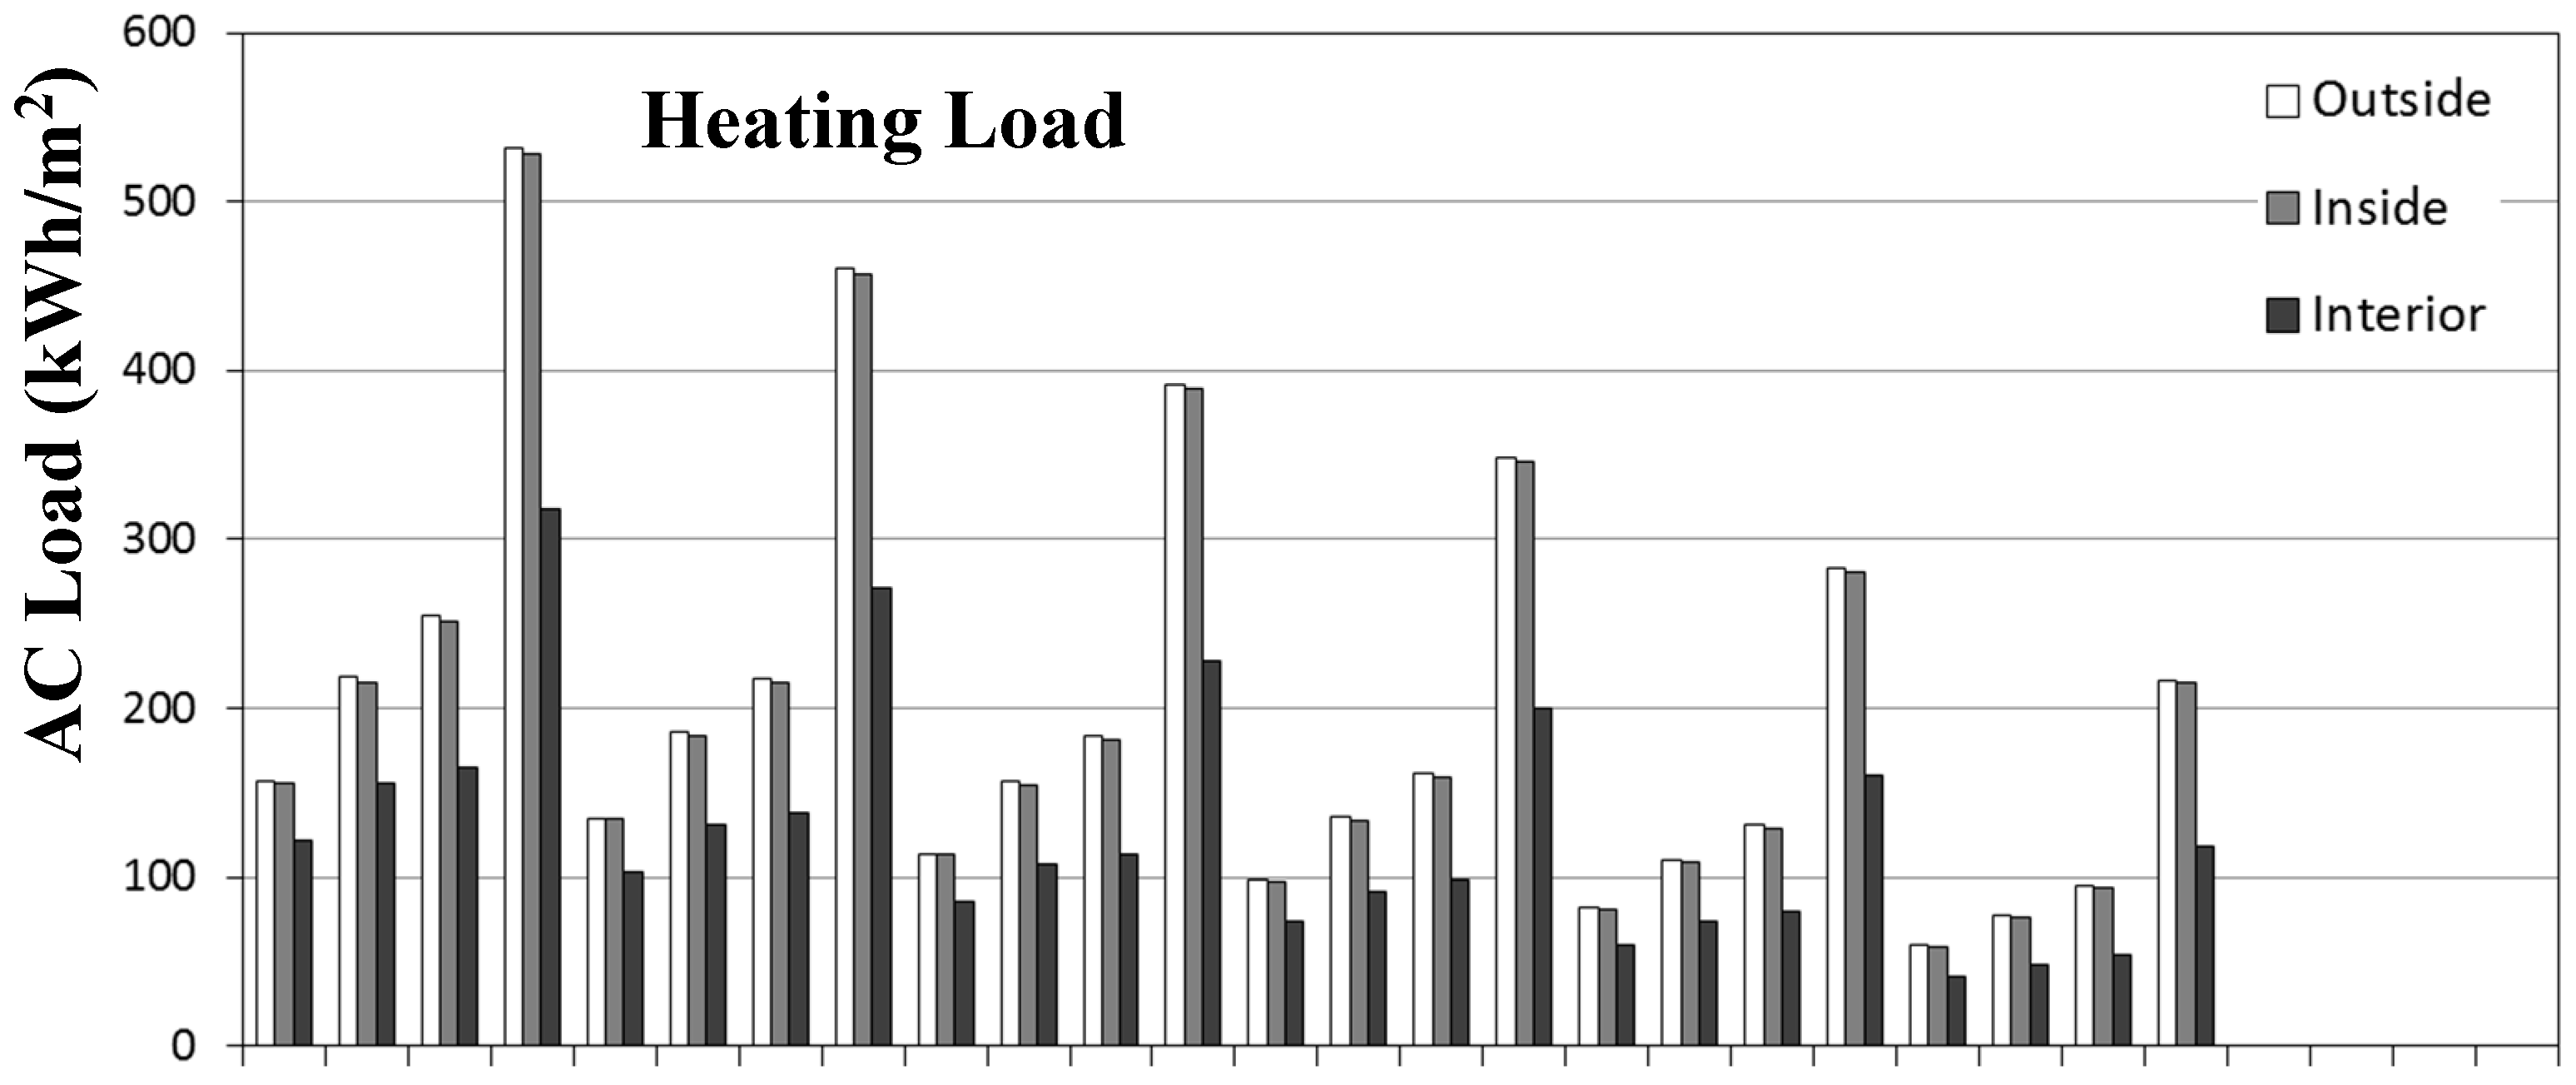
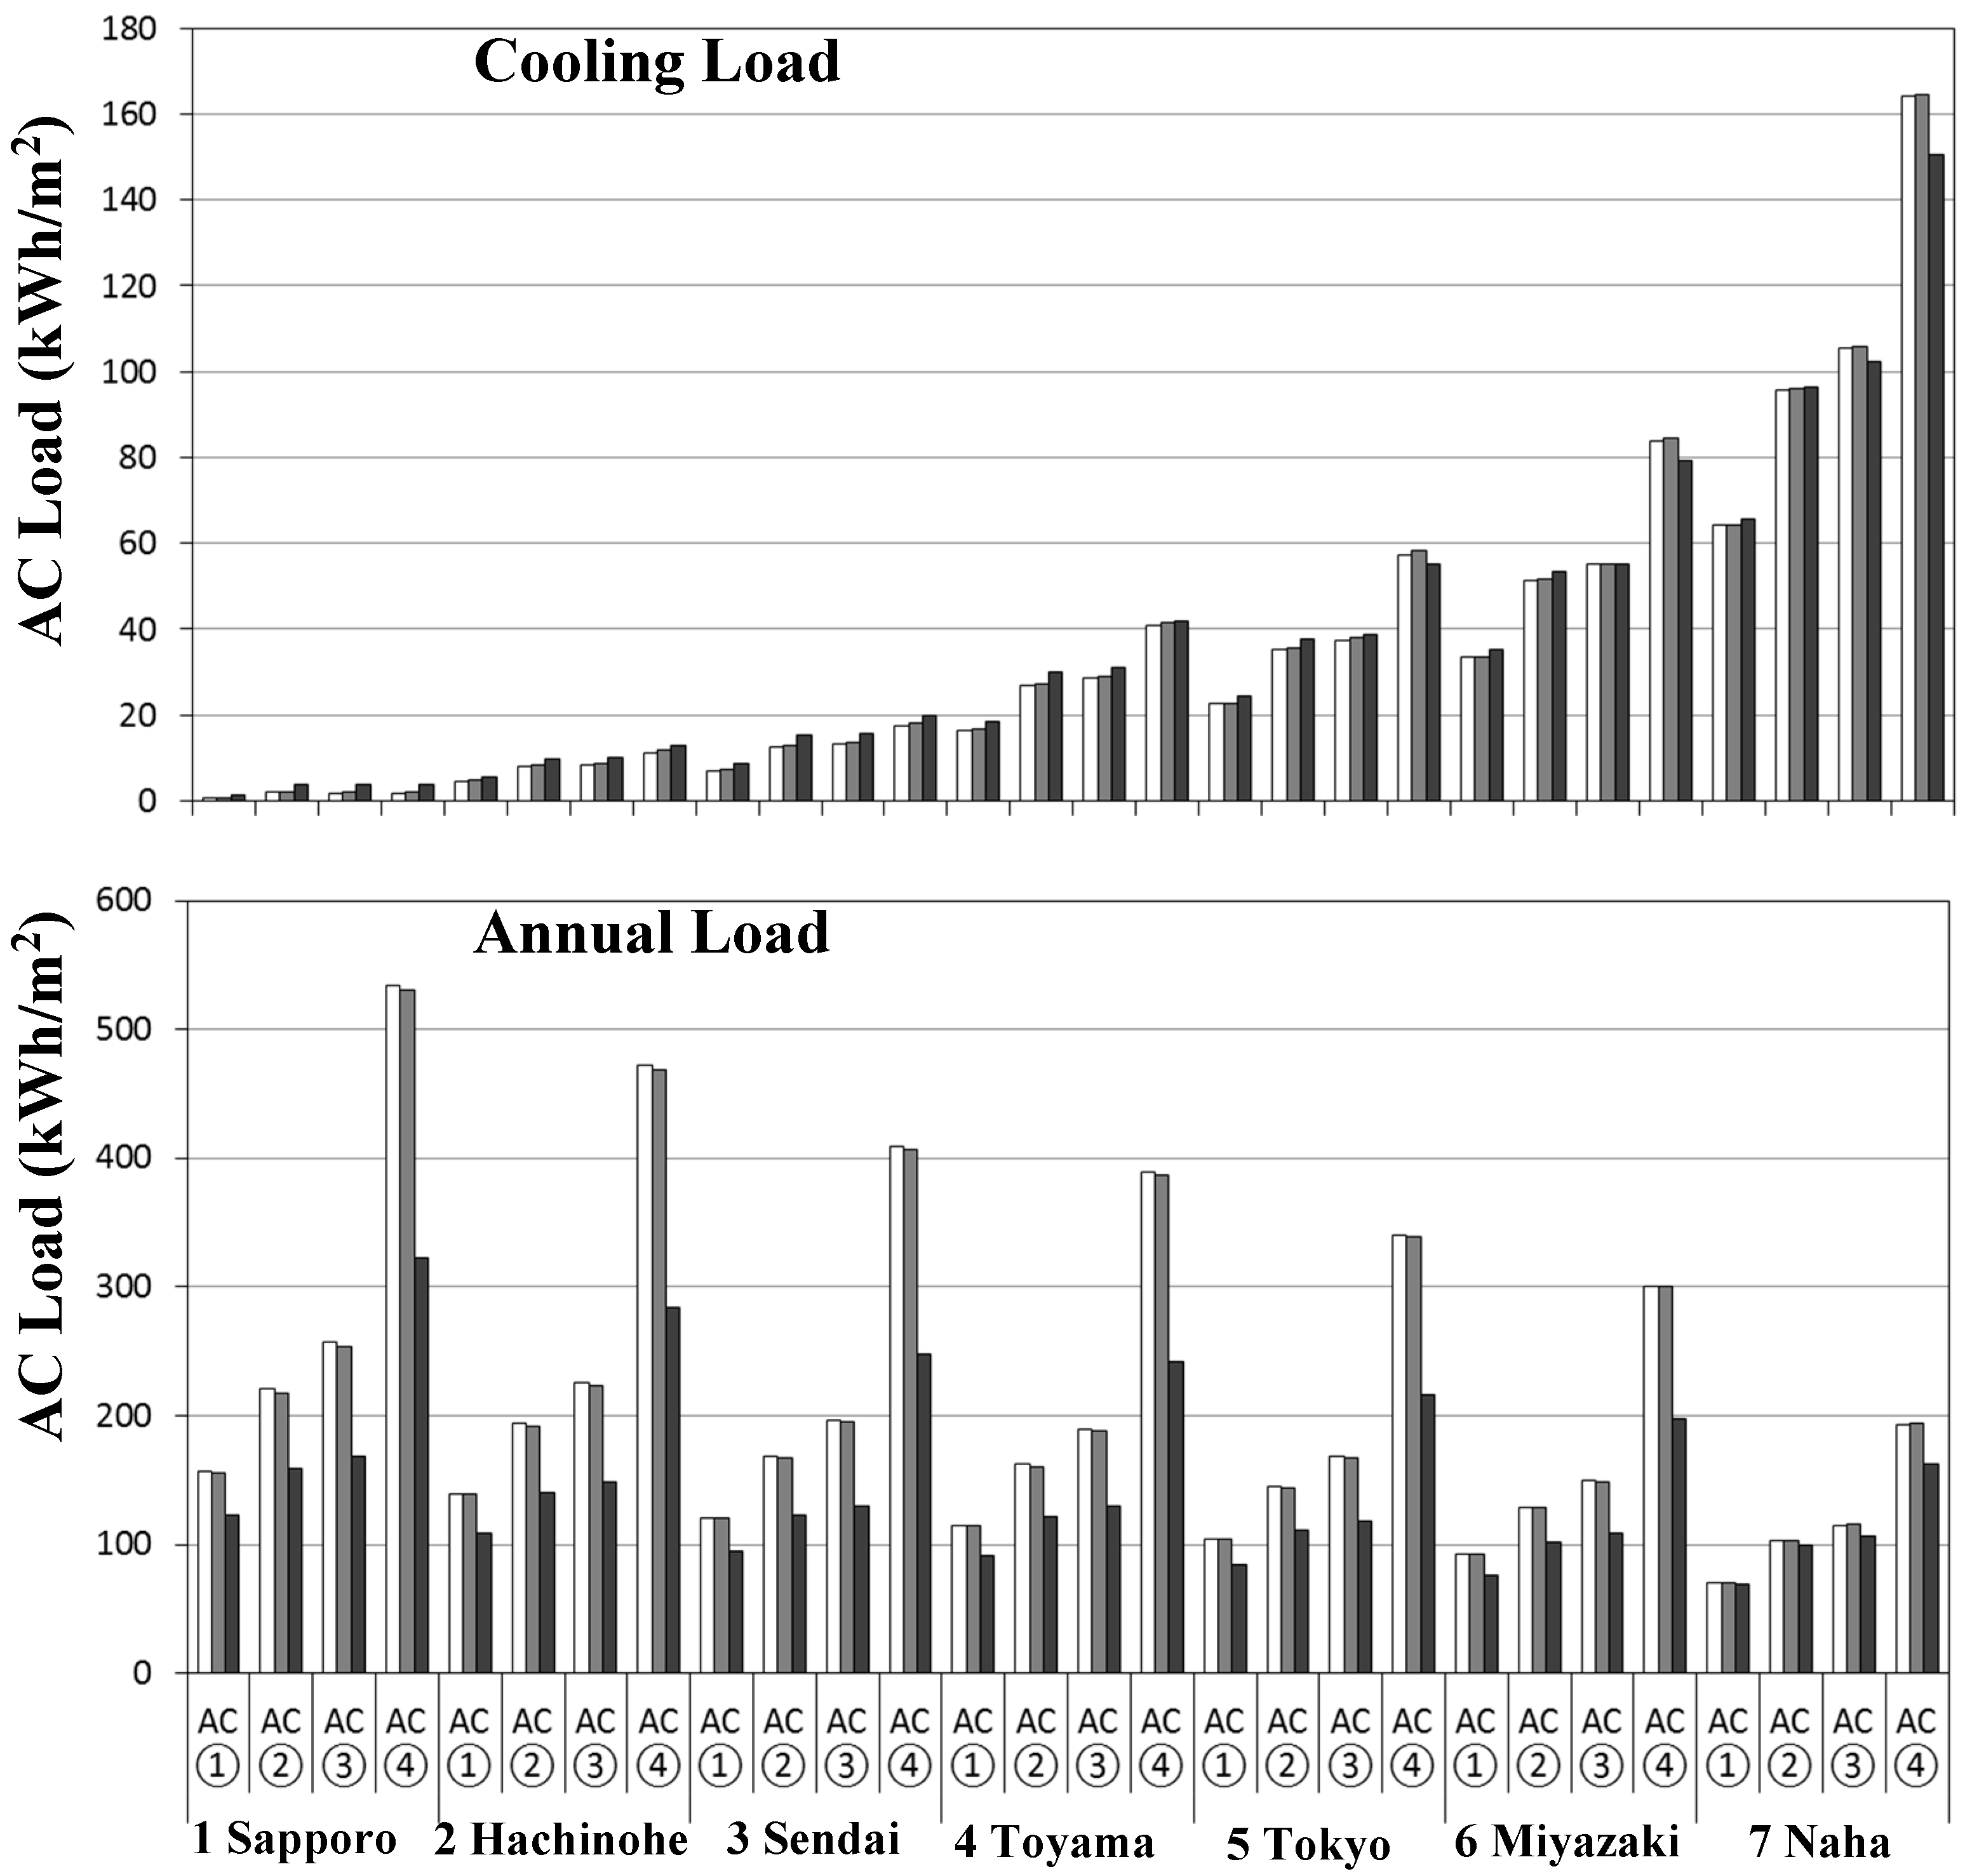
Figure 4 shows that the annual heating energy use in warm cities was lower than the annual heating load in cold cities. Compared among the AC usage patterns, the heating energy use of an outside insulation unit was, on average, 0.9% higher than that of an inside insulation unit. The heating energy use of an outside insulation unit was, on average, 29.7% higher than the heating energy use of an interior insulation unit. The highest decreased rate was observed in Miyazaki according to AC usage pattern 4, reaching up to 45.5%. Generally, the heating load reduction rate in southern cities was lower than the rate in northern cities.
Looking at the cooling energy use, the load in southern cities was higher than that in northern cities. Other than the case of Naha using AC usage pattern 1, the cooling load of an outside insulation unit was lower than that of an inside insulation unit. The cooling energy use in an outside insulation unit was on average, 3.7% lower than the energy use in an inside insulation unit. In an outside insulation unit, the cooling energy use was mostly lower than the energy use in an interior insulation unit. In Sapporo using AC usage pattern 1, the cooling load of an interior insulation unit was 56.3% higher than that of an outside insulation unit, which was the highest load in all of the cases. When using AC usage pattern 4 in Tokyo and Miyazaki, and using AC patterns 3 and 4 in Naha, the cooling loads were higher in outside insulation units compared with loads in interior insulation units. Cooling load differences among these three types of insulation were smaller than the heating load in the winter.
The results for annual AC load show that mostly all of the AC energy use in Sapporo is used for heating. More than 90% of the annual AC load is used for heating in Hachinohe and Sendai. Meanwhile, the annual heating load is below 15% of the annual AC load in Naha. Therefore, the main issue for building energy savings is to identify solutions to reduce the heating load in northern cities and to identify solutions to reduce the cooling load in southern cities.
The annual AC load in warmer cities was lower than the annual load in colder cities, because energy consumption for heating accounts for the most significant portion of annual AC energy use. Considering the same AC usage in the same location, the AC energy use of an inside insulation unit was lower than that of an outside insulation unit. Given the three insulation styles, annual AC energy use of an interior insulation unit was lower than for all other cases. On average, the annual AC energy use of an outside insulation unit was only 0.5% higher than that of an inside insulation unit. The AC energy use of an outside insulation unit was on average 25.8% higher compared to an interior insulation unit. The AC energy use with a decreased rate between interior and outside insulation styles in Hachinohe, using AC usage pattern 4, which reached 39.7%, is the highest out of all the cases.
4.3. Indoor Thermal Environment and Energy Consumption
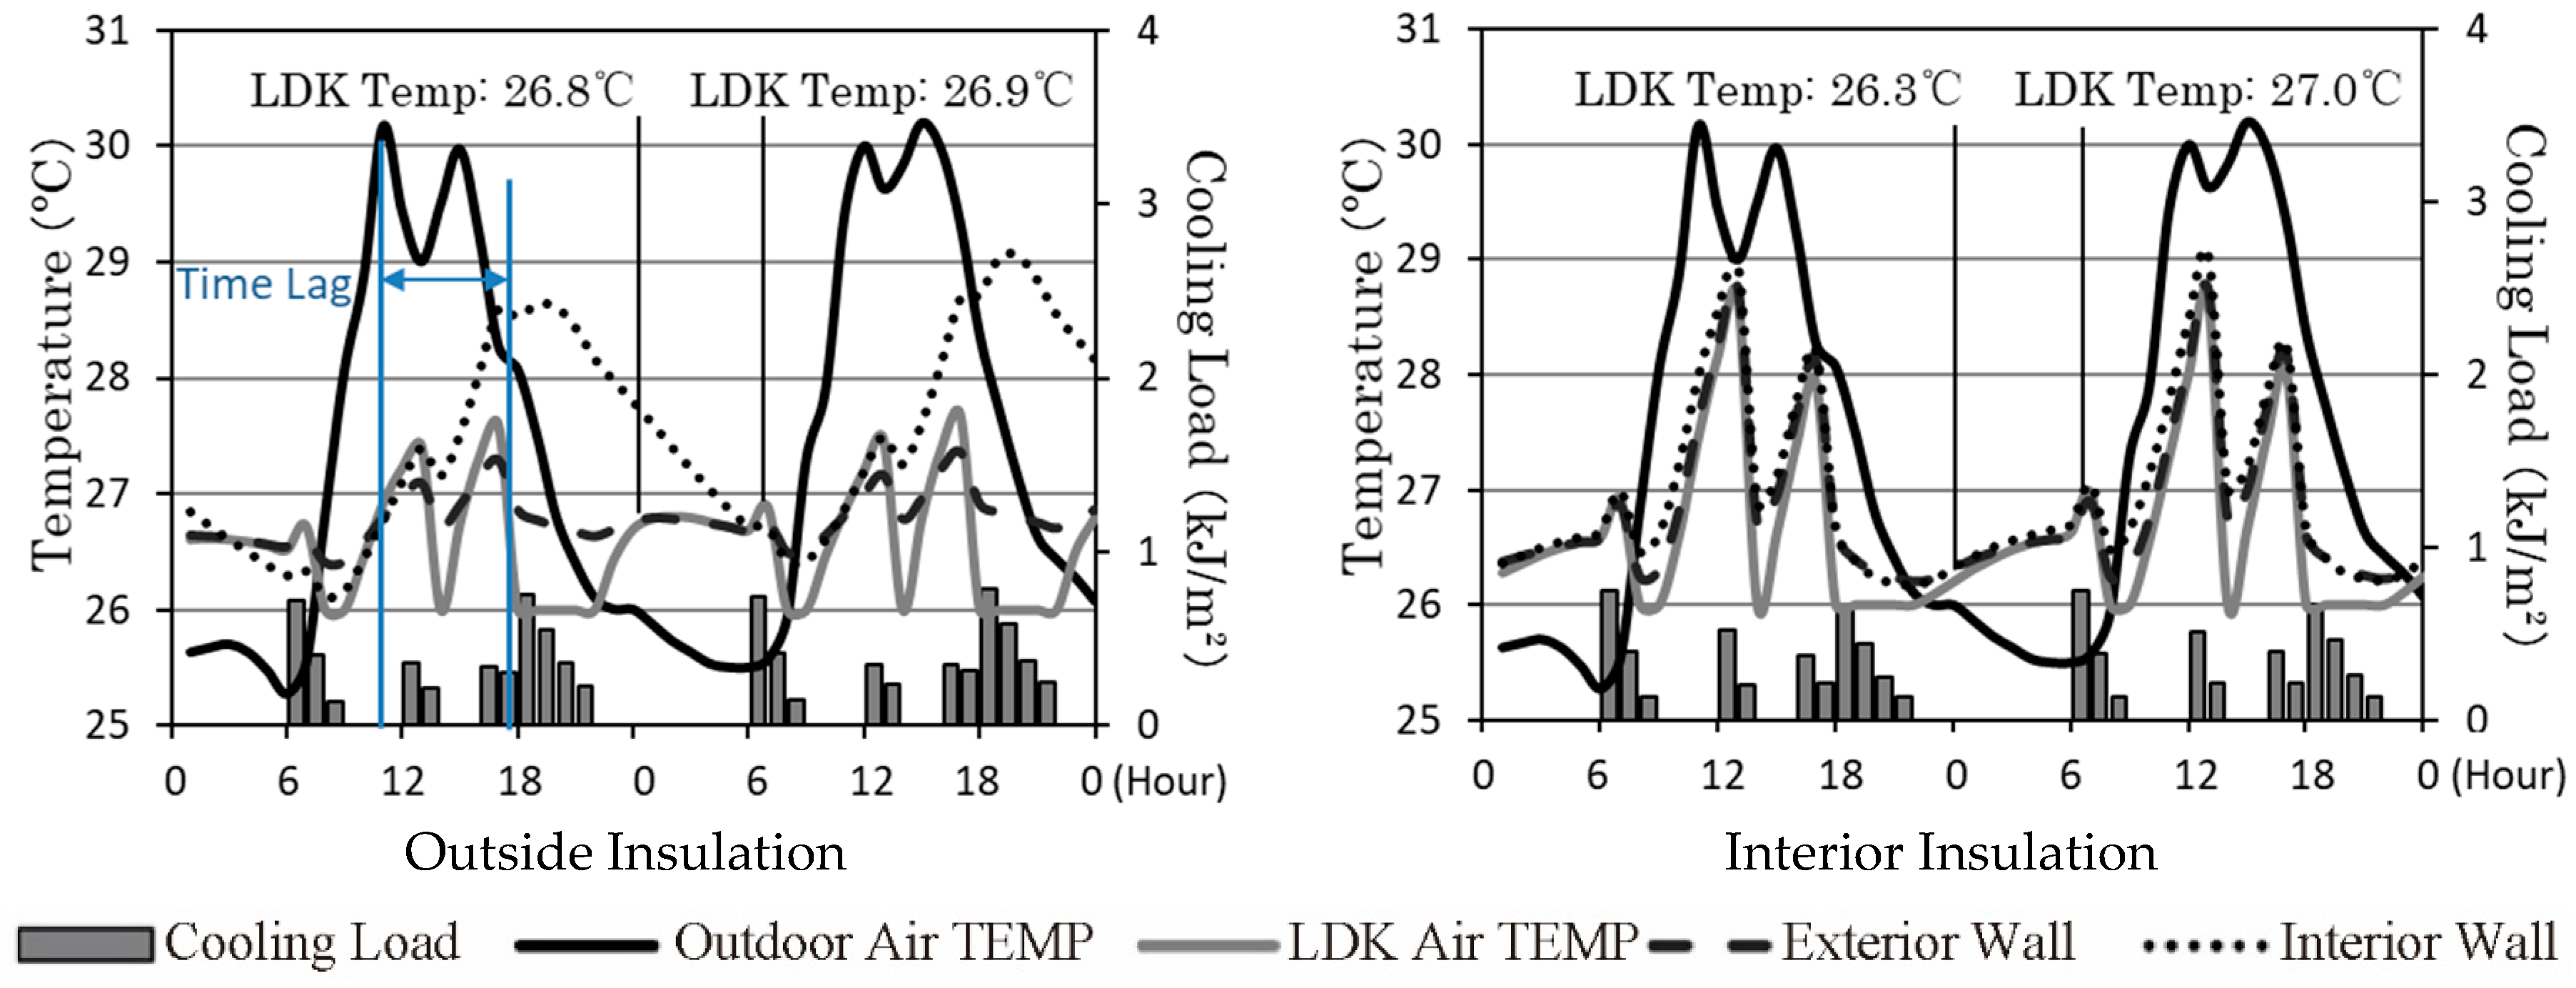
Figure 5 shows the cooling load and temperature changes using AC usage pattern 2. Firstly, this figure indicates the thermal effects from the heat capacity of the building envelope. The peak value of the outdoor air temperature occurred between 12:00 a.m. and 3:00 p.m., and reached up to 30 °C. The highest temperature value of the wall surface in an outside insulation unit was around 6:00 p.m., which was delayed by 3–6 h to the peak of outdoor air temperature. Therefore, we demonstrated that the high heat capacity of the building envelope stored the heat during the peak time and released the heat after that the peak. In an interior insulation unit, the peak time of the interior surface temperature was the same as the outdoor air temperature, and the temperate difference between the interior wall surface and the indoor air temperature was very slight when the AC was turned on. This is to say, a lower heat capacity of the building envelope contributed to greater control of indoor thermal conditions and reduced the cooling load on summer days. On these two summer days, the total cooling load was about 7.6% lower in the interior insulation unit compared with the cooling load in the outside insulation unit.
After turning off the AC after 11:00 p.m., the LDK (living room, dining room, kitchen room) air temperature rapidly increased close to the exterior wall surface temperature in an outside unit. At 1:00 a.m., the LDK temperature increased to 26.8 °C. Meanwhile, the LDK temperature was more stable in the interior insulation units. At 1:00 a.m., the LDK temperature increased to 26.3 °C, which was about 0.5 °C lower than the temperature in the outside insulation unit. Between turning off the AC at 11:00 p.m. and turning it on again the next day morning at 7:00 a.m., the LDK temperature in the outside insulation unit increased to 26.9 °C, and it increased to 27.0 °C in the interior insulation unit.
As shown in Figure 5, the exterior wall surface temperature did not vary with the outside air temperature or the LDK air temperature during the daytime. Even when the AC was turned off after 9:00 a.m., the high thermal storage capacity of the concrete wall kept the indoor temperature from increasing quickly. Therefore, the lower indoor air temperature reduced the cooling load during that first hour when the AC was turned on. In the case of the interior insulation unit, however, the wall surface temperature increased significantly. For cooling the LDK air temperature, the cooling load of the interior insulation unit was higher than that of the outside insulation unit during the first hour when the AC was turned on. It was lower, however, after the room cooled down to 26 °C. The total cooling load on these two days for the interior insulation unit was about 9.9% lower than that in the outside insulation unit.
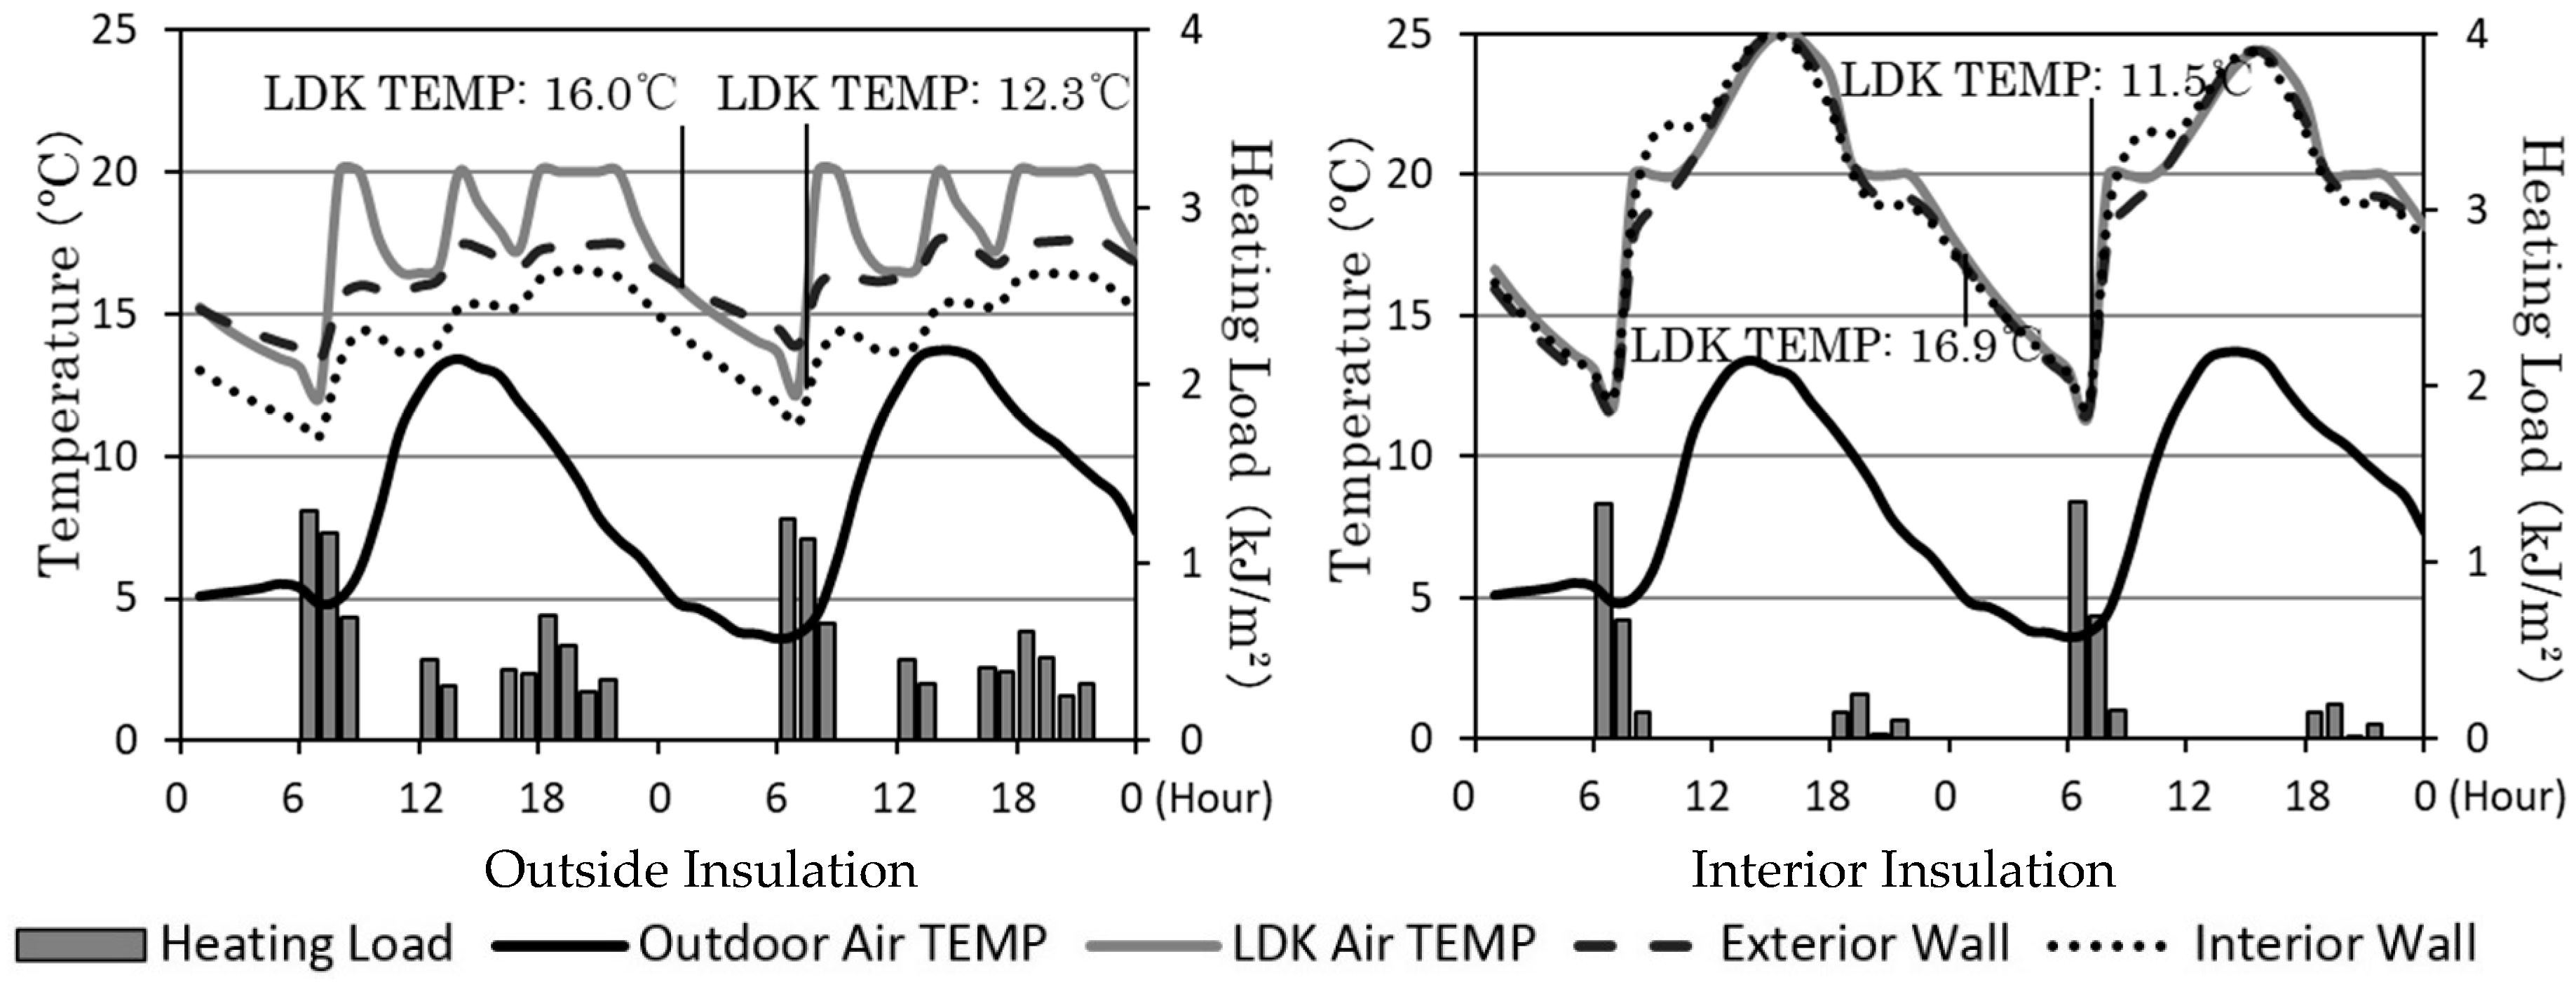
During winter nights, the LDK air temperature kept dropping after the heater was turned off until the next morning. Figure 6 shows that the LDK temperature started dropping after the heater was turned off (11:00 p.m.). In the outside insulation unit, the dropping speed is fast until the LDK air temperature was close to the structure’s surface temperature. The air temperature change in the interior insulation unit, however, was more stable compared with the outside insulation unit. Two hours after the heater was turned off (1:00 a.m.), the LDK air temperature was 16.9 °C, which was 0.9 °C higher than in the outside insulation unit. At 7:00 a.m., before the heater is turned on, the LDK temperature in the interior insulation unit was 0.8 °C lower than that in the outside insulation unit. This lower temperature contributed to a higher heating load (2%) in the first hour after the heater was turned on. In the second hour after the heater was turned on, the heating load for the interior insulation unit was 42% lower than that in the outside insulation unit. The total heating load for these two days in the interior insulated unit was 58% lower than that in the outside insulated unit.
4.4. Indoor Air Temperature Distribution in Winter Nights
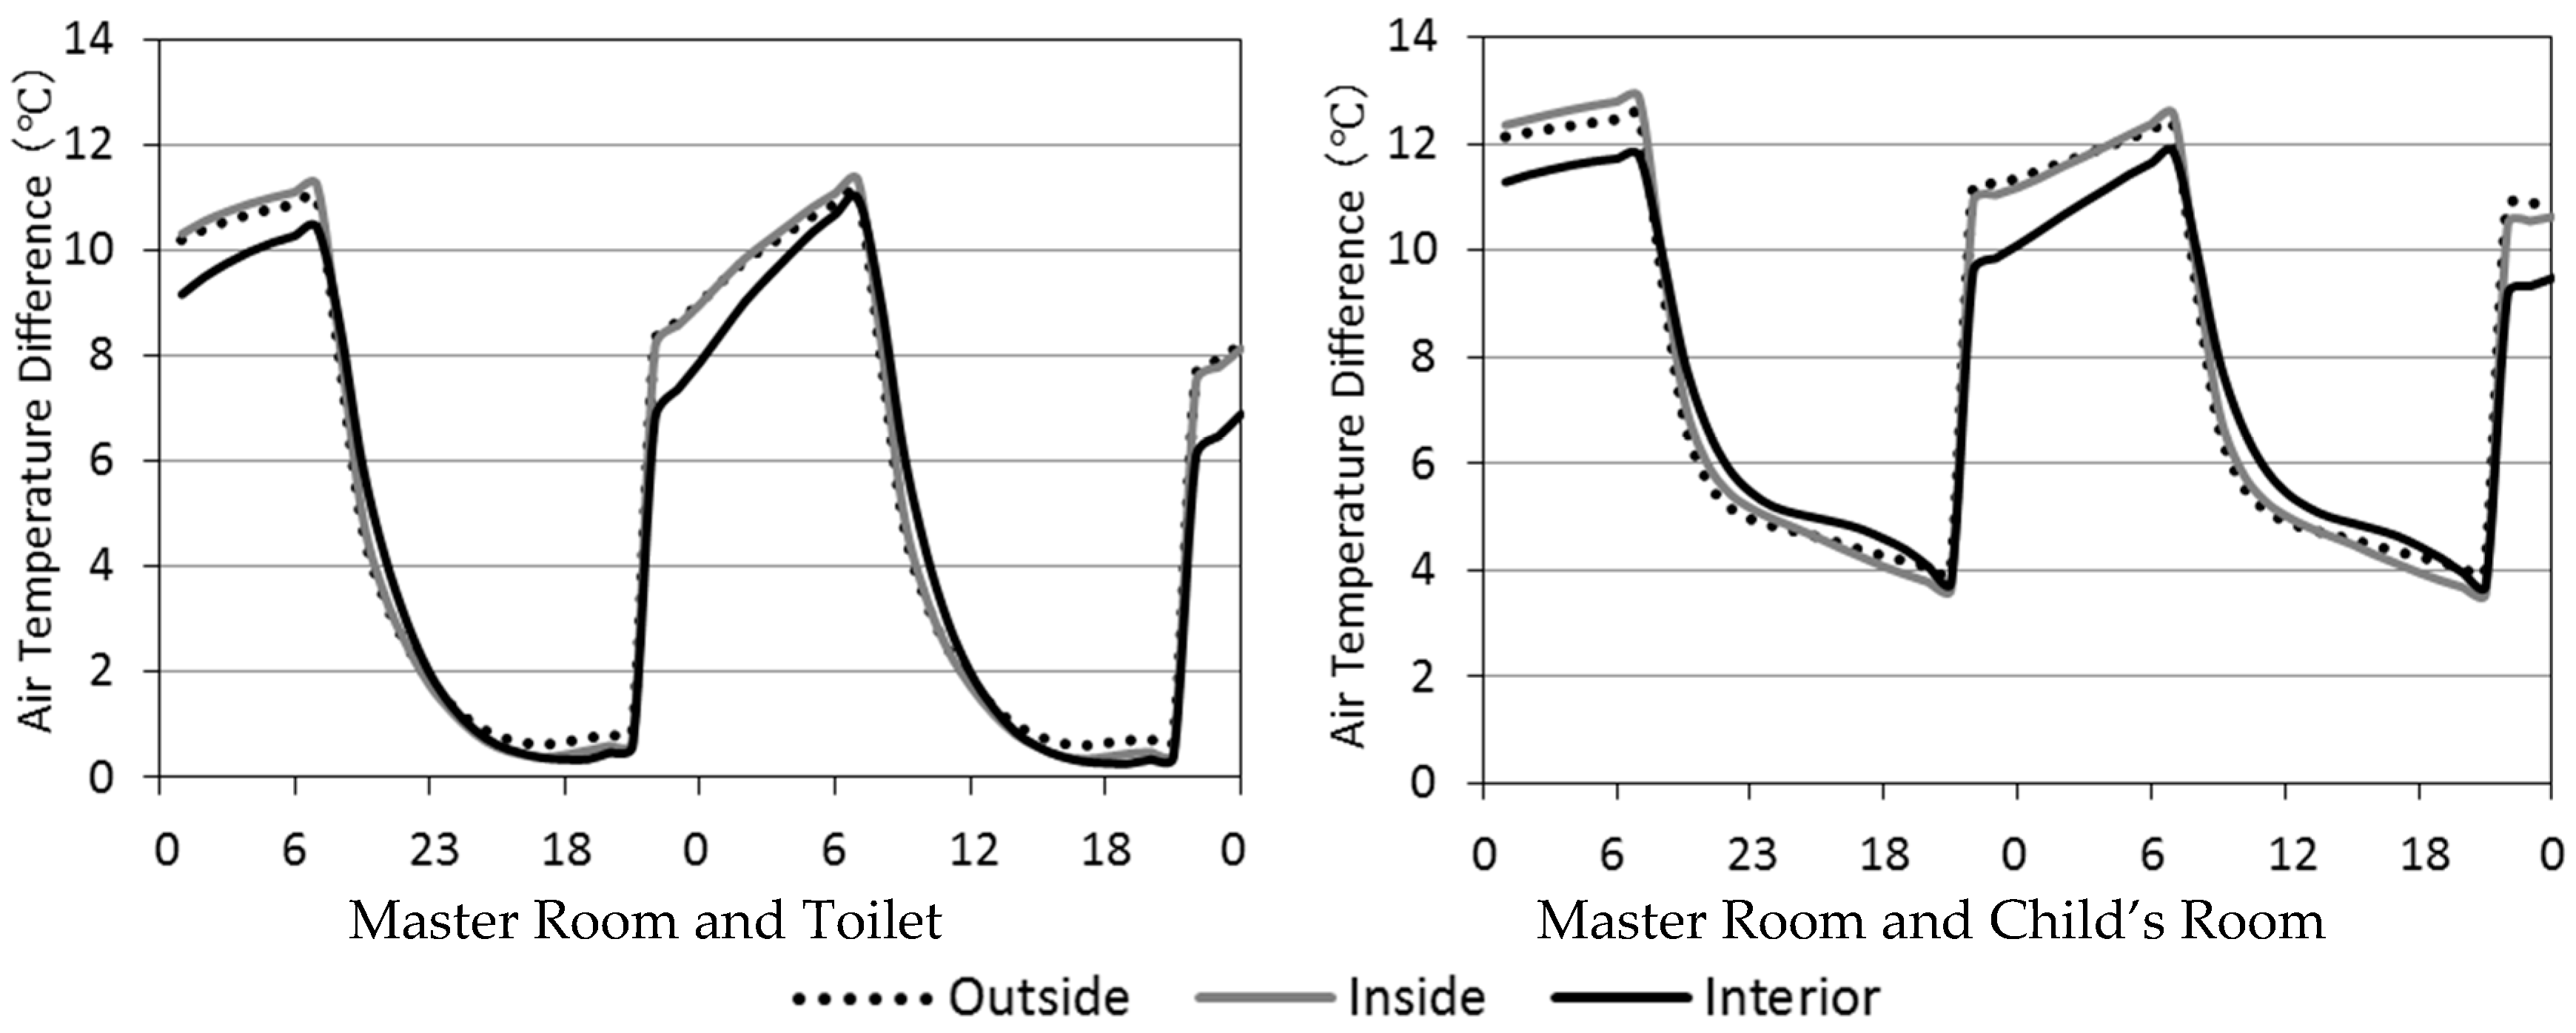
Rapid air temperature decreases in the winter lead to an increase in blood pressure and increase the risk of cerebral hemorrhage [20]. Every 4 °C drop in indoor air temperature increases cardiovascular disease mortality by 5% [21]. Reducing air temperature differences among rooms in one unit could promote indoor thermal comfort and contribute to resident well-being, especially for older residents on winter nights.
Figure 7 compares air temperature differences between a master room and two other rooms that might be used during the night (the toilet and a child’s room). In the night, from 10:00 p.m. to 7:00 a.m. on the second day when the heater was used only in the master room, the air temperature difference could increase to more than 10 °C between the master room and the other two rooms. The temperature difference in the interior insulation unit was up to 1.5 °C lower than that in the outside and inside insulation units.
5. Conclusions
This research proposed and investigated an innovative insulation style using interior insulation. First, we calculated the thermal loss. By comparing the calculation results, we investigated the thermal loss caused by thermal bridges in order to demonstrate the advantages of using the proposed interior insulation. The thermal bridge had distinct effects on a building’s environmental properties, and this could be solved with installing interior insulation. We simulated and compared the AC energy use and indoor thermal comfort of the unit with three insulation styles in seven cities. The AC load varied in different cities and seasons. The annual AC energy use of an interior insulation unit was lower compared to outside and inside insulation units under all conditions. In summer, the air temperature in an interior insulation unit was lower compare to the others when the AC was not in use.
In winters, the interior wall surface temperature for an interior insulation unit was higher than that for an outside insulation unit. A cold interior surface had a higher heating energy use. Interior insulation also could be used to reduce temperature differences among rooms in one unit, contributing to resident well-being and reducing the mortality rate of individuals with cardiovascular disease on winter nights.
This research compared the three different insulation types and demonstrated the environmental advantages of interior insulation. In the process of sustainable building design, a complete insulation system should be introduced according to the local climate conditions and other construction considerations.
Author Contributions
Y.W. and H.F. contributed equally to this paper. They performed the experiments, analyzed the data, and wrote the paper together.
Funding
This research was partly funded by National Natural Science Foundation of China, grant number 51608439.
Acknowledgments
The authors would like to thank Akihito Ozaki from the Department of Architecture and Urban Design, Kyushu University, Japan, for providing the free simulation software THERB.
Conflicts of Interest
The authors declare no conflict of interest.
References
- The Institute for Building Environment and Energy Conservation (IBEEC). Explanation of the Energy-Saving Standards for Houses; IBEEC: Tokyo, Japan, 2009. [Google Scholar]
- Wang, Y.; Fukuda, H.; Kuma, Y.; Ozaki, A. Study of Air-Conditioning Load: Comparison of Steel and RC Residence Units. J. Asian Archit. Build. Eng. 2010, 9, 571–576. [Google Scholar] [CrossRef] [Green Version]
- Evans, M.; Shui, B.; Takagi, T. Country Report on Building Energy Codes in Japan. Pac. Northwest Natl. Lab. 2009. [Google Scholar] [Green Version]
- Kuma, Y.; Ozaki, A.; Ozasa (Kagawa), H.; Fukuda, H. Influence of Moisture Sorption and Desorption of Walls on Space Conditioning Load. J. Environ. Eng. 2008, 73, 1171–1178. [Google Scholar] [CrossRef]
- Kontoleon, K.J.; Bikas, D.K. The effect of south wall’s outdoor absorption coefficient on time lag, decrement factor and temperature variations. Energy Build. 2007, 39, 1011–1018. [Google Scholar] [CrossRef]
- Bojic, M.; Yik, F.; Wan, K.; Burnett, J. Influence of envelope and partition characteristics on the space cooling of high-rise residential buildings in Hong Kong. Build. Environ. 2002, 37, 347–355. [Google Scholar] [CrossRef]
- Yuan, J. Impact of Insulation Type and Thickness on the Dynamic Thermal Characteristics of an External Wall Structure. Sustainability 2018, 10, 2835. [Google Scholar] [CrossRef]
- Ma, Q.; Fukuda, H.; Kobatake, T.; Lee, M. Study of a Double-Layer Trombe Wall Assisted by a Temperature-Controlled DC Fan for Heating Seasons. Sustainability 2017, 9, 2179. [Google Scholar] [CrossRef]
- Cheung, C.K.; Fuller, R.J.; Luther, M.B. Energy-efficient envelope design for high-rise apartments. Energy Build. 2005, 37, 37–48. [Google Scholar] [CrossRef] [Green Version]
- Asan, H. Investigation of wall’s optimum insulation position from maximum time lag and minimum decrement factor point of view. Energy Build. 2000, 32, 197–203. [Google Scholar] [CrossRef]
- Ozel, M.; Pihtili, K. Optimum location and distribution of insulation layers on building walls with various orientations. Build. Environ. 2007, 42, 3051–3059. [Google Scholar] [CrossRef]
- Bianchi, F.; Pisello, A.L.; Baldinelli, G.; Asdrubali, F. Infrared thermography assessment of thermal bridges in building envelope: Experimental validation in a test room setup. Sustainability 2014, 6, 7107–7120. [Google Scholar] [CrossRef]
- Erhorn, H.; Erhorn-Kluttig, H.; Thomsen, K.E.; Rose, J.; Aggerholm, S. An Effective Handling of Thermal Bridges in the EPBD Context: Final Report of the IEE ASIEPI Work on Thermal Bridges; ASIEPI: Brussel, Belgium, 2010. [Google Scholar]
- Ge, H.; McClung, V.R.; Zhang, S. Impact of balcony thermal bridges on the overall thermal performance of multi-unit residential buildings: A case study. Energy Build. 2013, 60, 163–173. [Google Scholar] [CrossRef]
- Shimoda, Y.; Yamaguchi, Y.; Okamura, T.; Taniguchi, A.; Yamaguchi, Y. Prediction of greenhouse gas reduction potential in Japanese residential sector by residential energy end-use model. Appl. Energy 2010, 87, 1944–1952. [Google Scholar] [CrossRef]
- Wang, Z.; Zhao, J. Optimization of Passive Envelop Energy Efficient Measures for Office Buildings in Different Climate Regions of China Based on Modified Sensitivity Analysis. Sustainability 2018, 10, 907. [Google Scholar] [CrossRef]
- Akihito, O. Simulation software of the hygrothermal environment of buildings based on detailed thermodynamic models, eSim 2004. In Proceedings of the Canadian Conference on Building Energy Simulation, Vancouver, Canada, 9–11 June 2004; pp. 45–54. [Google Scholar]
- Ozaki, A.; Tsujimaru, T. Prediction of hygrothermal environment of buildings based upon combined simulation of heat and moisture transfer and airflow. J. Int. Build. Perform. Simul. Assoc. 2006, 16, 30–37. [Google Scholar]
- Architectural Institute of Japan. Expanded AMeDAS Weather Data (1981–2000); Architectural Institute of Japan: Tokyo, Japan, 2005. [Google Scholar]
- Caplan, L.R.; Neely, S.; Phillip, G. Cold-related intracerebral hemorrhage. Arch. Neurol. 1984, 41, 227. [Google Scholar] [CrossRef] [PubMed]
- Woodhouse, P.R.; Khaw, K.T.; Plummer, M. Seasonal variation of blood pressure and its relationship to ambient temperature in an elderly population. J. Hypertens. 1993, 11, 1267–1274. [Google Scholar] [CrossRef] [PubMed]
Figure 1.
Unit plan.

Figure 2.
Thermal insulation details in three styles. The locations of the thermal bridges are shown in dark circles.
Figure 2.
Thermal insulation details in three styles. The locations of the thermal bridges are shown in dark circles.

Figure 3.
Climate zones and selected cities.

Figure 4.
AC energy use with four AC usage patterns in seven Japanese cites.


Figure 5.
Cooling energy use and temperature change from 15–16 August with outside insulation and interior insulation, using AC 2 in Tokyo (LDK: living room, dining room, kitchen room).
Figure 5.
Cooling energy use and temperature change from 15–16 August with outside insulation and interior insulation, using AC 2 in Tokyo (LDK: living room, dining room, kitchen room).

Figure 6.
Heating energy use and temperature change from 9–10 January with outside insulation and interior insulation, using AC 2 in Tokyo.
Figure 6.
Heating energy use and temperature change from 9–10 January with outside insulation and interior insulation, using AC 2 in Tokyo.

Figure 7.
Air temperature difference from 9–10 January between the master room and toilet and the master room and child’s room with three insulation styles, using AC 3 in Tokyo.
Figure 7.
Air temperature difference from 9–10 January between the master room and toilet and the master room and child’s room with three insulation styles, using AC 3 in Tokyo.


Table 1.
Total Thermal Loss Calculation.
| - | Outside Insulation | Inside Insulation | Interior Insulation | ||||||
|---|---|---|---|---|---|---|---|---|---|
| Area | Thermal Transmittance | Heat Loss | Area | Thermal Transmittance | Heat Loss | Area | Thermal Transmittance | Heat Loss | |
| (m2) | (W/m2·K) | (W/K) | (m2) | (W/m2·K) | (W/K) | (m2) | (W/m2·K) | (W/K) | |
| Exterior Wall | 9.29 | 0.81 | 7.52 | 9.29 | 0.70 | 6.50 | 9.29 | 0.70 | 6.50 |
| Pillar | 6.20 | 0.57 | 3.53 | 5.00 | 0.52 | 2.60 | 5.00 | 0.52 | 2.60 |
| Beam | 7.65 | 0.67 | 5.13 | 7.65 | 0.60 | 4.59 | 7.65 | 0.60 | 4.59 |
| Window | 7.46 | 1.90 | 14.17 | 7.46 | 1.90 | 14.17 | 7.46 | 1.90 | 14.17 |
| Door | 2.00 | 1.50 | 3.00 | 2.00 | 1.50 | 3.00 | 2.00 | 1.50 | 3.00 |
| Thermal Bridge | 3.10 | 5.87 | 18.19 | 3.70 | 5.87 | 21.71 | 0.00 | - | 0.00 |
| Total | - | - | 51.54 | - | - | 52.57 | - | - | 30.86 |
Table 2.
Thermal transmittance calculations.
| - | Outside Insulation | Inside Insulation | Interior Insulation | |||||||
|---|---|---|---|---|---|---|---|---|---|---|
| Thickness | Thermal Conductivity | Thermal Resistance | Thickness | Thermal Conductivity | Thermal Resistance | Thickness | Thermal Conductivity | Thermal Resistance | ||
| (m) | (W/m·K) | (m2·K/W) | (m) | (W/m·K) | (m2·K/W) | (m) | (W/m·K) | (m2·K/W) | ||
| Exterior Wall | Extruded poly styrene foam blocks A-3 | 0.030 | 0.028 | 1.070 | 0.035 | 0.028 | 1.250 | 0.035 | 0.028 | 1.250 |
| Concrete | 0.200 | 1.600 | 0.130 | 0.200 | 1.600 | 0.130 | 0.200 | 1.600 | 0.130 | |
| Plaster board | 0.010 | 0.220 | 0.050 | 0.010 | 0.220 | 0.050 | 0.010 | 0.220 | 0.050 | |
| Total | - | 1.240 | - | 1.420 | - | 1.420 | ||||
| - | Thermal Transmittance (W/m2·K) | 0.810 | Thermal Transmittance (W/m2·K) | 0.700 | Thermal Transmittance (W/m2·K) | 0.700 | ||||
| Pillar | Extruded poly styrene foam blocks A-3 | 0.030 | 0.028 | 1.070 | 0.035 | 0.028 | 1.250 | 0.035 | 0.028 | 1.250 |
| Concrete | 1.000 | 1.600 | 0.630 | 1.000 | 1.600 | 0.630 | 1.000 | 1.600 | 0.630 | |
| Plaster board | 0.010 | 0.220 | 0.050 | 0.010 | 0.220 | 0.050 | 0.010 | 0.220 | 0.050 | |
| Total | - | 1.740 | - | 1.920 | - | 1.920 | ||||
| - | Thermal Transmittance (W/m2·K) | 0.570 | Thermal Transmittance (W/m2·K) | 0.520 | Thermal Transmittance (W/m2·K) | 0.520 | ||||
| Beam | Extruded poly styrene foam blocks A-3 | 0.030 | 0.028 | 1.070 | 0.035 | 0.028 | 1.250 | 0.035 | 0.028 | 1.250 |
| Concrete | 0.600 | 1.600 | 0.380 | 0.600 | 1.600 | 0.380 | 0.600 | 1.600 | 0.380 | |
| Plaster board | 0.010 | 0.220 | 0.050 | 0.010 | 0.220 | 0.050 | 0.010 | 0.220 | 0.050 | |
| Total | - | 1.490 | - | 1.670 | - | 1.670 | ||||
| - | Thermal Transmittance (W/m2·K) | 0.670 | Thermal Transmittance (W/m2·K) | 0.600 | Thermal Transmittance (W/m2·K) | 0.600 | ||||
| Thermal Bridge | Concrete | 0.200 | 1.600 | 0.130 | 0.200 | 1.600 | 0.130 | - | ||
| Plaster board | 0.010 | 0.220 | 0.050 | 0.010 | 0.220 | 0.050 | ||||
| Total | - | 0.170 | - | 0.170 | ||||||
| - | Thermal Transmittance (W/m2·K) | 5.870 | Thermal Transmittance (W/m2·K) | 5.870 | ||||||
Table 3.
Thickness of insulation materials [1].
Table 3.
Thickness of insulation materials [1].
| Zone | Placement | Thickness (mm) | ||
|---|---|---|---|---|
| Outside | Inside | Interior | ||
| 1 | Ceiling | 85 | 105 | 105 |
| Exterior Wall | 55 | 65 | 65 | |
| 2 | Ceiling | 65 | 80 | 80 |
| Exterior Wall | 45 | 55 | 55 | |
| 3, 4, 5 | Ceiling | 60 | 70 | 70 |
| Exterior Wall | 30 | 35 | 35 | |
| 6 | Ceiling | 60 | 70 | 70 |
| Exterior Wall | 10 | 10 | 10 | |
Table 4.
Air-conditioning (AC) periods in seven cities [4].
Table 4.
Air-conditioning (AC) periods in seven cities [4].
| - | 1. Sapporo 2. Hachinohe | 3. Sendai 4. Toyama | 5. Tokyo | 6. Miyazaki | 7. Naha |
|---|---|---|---|---|---|
| Heating Period | January–May | January–April | January–March | January–March | - |
| October–December | November–December | November–December | December | ||
| Cooling Period | June–September | May–October | April–October | April–November | January–December |
Table 5.
Details of indoor heat generation.
| AC①: Two-career | −5 | 6 | 7 | 8 | 9 | 10 | 11 | 12 | 13 | 14 | 15 | 16 | 17 | 18 | 19 | 20 | 21 | 22 | 23− |
| LD | 16 | 354 | 119 | 16 | 209 | 240 | 387 | 593 | 270 | 16 | |||||||||
| K | 60 | 711 | 353 | 126 | 951 | 353 | 126 | 60 | |||||||||||
| Child’s Room | 0 | ||||||||||||||||||
| Master Room | 106 | 64 | 0 | 132 | 106 | ||||||||||||||
| Bathroom | 0 | 137 | 133 | 0 | |||||||||||||||
| Changing Room | 0 | 346 | 47 | 0 | 153 | 0 | |||||||||||||
| AC②: Family | −5 | 6 | 7 | 8 | 9 | 10 | 11 | 12 | 13 | 14 | 15 | 16 | 17 | 18 | 19 | 20 | 21 | 22 | 23− |
| LD | 16 | 375 | 213 | 269 | 69 | 158 | 128 | 69 | 77 | 239 | 411 | 676 | 334 | 256 | 16 | ||||
| K | 60 | 637 | 384 | 126 | 384 | 126 | 1101 | 412 | 126 | 60 | |||||||||
| Child’s Room | 44 | 33 | 51 | 0 | 40 | 117 | 0 | 11 | 44 | ||||||||||
| Master Room | 106 | 135 | 0 | 28 | 0 | 57 | 0 | 132 | 106 | ||||||||||
| Bathroom | 0 | 72 | 271 | 0 | |||||||||||||||
| Changing Room | 0 | 297 | 126 | 0 | |||||||||||||||
| AC③: Aging Family | −5 | 6 | 7 | 8 | 9 | 10 | 11 | 12 | 13 | 14 | 15 | 16 | 17 | 18 | 19 | 20 | 21 | 22 | 23− |
| AC④: Continuous | |||||||||||||||||||
| LD | 16 | 283 | 391 | 150 | 74 | 98 | 223 | 146 | 86 | 109 | 239 | 108 | 356 | 316 | 353 | 220 | 16 | ||
| K | 60 | 510 | 351 | 126 | 323 | 126 | 720 | 126 | 351 | 126 | 60 | ||||||||
| Child’s Room | 0 | ||||||||||||||||||
| Master Room | 88 | 109 | 0 | 12 | 37 | 0 | 25 | 0 | 44 | 88 | |||||||||
| Bathroom | 0 | 129 | 0 | 129 | 0 | ||||||||||||||
| Changing Room | 0 | 278 | 45 | 77 | 0 | ||||||||||||||
*AC: Air Conditioning; LD: Living Room and Dining Room; K: Kitchen Room.
Table 6.
AC Operating Schedules.
| AC①: Two-career | 1 | 2 | 3 | 4 | 5 | 6 | 7 | 8 | 9 | 10 | 11 | 12 | 13 | 14 | 15 | 16 | 17 | 18 | 19 | 20 | 21 | 22 | 23 | 24 | □ |
| Living Room | □ | □ | □ | □ | □ | □ | □ | □ | □ | □ | □ | □ | □ | □ | □ | □ | □ | □ | □ | □ | □ | □ | □ | □ | 6 h |
| Master Room | □ | □ | □ | □ | □ | □ | □ | □ | □ | □ | □ | □ | □ | □ | □ | □ | □ | □ | □ | □ | □ | □ | □ | □ | 2 h |
| Child’s Room | □ | □ | □ | □ | □ | □ | □ | □ | □ | □ | □ | □ | □ | □ | □ | □ | □ | □ | □ | □ | □ | □ | □ | □ | 0 h |
| The Others | □ | □ | □ | □ | □ | □ | □ | □ | □ | □ | □ | □ | □ | □ | □ | □ | □ | □ | □ | □ | □ | □ | □ | □ | 0 h |
| AC②: Family | 1 | 2 | 3 | 4 | 5 | 6 | 7 | 8 | 9 | 10 | 11 | 12 | 13 | 14 | 15 | 16 | 17 | 18 | 19 | 20 | 21 | 22 | 23 | 24 | □ |
| Living Room | □ | □ | □ | □ | □ | □ | □ | □ | □ | □ | □ | □ | □ | □ | □ | □ | □ | □ | □ | □ | □ | □ | □ | □ | 11 h |
| Master Room | □ | □ | □ | □ | □ | □ | □ | □ | □ | □ | □ | □ | □ | □ | □ | □ | □ | □ | □ | □ | □ | □ | □ | □ | 2 h |
| Child’s Room | □ | □ | □ | □ | □ | □ | □ | □ | □ | □ | □ | □ | □ | □ | □ | □ | □ | □ | □ | □ | □ | □ | □ | □ | 3 h |
| The Others | □ | □ | □ | □ | □ | □ | □ | □ | □ | □ | □ | □ | □ | □ | □ | □ | □ | □ | □ | □ | □ | □ | □ | □ | 0 h |
| AC③: Aging Family | 1 | 2 | 3 | 4 | 5 | 6 | 7 | 8 | 9 | 10 | 11 | 12 | 13 | 14 | 15 | 16 | 17 | 18 | 19 | 20 | 21 | 22 | 23 | 24 | □ |
| Living Room | □ | □ | □ | □ | □ | □ | □ | □ | □ | □ | □ | □ | □ | □ | □ | □ | □ | □ | □ | □ | □ | □ | □ | □ | 15 h |
| Master Room | □ | □ | □ | □ | □ | □ | □ | □ | □ | □ | □ | □ | □ | □ | □ | □ | □ | □ | □ | □ | □ | □ | □ | □ | 11 h |
| Child’s Room | □ | □ | □ | □ | □ | □ | □ | □ | □ | □ | □ | □ | □ | □ | □ | □ | □ | □ | □ | □ | □ | □ | □ | □ | 0 h |
| The Others | □ | □ | □ | □ | □ | □ | □ | □ | □ | □ | □ | □ | □ | □ | □ | □ | □ | □ | □ | □ | □ | □ | □ | □ | 0 h |
| AC④: Continuous | 1 | 2 | 3 | 4 | 5 | 6 | 7 | 8 | 9 | 10 | 11 | 12 | 13 | 14 | 15 | 16 | 17 | 18 | 19 | 20 | 21 | 22 | 23 | 24 | □ |
| Living Room | □ | □ | □ | □ | □ | □ | □ | □ | □ | □ | □ | □ | □ | □ | □ | □ | □ | □ | □ | □ | □ | □ | □ | □ | 24 h |
| Master Room | □ | □ | □ | □ | □ | □ | □ | □ | □ | □ | □ | □ | □ | □ | □ | □ | □ | □ | □ | □ | □ | □ | □ | □ | 24 h |
| Child’s Room | □ | □ | □ | □ | □ | □ | □ | □ | □ | □ | □ | □ | □ | □ | □ | □ | □ | □ | □ | □ | □ | □ | □ | □ | 24 h |
| The Others | □ | □ | □ | □ | □ | □ | □ | □ | □ | □ | □ | □ | □ | □ | □ | □ | □ | □ | □ | □ | □ | □ | □ | □ | 24 h |
| ※□Heating: 20 °C (Nov. to Mar.) □□Cooling: 26 °C (Jun. to Sep.) | □ | AC on | □ | AC off | |||||||||||||||||||||
© 2019 by the authors. Licensee MDPI, Basel, Switzerland. This article is an open access article distributed under the terms and conditions of the Creative Commons Attribution (CC BY) license (http://creativecommons.org/licenses/by/4.0/).
Share and Cite
MDPI and ACS Style
Wang, Y.; Fukuda, H. The Influence of Insulation Styles on the Building Energy Consumption and Indoor Thermal Comfort of Multi-Family Residences. Sustainability 2019, 11, 266. https://doi.org/10.3390/su11010266
AMA Style
Wang Y, Fukuda H. The Influence of Insulation Styles on the Building Energy Consumption and Indoor Thermal Comfort of Multi-Family Residences. Sustainability. 2019; 11(1):266. https://doi.org/10.3390/su11010266
Chicago/Turabian StyleWang, Yupeng, and Hiroatsu Fukuda. 2019. "The Influence of Insulation Styles on the Building Energy Consumption and Indoor Thermal Comfort of Multi-Family Residences" Sustainability 11, no. 1: 266. https://doi.org/10.3390/su11010266
Note that from the first issue of 2016, this journal uses article numbers instead of page numbers. See further details here.