Spatial Organization of Hierarchical Medical Services within the City Proper of Tianjin, China: Towards Efficient Medical Alliances

1
Zhou Enlai School of Government, Nankai University, Tianjin 300350, China
2
Experimental Teaching Center of Applied Social Science, Nankai University, Tianjin 300350, China
3
School of Public Affairs, Zhejiang University, Hangzhou 310058, China
4
School of Social & Political Sciences, University of Glasgow, Glasgow G12 8RS, UK
*
Author to whom correspondence should be addressed.
Sustainability 2019, 11(1), 229; https://doi.org/10.3390/su11010229
Submission received: 6 November 2018
/
Revised: 18 December 2018
/
Accepted: 24 December 2018
/
Published: 4 January 2019
Abstract
:To address the low performance of health care service delivery in the half-market system, the Chinese government has begun to advocate the medical alliance (MA) recently. Instead of strict regulations on the procedure of diagnosis and treatment, flexible resource sharing among medical institutions of different grades inside each MA is encouraged. By now, many attempts have been made for MA establishment from different perspectives, but there is no effective model maturely developed. For the promotion of the spatial accessibility to medical services at different levels, it is important to organize the hierarchial medial services according to the distributions of different grades of health care facilities in a city. With the city proper of Tianjin as the study case, we explored the optimal establishment of MAs using the geographic information system (GIS). By means of the Voronoi Diagrams, the service regions of different medical institutions were precisely defined and the organizational structure of hierarchical medical services in MAs was determined. Through interpolation analysis, accessibility to different levels of medical services was measured, and on this basis, discussions were conducted on the service efficiency of the MAs. According to the results from Tianjin, (1) under the proposed organizational model for MAs, the fit of the service regions of the first grade and the other two higher grades of medical institutions was good. but the fit of the second and the third grade medical institutions was insufficient. (2) Although the overall service efficiency was excellent, there were still deficiencies in a number of the MAs. (3) Increasing the number of second and third grade medical institutions in specific regions near the city’s edge, as well as the number of first grade institutions, could further improve the performance of hierarchical medical services.
1. Introduction
Public health is one of the key concerns of sustainable development. Over the past few decades, China has witnessed a remarkable growth in economy and a great rise in the living standards of the people [1,2,3]. In line with socioeconomic progress, more public funds are now being poured into health care in an attempt to provide the society with enriched medical services. However, improvement of physical conditions does not essentially lead to the efficient operation of a system [4]. The poor access to medical services is still widely criticized by the public, especially in big cities [5,6]. To promote the performance of health care service delivery, a number of reform programs have been implemented [7,8,9,10], including the introduction of prepaid medical insurance, the establishment of health care cloud platforms, and the rigorous development of community health care. Nevertheless, restricted by biased medical resource allocation existing at different levels of health care infrastructure and by patients’ pursuing high-quality medical treatments, most of the reforms are hard to achieve the expected results in the end [11,12,13].
Faced with the irreconcilable disparity between supply and demand, effective management of medical resources is always of particular importance in high-performance health care service [14,15,16]. In western countries, hierarchical diagnosis and treatment has long been a part of the different grades of health care institutions [17], for the best allocation of medical resources for curing both common illnesses and serious diseases [18,19,20]. However, when similar work was planned and carried out in China, many systematic problems were encountered. Even if hierarchical infrastructures already existed [21], the marketization of the health care system and patient’s freedom of choice created a notable contrast between the insufficient supply of medical services in large hospitals and the low rates of utilization of medical resources at community clinics [22,23].
As an alternative measure to push through hierarchical medical services in the half-market system, the medical alliance (MA) has been especially advocated by the Chinese government in recent years [24]. MAs are cooperative associations of medical institutions in certain regions. Instead of strict regulations on procedures of diagnosis and treatment, flexible resource sharing is encouraged among the different grade medical institutions inside each MA [25,26]. In response to the call for medical reform, many cities have made attempts to set up MAs [27,28,29]. For example, Beijing initially established the MA system for patient referral, professional support, and drug delivery; Shanghai set up more than 40 MAs, with an average of one in each administrative district, for the promotion of connections between large hospitals and community clinics; Shenzhen formed the biggest MA in China, involving more than 100 institution members from the Futian district; and Tianjin set up a number of regional MAs in 14 administrative districts for the medical diagnosis and treatment with effective upper and lower linkages. Some MAs are big and others are small; sometimes there are several MAs in one administrative district and other times one MA may cover several administrative districts. No effective model has yet been developed for the establishment of MAs and there continue to be hardly any criterion for judging the efficiency of existing MAs [30].
Except from the medical capability and environment in the traditional sense, distance is a determinant factor of health care facility utility [31,32]. No matter for adults or children, the proximity to a hospital is always important when seeking and receiving medical treatments [33,34,35]. To minimize the travel time for both routine and emergency cures, reducing, as much as possible, the spatial distances between the dwellings of residents and medical infrastructures is a significant task of health care service delivery [36,37,38]. Thus, the establishment of MAs cannot neglect the locations and spatial relationships of medical institutions. The rational organization of hierarchical medical services in the geographical space is the basis to ensure the high efficiency of MAs.
For the promotion of accessibility to different levels of medical services inside MAs, this paper explores the optimal organization of hierarchical medical services in the city from a spatial perspective. With the city proper of Tianjin as the study case, it attempts to contribute to the current literature in the following ways: (1) according to the spatial distribution of different grade health care facilities, Voronoi diagrams were generated and overlaid to determine the organizational structure of hierarchical medical services in MAs; (2) with reference to the accessibility to different levels of medical services within the territories of MAs, the practical service efficiencies of MAs were evaluated and discussed.
2. Materials and Methods
2.1. Materials Section
As one of the four municipalities under direct control of the central government and the northern economic center of China, Tianjin is a typical fast developing big city with more than 15 million people. Compared with the environs and the outer suburbs, the six districts (Heping, Nankai, Hebei, Hedong, Hexi, Hongqiao) that compose the city proper are the core regions, with the most dense populations and well-developed infrastructure (see Figure 1). Considering its merits in the health care environment, the city proper of Tianjin was chosen as the case study of our research.
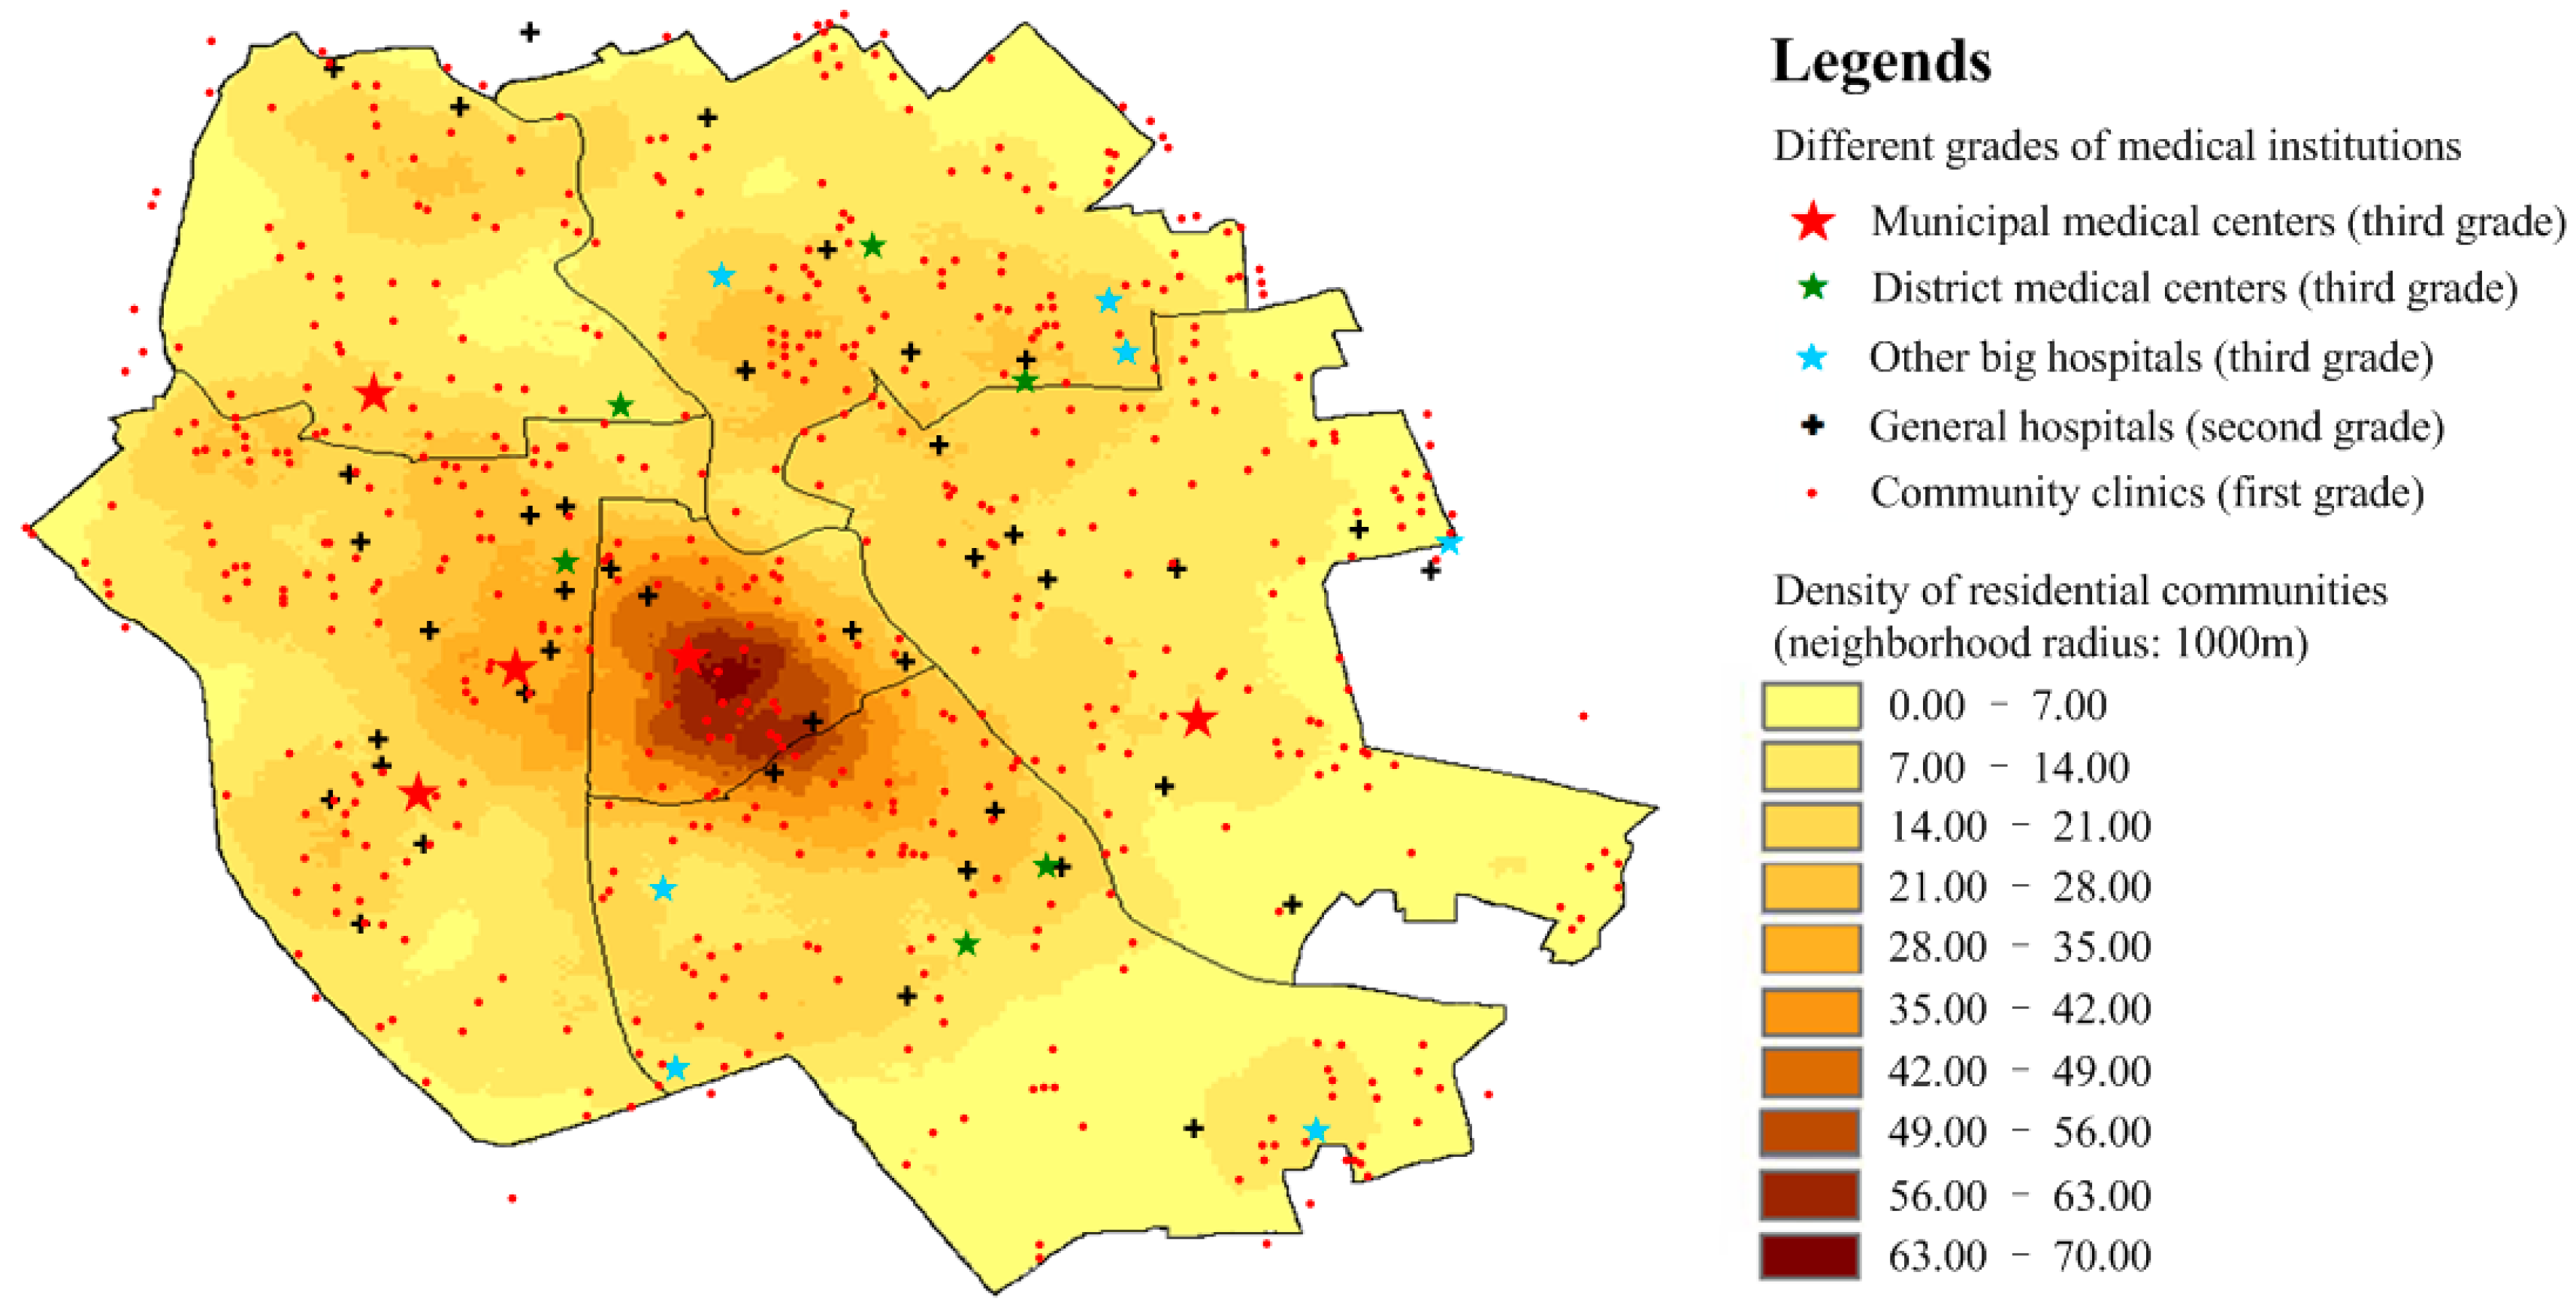
The medical institutions in China are generally divided into three grades. From the first grade to the third grade, the service capacity of the institutions becomes increasingly stronger. According to the designated medical institution directory produced by the Municipal Human Resources and Social Security Bureau, in and near the city proper of Tianjin, there are a total of:
- 18 third grade medical institutions (municipal medical centers, district medical centers, and other big hospitals),
- 46 second grade medical institutions (general hospitals),
- 655 first grade medical institutions (community clinics).
Meanwhile, according to the statistics of the local Civil Affairs Bureau, there are 2653 residential communities corresponding to six administrative districts. With the point of interest (POI) data obtained from navigation maps, it was possible to determine the exact spatial distributions of medical institutions and residential communities in the area (see Figure 2).
According to the supporting documents of the standards for public service facilities [39], health care and the medical service system construction plan [40], the standard service radii of the third grade, second grade, and first grade medical institutions are about 3000 m, 2000 m, and 500 m respectively. For intuitive descriptions of the opportunities to acquire health care services in daily life, the coverage frequency index (CFI) was calculated via the following function:
where CFI(p) stands for coverage frequency index at the point of p; N1, N2, and N3 are the total number of first, second, and third grade medical institutions; C1(n,p), C2(m,p), and C3(t,p) are the status descriptors indicating whether the point p was within the service radius range of n first grade, m second grade, and t third grade medical institutions, respectively.
As a parameter that reflects the richness of medical resources in the local area, the CFI records the times that a specific location is covered by the service scope of various medical institutions. Indicated by the spatial representation of CFI, the level of health care resources generally decreases from the city center to the outskirts (see Figure 3). While there are still some places with very low CFI (<1), such as the southeast of the Hedong district, the south of the Hexi district, the border area between the Hexi district and the Nankai district, and the west of both the Nankai and the Hongqiao district, over 90% of the city proper has a high CFI (>2). However, good foundations do not necessarily mean good services. To ensure high-efficiency health care services in the city proper, it is critical to organize medical resources in a sensible way.
2.2. Methods Section
2.2.1. Spatial Organization of Medical Services Based on the Voronoi Diagram
The Voronoi diagram is a popular tool in computational geometry [41]. According to the principle of closest proximity, it divides an area into a number of polygonal regions that illustrate the vicinity of any point against all the others. Due to this capability to effectively demarcate the borders of targeted objects, Voronoi diagrams are widely used in spatial structure analyses of activities and interactions [42,43,44].
With consideration for spatial accessibility, the most efficient health care services are obviously those delivered from the nearest medical institutions. Thus, for optimal organization of medical services, we propose figuring out the service scopes and spatial relationships of various medical institutions by means of the Voronoi diagrams. With reference to the relative locations of medical institutions, the geography of a city is divided into different medical service regions. Each region covers all the points that are closest to a certain medical institution, and the size of the region is mainly determined by the distribution density of similar institutions in the surrounding area. According to the grading of medical institutions, different levels of medical service regions can be expressed with following formulas:
where Vi stands for the medical service regions of all the institutions of grade i; Vori,j stands for the medical service region of the grade i institution j, Pi refers to the set of all the medical institutions of grade i, x refers to an arbitrary point in the geographical space, pi,j and pi,k are the locations of the grade i institutions j and k, and d(x,pi,j) and d(x,pi,k) represent the Euclidean distances from point x to pi,j and pi,k.
Due to the differences in service capability and regional scope, medical institutions of different grades can constitute a network of medical services. As the provider of the highest level health care services, the third grade medical institutions generally determine the territories of MAs. Meanwhile, the spatial coverage of mid-level and lowest level medical services within each MA territory are mainly defined by the Voronoi diagrams of the second and first grade institutions.
2.2.2. Measuring Accessibility and Evaluating the Service Efficiency of MAs
Under the specified organization of medical services, the efficiency of each MA is evaluated with reference to the spatial accessibility to the involved medical institutions. To figure out the effective service range of a MA, the accessibility index at any point of a territory can be calculated and, based on the spatial distribution of residential communities, the practical effects of medical services at different levels can be assessed to score the MA.
The measurement of accessibility can be calculated via a number of methods [45] and for different precisions [46]. Apart from the works to decide the travel needs of patients, the supply levels of health care services, and the opportunity for service acquirement [47], we focused on the maximum coverage of medical services. For simplicity, we ignored all the local features (e.g., variations in road density, traffic conditions, and service demands) within the MA territory, spatial interpolation analysis was adopted to calculate the service accessibility index. The availability of medical services from all the related facilities was taken into account. With the basic assumption that the accessibility metrics decreased with increasing distance [48,49], the inverse distance weighted (IDW) interpolation method [50] was employed as a means to quantitatively measure the accessibility of each medical institution at any point. The maximum accessibility to different medical institutions of the same grade was regarded as the accessibility to the corresponding level of medical service. Thus, the accessibility indexes can be calculated with the following interpolation function:
where ai(S0) stands for the accessibility index for the medical service provided by the i grade medical institutions at a location S0, IDWi,j(S0) stands for the IDW interpolation value of the accessibility to the i grade medical institution j at the location S0, ci,j is the service provision capability of the i grade medical institution j, di,j(S0) is the distance between S0 and the i grade medical institution j, and p (≥0) refers to inverse distance weighing power that determines the decreasing rate of service capability with distance.
With reference to the accessibility index obtained through the spatial interpolation analysis and the service standard of the medical institution (see Section 2.1 for details), it was simple to determine the proportion of residential communities with high accessibility (above the standard) to different levels of health care services within the territories of the MAs. In view of the ratios of residential communities with advantageous conditions concerning medical services, the efficiency of each MA was evaluated with the following formulas:
where Op stands for all the residential communities within the service region of the p MA, Ch(Op) refers to the proportions of residential communities with high accessibility to health care services provided by the h grade medical institutions, x is any one residential community in Op, ah(x) is the accessibility index for the h grade medical institutions at the location of the x community, STDh is the standard accessibility for the h grade medical institutions, eh(Op) stands for the service efficiency score of the h grade medical institutions on the Op, and Num(Ch(Op)) and Num(Op) are the numbers of privileged communities Ch(Op) and total communities Op.
3. Results
3.1. Organizational Structure Determination of Hierarchical Medical Services
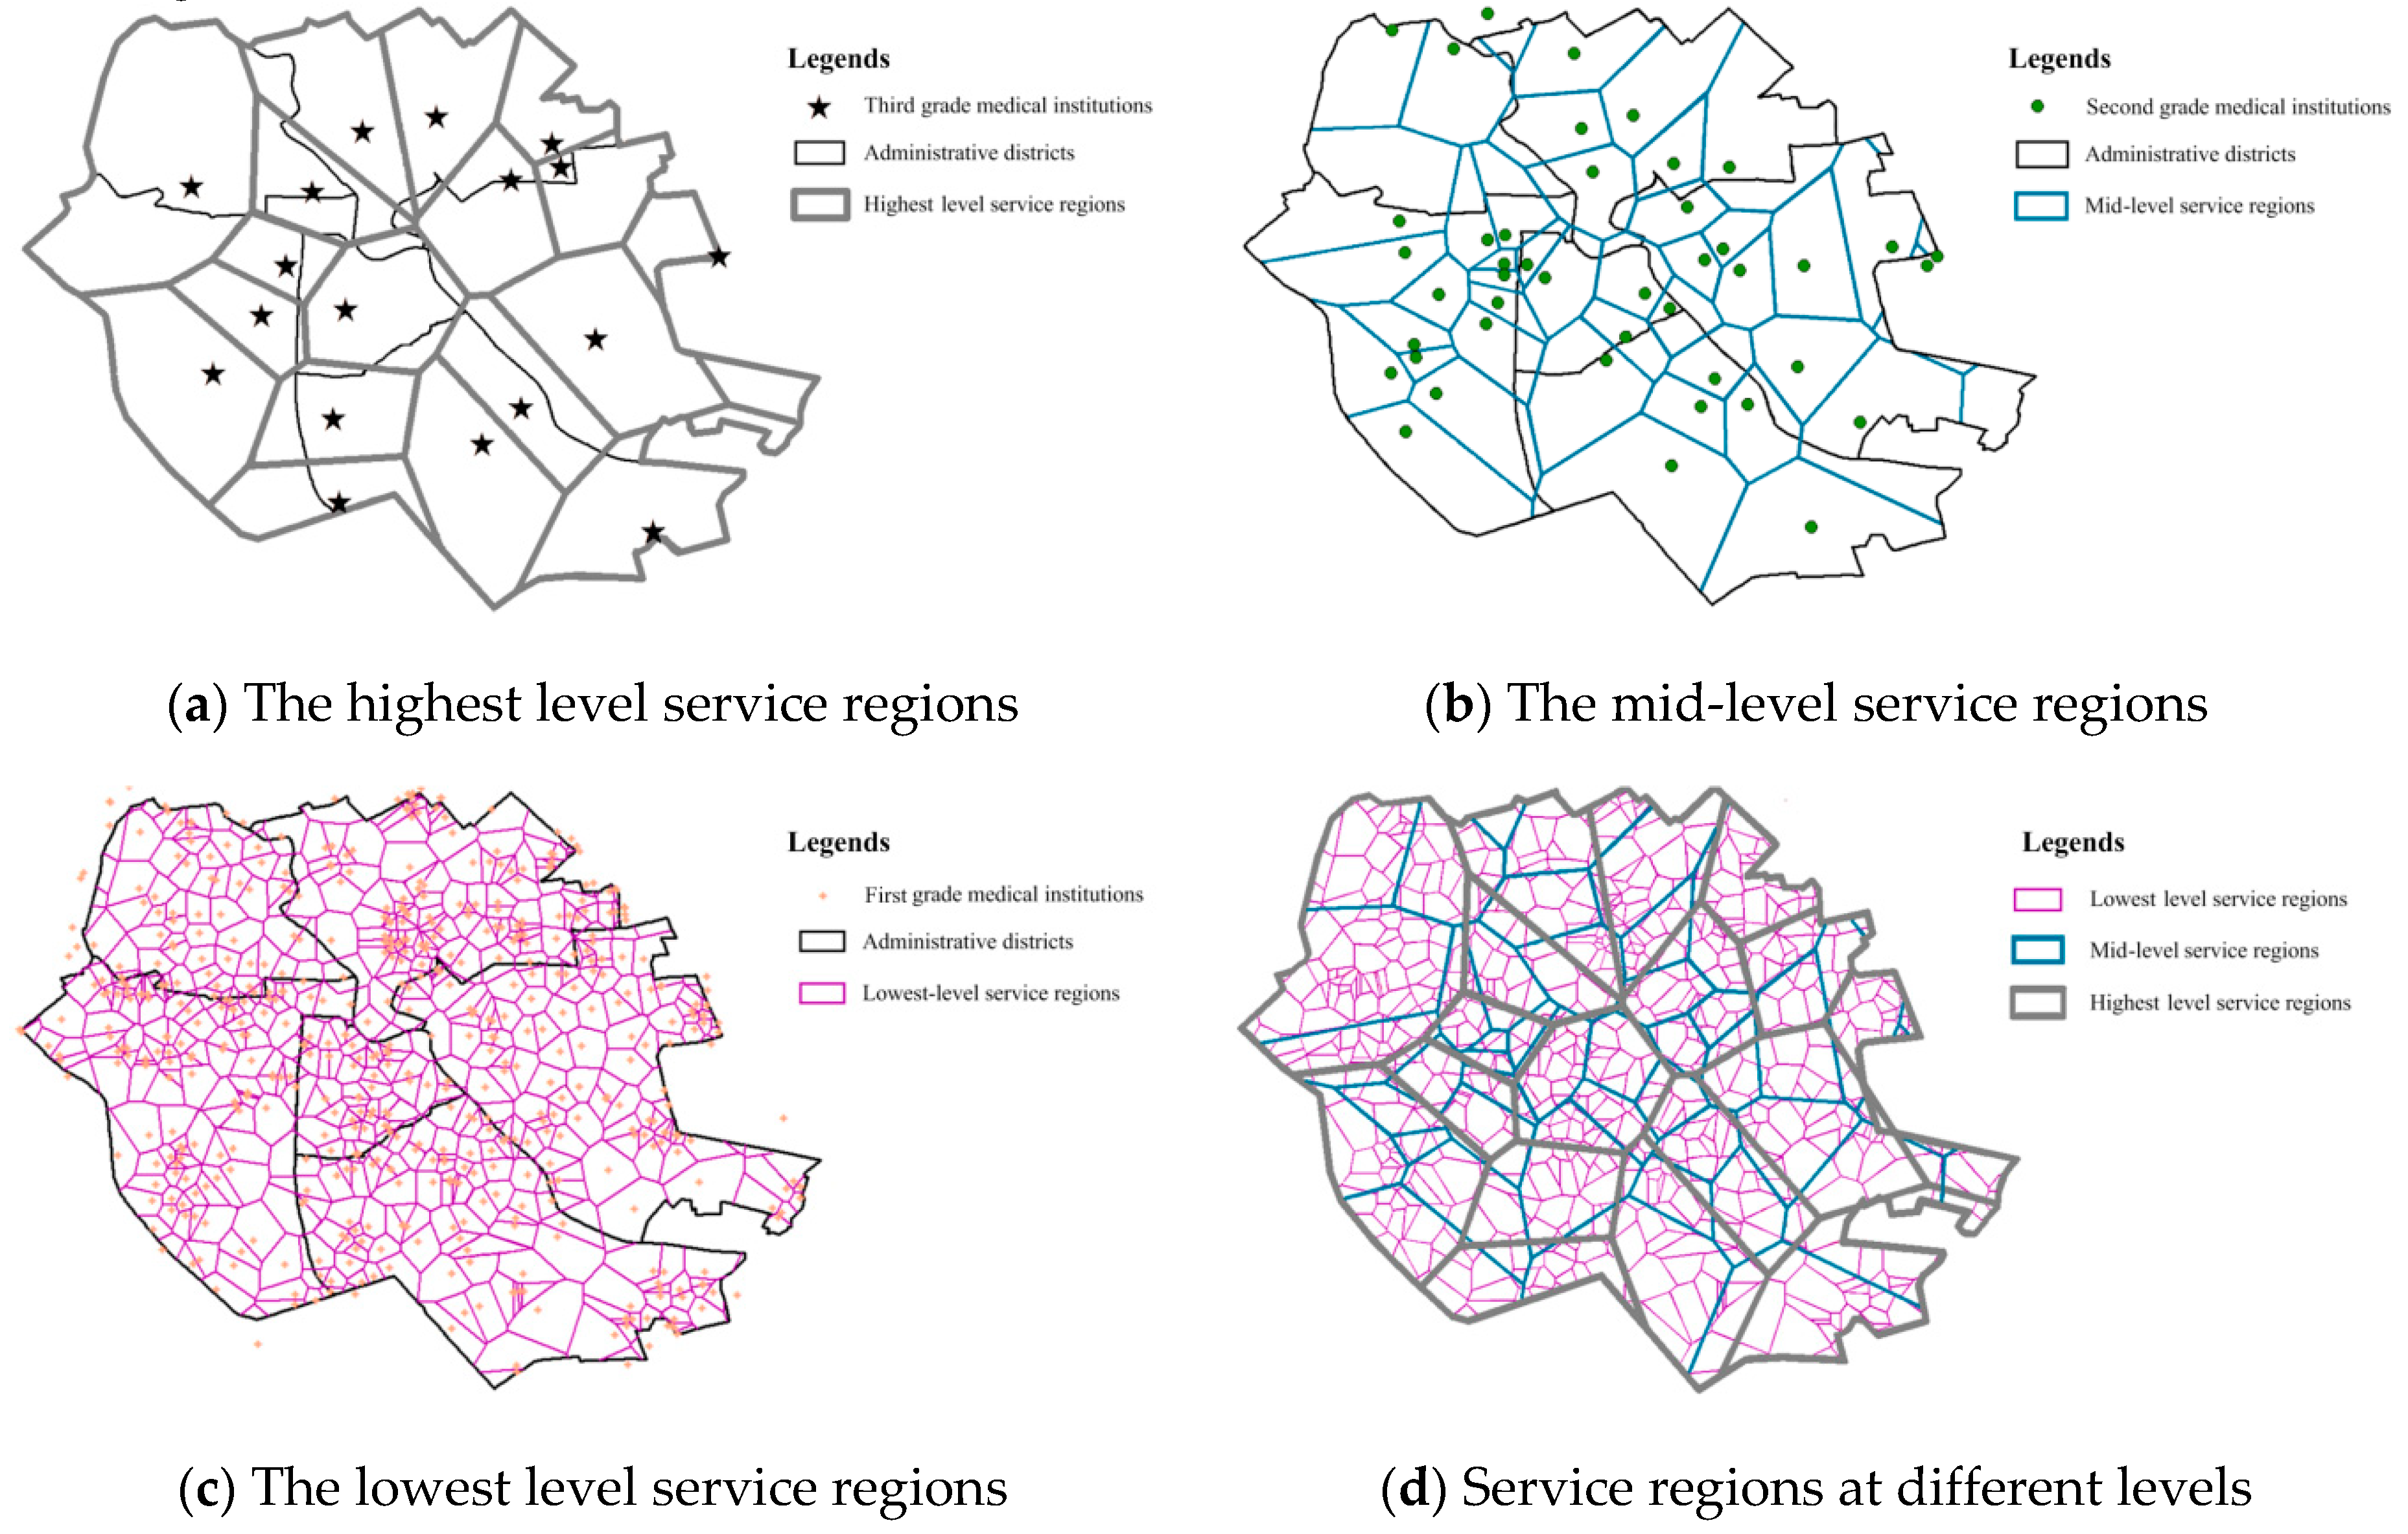
To decide the proper service regions of MAs in the city proper of Tianjin, the Voronoi diagrams were generated among different grade medical institutions:
- Based on the spatial distribution of the third grade medical institutions, the geographical space of the city proper was roughly divided into 18 different zones, representing the highest level service regions of MAs (see Figure 4a). As it was hard to ensure the coincidence between the borders of service regions and boundaries of administrative districts, especially when the medical institutions were located near the boundaries of administrative districts, many MAs inevitably involved trans-regional medical service delivery.
- Similarly, the mid-level service regions of MAs were delimited with reference to the spatial distribution of second grade medical institutions (see Figure 4b). Due to the unequal distribution of hospitals, the service regions varied greatly in the city proper. The organizational structure of the mid-level service regions generally conformed to the decreasing trend of urbanization level from the city center to the outskirts. While small service regions were brought about by the high density of hospitals located in the heartland of the city, most of the medical institutions had to serve comparatively larger areas in the peripheral regions.
- The lowest level service regions of MAs were determined by the distribution of first grade medical institutions and reflected the spatial structure of primary health care service delivery in the city proper (see Figure 4c). Benefiting from social infrastructure developments at the neighborhood level in recent decades, the high density of community clinics really contributed to the equalization of health care services in the city. Except for some parts at the southeast corner, the area of most service regions was small enough to ensure accessibility to daily medical treatments within the neighborhoods.
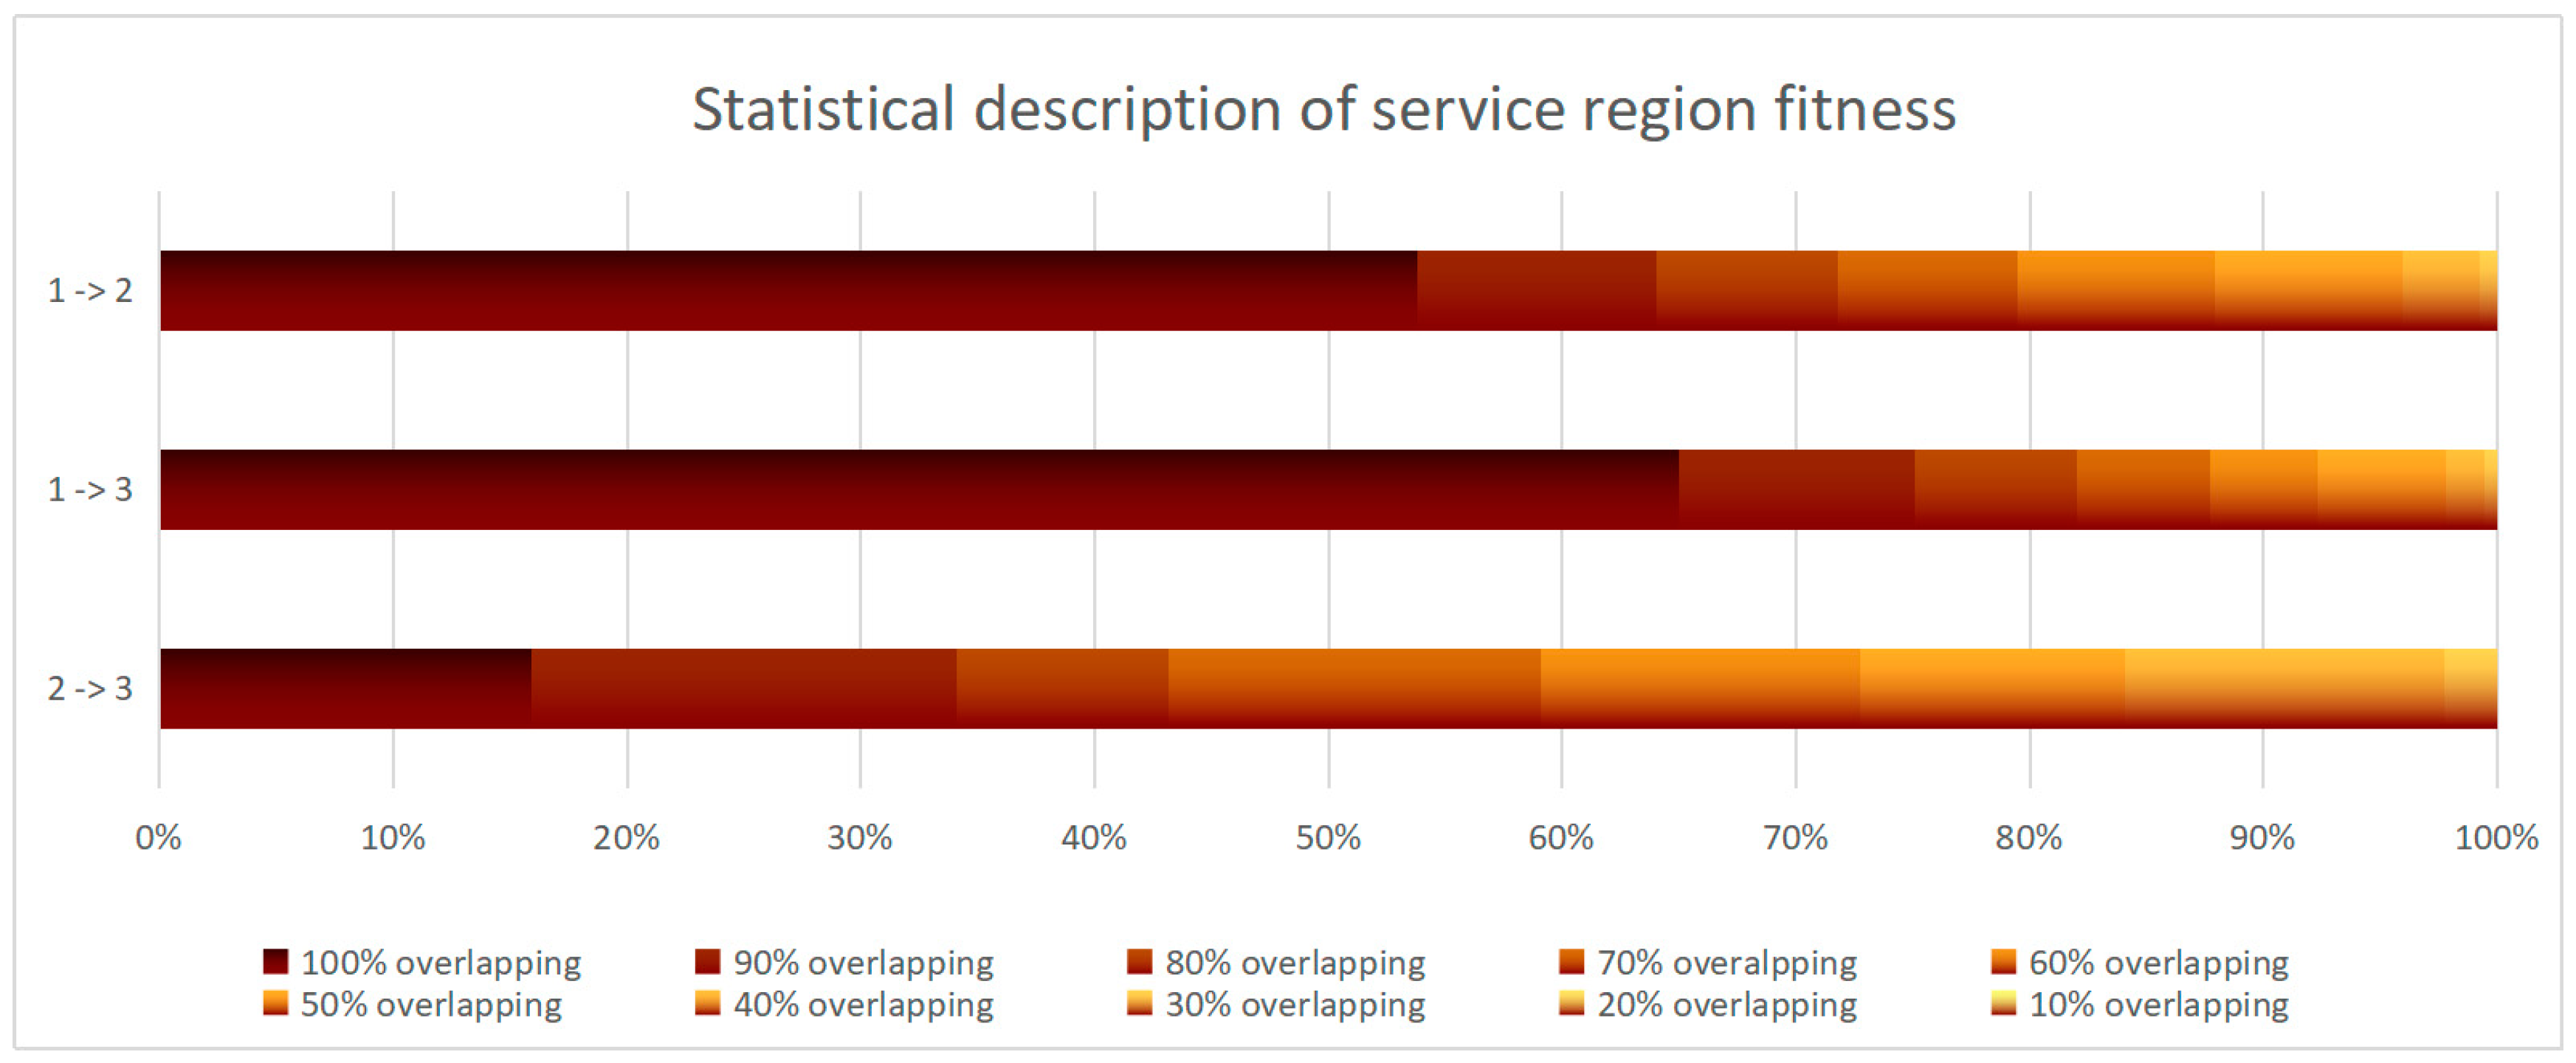
Overlapping the service regions at different levels, the spatial compatibility of different grade medical institutions in the provision of hierarchical medical services was demonstrated (see Figure 4d). Due to the high density and approximately uniform distribution of the first grade medical institutions, most of the lowest level service regions fit well within the service regions of higher levels. However, because of uncoordinated planning and the development of a hierarchical health care system [51], the fit of the service regions of the second and the third grade medical institutions was not so good.
According to the statistics (see Figure 5), about 90% of the service regions of the first grade medical institutions overlapped (≥60% overlapping) with the service regions of the higher level medical institutions, and between 50% and 60% of the service regions of the first grade medical institutions lay within the service regions of the second and third grade medical institutions. By contrast, 70% mostly overlapped but only 15% of the service regions of the second and the third grade medical institutions were completely covered. As indicated by the results, there was a good foundation for cooperation between the first grade medical institutions and the second and third grade institutions inside MAs, but the coordination between the second grade medical institutions and those of the third grade may face future challenges.
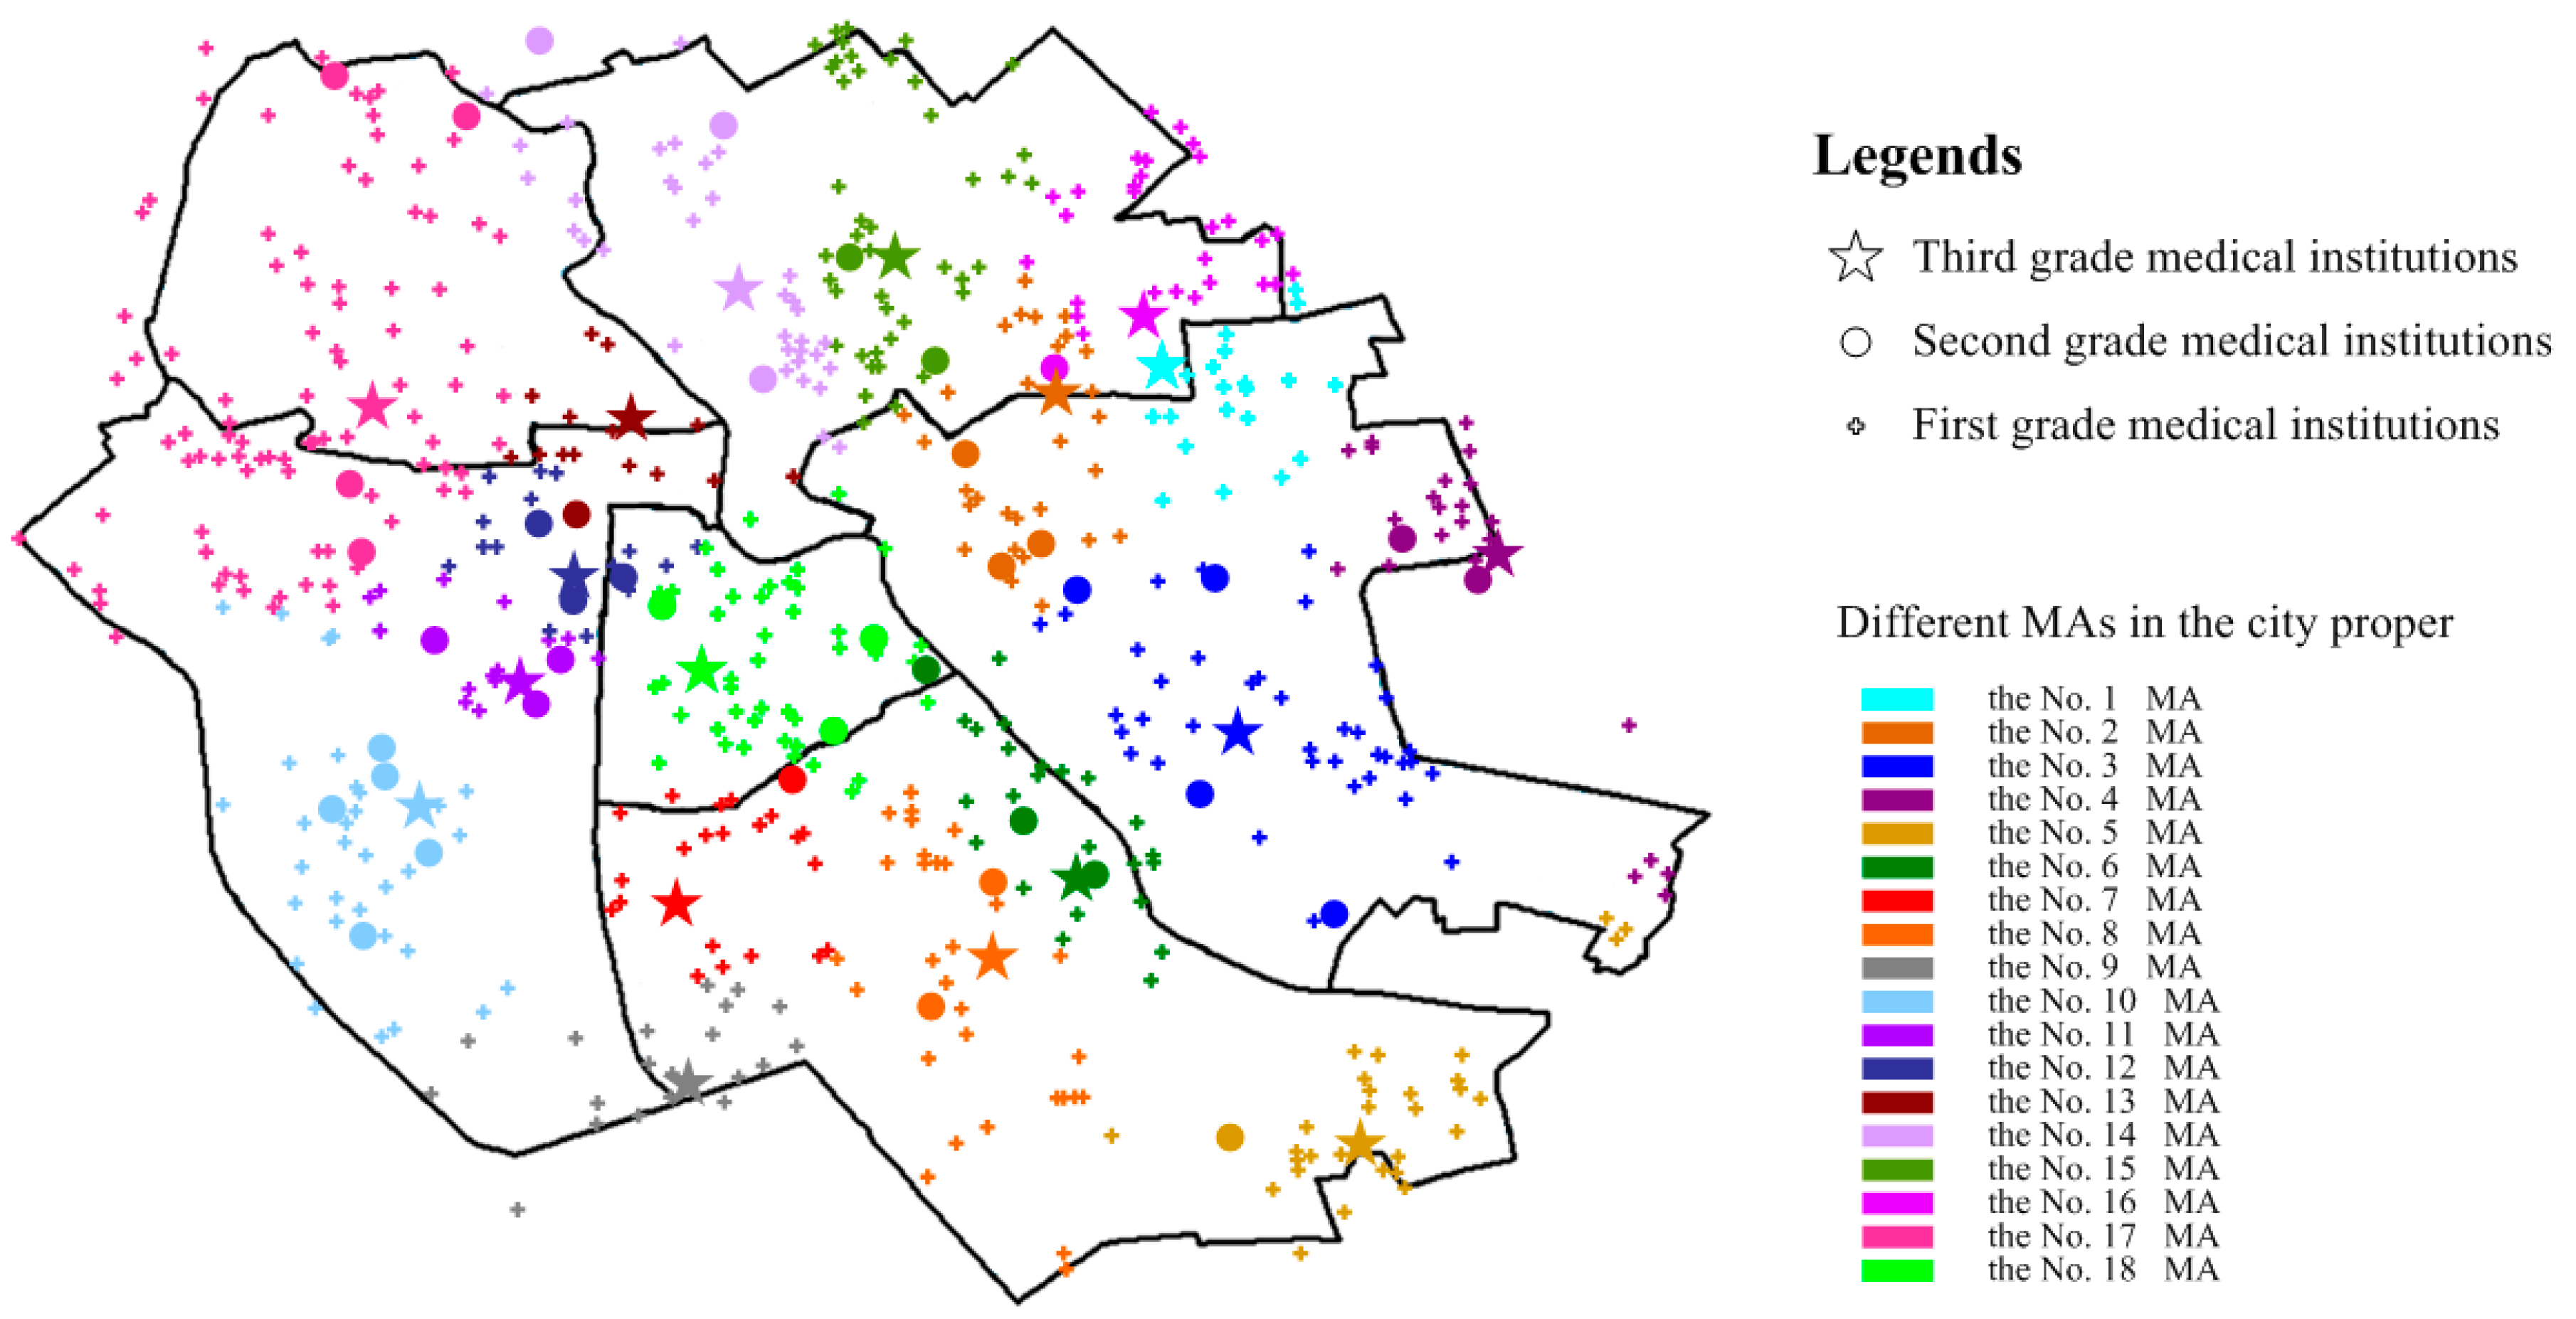
For the establishment of MAs with the best spatial accessibility to medical services at different levels, each of the first and second grade medical institutions were assigned to a specific third grade medical institution with a maximum ratio of overlap in the service region (see Figure 6). Influenced by a mixture of spatial factors, the sizes of the MAs obtained were actually different. Number 17 was the biggest, with one third grade medical institution, four second grade medical institutions, and eighty-nine first grade medical institutions covering most of the Hongqiao district and about a fifth of the Nankai district. In contrast, the No. 9 was the smallest, with one third grade medical institution, one second grade medical institution, and thirteen first grade medical institutions. In terms of organization, MA No. 10 involved five second grade medical institutions, and MA No. 2, No. 3, No. 6, No. 11, No. 12, No. 14, No. 17, and No. 18 involved more than three second grade medical institutions. Nevertheless, no second grade medical institutions were in MAs No. 1 or No. 9. The different spatial coverages and compositions of the MAs brought different service efficiencies.
3.2. Discussion of the Practical Service Efficiency of MAs
Ignoring the difference in service capability, ci,j, among the medical institutions of the same grade, the accessibility, ai(S0), to certain levels of medical service was only related to the distance factor, di,j(S0), (see Section 2.2.2 for details). Thus, through spatial interpolation analysis, the nearest distance to medical institutions was resolved as the direct indicator of accessibility for service efficiency evaluation of MAs in the city proper of Tianjin.
According to the interpolation result of spatial accessibility to third grade medical institutions, most of the city proper had good access to medical services (see Figure 7). Specifically, about 90% were within the warm colored area (≤3000 m standard service radius) of the third grade hospitals. With respect to the service scope of medical institutions, the residential communities within the small territories of the MAs always enjoyed more convenient medical services. On the contrary, the residential communities located in the large territories, especially in MA No. 4, No. 5, No. 8 and No. 17 at the northwest and southeast corners, sometimes suffered from poor accessibility to high-quality medical services.
Compared with good accessibility to the highest level medical services, the coverage of mid-level medical services decreased to some extent (see Figure 8). With reference to the standard service radius (≤2000 m) of the second grade medical institutions, about 85% was in warm colors. In addition, there were significant differences in the service effect both among and inside the MAs. While perfect spatial accessibility to the mid-level medical service was demonstrated in territories two, 11, and 12, poor accessibility was shown in the territories at the edge of the city proper, particularly MA No. 9. At the same time, the residential communities within the territory of MA No. 1, No. 7, No. 16, and No. 17 were partially well connected and partially poorly connected in terms of medical service.
In view of the service coverage, the regional difference of accessibility to the lowest level medical service was the smallest among all of the different grades (see Figure 9). Because of the small service scope and high density of community clinics, the warm colored areas (≤500 m standard service radius) accounted for over 90% of the whole area and were evenly distributed in the city proper. On one hand, the residential communities in most of the MA territories were able to enjoy high accessibility to the lowest level medical services. However, on the other hand, there were some places poorly connected to medical service in almost every territory, especially those of MA No. 4, No. 5, No. 7, No. 10, No. 11 and No. 14.
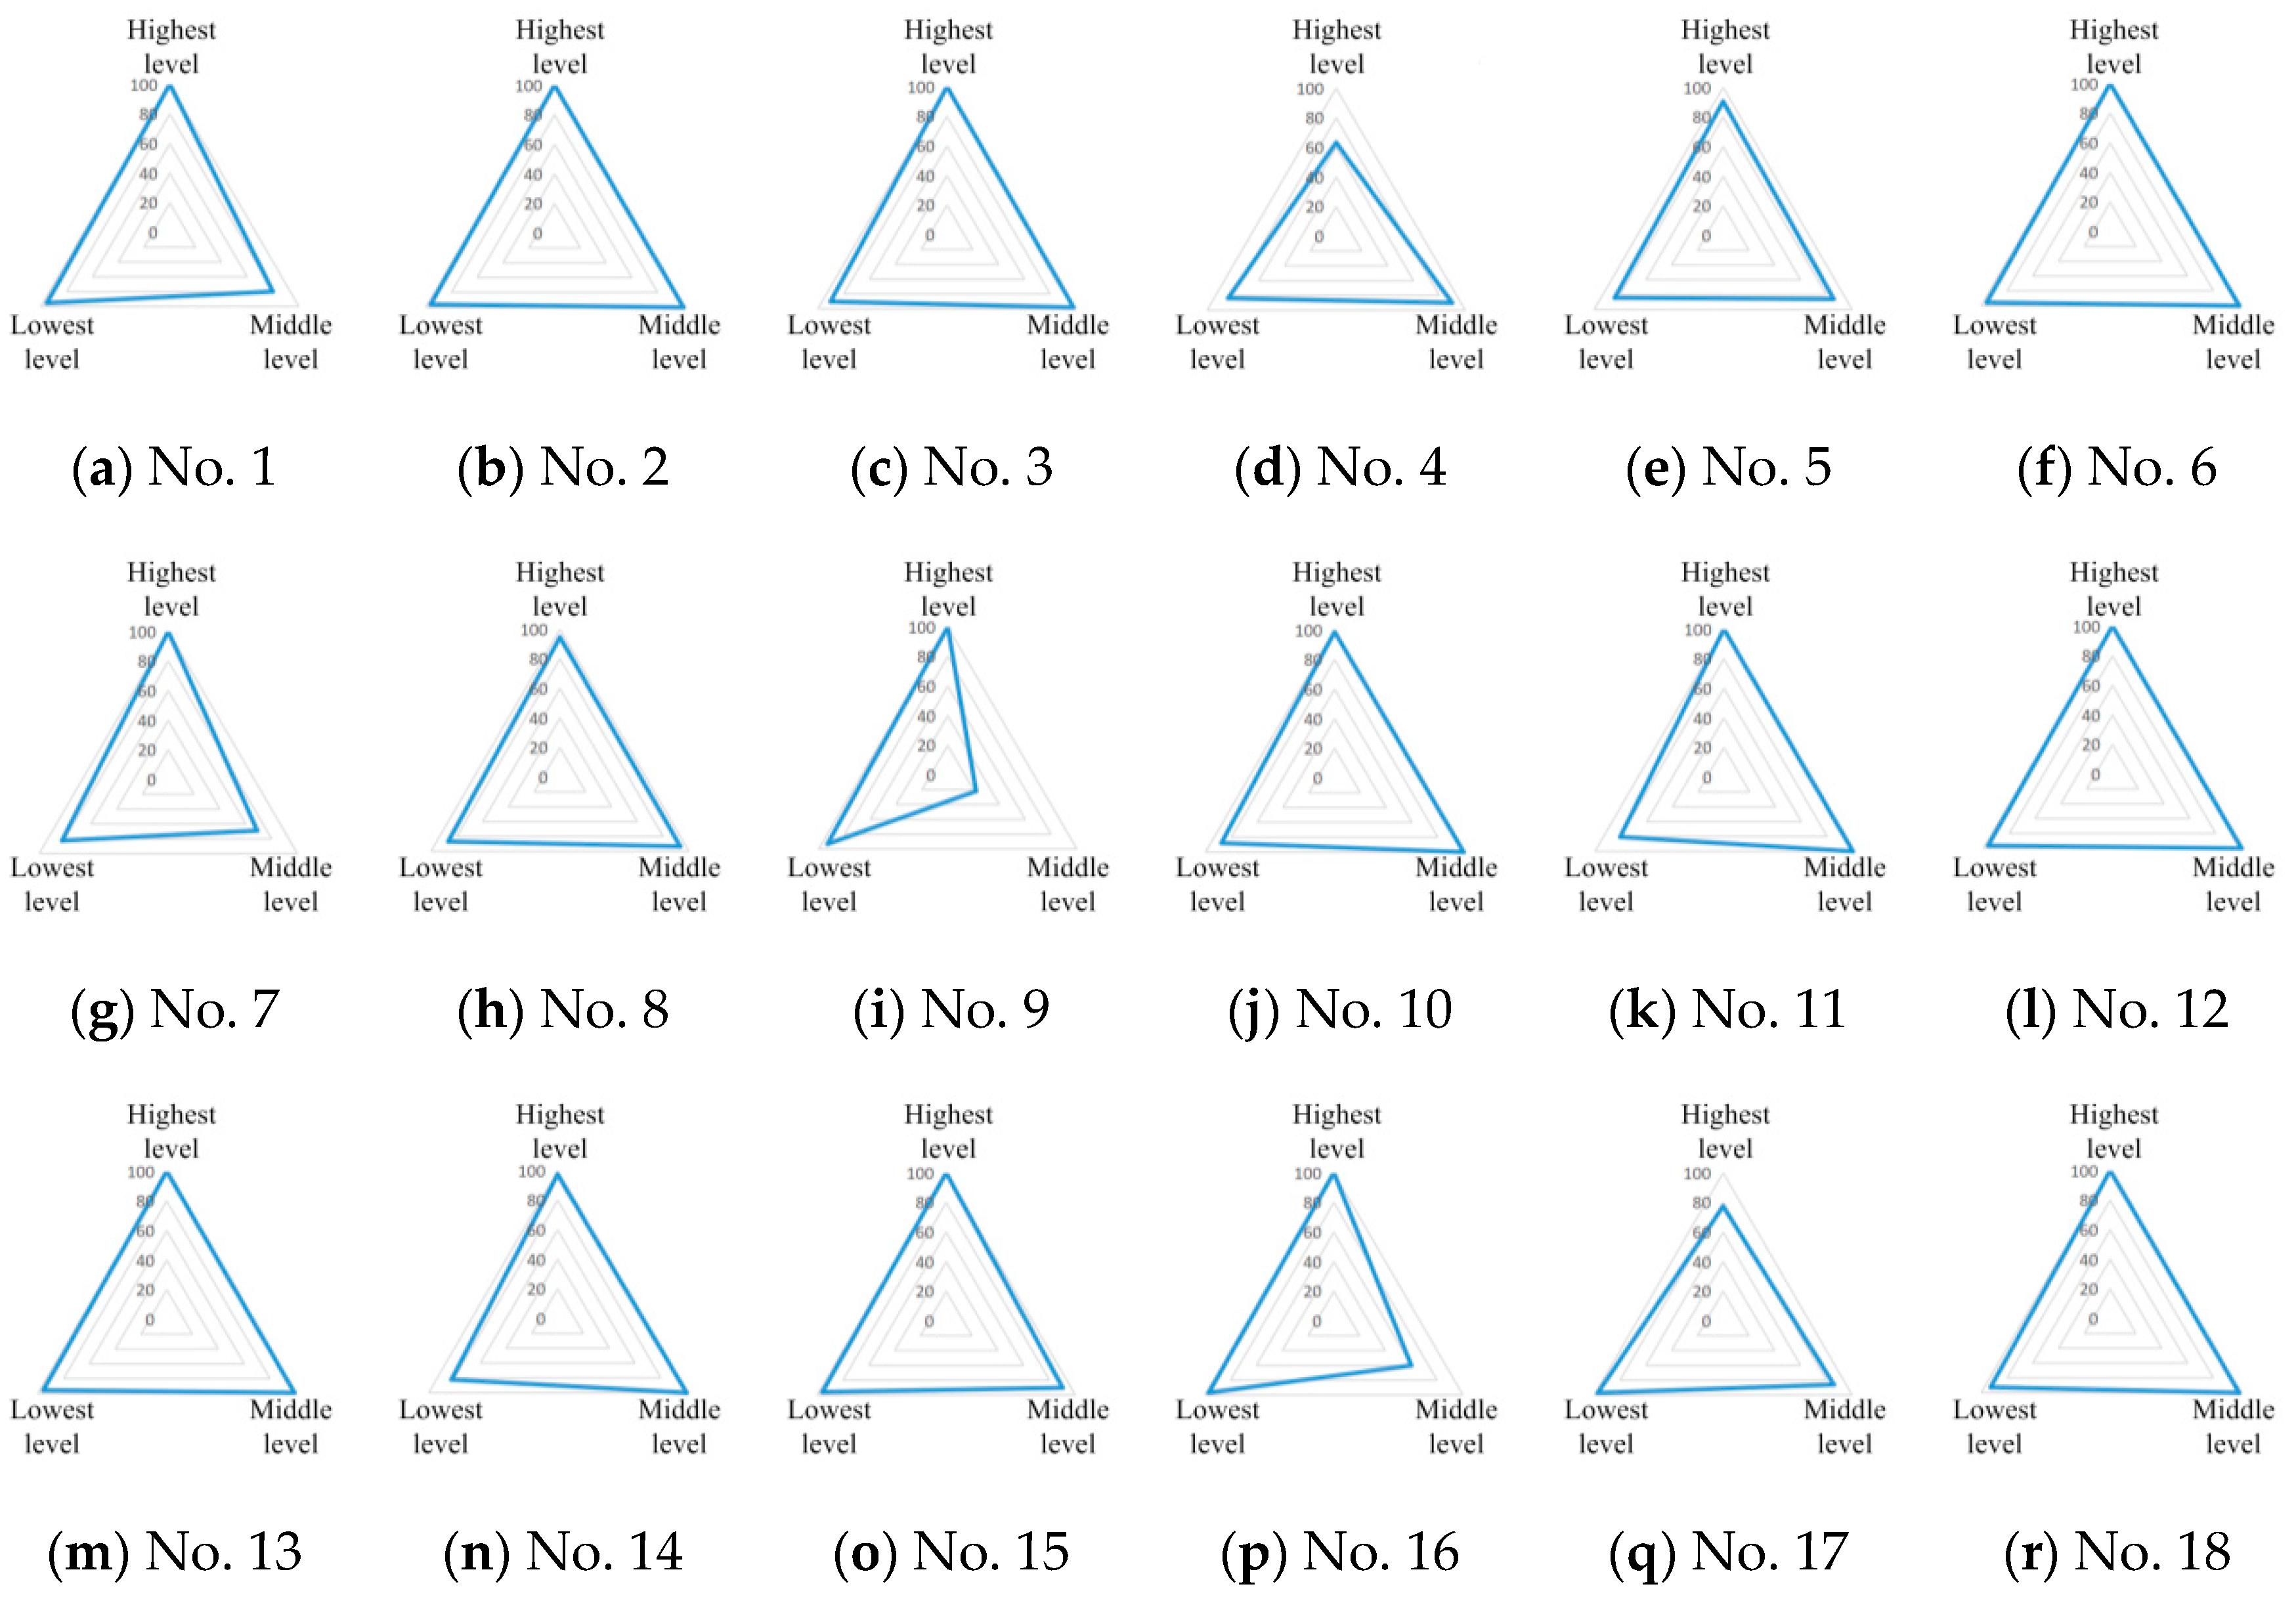
To evaluation of the efficiency of hierarchical medical services, the MAs were scored with reference to the ratios of residential communities with high accessibility to the different grades of medical institutions within the service territories (see Section 2.2.2 for details). As shown in Table 1, the overall scores for the three levels of medical services in the city proper of Tianjin were 95.59, 91.67, and 91.37, indicating generally excellent coverage of hierarchical medical services for residential communities. For the highest level medical service, 16 of the 18 MAs scored over 90, and two scored below 80. For the mid-level medical service, 11 MAs scored over 90, three scored between 80 and 90, another three scored between 60 and 80. There was one score of 21.92. As for the lowest level medical services, although no MA scored a full mark, no MA scored below 80 either. Thus, for better hierarchical medical services, high level health care infrastructure development should pay particular attention to some specific MAs, the enhancement of primary health care is actually needed by the whole system.
For each MA, a certain pattern of hierarchical medical services was demonstrated (see Figure 10). MAs No. 2, No. 3, No. 6, No. 12, No. 13, No. 15, and No. 18 had excellent scores in almost every aspect, indicating a superior environment for the provision of hierarchical medical services. By comparison, MA No. 4 and MA No. 17 scored unfavorably for the highest level medical services, and MAs No. 1, No. 7, No. 16, and especially MA No. 9, were badly connected to mid-level medical services. The residents in the service scope of these imperfect MAs suffered from inefficient medical services for serious diseases. Aside from that, the primary health coverage of MAs No. 4, No. 5, No. 7, No. 8, No.11, and No. 14 were not good enough to support convenient medical services in every neighborhood.
By analyzing the practical effects of different levels of medical services within the territories of the MAs, the weakness of hierarchical medical services in the city proper of Tianjin was revealed (see Figure 11). On one hand, driven by the common center-periphery model in urban development [52], the high level infrastructural facilities tended to gather in the central of the city and, thus, the inadequate numbers of high-quality medical services were available near the city edge. On the other hand, and contrary to the common perception [53], the primary medical service delivery was the major weakness of hierarchical medical services in the territories of many MAs, including both the ones at the city edge and the ones in the city center. For further improvement, new second and third grade medical institutions should be added into MA territories No. 1, No. 4, No. 7, No. 9, No. 16 and No. 17. More community clinics are still needed in many parts of the city, especially in the territories of MAs No.5, No. 11, and No. 14.
4. Conclusions
How to provide more efficient health care services to the public is a challenge faced by governments around the world. For a long time, most of the attention has been given to the requirements of the people and work has been done to increase health care service options and enhance the convenience of medical treatments. Nevertheless, from the side of consumers, the free choice and convenience of individual treatments does not necessarily, in practice, mean efficiency. The delivery of public health services should consider not only the allocation of medical resources in the physical world, but also the coordination and management of medical institutions.
In China, although hierarchical health care infrastructures are readily available, marketization of the health care system has resulted in serious patient congestion in large hospitals and low utilization of medical resources at the community level. For better management of health care resources at all levels, the MA was especially advocated by the Chinese government. As an initial study of the establishment of MAs in the city, the organization of hierarchical medical services and service efficiencies of MAs were discussed with consideration for the spatial accessibility.
Using the city proper of Tianjin as the study case, Voronoi diagrams were generated to define the service regions of medical institutions and the organizational structure of hierarchical medical services. Furthermore, through spatial interpolation analyses, the accessibility of medical services at different levels was measured for the discussion surrounding the service efficiency of MAs. According to the results, all the hospitals and clinics in and near the city proper were grouped into 18 MAs of different sizes. The fitness between the service regions of the first grade and the two higher grade medical institutions was much better than that between the second and the third grade institutions. Most of the residential communities were well connected to hierarchical medical services, with the exception of a number of MAs where there were certain deficiencies. Geographically, the high grade medical institutions were inadequate in the regions at the edge of the city and, contrary to common belief, more community clinics are still needed in parts of the city proper.
The findings of this initial research on the spatial organization of hierarchical medical services provide an important knowledge base for the future planning and implementation of MAs in the city. Further works are necessary to determine the final composition of MAs and alter the current patterns of health service provision and utilization. In order to establish MAs with balanced medical services, the service capability of each medical institution and the dwelling population of every residential community could be considered in the determination of the health care service structure. For a more precise definition of the medical service regions, the travelling time from each residential community to different medical institutions may be calculated based on the road network and daily traffic conditions.
Author Contributions
Conceptualization, X.S.; Methodology, X.S. and Y.J.; Data analysis, Y.J.; Writing-Original Draft Preparation, X.S.; Writing-Review & Editing, X.S., T.S. and Y.P.W.; Project Administration, T.S. and Y.P.W.; Funding Acquisition, T.S.
Funding
This research was jointly supported by the ESRC-NSFC Project (Grant No. ES/N010981/1), the National Natural Science Foundation of China (Grant No. 71561137003, 41501427), the Major Projects of the National Social Science Fund (Grant No. 15ZDB173, 18VZL006), and the Major Projects of Philosophy and Social Sciences of the Ministry of Education (Grant No. 15JZD025).
Conflicts of Interest
The authors declare no conflicts of interest with respect to the research, authorship, or publication of this article.
References
- Sahoo, P.; Dash, R.; Nataraj, G. China’s growth story: The role of physical and social infrastructure. J. Econ. Dev. 2012, 37, 53–75. [Google Scholar] [CrossRef]
- Wang, Y.; Liu, Y.; Li, Y.; Li, T. The spatio-temporal patterns of urban–rural development transformation in China since 1990. Habitat Int. 2016, 53, 178–187. [Google Scholar] [CrossRef] [Green Version]
- Huang, X.; Yang, Y. Urban redevelopment, gentrification and gentrifiers in post-reform inland China: A case study of Chengdu, China. Chin. Geogr. Sci. 2017, 27, 151–164. [Google Scholar] [CrossRef]
- Meng, Q.; Zhang, J.; Yan, F.; Hoekstra, E.J.; Zhuo, J. One country, two worlds–the health disparity in China. Glob. Public Health 2012, 7, 124–136. [Google Scholar] [CrossRef]
- Li, Y.; Wei, Y.H.D. The spatial-temporal hierarchy of regional inequality of China. Appl. Geogr. 2010, 30, 303–316. [Google Scholar] [CrossRef]
- Yin, C.H.; He, Q.S.; Liu, Y.F.; Chen, W.Q.; Gao, Y. Inequality of public health and its role in spatial accessibility to medical facilities in China. Appl. Geogr. 2018, 92, 50–62. [Google Scholar] [CrossRef]
- Ramesh, M.; Wu, X.; He, A.J. Health governance and healthcare reforms in China. Health Policy Plan. 2014, 29, 663–672. [Google Scholar] [CrossRef]
- Li, L.; Fu, H. China’s health care system reform: Progress and prospects. Int. J. Health Plan. Manag. 2017, 32, 240–253. [Google Scholar] [CrossRef]
- He, A.J.; Wu, S. Towards universal health coverage via social health insurance in China: Systemic fragmentation, reform imperatives, and policy alternatives. Appl. Health Econ. Health Policy 2017, 15, 707–716. [Google Scholar] [CrossRef]
- Li, H.; Liu, K.; Gu, J.; Zhang, Y.; Qiao, Y.; Sun, X. The development and impact of primary health care in China from 1949 to 2015: A focused review. Int. J. Health Plan. Manag. 2017, 32, 339–350. [Google Scholar] [CrossRef]
- Pan, J.; Qin, X.; Li, Q.; Messina, J.P.; Delamater, P.L. Does hospital competition improve health care delivery in China? China Econ. Rev. 2015, 33 (Suppl. C), 179–199. [Google Scholar] [CrossRef]
- Zhang, H.; Hu, H.; Wu, C.; Yu, H.; Dong, H. Impact of China’s Public Hospital Reform on Healthcare Expenditures and Utilization: A Case Study in ZJ Province. PLoS ONE 2015, 10, e0143130. [Google Scholar] [CrossRef] [PubMed]
- Fang, P.; Hu, R.; Han, Q. Effects of healthcare reform on health resource allocation and service utilization in 1110 Chinese county hospitals: Data from 2006 to 2012. Int. J. Health Plan. Manag. 2017, 32, 400–415. [Google Scholar] [CrossRef]
- Schoen, C.; Osborn, R.; Doty, M.M.; Bishop, M.; Peugh, J.; Murukutla, N. Toward higher-performance health systems: Adults’ health care experiences in seven countries, 2007. Health Aff. 2007, 26, w717–w734. [Google Scholar] [CrossRef] [PubMed]
- Epstein, R.M.; Fiscella, K.; Lesser, C.S.; Stange, K.C. Why the nation needs a policy push on patient-centered health care. Health Aff. 2010, 29, 1489–1495. [Google Scholar] [CrossRef] [PubMed]
- DeVries, A.; Li, C.H.; Oza, M. Strategies to reduce nonurgent emergency department use: Experience of a Northern Virginia Employer Group. Med. Care 2013, 51, 224–230. [Google Scholar] [CrossRef] [PubMed]
- Schmid, A.; Cacace, M.; Gotze, R.; Rothgang, H. Explaining health care system change: Problem pressure and the emergence of “hybrid” health care systems. J. Health Polit. Policy Law 2010, 35, 455–486. [Google Scholar] [CrossRef] [PubMed]
- Gordon, J.B.; Colby, H.H.; Bartelt, T.; Jablonski, D.; Krauthoefer, M.L.; Havens, P. A tertiary care–primary care partnership model for medically complex and fragile children and youth with special health care needs. Arch. Pediatr. Adolesc. Med. 2007, 161, 937–944. [Google Scholar] [CrossRef]
- Mehrotra, A.; Wang, M.C.; Lave, J.R.; Adams, J.L.; McGlynn, E.A. Retail clinics, primary care physicians, and emergency departments: A comparison of patients’ visits. Health Aff. 2008, 27, 1272–1282. [Google Scholar] [CrossRef]
- Hutchison, B.; Levesque, J.F.; Strumpf, E.; Coyle, N. Primary health care in Canada: Systems in motion. Milbank Q. 2011, 89, 256–288. [Google Scholar] [CrossRef]
- Blumenthal, D.; Hsiao, W. Lessons from the East—China’s rapidly evolving health care system. N. Engl. J. Med. 2015, 372, 1281–1285. [Google Scholar] [CrossRef]
- Hu, S.; Tang, S.; Liu, Y.; Zhao, Y.; Escobar, M.L.; De Ferranti, D. Reform of how health care is paid for in China: Challenges and opportunities. Lancet 2008, 372, 1846–1853. [Google Scholar] [CrossRef]
- Yip, W.C.M.; Hsiao, W.C.; Chen, W.; Hu, S.; Ma, J.; Maynard, A. Early appraisal of China’s huge and complex health-care reforms. Lancet 2012, 379, 833–842. [Google Scholar] [CrossRef]
- Fang, P.; Zhou, Y. Problem analysis and choice of reform path of medical alliances in China. Chin. J. Hosp. Admin. 2017, 33, 881–884. [Google Scholar] [CrossRef]
- Wang, X.; Birch, S.; Zhu, W.; Ma, H.; Embrett, M.; Meng, Q. Coordination of care in the Chinese health care systems: A gap analysis of service delivery from a provider perspective. BMC Health Serv. Res. 2016, 16, 571. [Google Scholar] [CrossRef] [PubMed]
- Wang, L. County integrated healthcare organization, China solution of rural health. Chin. Stud. 2017, 6, 161–166. [Google Scholar] [CrossRef]
- He, J.; Yi, L. Practice and reflections of medical alliance development in Wuxi. Chin. J. Hosp. Admin. 2018, 34, 189–191. [Google Scholar] [CrossRef]
- Zuo, X.; Zhen, C.; Ye, X.; Song, H.; Wang, T.; Guan, Z.; Meng, K. The current situation and effectiveness evaluation of medical staff’s participation in medical alliances in Beijing. Chin. J. Health Policy 2018, 11, 37–43. [Google Scholar] [CrossRef]
- Wang, R.; Li, Y.; Ge, Y. Present Situation and Reflection of the Construction of Medical Alliance. Med. Philos. 2018, 59–62. [Google Scholar] [CrossRef]
- Jin, C. What kind of medical alliance do we need to build. Chin. Health Resour. 2018, 21, 1–2. [Google Scholar] [CrossRef]
- Gulliford, M.; Morgan, M. Access to Health Care, 1st ed.; Routledge: New York, NY, USA, 2003; pp. 13–35. ISBN 978-0415275460. [Google Scholar]
- Pitkin, D.K.; Varda, D.M. Social capital and health care access: A systematic review. Med. Care Res. Rev. 2009, 66, 272–306. [Google Scholar] [CrossRef] [PubMed]
- Ludwick, A.; Fu, R.; Warden, C.; Lowe, R.A. Distances to emergency department and to primary care provider’s office affect emergency department use in children. Acad. Emerg. Med. 2009, 16, 411–417. [Google Scholar] [CrossRef] [PubMed]
- Schooling, M.C.; Man, K.K.; Cynthia, Y.; Benjamin, J.C.; Tai, H.L.; Gabriel, M.L. Spatial proximity and childhood hospital admissions in a densely populated conurbation: Evidence from Hong Kong’s ‘Children of 1997’ birth cohort. Health Place 2011, 17, 1038–1043. [Google Scholar] [CrossRef] [PubMed]
- Ahmadi-Javid, A.; Seyedi, P.; Syam, S.S. A survey of healthcare facility location. Comput. Oper. Res. 2017, 79, 223–263. [Google Scholar] [CrossRef]
- Rosenberg, M. Health geography I: Social justice, idealist theory, health and health care. Prog. Hum. Geogr. 2014, 38, 466–475. [Google Scholar] [CrossRef]
- Syed, S.T.; Gerber, B.S.; Sharp, L.K. Traveling towards disease: Transportation barriers to health care access. J. Community Health 2013, 38, 976–993. [Google Scholar] [CrossRef] [PubMed]
- Sun, X.; Wang, W.; Sun, T.; Wang, Y. Understanding the Living Conditions of Chinese Urban Neighborhoods through Social Infrastructure Configurations: The Case Study of Tianjin. Sustainability 2018, 10, 3243. [Google Scholar] [CrossRef]
- Supporting Standards for Public Service Facilities of Tianjin Urban Residential Area. Available online: https://ebook.chinabuilding.com.cn/zbooklib/book/detail/show?bookID=61879&SiteID=1 (accessed on 18 August 2018).
- Tianjin Medical and Health Service System Construction Plan (2015–2020). Available online: http://www.navinfo.com/index.aspx (accessed on 21 August 2018).
- Aurenhammer, F.; Klein, R.; Lee, D.T. Voronoi Diagrams and Delaunay Triangulations, 1st ed.; World Scientific Publishing Company: Danvers, MA, USA, 2013; pp. 183–193. ISBN 978-9814447638. [Google Scholar]
- Fonseca, S.; Milho, J.; Travassos, B.; Araújo, D. Spatial dynamics of team sports exposed by Voronoi diagrams. Hum. Mov. Sci. 2012, 31, 1652–1659. [Google Scholar] [CrossRef] [PubMed] [Green Version]
- Xiao, Y.; Gao, Z.; Qu, Y.; Li, X. A pedestrian flow model considering the impact of local density: Voronoi diagram based heuristics approach. Trans. Res. Part C Emerg. Technol. 2016, 68, 566–580. [Google Scholar] [CrossRef]
- Silas, N.M.; Richard, F.; Patricia, B. Voronoi Diagrams and Spatial Analysis of Crime. Prof. Geogr. 2017, 69, 579–590. [Google Scholar] [CrossRef]
- Yang, D.H.; Goerge, R.; Mullner, R. Comparing GIS-based methods of measuring spatial accessibility to health services. J. Med. Syst. 2006, 30, 23–32. [Google Scholar] [CrossRef] [PubMed]
- Wang, Y.; Chen, B.Y.; Yuan, H.; Wang, D.; Lam, W.H.K.; Li, Q. Measuring temporal variation of location-based accessibility using space-time utility perspective. J. Transp. Geogr. 2018, 73, 13–24. [Google Scholar] [CrossRef]
- Wang, F. Measurement, optimization, and impact of health care accessibility: A methodological review. Ann. Assoc. Am. Geogr. 2012, 102, 1104–1112. [Google Scholar] [CrossRef] [PubMed]
- Martínez, L.M.; Viegas, J.M. A new approach to modelling distance-decay functions for accessibility assessment in transport studies. J. Transp. Geogr. 2013, 26, 87–96. [Google Scholar] [CrossRef]
- Hooper, J. A destination too far? Modelling destination accessibility and distance decay in tourism. GeoJournal 2015, 80, 33–46. [Google Scholar] [CrossRef]
- Setianto, A.; Triandini, T. Comparison of kriging and inverse distance weighted (IDW) interpolation methods in lineament extraction and analysis. J. Appl. Geol. 2013, 5, 21–29. [Google Scholar] [CrossRef]
- Ortiz-Astorquiza, C.; Contreras, I.; Laporte, G. Multi-level facility location problems. Eur. J. Oper. Res. 2018, 267, 791–805. [Google Scholar] [CrossRef]
- Oppong, J.R.; Ironside, R.G.; Kennedy, L.W. Perceived quality of life in a centre-periphery framework. Soc. Indic. Res. 1988, 20, 605–620. [Google Scholar] [CrossRef]
- Wang, H.H.; Wang, J.J.; Wong, S.; Wong, M.; Mercer, S.W.; Griffiths, S.M. The development of urban community health centres for strengthening primary care in China: A systematic literature review. Br. Med. Bull. 2015, 116, 139–153. [Google Scholar] [CrossRef]
Figure 1.
The administrative area and Tianjin city proper.

Figure 2.
The distribution of medical institutions and residential communities.

Figure 3.
CFI of health care services within the city proper of Tianjin.

Figure 4.
Different levels of service regions defined by the Voronoi diagrams.

Figure 5.
The fit of service regions among different grade medical institutions.

Figure 6.
Spatial organization of MAs in the city proper of Tianjin.

Figure 7.
Interpolation analysis of the spatial accessibility to third grade medical institutions.

Figure 8.
Interpolation analysis of the spatial accessibility to second grade medical institutions.

Figure 9.
Interpolation analysis of the spatial accessibility to first grade medical institutions.

Figure 10.
Service efficiency description of the MAs at different levels.

Figure 11.
Practical effects of different levels of medical services.


Table 1.
Efficiency evaluation of hierarchical medical services.
| MAs | Scores for Highest Level Medical Services | Scores for Mid-Level Medical Services | Scores for Lowest Level Medical Services |
|---|---|---|---|
| 1 | 100 | 79.76 | 95.24 |
| 2 | 100 | 100 | 96.15 |
| 3 | 100 | 98.04 | 90.2 |
| 4 | 63.26 | 89.8 | 83.67 |
| 5 | 90.48 | 85.7 | 84.13 |
| 6 | 100 | 100 | 95.65 |
| 7 | 100 | 68.9 | 82.35 |
| 8 | 94.51 | 93.3 | 86.59 |
| 9 | 100 | 21.92 | 93.15 |
| 10 | 98.7 | 100 | 87.66 |
| 11 | 100 | 100 | 80.45 |
| 12 | 100 | 100 | 96.36 |
| 13 | 100 | 98.9 | 95.6 |
| 14 | 97.39 | 100 | 82.35 |
| 15 | 100 | 90.16 | 95.95 |
| 16 | 100 | 60 | 96.92 |
| 17 | 77.43 | 85.89 | 97.18 |
| 18 | 100 | 100 | 92.57 |
| Overall | 95.59 | 91.67 | 91.37 |
© 2019 by the authors. Licensee MDPI, Basel, Switzerland. This article is an open access article distributed under the terms and conditions of the Creative Commons Attribution (CC BY) license (http://creativecommons.org/licenses/by/4.0/).
Share and Cite
MDPI and ACS Style
Sun, X.; Sun, T.; Jin, Y.; Wang, Y.P. Spatial Organization of Hierarchical Medical Services within the City Proper of Tianjin, China: Towards Efficient Medical Alliances. Sustainability 2019, 11, 229. https://doi.org/10.3390/su11010229
AMA Style
Sun X, Sun T, Jin Y, Wang YP. Spatial Organization of Hierarchical Medical Services within the City Proper of Tianjin, China: Towards Efficient Medical Alliances. Sustainability. 2019; 11(1):229. https://doi.org/10.3390/su11010229
Chicago/Turabian StyleSun, Xuan, Tao Sun, Yushan Jin, and Ya Ping Wang. 2019. "Spatial Organization of Hierarchical Medical Services within the City Proper of Tianjin, China: Towards Efficient Medical Alliances" Sustainability 11, no. 1: 229. https://doi.org/10.3390/su11010229
Note that from the first issue of 2016, this journal uses article numbers instead of page numbers. See further details here.