Article

Improvement of Ecological Footprint Model in National Nature Reserve Based on Net Primary Production (NPP)

1
Satellite Environmental Application Center, Ministry of Environmental Protection, Beijing 100094, China
2
Institute of Geographical Sciences and Natural Resources Research, Chinese Academy of Sciences, 11A Datun Road, Beijing 100101, China
3
College of Resources and Environment, University of Chinese Academy of Sciences, No. 19A Yuquan Road, Beijing 100049, China
4
Key Laboratory of Carrying Capacity Assessment for Resource and Environment, Ministry of Land & Resources, Beijing 100101, China
5
Chinese Research Academy of Environmental Sciences, State Environmental Protection Key Laboratory of Regional Eco-process and Function Assessment, No. 8 Dayangfang Road, Anwai Beiyuan, Beijing 100012, China
*
Author to whom correspondence should be addressed.
Sustainability 2019, 11(1), 2; https://doi.org/10.3390/su11010002
Submission received: 3 November 2018 / Revised: 7 December 2018 / Accepted: 18 December 2018 / Published: 20 December 2018

Abstract

:
An increasing number of nature reserves are being invaded by various development and construction activities, such as energy, resources, and transportation facilities. The ecological footprint model, which enables a quantitative assessment of ecological sustainability, can assess whether human consumption at various spatial scales falls within the regenerative capacity of the biosphere. Based on the traditional ecological footprint evaluation model: the Global Agro-Ecological Zone (EF-GAEZ model), this study proposes an improved ecological footprint model based on net primary productivity (EF-NPP model) and its validations. In this study, the status of ecological footprints and the ecological carrying capacities of 319 national nature reserves in 2010 is explored, and the changes in ecological surpluses and ecological deficits from 2000 to 2010 are analyzed. The ecological footprint per capita and the ecological carrying capacity per capita calculated by the two models were mostly consistently at the same level (more than 68%), which indicated that the ecological footprint per capita and the ecological carrying capacity per capita of the two models followed the same rule. The EF-NPP model can reflect the change in the global climate, the degradation of the soil, and the progress of the technology.

1. Introduction

The products and services provided via the ecosystem are the foundation of human society [1,2]. Ecological sustainability is the basic guarantee of the sustainable development of human society [3]. Therefore, the use of ecosystem productivity, human consumption, and occupancy to evaluate sustainable development has become a significant focus of research [4,5,6]. Nonetheless, nature reserves face tremendous development pressure with the occurrence of rapid socioeconomic development [7].
An increasing number of nature reserves are involved in various development and construction projects, such as energy, resources, and transportation projects [8]. Some core areas or buffer zones of nature reserves have been developed for tourism, planting, or breeding industries, and local communities have continuously eroded the land of nature reserves [9,10,11]. This pressure greatly exceeds the ecological carrying capacity, which is an ecological concept that assumes that a limited number of individuals can be supported at a given level of consumption wherein the environment is not degraded [12], causing great damage to the main targets of protection and the resources and environment in these areas [13].
One way to estimate human demand compared to an ecosystem’s carrying capacity is “ecological footprint” accounting [14,15,16]. The ecological footprint is an accounting system of indicators based on the context that the Earth has a finite amount of biological production that supports all life on it [17]. Accounting for the ecological footprint is a non-monetized ecosystem assessment tool and a significant international biophysical method for distinguishing the level of development in recent years [18,19,20]. Bioproductive space has been used as a synonym for the renewable capacity of the Earth’s ecosystem to measure the flow of energy into and out of the socioeconomic system, thereby characterizing the interdependence and supportive relation between human society and nature [21]. The ecological footprint could be used to express the space equivalents—individuals or countries occupying bioproductive areas [22]. The idea of this concept is to compare the area needed to support a certain lifestyle with the available area, thus providing a tool to assess whether the consumption is ecologically sustainable [23].
The ecological footprint model can assess whether human consumption at the various spatial scales exists within the regenerative capacity of the biosphere, thereby enabling a quantitative assessment of the ecological sustainability [24,25]. Therefore, many scholars have been attracted to the proposed model, which has been applied and explored many times [26,27,28]. At present, the commonly used ecological footprint calculations include the classical method proposed by Wackemagel [29] and the method of using input-output analysis [22,30]. The equivalence factor used to standardize the different types of land use is a critical parameter in the model [31]. In the traditional ecological footprint model, the equivalence factors are calculated using suitability indexes from the EF-GAEZ combined with information about actual areas of cropland, forest, and grazing area from Food and Agricultural Organization Statistical Database (FAOSTAT) [32,33]. The ecological footprint model has the advantages of global comparison, conceptual image, intuitive theory, strong operability, and easy-to-understand conclusions, but some doubts and arguments remain [34,35]. The primary advantages of the EF-GAEZ model include the concept of the image, the feasibility of the method, the reproducibility and the policy implications of the results [36]. The major deficiency is the ecological footprint as an evaluation indicator of sustainable development, ecological bias, ecological profit and loss judgment, sustainable development, and scale [37,38]. Biocapacity refers to the amount of biologically productive land and water areas available within the boundaries of a given country [33]. Although the land area method of calculating biocapacity take into consideration the multiple functions of land use and the values of factors such as the equivalence factor and yield factor [39], it typically uses both the global average yield factor and the equivalence factor. However, due to the differences and particularities of each research areas, it is not scientific to replace the yield factors and equivalence factors of each region with a global average scale [40]. Simultaneously, in response to the deficiencies of the EF-GAEZ model, Venetoulis and Talberth made major changes to the theory and method of the ecological footprint model in 2004 and 2005 [41,42]. Combining the ecological footprint with Net Primary Productivity (NPP), an ecological footprint calculation method based on net primary productivity was proposed (the EF-NPP model), and it was applied to more than 100 countries around the world [43,44]. The theoretical framework of the method based on the ecological footprint model improves the equivalence factors and carbon absorption in response to the more theoretical assumptions in question and provides better measures and evaluations for the sustainable development of the region [45,46]. The proposal of the EF-NPP method is important for improving the ecological footprint method [47]. Compared with EF-GAEZ, the EF-NPP model can study land productivity changes dynamically and in real time and thus more accurately assess the sustainable development of the region [48].
Based on the traditional ecological footprint evaluation method (EF-GAEZ model), this study proposes and validates an improved model on account of net primary productivity (EF-NPP model). Using the EF-NPP method, we analyzed the status of the ecological footprints and ecological carrying capacities of 319 national nature reserves in 2010, and the changes in the ecological surpluses and ecological deficits from 2000 to 2010. Finally, the state of the sustainable development of traffic lights in China’s national nature reserves was evaluated.

2. Materials and Methods

2.1. Data

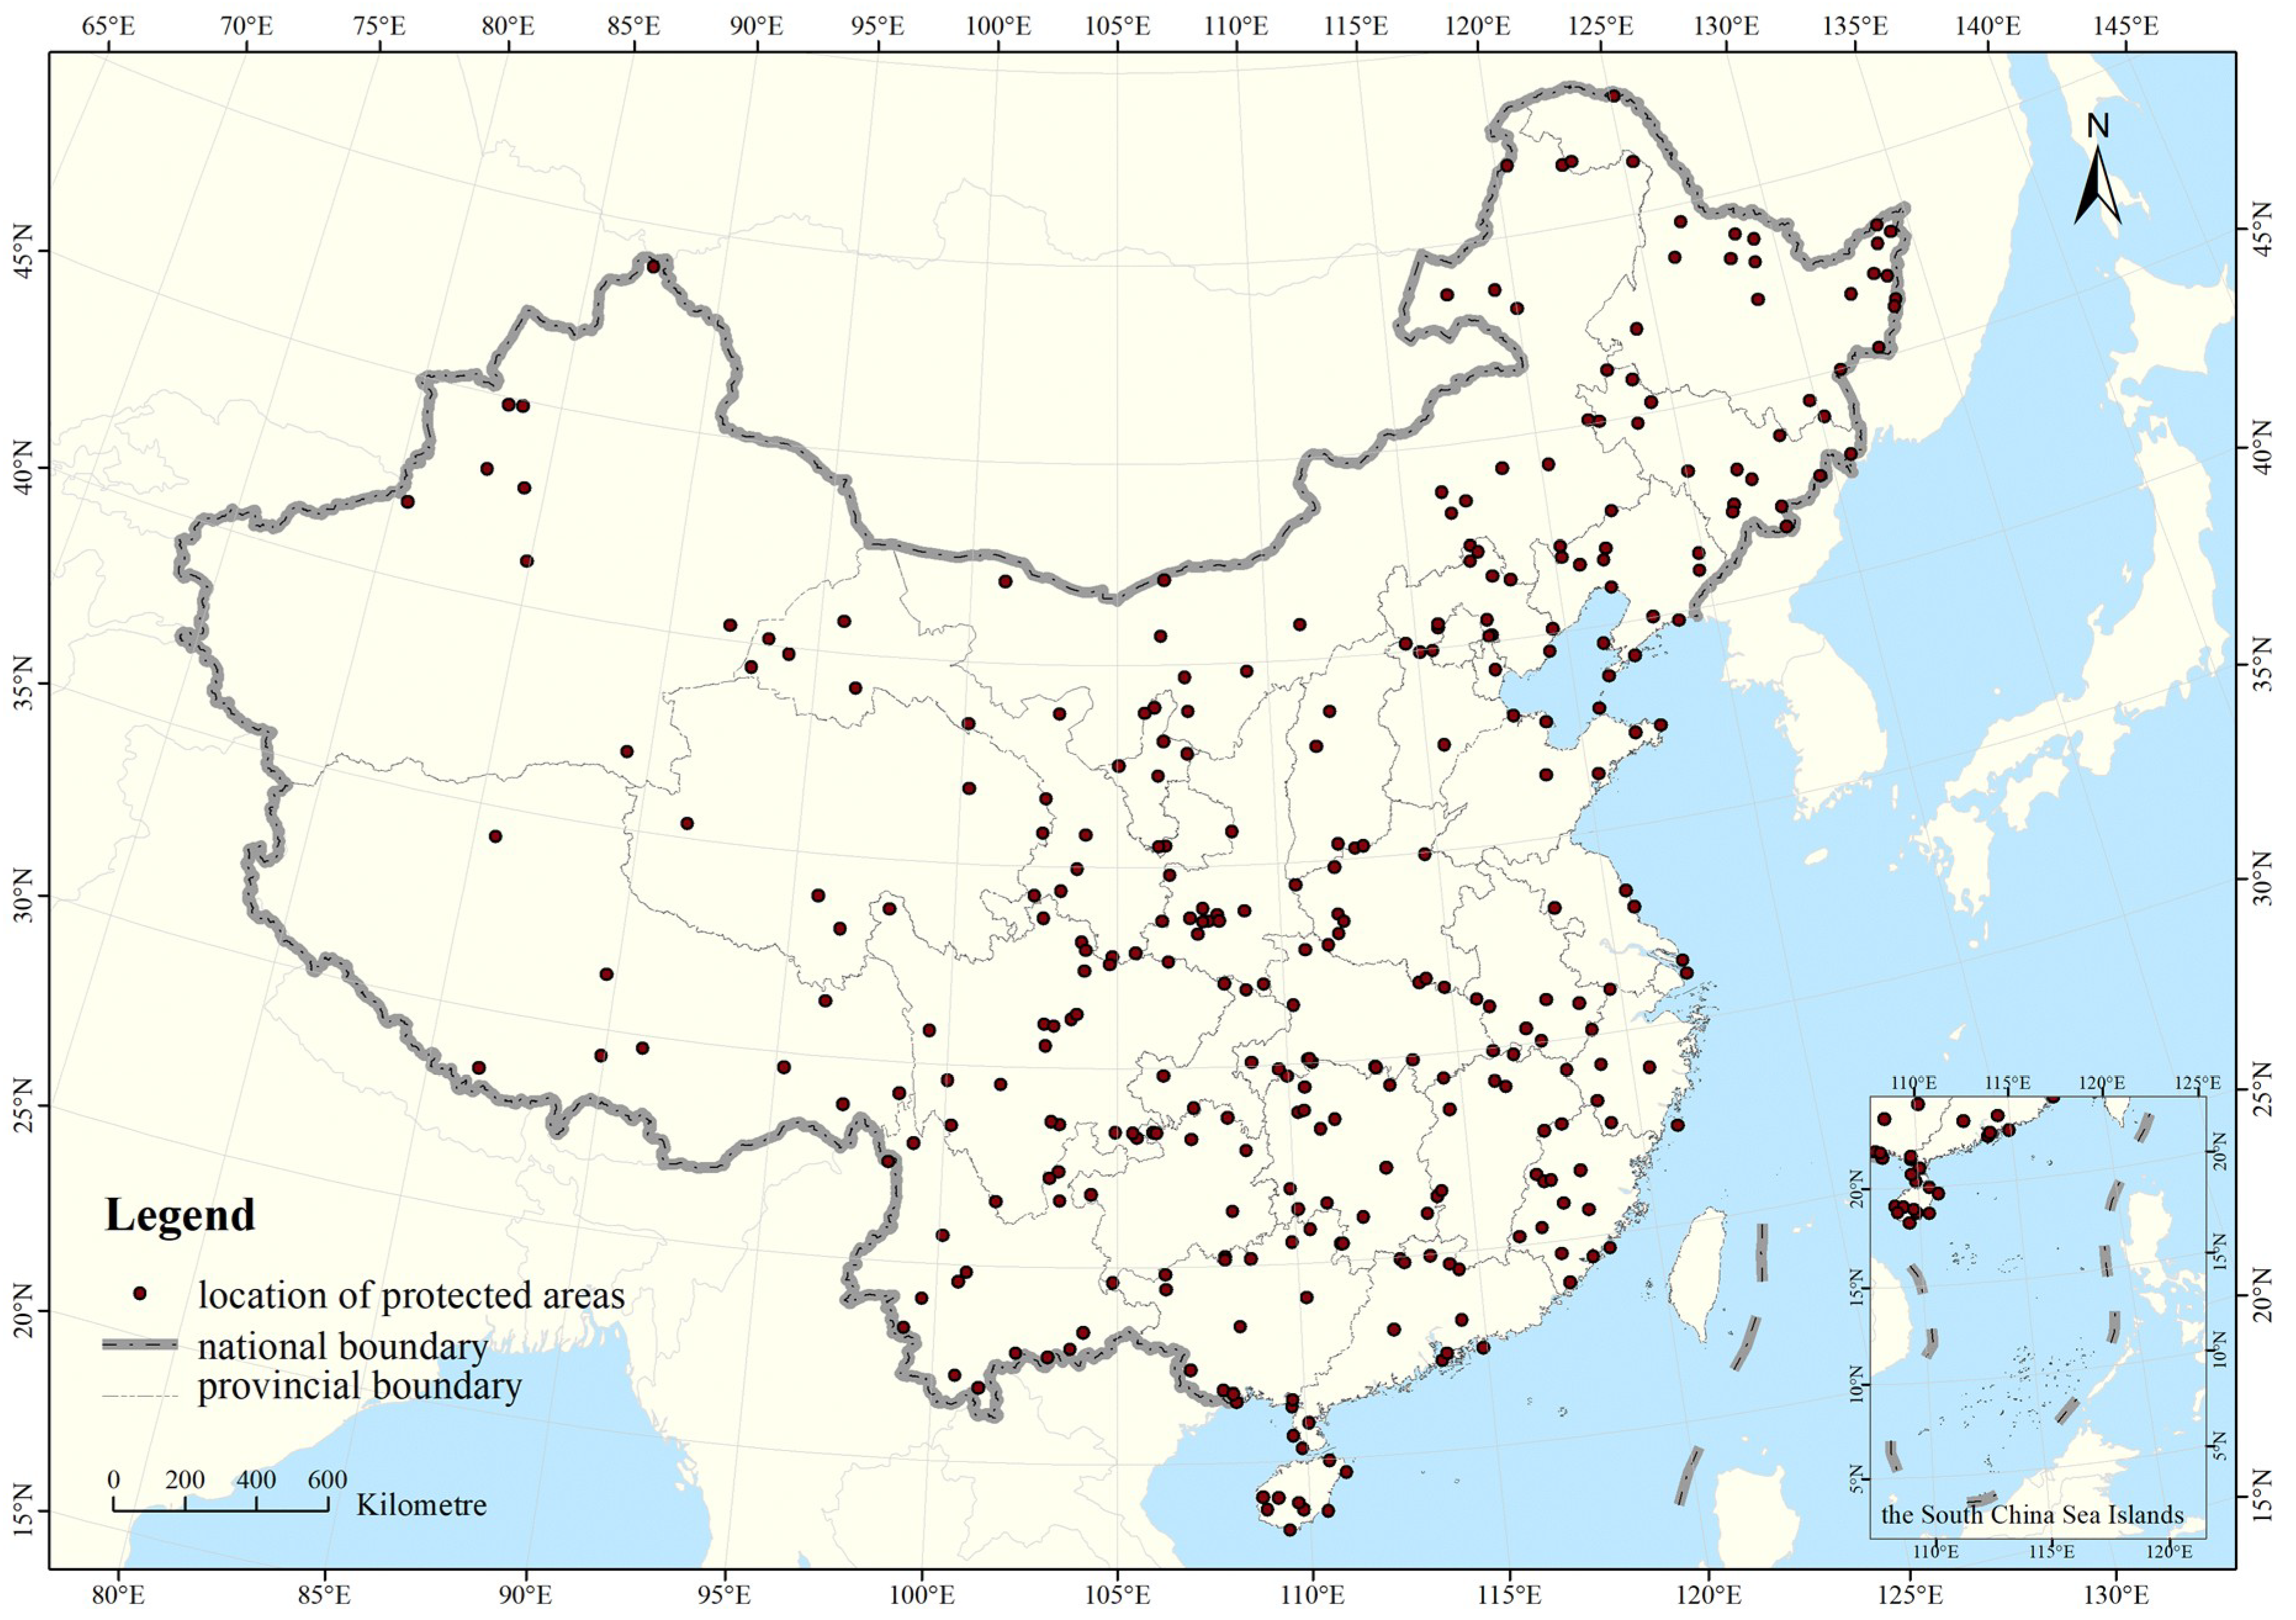
2.1.1. Nature Reserve Data
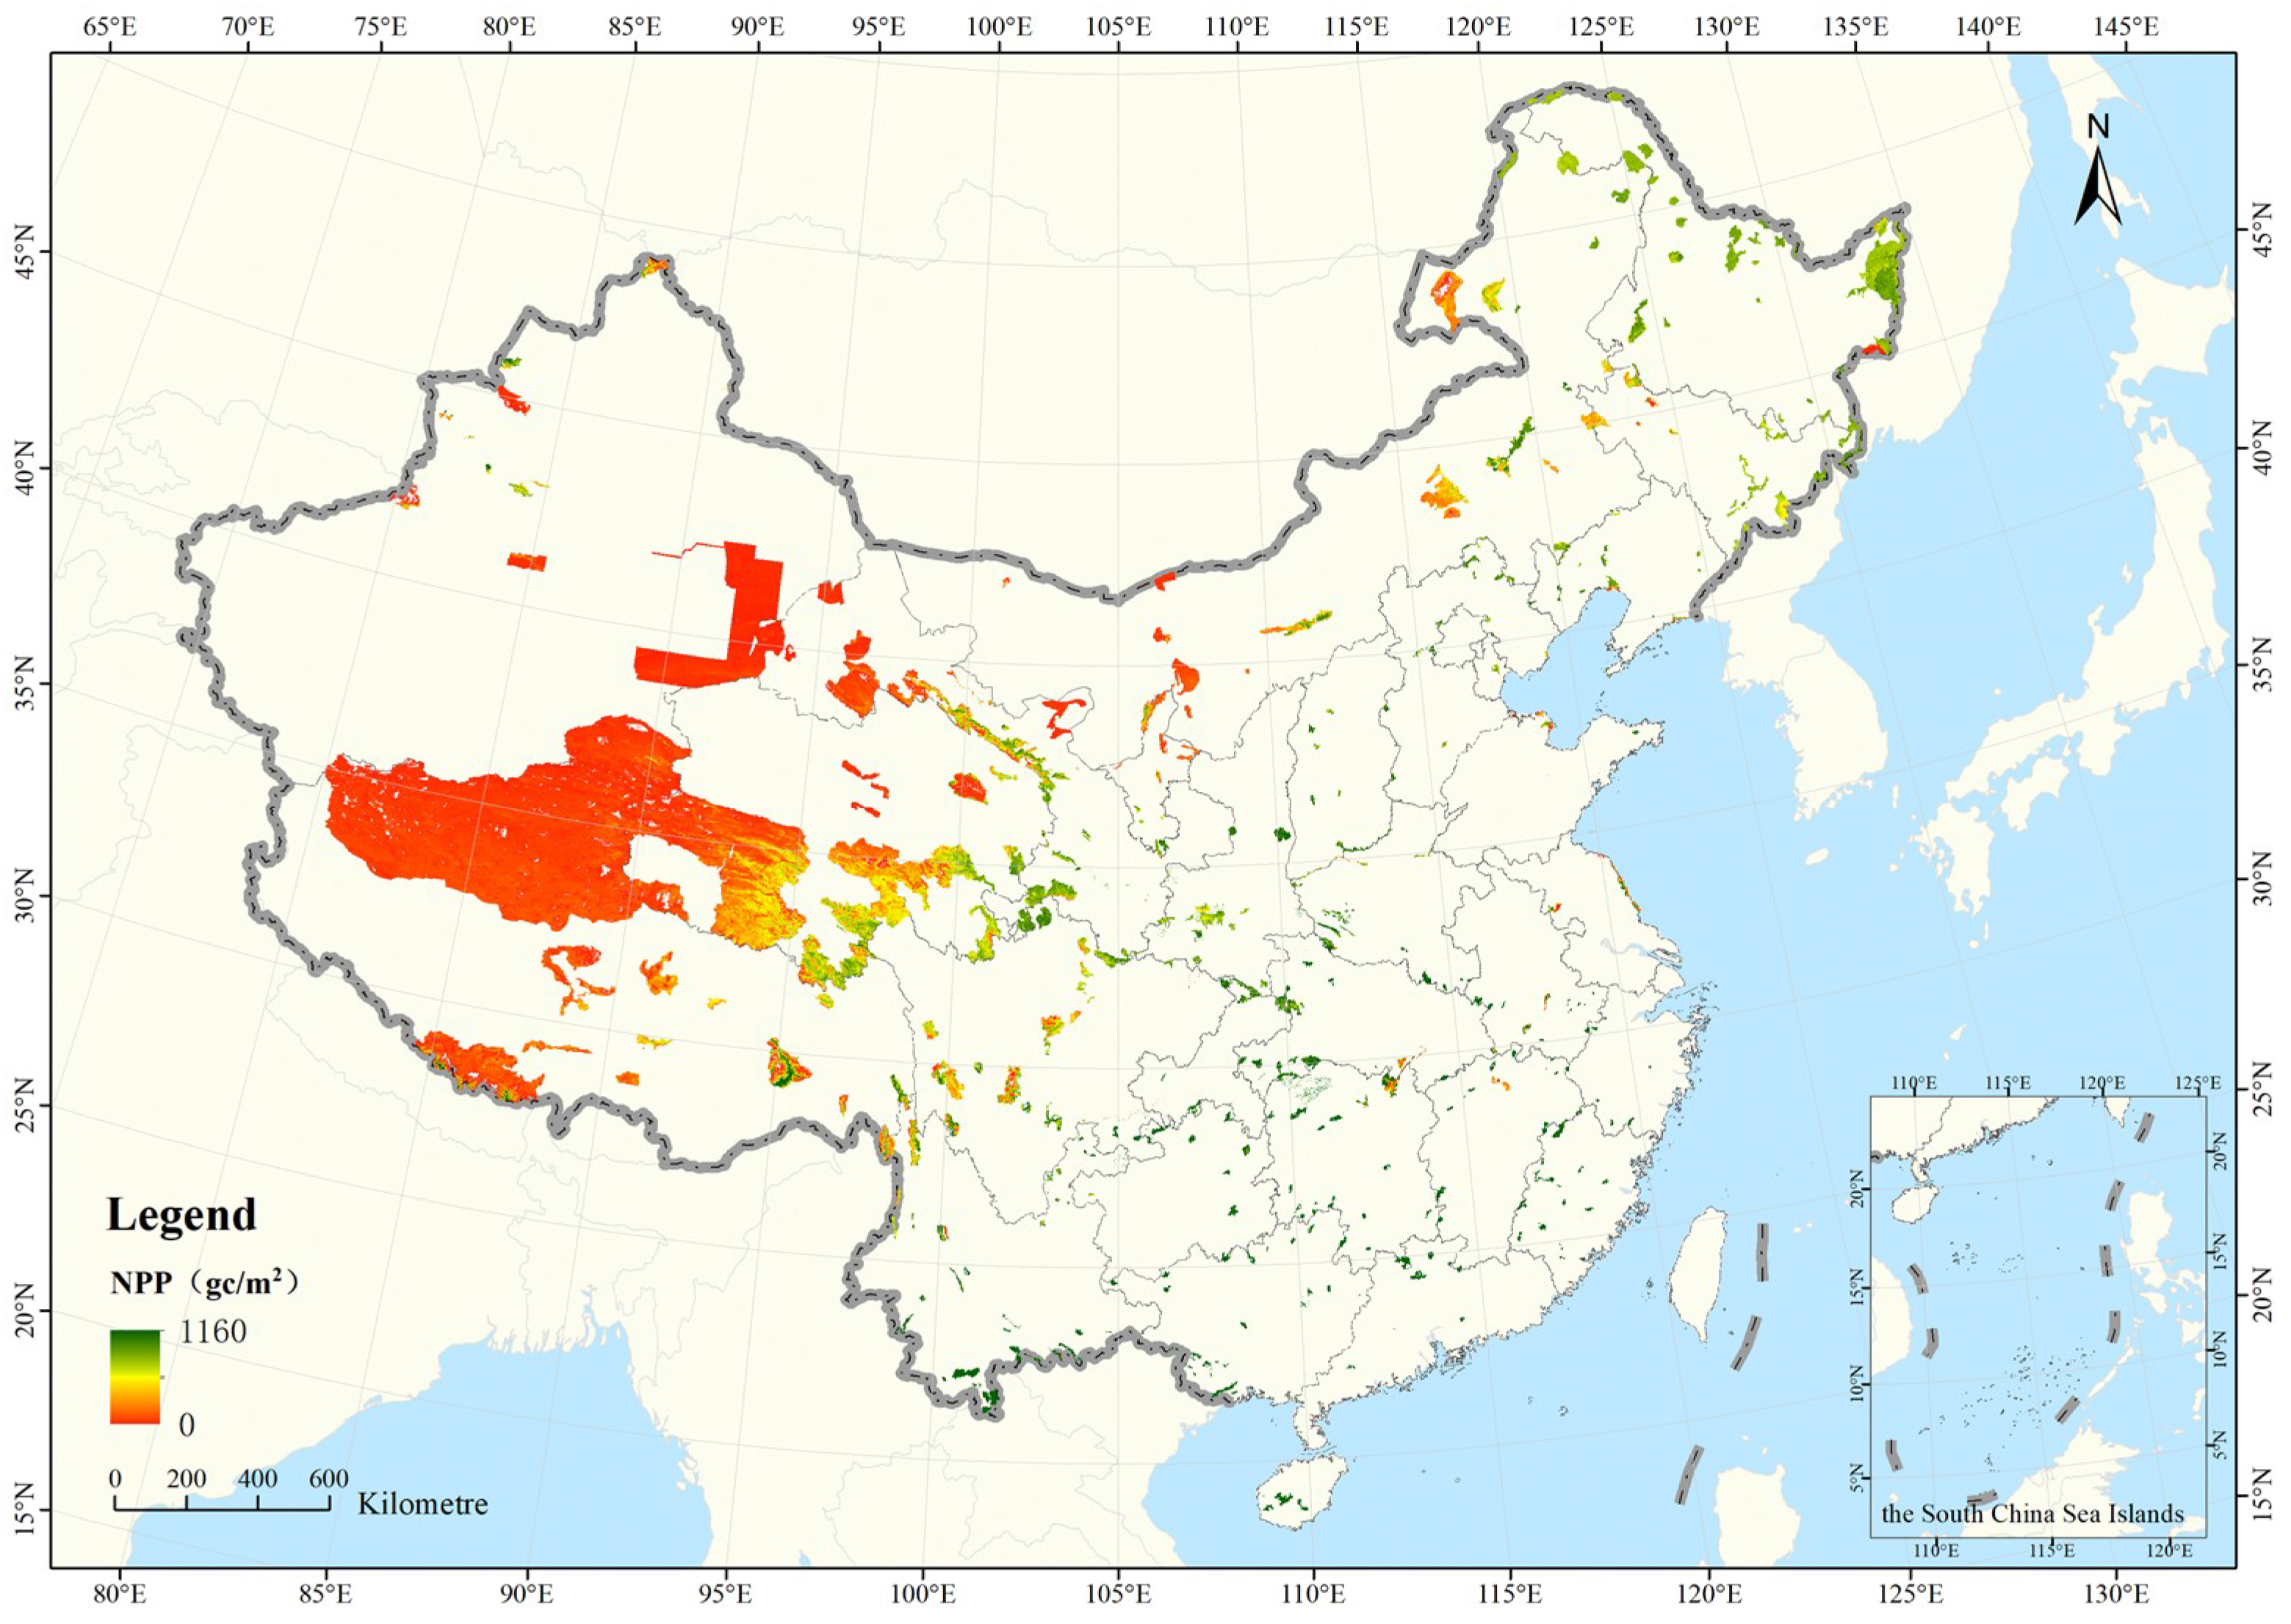
By the end of 2010, there was a total of 319 national nature reserve in China, the distribution of which is shown in Figure 1. The paper adopted the bound data of 319 national nature reserve from Nanjing institute of Environmental Sciences, Ministry of Environmental Protection (MEP).

2.1.2. NPP Data

The NPP data used in this paper comes from the project entitled “Remote Sensing Investigation and Assessment on the Changes of National Ecological Environment in Ten Years (2000–2010)”, which was conducted by the MEP and the Chinese Academy of Sciences. This project is based on the Carnegie-Ames-Stanford Approach (CASA) model, the normalized difference vegetation index (NDVI) dataset of the 250 m of Moderate-resolution Imaging Spectroradiometer (MODIS) products, the surface temperature data set of the splitting window algorithm, the moisture index data set and the national meteorological data interpolation solar total radiation data set, and the 250-m resolution NPP data acquired in 2000 and 2010.

2.2. Methods

In this study, the status of ecological footprints and the ecological carrying capacities of 319 national nature reserves in 2010 and the changes in ecological surpluses and ecological deficits from 2000 to 2010 were analyzed according to the following process (Figure 2).

2.2.1. NPP Estimation Model

Aimed at the shortcomings of the traditional EF-GAEZ model, the EF-NPP model, which is based on net primary productivity, is proposed. The equivalence factor, yield factor, and the area of land conserved for biodiversity are improved.
The NPP estimation formula is as follows:
N P P ( x , t ) = A P A R ( x , t ) × ( x , t )
where APAR (x, t)represents the absorbed photosynthetically active radiation by x in t months (unit: MJ/m2/ten), and ε represents the actual light utilization of x in t months (Unit: gC/MJ).

2.2.2. Improvement of the EF-NPP Model

(A) Equivalence Factor of the EF-NPP Model
Based on the NPP data, the equivalence factor of the national nature reserve is calculated according to the following steps:
(1) The 250-m resolution NPP datasets of 2000 and 2010 were resampled to a 30-m resolution. These datasets were then overlaid with the 30-m land-utilization dataset of 2000 and 2010 to obtain the NPP of the different types of biological productive areas throughout the country (woodland, grassland, waters, and farmland).
(2) Based on the vector data of the national nature reserve borders, the NPP of the different types of bioproductive land in each protected area was extracted by the Geographic Information System (GIS) spatial analysis method.
(3) The average NPP was calculated for each of the four major categories—woodland, grassland, waters and farmland—in the different reserves, as shown in the formula:
N P P n r = j N P P j × A j j A j
where NPPnr is the average NPP of the various vegetation types in the national nature reserve, NPPj is the NPP of the different types of biological productive areas in the nature reserve, and Aj is the different types of biological productive areas.
(4) For the balance factors for the woodland, grassland, farmland and waters in the reserve, the NPP for a biological production area is divided by the average NPP of the four types of area. The model is as follows:
r j = N P P j N P P n r
where rj is the equivalence factor of the different types of biological productive areas in national nature reserve, NPPnr is the average NPP of the different types of biological productive areas, and NPPj is the NPP of the different types of biological productive areas. The equivalence factor of the land with construction is replaced by the equivalence factor of farmland.
(B) The Yield Factor of the EF-NPP Model
Based on the NPP data, the yield factors of the national nature reserve were calculated according to the following steps:
(1) The 250-m resolution NPP datasets for 2000 and 2010 were resampled to a 30-m resolution. These datasets were overlaid with 30-m land-utilization datasets for 2000 and 2010 to obtain the NPP of the different types of biological productive areas throughout the country (woodland, grassland, waters, and farmland).
(2) Based on the vector data from the borders of the national nature reserve, the NPP of the different types of bioproductive land in each protected area was extracted by the GIS spatial analysis method.
(3) The yield factors of the woodland, grassland, farmland and waters of the reserve were obtained through the ratio of each reserve to the national average. The model is as follows:
y j = N P P j NPP j ¯
where yj is the yield factor of the different types of biological productive areas in the national nature reserve, NPPj is the NPP of j type biological production area in a national nature reserve; NPP j ¯ is the average NPP of j type land in China, and the yield factor f for land with construction is replaced by the yield factor of farmland.

2.2.3. Establishment of Equivalence Factor and Yield Factor in EF-GAEZ

The equivalence factor in the EF-GAEZ model uses the most widely used Wackernagel research results, whose equivalence factors for farmland, woodland, grassland, and waters are 2.8, 1.1, 0.5, and 0.2, respectively. In addition to the above four types of ecological productivity, the equalization factor for land with construction is the same as for farmland. The yield factors also use the Wackernagel yield factors, with the yield factor for farmland and land with construction being 1.66, the factor for grassland being 0.19, the factor for woodland being 0.91, and the factor for water being 1.0.
The EF-GAEZ model, like the EF-NPP model, also defines the area ratio of the protected areas as the proportion of land area that should be reserved for the evaluation of ecological carrying capacity.

2.2.4 Average Ecological Footprint Model

There are 5 land types that need to be considered to biological productive area when calculating the ecological footprint: fossil energy land, woodland, grassland, construction land, and water area. The fossil energy land refers to the forestland area to absorb the carbon emission during combustion of fossil energy, and the actual values calculated using the consumption of raw coal, coke, crude oil, petrol, kerosene, diesel, fuel oil, LPG, natural gas, and thermal energy multiply by the conversion coefficient of the country. Therefore, the land for energy consumption is designed for the construction land. In this paper, the 5 types are considered for the calculation of the ecological footprint including the farmland, woodland, grassland, water, and development and construction land.
Because the ecological productivity is different for various types of biological productive land, using the average biological productivity turn resource consumption and waste capacity into the needs of biological productive area. Introducing equivalence factor, make various types of biological productive land into equivalent ecological productivity, and to calculate the total ecological footprint (Equations (5) and (6)).
Ecological productivity varies according to the type of biological productive area, with resource consumption and waste absorption being converted by the average bioproductivity of each of the required biological productive areas. Different types of biological productive area are transformed into equivalent eco-productivity to calculate the total ecological footprint:
E F n r = j = 1 n C j E P j × r j
e f n r = E F n r N
where EFnr is the total ecological footprint of the nature reserve, j is the type of biological productive area, Cj is the resource consumption, EPj is the average bioproductivity, rj is the equalization factor, efnr is the per capita ecological footprint of the nature reserve, and N is the total population.

2.2.5. Calculation of the Average Ecological Footprint in the National Wilderness Preservation System

Calculating the ecological footprint requires a large amount of statistics of production and consumption, but China’s statistics is mostly based on administrative regions, which lacks the data of national natural reserves. Thus, this study estimated the per capita ecological footprint of the counties, considering that the per capita consumption level of the residents living in the national nature reserves and the counties where the protected areas are located is basically the same. There are 227 national nature reserves with the boundaries falling in their counties, and 92 national nature reserves falling within multiple counties (Table 1). The Sanjiangyuan National Nature Reserve even spans ten counties. For the protected areas where the boundary falls in one county, the per capita ecological footprint of the county is calculated by the per capita ecological footprint of the protected area. When the protected area spans more than one county, the average of per capita ecological footprint of each county is quantized by the per capita ecological footprint of the protected area.

2.2.6. Correlation Analysis Method

Correlation analysis is widely used in industrial and agricultural production and in scientific research. It is an indispensable tool for analysis.
Relevance relations were divided into complete correlation (function related), incomplete correlation (false correlation), and zero correlation (irrelevant). Relevance relations are usually described by the correlation coefficient r (Pearson coefficient), and the formula is as follows:
r = i = 1 n ( x i x ¯ ) ( y i y ¯ ) i = 1 n ( x i x ¯ ) 2 i = 1 n ( y i y ¯ ) 2 = n i = 1 n x i y i ( i = 1 n x i ) ( i = 1 n y i ) n i = 1 n x i 2 ( i = 1 n x i ) 2 n i = 1 n y i 2 ( i = 1 n y i ) 2
For x ¯ = 1 n i = 1 n x i , in the formula, x ¯ and y ¯ represent the average value of the two sample elements. For y ¯ = 1 n i = 1 n y i , when | r | < 0.3 , a zero correlation is noted, and the two elements are irrelevant; when 0.3 | r | < 0.5 , the relativity of the two elements is low; when 0.5 | r | < 0.8 , the two elements are relative; and when 0.8 | r | 1 , the relativity of the two elements is high.
After the linear correlation coefficient between the two variables has been calculated from the sample data, a statistical test on the degree of linear correlation is usually performed, which means the appropriate statistic can be selected. At a given level of significance, the significance of the statistic is tested, which means the correlation coefficient is also tested. This study adopted the t test method, and the specific steps are as follows:
(1) We propose the null hypothesis, H0: no significant linear correlation exists between the two populations. The alternative hypothesis is H1: a significant linear correlation exists between the two populations.
(2) According to the calculation method of the correlation coefficient, to calculate the corresponding statistics, the formula is as follows:
t = r n 2 1 r 2 ~ t ( n 2 )
where the t-statistic obeys a t-distribution with the freedom of n − 2. According to the statistics obtained by the corresponding probability, a significant α is given (in this study, α = 0.01). If the associated probability is less than or equal to the significance level α, the null hypothesis H0 is rejected, and H1 is accepted, which means a significant linear correlation exists between the two populations. If the associated probability is greater than the significance level α, the null hypothesis H0 is accepted, and no significant linear correlation exists between the two populations.

3. Result and Analysis

3.1. Acquisition of NPP at National Nature Reserves

Based on the NPP data collected from across the entire country, the NPP data of 319 national nature reserves were extracted for the years 2000 and 2010 using the GIS method, as shown in Figure 3 and Figure 4, respectively.

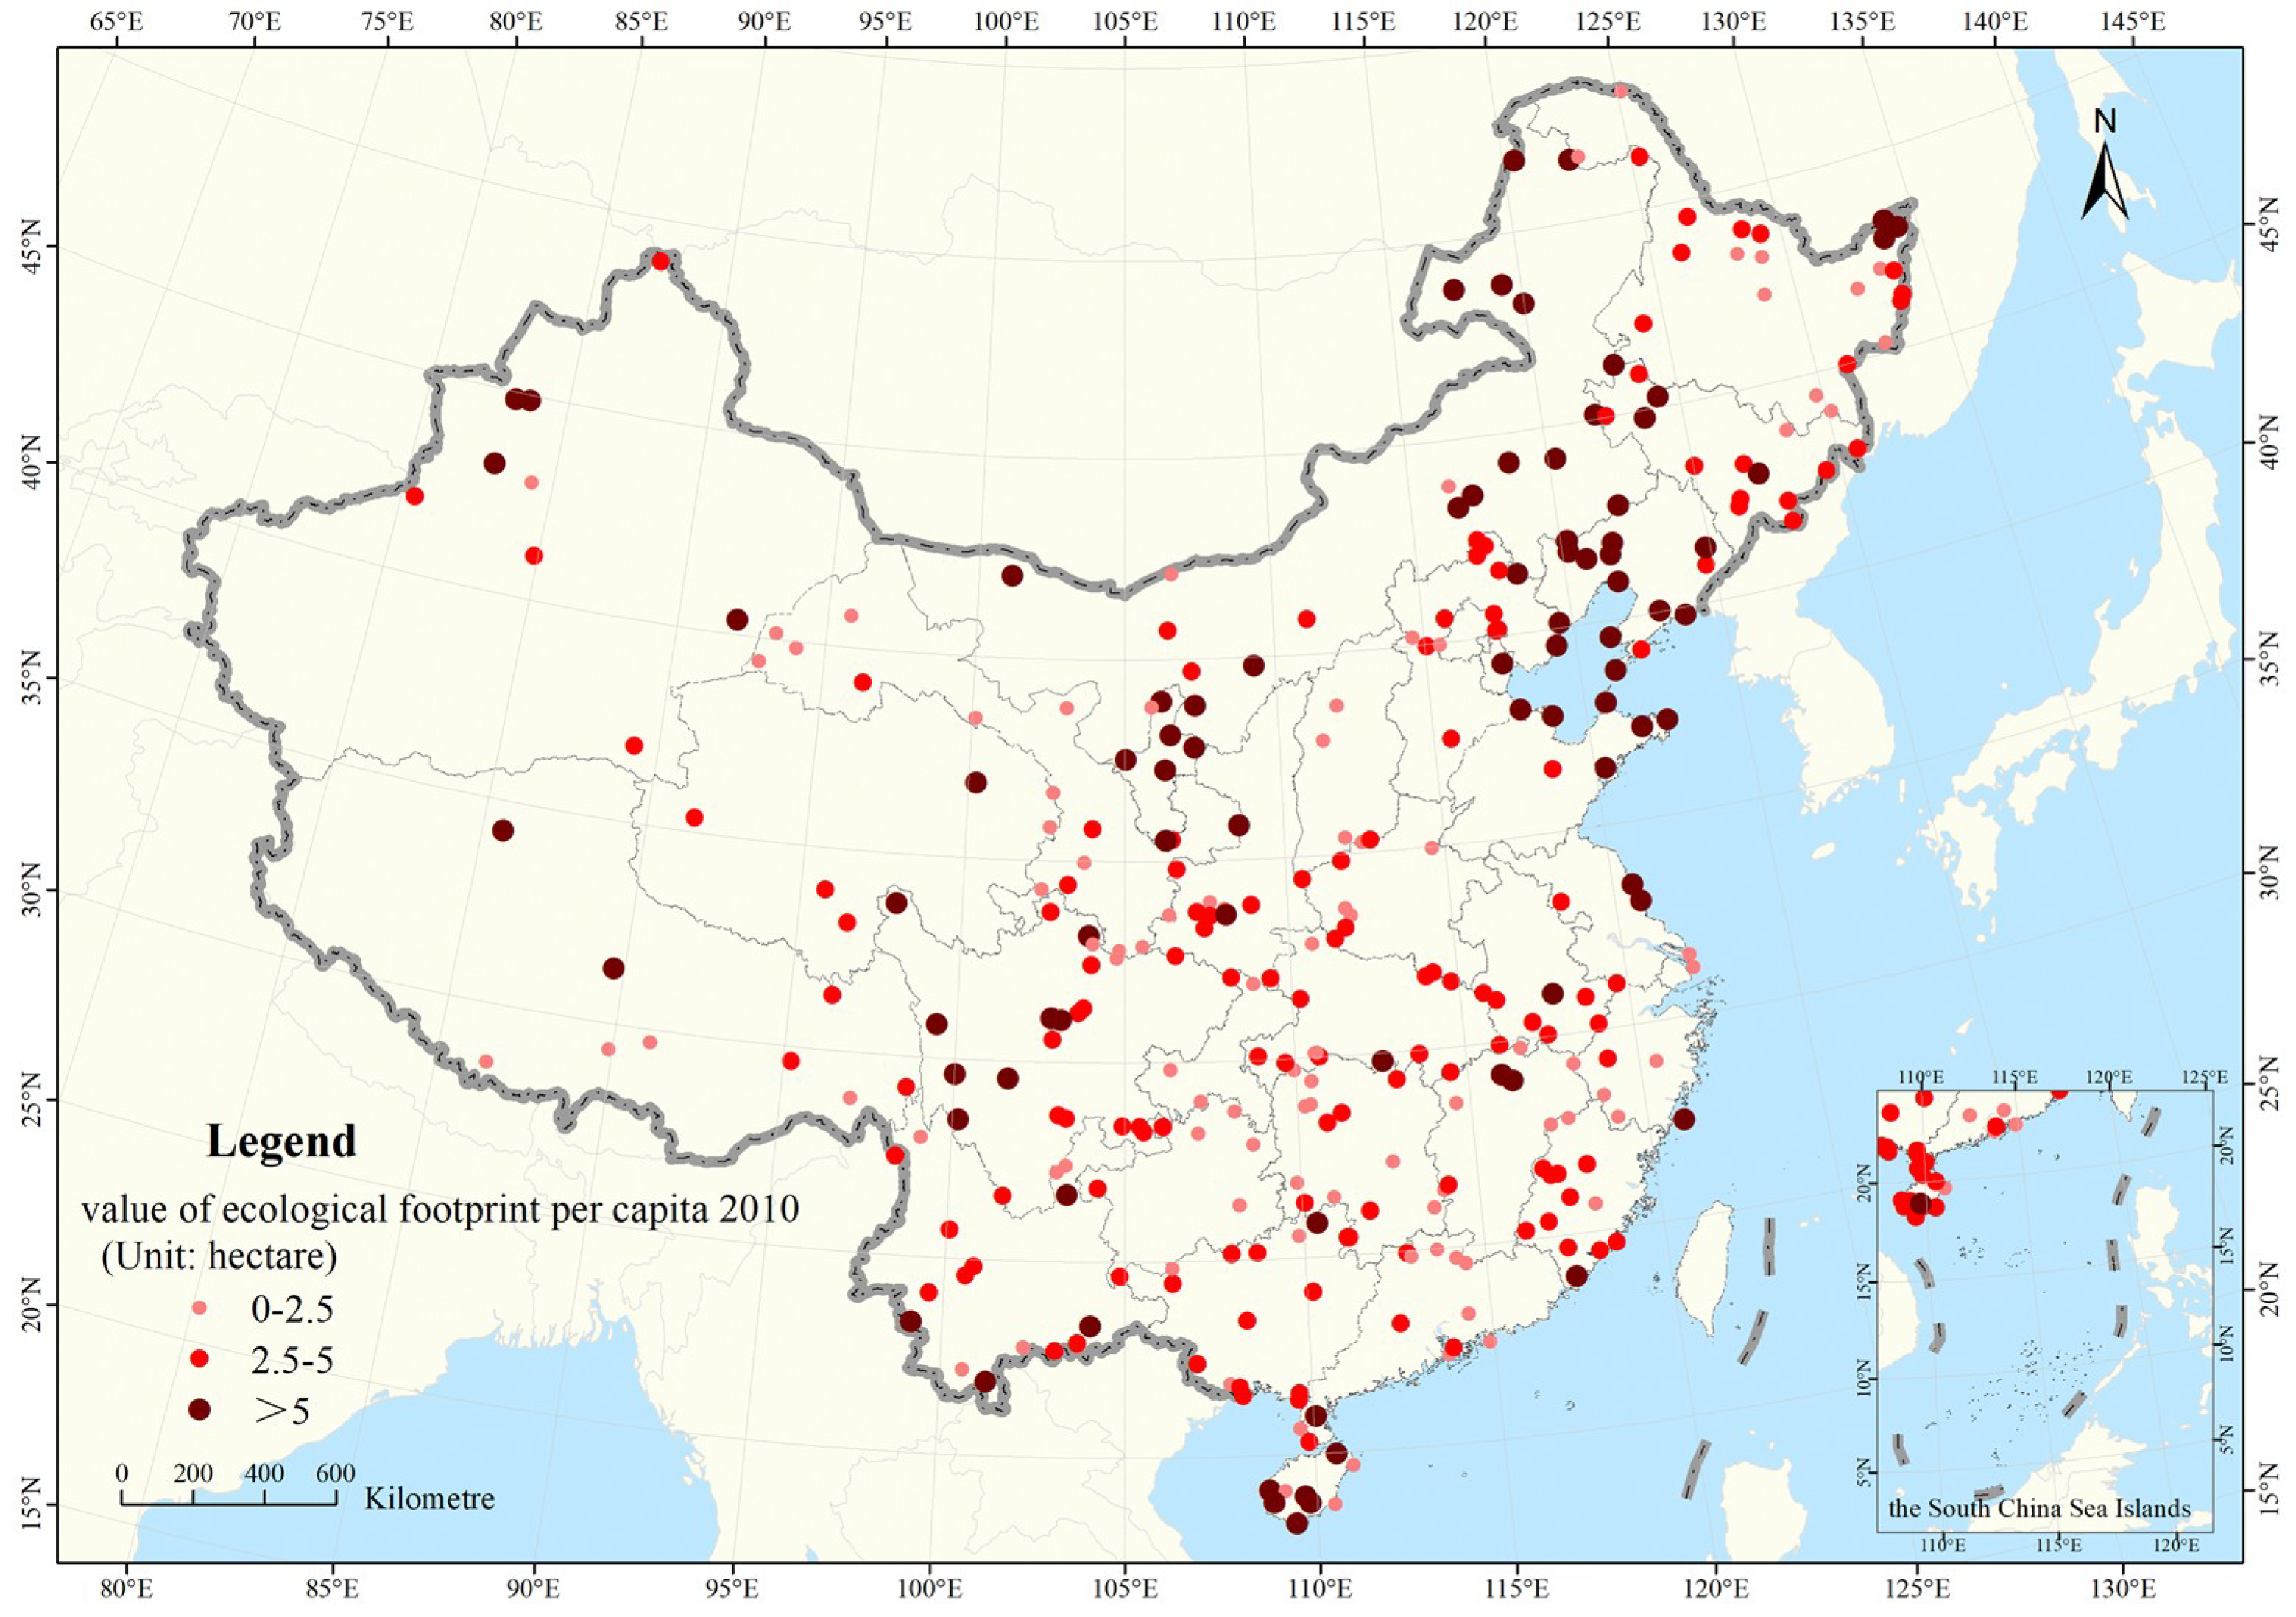
3.2. Spatial Distribution of Average Ecological Footprint in National Nature Reserves

In terms of the per person ecological footprint in different areas, The per person ecological footprint of development and construction land of national nature reserve land in Neimenggu, Ningxia, Liaoning, Xinjiang, and Shandong provinces (district) is more demanding (Figure 5). The per person ecological footprint of farmland of the national nature reserves in the Sichuan, Heilongjiang, and Jilin provinces is more demanding, because the development and construction land as well as farmland occupy the principal part of the per person ecological footprint demand of the national nature reserve, and directly result in a high demand in these areas of the per person ecological footprint. The per person ecological footprint of woodland of national nature reserves in Fujian, Guangxi, Hunan, and Anhui provinces (district) is more demanding, whereas the per person ecological footprint of grassland of national nature reserve in Qinghai, Neimenggu, and Xizang provinces (district) is more demanding. The per person ecological footprint of water area of national nature reserve in coastal provinces such as Shandong, Hainan, Jiangsu, Liaoning, and Guangdong is more demanding.

3.3. Comparison of Equivalence Factor and Yield Factors in the EF-GAEZ Model and EF-NP Model

3.3.1. Equivalence Factor Comparison

In the EF-GAEZ model, the equivalence factors of farmland, woodland, grassland, and waters in the national nature reserve were 2.8, 1.1, 0.5, and 0.2, respectively, and the general rules of farmland > forest land > grassland > water area were presented. The average equivalence factors of farmland, woodland, grassland, and waters in the 2000 national nature reserve calculated by the EF-NPP model were 1.4, 1.08, 0.77 and 0.66, respectively. In terms of the farmland, woodland, grassland, and waters of the national nature reserve in 2010, the average equivalence factors were 1.19, 1.16, 0.85, and 0.73, respectively (Table 2), and all obeyed the laws of farmland > forest land > grassland > water area, which was consistent with the EF-GAEZ model.

3.3.2. Comparison of Yield Factors

In the EF-GAEZ model, the yield factors of farmland, woodland, grassland, and waters in national nature reserves are 1.66, 0.91, 0.19, and 1.00, respectively. The average yield factors of farmland, woodland, grassland, and waters in the 2000 national nature reserve calculated by the EF-NPP model were 0.88, 0.88, 1.77 and 1.13, respectively. The average farmland, woodland, grassland, and waters of the national nature reserve in 2010. The yield factors were 0.88, 0.89, 1.39, and 1.05, respectively (Table 3). Compared with the EF-GAEZ model, the adjustment of the yield factor by the EF-NPP model increases the yield factors of forest land, grassland, and waters in national nature reserves, and reduces the yield factors of farmland and development and construction land. The EF-NPP model greatly improved the ecological carrying capacity of three natural ecosystems in waters, grasslands, and woodlands, increased the importance of three natural ecosystems, and weakened the role of farmland and development and construction land, which is more in line with national nature conservation. The actual situation of the district.

3.4. Correlation Analysis of the Ecological Footprint per Capita between the EF-GAEZ and EF-NPP Models

3.4.1. Correlation Analysis of Ecological Footprint per Capita in 2000

Taking the ecological footprint per capita of 2000 from the EF-GAEZ model as explanatory variables and taking the ecological footprint per capita of 2000 from the EF-NPP model as explanatory variables, two variables were analyzed for correlation and linear regression fit. Figure 6 shows the correlation between the ecological footprint per capita of the national nature reserves calculated by the EF-GAEZ and the EF-NPP models in 2000 (hereafter referred to as the EF-GAEZ2000efpc and the EF-NPP2000efpc). The Pearson correlation coefficient is 0.804, and the determination coefficient R2 is 0.6484. As shown in the correlation test table (Table 4), the significant value of the correlation coefficient between the EF-GAEZ2000efpc and the EF-NPP2000efpc is 0, less than 0.01, which means that the EF-GAEZ2000efpc and the EF-NPP2000efpc show a positive correlation.

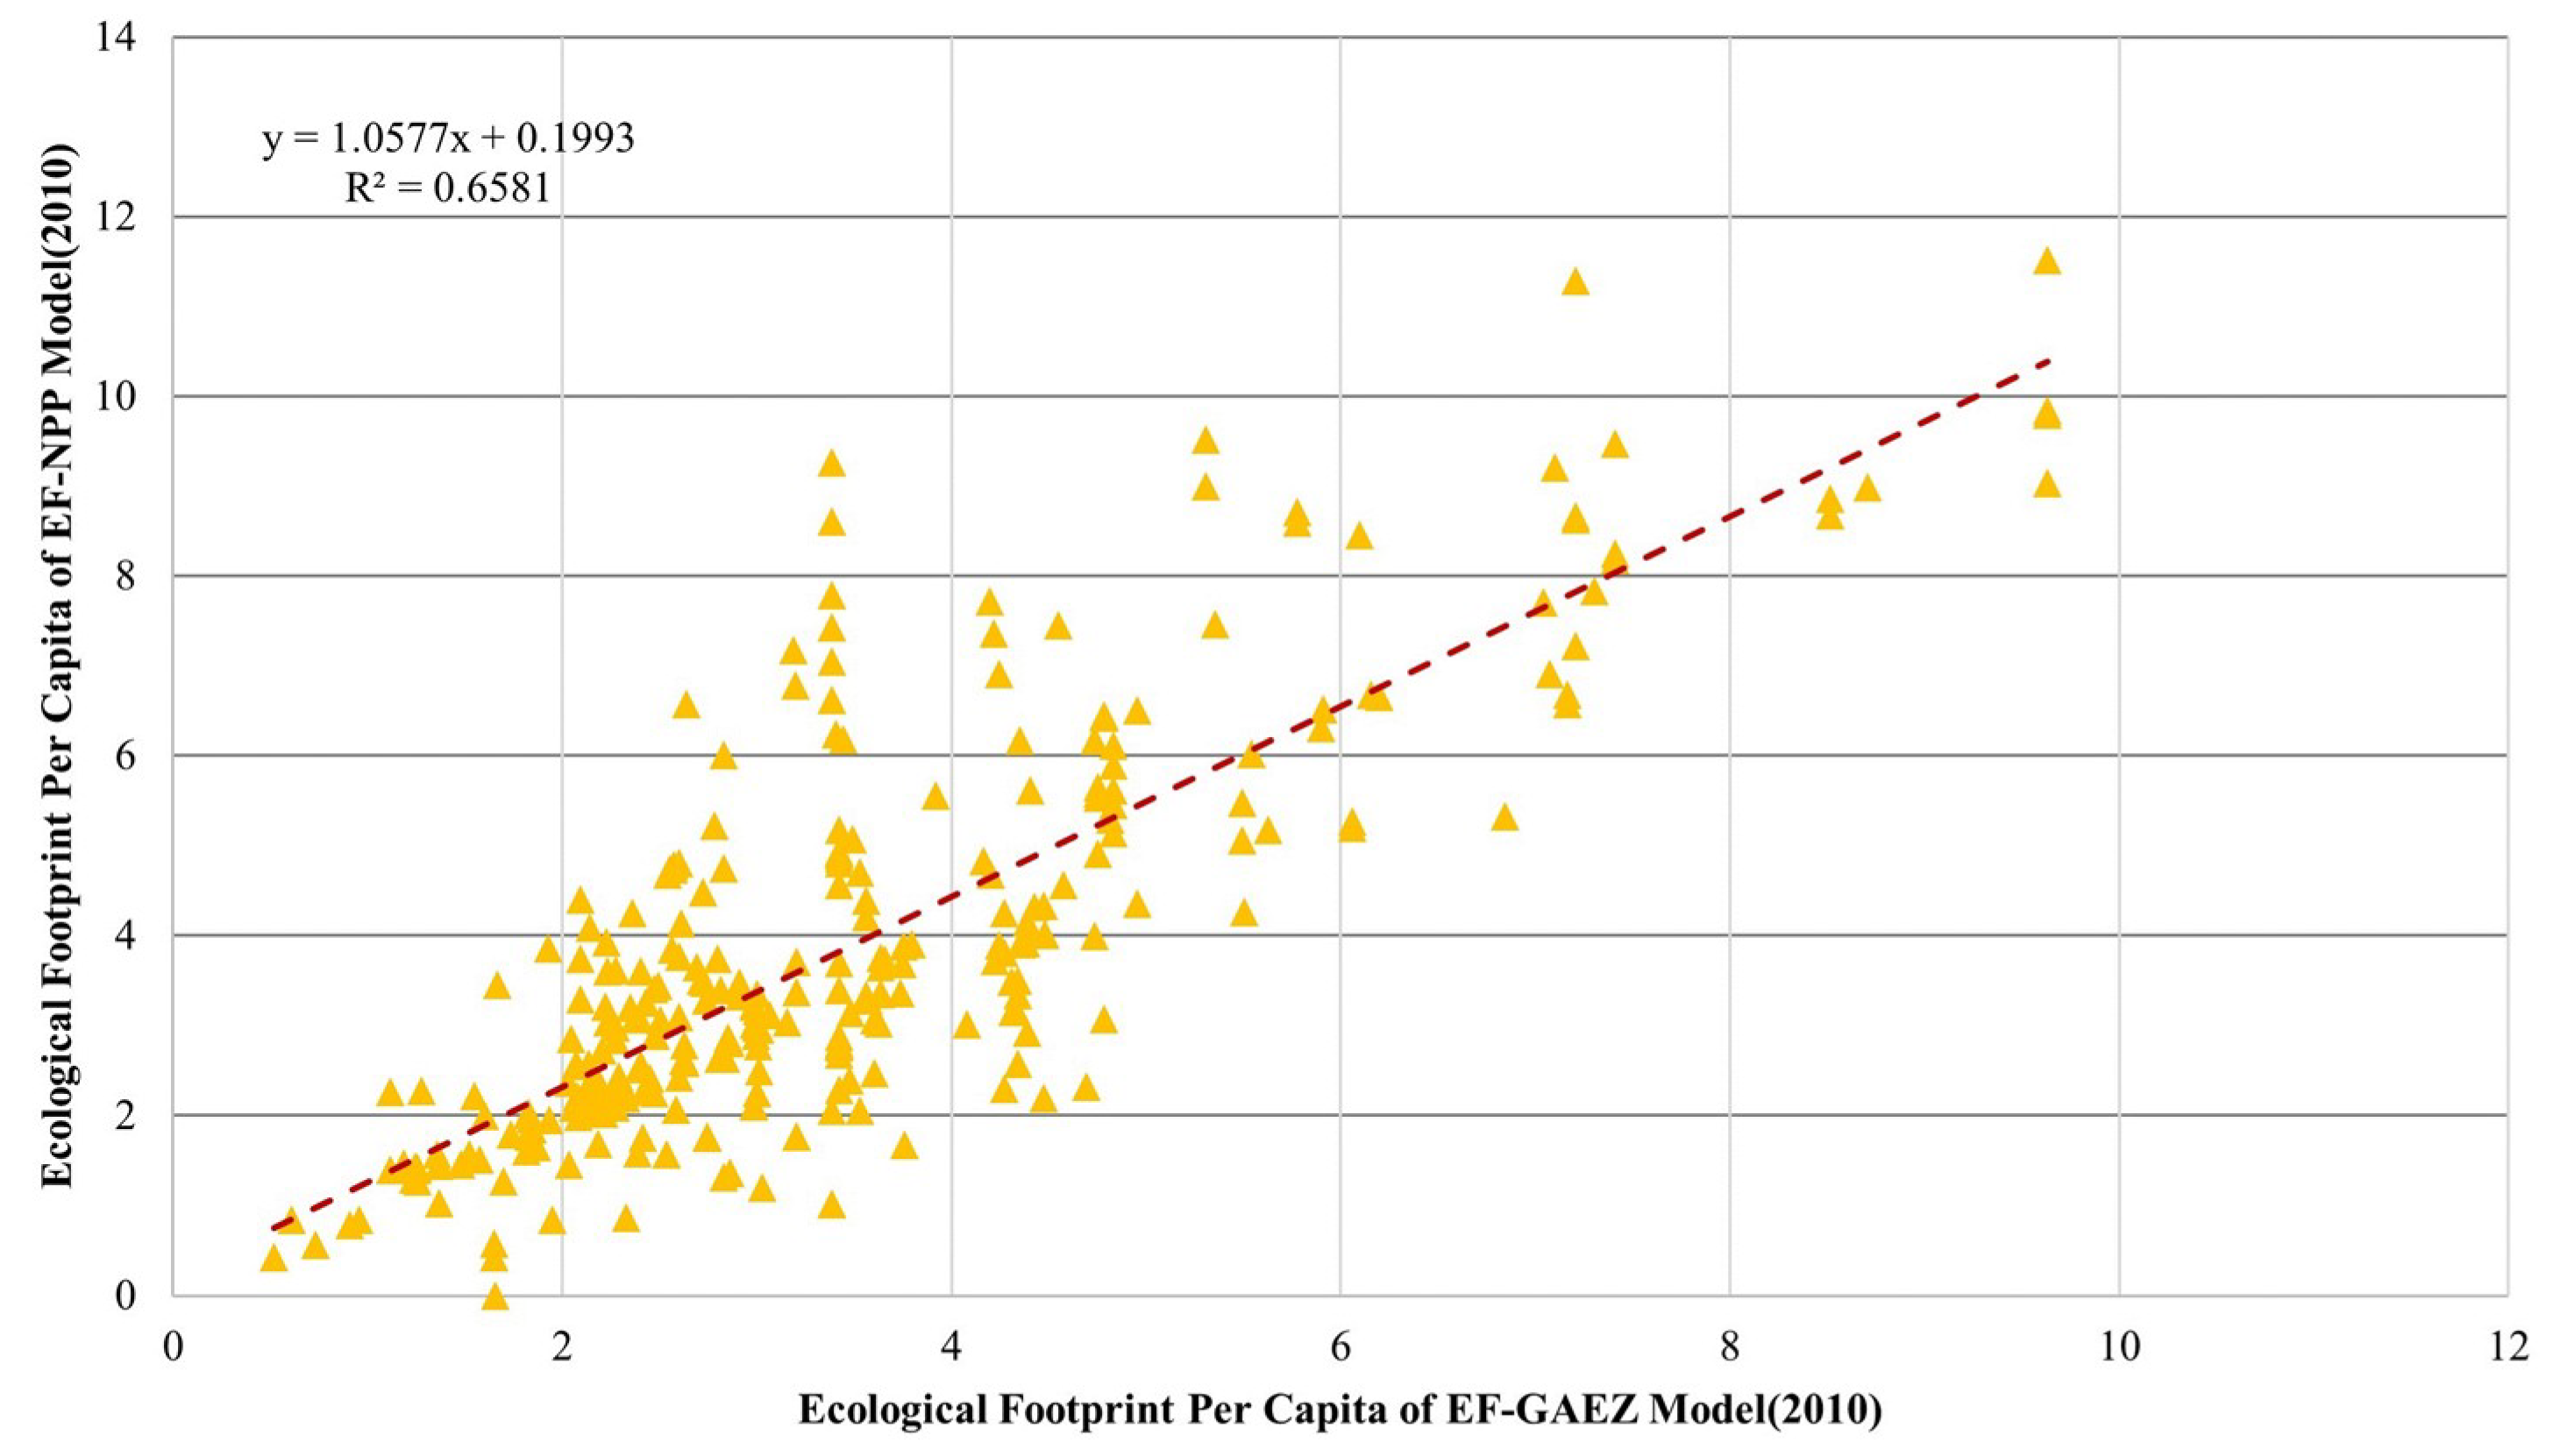
3.4.2. Correlation Analysis of the per Capita Ecological Footprint in 2010

Taking the ecological footprint per capita of 2010 from the EF-GAEZ model as explanatory variables and taking the ecological footprint per capita of 2010 from the EF-NPP model as explanatory variables, two variables were analyzed for correlation and linear regression fit. Figure 7 shows the correlation between the ecological footprint per capita of the national nature reserves calculated by the EF-GAEZ and EF-NPP models in 2010 (hereafter referred to as the EF-GAEZ2010efpc and the EF-NPP2010efpc). The Pearson correlation coefficient is 0.811, and the determination coefficient R2 is 0.6581. As shown in the correlation test table (Table 5), the significant value of the correlation coefficient between the EF-GAEZ2010efpc and the EF-NPP2010efpc is 0, less than 0.01, which means that EF-GAEZ2010efpc and the EF-NPP2010efpc is a positive correlation.

3.5. Consistency Analysis of Ecological Footprint per Capita between the EF-GAEZ and EF-NPP Models

When the current situation and changing rules for the ecological footprints and carrying capacity per capita of national nature reserves are being analyzed, a method that will provide a graded evaluation is generally adopted. If the EF-GAEZ and EF-NPP results are highly consistent at the same level, the spatial distribution of the ecological footprints and the ecological carrying capacities of the national nature reserves in the two models are consistent.
Based on the grading of the ecological footprint per capita and ecological carrying capacity of the EF-GAEZ and EF-NPP models, this section counts the number of nature reserves at the same level to verify the consistency of the EF-NPP model and the EF-GAEZ model. The ecological footprint per capita of the national nature reserve is graded according to two levels: 0–2.5 hectares, and greater than 2.5 hectares.

3.5.1. Comparison of the Ecological Footprint per Capita in 2000

In 2000, based on the EF-NPP model, 208 protection zones had an ecological footprint per capita at the 0–2.5-hectare level, which is 39 fewer than the number based on the EF-GAEZ model. Under the two models, 185 protected zones are the same.
In 2000, based on the EF-NPP model, 111 protection zones had an ecological footprint per capita at the greater than 2.5-hectare level. Under the two models, 44 protected zones are the same (Table 6).
According to the EF-NPP model and the EF-GAEZ model, the ecological footprint per capita of 2000 shows that in two grading levels, the number of national nature reserves that are the same is 229, with a consistency of 72%.

3.5.2. Comparison of the Ecological Footprint per Capita in 2010

In 2010, based on the EF-NPP model, 98 protection zones had an ecological footprint per capita at the 0–2.5-hectare level, which is 5 less than the number based on based on the EF-GAEZ model. Under the two models, 71 protected zones are the same (Table 7).
In 2010, based on the EF-NPP model, 221 protection zones had an ecological footprint per capita at the greater-than-2.5-hectare level. Under the two models, 146 protected zones are the same.
According to the EF-NPP model and the EF-GAEZ model, the ecological footprint per capita of 2010 shows that in two grading levels, the total number of the same national nature reserves is 217, with a consistency of 68%.

4. Discussion

4.1. Uncertainty and Sensitivity Analysis

There is a wide range of uncertainties in the evaluation of the ecological footprint in this paper, which may affect the credibility of the research results. (1) There are limitations in data quality, such as errors transmitted by the data collection process, lacking of data, insufficient data representation, and improper selection of data. (2) There is an uncertainty for some key parameters, such as the balance factor in the model, the measurement of various factors such as soil, temperature, slope, precipitation, the estimation of NPP in grassland and water area, the setting of global average CO2 absorption rate, and the calculation of food consumption in animal husbandry unit products. There may be a lack of funding that meant information was simplified, roughed, or replaced, and this could introduce erroneous knowledge and methods, or even errors in calculations, resulting in uncertainty. (3) There is also uncertainty caused by the inherent defects of the model. If the diversity and interaction of different types of land functions are not considered, the complex mechanism of the Earth’s carbon cycle is simplified, and the trade balance between regions is intricate and difficult to track. Therefore, it is necessary to identify the path and sensitivity of these variables, improving the reliability and credibility of accounting results, and providing relatively accurate information for environmental managers or decision makers in ecological footprint assessment. In the future, the assessment of data quality will be carried out from the aspects of data credibility, time, source, geographic coverage, and technical level. The Monte Carlo method, Latin hypercube sampling, and other methods will be applied for uncertainty quantification and sensitivity analysis.

4.2. The Advantage of the EF-NPP Model

The traditional model typically uses the global average yield factor and equivalence factor. However, many scholars have questioned the scientific quality of the above-mentioned parameter assignment methods, believing that the parameters should be adjusted to characterize the particularity of different regions [22,49,50]. Applying NPP to modify the theory and method of the ecological footprint reflects the actual biomass of different ecosystems under natural or man-made disturbances, and also reflects their ecological value in food production and raw material supply [51]. Compared with the traditional EF-GAEZ model, in terms of calculation method, using the EF-NPP model to calculate the equivalence factor and yield factor has inherent advantages over the traditional EF-GAEZ model. Energy flow of the ecosystem begins with the photosynthesis of green plants, and the EF-NPP model directly reflects the true productivity of plant communities in different ecosystems. Therefore, using the EF-NPP model to represent the biological productivity of land can make the equivalence factor reflect the differences of various types of productivity more directly and accurately. The calculation of the ecological footprint can truly reflect our occupancy of the ecosystem supply capacity, so that the ecological sustainability of national nature reserves can be better assessed. At the same time, the EF-NPP model can realize the real-time update of the yield factors, especially for the ecosystem types such as grassland and woodland, which prove difficult when using the conventional methods such as statistical or investigation methods to quantify their productivity. The EF-NPP model can solve the problems that the static yield factor cannot solve. The EF-NPP model can reflect the change of global climate, the degradation of soil, and the progress of technology.

5. Conclusions

Since the EF-NPP model is improved on the EF-GAEZ model, they both have the same calculation model, their ecological footprint per capita and ecological carrying capacity per capita of the National Nature Reserve in 2000 and 2010 are significantly related, all their Pearson correlation coefficients are above 0.8. The ecological footprint per capita and ecological carrying capacity per capita calculated by the two models are highly consistent, more than 68% in total, which shows that the ecological footprint per capita and the ecological carrying capacity per capita of the two models follow the same rule. The results of the EF-NPP model is credible. According to the conclusion of the project, national nature reserves are dominated by natural ecosystems in 2000 and 2010, accounting for more than 90% of all reserves in China (Ministry of Environmental Protection, etc.). As the EF-NPP model increases the yield factors of three types of natural ecosystems—woodland, grassland, and waters—in the national nature reserve, the ecological carrying capacity per capita of the EF-NPP model is greater than that of the EF-GAEZ model. The increase of ecological carrying capacity, according to ecological footprint, makes the ecological deficit appear later in the EF-NPP model than in the EF-GAEZ model. The result of the EF-NPP model is more optimistic than the result of the EF-GAEZ model, which partially solves the question about the pessimistic results of EF-GAEZ. Therefore, EF-NPP is more sensible than EF-GAEZ for the study of the trend of ecological footprint.

Author Contributions

X.L. wrote the majority of the paper; J.F. conceived and designed the survey; J.L., H.L. and C.S. contributed to data analysis; D.J. and R.W. provided some useful suggestions.

Funding

This research was funded by the Strategic Priority Research Program of the Chinese Academy of Sciences [XDA19040305], Institute of Geographical Sciences and Natural Resources Research (grant number 2016RC203) and the Program of Long-term Monitoring of Nature reserves in China based on sky and earth [2038001006].

Acknowledgments

Data of national nature reserves used in this paper is provided by Nanjing Institute of Environmental Sciences, Ministry of Environmental Protection. We are very grateful for the support.

Conflicts of Interest

The authors declare no conflict of interest.

References

  1. Ciftcioglu, G.C. Revealing major terrestrial- and marine species-based provisioning ecosystem services provided by the socio-ecological production landscapes and seascapes of Lefke Region in North Cyprus. Environ. Dev. Sustain. 2018, 20, 197–221. [Google Scholar] [CrossRef]
  2. Fan, M.M.; Li, W.J. Research progress and debate on the theory of payment for ecosystem services: Based on the relationship between ecology and society. China Popul. Resour. Environ. 2017, 27, 137. [Google Scholar] [CrossRef]
  3. Holden, E.; Linnerud, K. The sustainable development area: Satisfying basic needs and safeguarding ecological sustainability. Sustain. Dev. 2010, 15, 174–187. [Google Scholar] [CrossRef]
  4. Velis, M.; Conti, K.I.; Biermann, F. Groundwater and human development: Synergies and trade-offs within the context of the sustainable development goals. Sustain. Sci. 2017, 12, 1007–1017. [Google Scholar] [CrossRef]
  5. Wood, S.L.; Jones, S.K.; Johnson, J.A.; Brauman, K.A.; Chaplin-Kramer, R.; Fremier, A.; Girvetz, E.; Gordon, L.J.; Kappel, C.V.; Mandle, L.; et al. Distilling the role of ecosystem services in the Sustainable Development Goals. Ecosyst. Serv. 2018, 29, 70–82. [Google Scholar] [CrossRef]
  6. Zagonari, F. Using ecosystem services in decision-making to support sustainable development: Critiques, model development, a case study, and perspectives. Sci. Total Environ. 2016, 548, 25–32. [Google Scholar] [CrossRef] [PubMed]
  7. Osio, N.; Yanagihara, K.; Tani, Y. A Study on On-the-Machine Tool Re-Generation Technology: Process development for grinding tools with rapid baking system(Grinding technology). Nat. Genet. 2017, 10, 188–195. [Google Scholar] [CrossRef]
  8. Boucher, M.; Turcotte, N.; Guillemette, V.; Lantagne, G.; Chapotot, A.; Pourcelly, G.; Sandeaux, R.; Gavach, C. Recovery of spent acid by electrodialysis in the zinc hydrometallurgy industry: Performance study of different cation-exchange membranes. Hydrometallurgy 2018, 45, 137–160. [Google Scholar] [CrossRef]
  9. Fairhurst, C.W.; Ryge, G. The effectiveness of China’s National Forest Protection Program and National-level Nature Reserves, 2000 to 2010: PREPRINT. Biorxiv 2013. [Google Scholar] [CrossRef]
  10. Wang, L.; Pan, Y.; Cao, Y.; Li, B.; Wang, Q.; Wang, B.; Pang, W.; Zhang, J.; Zhu, Z.; Deng, G. Detecting early signs of environmental degradation in protected areas: An example of Jiuzhaigou Nature Reserve, China. Ecol. Indicat. 2018, 91, 287–298. [Google Scholar] [CrossRef]
  11. Senczyno, M.; Gerlée, A. Land use change impact on the nature reserves located in urban development areas: The case of the Natolin Forest and the Stefan Starzyński Kabacki Forest. Prace I Stud. Geogr. 2017, 62, 31–51. [Google Scholar]
  12. Ma, P.; Ye, G.; Peng, X.; Liu, J.; Qi, J.; Jia, S. Development of an index system for evaluation of ecological carrying capacity of marine ecosystems. Ocean Coast. Manag. 2017, 144, 23–30. [Google Scholar] [CrossRef]
  13. Ramirez-Acosta, J.; Castellanos, A.; Arnaud, G.; Breceda, A.; Rojas-Soto, O. Conservation of endemic terrestrial vertebrates in the protected areas of the Baja California Peninsula, Mexico. Nat. Areas J. 2017, 32, 15–30. [Google Scholar] [CrossRef]
  14. Nakajima, E.S.; Ortega, E. Carrying capacity using emergy and a new calculation of the ecological footprint. Ecol. Indicat. 2016, 60, 1200–1207. [Google Scholar] [CrossRef]
  15. Wang, S.; Yang, F.L.; Xu, L.; Du, J. Multi-scale analysis of the water resources carrying capacity of the Liaohe Basin based on based on ecological footprints. J. Clean. Prod. 2013, 53, 158–166. [Google Scholar] [CrossRef]
  16. Świąder, M.; Szewrański, S.; Kazak, J.; van Hoof, J.; Lin, D.; Wackernagel, M.; Alves, A. Application of ecological footprint accounting as a part of an integrated assessment of environmental carrying capacity: A case study of the footprint of food of a large city. Resources 2018, 7, 52. [Google Scholar] [CrossRef]
  17. Lin, D.; Hanscom, L.; Murthy, A.; Galli, A.; Evans, M.; Neill, E.; Mancini, M.; Martindill, J.; Medouar, F.Z.; Huang, S.; et al. Ecological footprint accounting for countries: Updates and results of the national footprint accounts. 2012–2018. Resources 2018, 7, 58. [Google Scholar] [CrossRef]
  18. Astles, K.L.; Holloway, M.G.; Steffe, A.; Green, M.; Ganassin, C.; Gibbs, P.J. An ecological method for qualitative risk assessment and its use in the management of fisheries in New South Wales, Australia. Fish. Res. 2006, 82, 290–303. [Google Scholar] [CrossRef]
  19. Dai, L.; Xu, B.; Wu, B. Assessing sustainable development of a historic district using an ecological footprint model: A case study of Nanluoguxiang in Beijing, China. Area 2017, 49, 94–105. [Google Scholar] [CrossRef]
  20. Ghita, S.; Saseanu, A.; Gogonea, R.M.; Huidumac-Petrescu, C.E. Perspectives of ecological footprint in European context under the impact of information society and sustainable development. Sustainability 2018, 10, 3224. [Google Scholar] [CrossRef]
  21. Lyon, S.W.; Desilets, S.L.E.; Troch, P.A. Characterizing the response of a catchment to an extreme rainfall event using hydrometric and isotopic data. Water Resour. Res. 2008, 44, 214. [Google Scholar] [CrossRef]
  22. Wackernagel, M.; Monfr, C.; Er, K.H. Ecological footprint time series of Austria, the Philippines, and South Korea for 1961–1999: Comparing the conventional approach to an ‘actual land area’ approach. Land Use Policy 2004, 21, 261–269. [Google Scholar] [CrossRef]
  23. Rees, W.; Wackernagel, M. Urban Ecological Footprints: Why Cities Cannot be Sustainable—And Why They are a Key to Sustainability. Environ. Impact Assess. Rev. 1996, 16, 223–248. [Google Scholar] [CrossRef]
  24. Kalbar, P.P.; Birkved, M.; Karmakar, S.; Nygaard, S.E.; Hauschild, M. Can carbon footprint serve as proxy of the environmental burden from urban consumption patterns? Ecol. Indicat. 2017, 74, 109–118. [Google Scholar] [CrossRef]
  25. Lanouar, C. The impact of energy consumption and economic development on Ecological Footprint and CO2 emissions: Evidence from a Markov Switching Equilibrium Correction Model. Energy Econ. 2017, 65, 355–374. [Google Scholar]
  26. He, J.; Wan, Y.; Feng, L.; Ai, J.; Wang, Y. An integrated data envelopment analysis and emergy-based ecological footprint methodology in evaluating sustainable development, a case study of Jiangsu Province, China. Ecol. Indicat. 2016, 70, 23–34. [Google Scholar] [CrossRef]
  27. Morgan, J. Ecological Footprints: An Essential Franciscan Guide for Faith and Sustainable Living. J. Soc. Christ. Ethics 2016, 36, 219–221. [Google Scholar] [CrossRef]
  28. Fan, Y.; Qiao, Q.; Xian, C.; Xiao, Y.; Fang, L. A modified ecological footprint method to evaluate environmental impacts of industrial parks. Resour. Conserv. Recycl. 2017, 125, 293–299. [Google Scholar] [CrossRef]
  29. Monfreda, C.; Wackernagel, M.; Deumling, D. Establishing national natural capital accounts based on detailed Ecological Footprint and biological capacity assessments. Land Use Policy 2004, 21, 231–246. [Google Scholar] [CrossRef]
  30. Reznichenko, N.; Davies, T.; Shulmeister, J.; McSaveney, M. Effects of debris on ice-surface melting rates: An experimental study. J. Glaciol. 2017, 56, 384–394. [Google Scholar] [CrossRef]
  31. Oku, E.E.; Ojikpong, T.; Yakubu, A.; Ezeaku, P. Soil Carbon Dynamics and Soil Properties Influenced by Different Types of Agronomic Land Use in the Forest Zone of Nigeria. J. Environ. Agric. Sci. 2015, 2, 1–5. [Google Scholar]
  32. Johannesen, A.B.; Nielsen, A.; Skonhoft, A. Livestock management at northern latitudes. Potential economic effects of climate change in sheep farming. Ecol. Econ. 2013, 93, 239–248. [Google Scholar] [CrossRef]
  33. Kitzes, J.; Galli, A.; Rizk, S.M.; Reed, A.; Wackernagel, M. Guidebook to the National Footprint Accounts; Global Footprint Network: Oakland, CA, USA, 2008. [Google Scholar]
  34. Laššák, P.; Labovský, J.; Jelemenský, Ĺ. Influence of parameter uncertainty on modeling of industrial ammonia reactor for safety and operability analysis. J. Loss Prev. Process Ind. 2010, 23, 280–288. [Google Scholar] [CrossRef]
  35. Tolk, A.; Bair, L.J.; Diallo, S.Y. Supporting Network Enabled Capability by extending the Levels of Conceptual Interoperability Model to an interoperability maturity model. J. Defense Model. Simul. 2013, 10, 145–160. [Google Scholar] [CrossRef]
  36. Wang, M.L.; Xu, F.L.; Lloyd, G.M. Results and implications of the damage index method applied to a multi-span continuous segmental prestressed concrete bridge. Struct. Eng. Mech. 2000, 10, 37–51. [Google Scholar] [CrossRef]
  37. Trousdale, W.; Gregory, R. Property evaluation and biodiversity conservation: Decision support for making hard choices. Ecol. Econ. 2004, 48, 279–291. [Google Scholar] [CrossRef]
  38. Urban, N.A.; Swihart, R.K.; Malloy, M.C.; Dunning, J.B., Jr. Improving selection of indicator species when detection is imperfect. Ecol. Indicat. 2012, 15, 188–197. [Google Scholar] [CrossRef]
  39. Tikabo, M.O.; Holden, S.T.; Bergland, O. Factor market imperfections and the land rental market in the highlands of Eritrea: Theory and evidence. Available online: http://www.umb.no/statisk/ior/discpaper/tenancy5_final5.pdf (accessed on 18 December 2018).
  40. Zhu, F.W.; Jin, Z.F.; Cui, F.F.; Lv, L.G.; Wang, J. Analysis of Land-Use Temporal and Spatial Pattern in Southern Jiangsu. Resour. Environ. Yangtze Basin 2015, S1, 23–29. [Google Scholar]
  41. Venetoulis, J. Assessing the ecological impact of a university: The ecological footprint for the University of Redlands. Int. J. Sustain. Higher Educ. 2001, 2, 180–197. [Google Scholar] [CrossRef]
  42. Talberth, J. By the Numbers: Economic Impacts of Climate Change in the Lower Mekong Basin. Available online: https://www.wri.org/blog/2015/02/numbers-economic-impacts-climate-change-lower-mekong-basin (accessed on 18 December 2018).
  43. Siche, R.; Agostinho, F.; Ortega, E. Emergy Net Primary Production (ENPP) as basis for calculation of Ecological Footprint. Ecol. Indic. 2010, 10, 475–483. [Google Scholar] [CrossRef]
  44. Liu, M.C.; Li, W.H. The calculation of China’s equivalence factor under ecological footprint mode based on net primary production. J. Nat. Resour. 2009, 24, 1550–1559. [Google Scholar] [CrossRef]
  45. Zhou, N.; Li, Y.C. Study on the ecological carrying capacity of Chongqing city Based on the ecological footprint improved model. J. Chongqing Normal Univ. 2018, 35, 56–63. [Google Scholar]
  46. Newsted, J.L.; Nakanishi, J.; Cousins, I.; Werner, K.; Giesy, J.P. Predicted distribution and ecological risk assessment of a “segregated” hydrofluorrother in the Japanese environment. Environ. Sci. Technol. 2002, 36, 4761–4769. [Google Scholar] [CrossRef] [PubMed]
  47. Penela, A.C.; Villasante, C.S. Applying physical input–output tables of energy to estimate the energy ecological footprint (EEF) of Galicia (NW Spain). Energy Policy 2008, 36, 1148–1163. [Google Scholar] [CrossRef]
  48. Gholkar, M.D.; Goroshi, S.; Singh, R.P.; Parihar, J.S. Influence of agricultural developments on net primary productivity (NPP) in the semi-arid region of India: A study using GloPEM Model. In Proceedings of the The International Archives of the Photogrammetry, Remote Sensing and Spatial Information Sciences, Volume XL-8, 2014 ISPRS Technical Commission VIII Symposium, Hyderabad, India, 9–12 December 2014. [Google Scholar]
  49. Van Vuuren, D.P.; Smeets, E.M.W. Ecological footprints of Benin, Bhutan, Costa Rica and the Netherlands. Ecol. Econ. 2000, 34, 115–130. [Google Scholar] [CrossRef]
  50. Haberl, H.; Erb, K.H.; Krausmann, F. How to calculate and interpret ecological footprints for long periods of time: The case of Austria 1926–1995. Ecol. Econ. 2001, 38, 25–45. [Google Scholar] [CrossRef]
  51. Venetoulis, J.; Talberth, J.J.E. Refining the ecological footprint. Environ. Dev. Sustain. 2008, 10, 441–469. [Google Scholar] [CrossRef]
Figure 1. Spatial distribution of the national nature reserve in China.
Sustainability 11 00002 g001
Figure 2. The flow diagram of this stud. EF-NPP represented the model on account of net primary productivity for Ecological Footprint; EF-GAEZ represented the model on account of Global Agro-Ecological Zone for Ecological Footprint.
Sustainability 11 00002 g002
Figure 3. Distribution of the net primary productivity of national nature reserves in 2000.
Sustainability 11 00002 g003
Figure 4. Distribution of net primary productivity of national nature reserves in 2010.
Sustainability 11 00002 g004
Figure 5. Spatial distribution of average ecological footprint in National Nature Reserves in 2010.
Sustainability 11 00002 g005
Figure 6. Correlation of the ecological footprint per capita between the EF-GAEZ and EF-NPP models (2000) (Unit: hectare).
Sustainability 11 00002 g006
Figure 7. Correlation of the ecological footprint per capita between the EF-GAEZ and the EF-NPP models (2010) (Unit: hectare).
Sustainability 11 00002 g007
Table 1. The amount of national nature reserves by county level.
Counties Involved by National Nature ReservesNumber of National Nature Reserves
1227
2–581
5–1010
>101
Table 2. The average value of the equivalence factor in the EF-NPP model.
Type20102000
Farmland1.191.40
Forest1.161.08
Grassland0.850.77
Water Area0.730.66
Table 3. The average value of the yield factor in the EF-NPP model.
Type20102000
Farmland0.880.88
Forest0.890.88
Grassland1.391.77
Water Area1.051.13
Table 4. Correlation Test of the Ecological Footprint Per Capita between the EF-GAEZ and EF-NPP Models (2000).
Comparison ValueParameterEF-GAEZ2000efpcEF-NPP2000efpc
EF-GAEZ2000efpcPearson correlation10.804 **
P-value-0.000
EF-NPP2000efpcPearson correlation0.804 **1
P-value0.000-
Note: ** Significantly related at the 0.01 level (both sides). P-value reflects the correlation, when P-value < 0.05, the correlation is very significant.
Table 5. Correlation Test of the Ecological Footprint Per Capita between the EF-GAEZ and EF-NPP Models (2010).
Comparison ValueParameterEF-GAEZ2010efpcEF-NPP2010efpc
EF-GAEZ2010efpcPearson correlation10.811 **
P-value 0.000
EF-NPP2010efpcPearson correlation0.811 **1
P-value0.000
Note: ** Significantly related on the 0.01 level (both sides). P-value reflects the correlation, when P-value < 0.05, the correlation is very significant.
Table 6. Ecological Footprint Per Capita Consistency Comparison between the EF-GAEZ and EF-NPP models at Different Levels (2000) (Unit: hectare).
Ecological Footprint per Capita 2000EF-NPP modelEF-GAEZ modelSame Number of Protection Zones
NumberPercentageNumberPercentage
0–2.520865%24777%185
>2.511135%7223%44
Table 7. Ecological Footprint Per capita Consistency Comparison between the EF-GAEZ and EF-NPP Models at Different Levels (2010) (Unit: hectare).
Ecological Footprint per Capita 2010EF-NPP modelEF-GAEZ modelSame Number of Protection Zones
NumberPercentageNumberPercentage
0–2.59831%10332%71
>2.522169%21668%146

