Evaluation of Spatial Balance of China’s Regional Development

1
Faculty of Geographical Science, Beijing Normal University, Beijing 100875, China
2
Institutes of Science and Development, Chinese Academy of Sciences, Beijing 100190, China
3
Institute of Spatial Planning and Regional Economy, Chinese Academy of Macroeconomic Research, Beijing 100038, China
*
Author to whom correspondence should be addressed.
Sustainability 2018, 10(9), 3314; https://doi.org/10.3390/su10093314
Submission received: 12 July 2018
/
Revised: 2 September 2018
/
Accepted: 2 September 2018
/
Published: 17 September 2018
Abstract
:China’s substantial economic growth and rapid urbanization has brought about some negative effects, one of which is spatial imbalance. Spatial imbalance has attracted considerable attention from both the government and researchers, since it has severely hindered regional sustainable development. This study, from the perspective of the matching relationship between spatial supply capacity and development demand intensity, evaluates the spatial balance of 290 prefecture-level cities in China by establishing an index system that considers the economy, society, resources, and the environment. The findings of this study have demonstrated that the strategies and measures of China in the last few years have brought about a spatial imbalance in regional development while rapidly boosting economic growth. The results reveal that there is not a corresponding relationship between spatial supply capacity and development demand intensity in China’s regional development, indicating that most cities in China are in an imbalanced state regarding regional development. Only a few cities have reached spatial balance, while overexploitation is a common phenomenon. This study displays an overall perspective on the state of spatial balance in China, providing a sound basis for implementing pertinent governance measures in different regions.
1. Introduction
China has experienced substantial economic growth and rapid urbanization during the last four decades, the main contributing factor for which has been the massive and intensive input of resources and factors. After the reform and opening up, China’s central government has implemented regional development strategies through consecutive five-year plans to realize China’s rapid economic development, which can be divided into three phases. The first period was from 1978 to 1994, with the imbalanced regional development strategy giving priority to the development of eastern coastal China. In this period, the government tried to encourage the eastern coastal areas to develop first and let some people and some regions become rich by opening up the coastal cities and establishing economic-technological development areas in Eastern China. The strategy greatly enhanced the economic growth of China while gradually making the development gap between the eastern region and the central and western regions larger. The second period was from 1995 to 2008, with the coordinated regional development strategy targeting the narrowing of regional disparities. The strategies of Western Development, the revitalization of the Old Industrial Base in Northeast China, and the rise of Central China were implemented to promote the development of the central and western areas. With rapid economic development, however, the development gap between urban and rural areas has widened and the contradiction between socioeconomic development and the resources utilization and environmental protection has become increasingly conspicuous. The third period was from 2009 to today, with the comprehensive coordinated regional development strategy targeting balanced development [1,2]. The government further propelled the overall regional development strategy and developed the strategic layout, including four regions and three supporting belts, which was called the “4+3 layout”, to promote multi-polar development. In addition, to realize the coordinated development of China’s population, economy, society, resources, and environment, and to narrow urban and rural disparities, China implemented strategies for major function-oriented zones and new-type urbanization, the implementation of which has resulted in some new changes in China’s economic spatial layout and the emergence of a “polycentric network” spatial pattern.
The strategies and measures have brought unprecedented economic growth and urbanization to China, reshaping the spatial layout of China’s economy while generating various negative effects. The urban space has sprawled disorderedly in recent years, with an increasing pressure on resource and environmental constraints faced by regional development resulting in the prominent contradiction between regional development and ecological protection.
One of the most serious issues created by the rapid economic development and the disordered sprawl of urban space is the spatial imbalance of regional development, which mainly lies in three “mismatches”.
The first mismatch is between the economic layout and the carrying capacity of resources and environment. The intensity of national land exploitation in some coastal developed regions has exceeded the carrying capacity of local resources and the environment, causing the decline of ecological and environmental quality. Studies have shown that the ecological footprint in China has been enlarged in the past twenty years. The megacities cities, such as Xi’an, Chengdu, Chongqing, and Shanghai, have met the threshold of below 2.5 global hectares for EF/capita, and over 3000 dollars/capita (in 2010 US$) for GPI/capita [3]. Even in Northwest China, the ecological footprint has increased from 57,770.19 thousand national hectares (NHA) in 2005 to 96,501.66 thousand NHA in 2014 [4]. In particular, with the overexploitation of national land, the ecological space has been eroded, and many cultivated lands, forest lands, grasslands and wetlands have been exploited arbitrarily, leading to severe ecological problems, such as soil erosion, shrinking of wetlands, drying of rivers and lakes, and declining groundwater levels. Consider the Pearl River Delta as an example, where urban construction land has expanded quickly with rapid economic development. Construction land in the Pearl River Delta was 246.58 km2 in 1979, while it reached 5844.58 km2 in 2009, with the proportion of construction land to the entire regional land increasing from 0.5% in 1979 to 10.8% in 2009 [5]. At the same time, along with increasing population density and economic intensity, the Pearl River Delta faced a greater pressure regarding regional resources and the environment, with growing evidence of environmental pollution, ecosystem function degradation, traffic congestion, and other issues. According to data from the Statistical Yearbook of Guangdong Province, the discharge volume of wastewater in the Pearl River Delta rose from 5.254 billion tons in 2010 to 6.327 billion tons in 2012, an increase of 20.4%. In addition, the large gap between regional economic development and the carrying capacity of resources and the environment can result in a massive and long-distance flow of production factors and goods, which not only increases waste in transit, but also raises costs and presents a risk to China’s economy.
The second mismatch is between the economic layout and the population distribution. Economic agglomeration can bring about population gathering, thus coordinating the population distribution with the economic layout because the areas where the economy aggregates usually are places where jobs and people concentrate. In this regard, Japan has reached a basic balance, with the three major metropolitan areas achieving 70% of Japan’s GDP and gathering 65% of the population. China’s economy and population have been moving in the same direction at a relatively slow pace. Since the reform and opening up, China’s industries have been continuously concentrated in the coastal areas and urban agglomerations, which did not attract the corresponding size of the population simultaneously. In 2015, the regional GDP of China’s ten major urban agglomerations, with 9.74% of the national land, accounted for 59.3% of the GDP of the country while the population accounted for only 35.87%. In 2015, the proportion of the regional GDP to the national GDPin Jiangsu province, Guangdong province, Zhejiang province, Shanghai municipality, Beijing municipality, Shandong province, Tianjin municipality, Fujian province, and Liaoning province was more than that of its population, especially in Jiangsu province and Guangdong province, with 3.88 and 2.16 percentage points higher, respectively. However, the proportion of the economic performance in most of the central and western provinces was less than that of the population. The mismatch between the population and the economy directly widens regional disparities, enhancing uncoordinated development among regions. In 2015, per capita GDP in Tianjin, which was the highest in China, was 4.09 times that of Gansu province, which had the lowest per capita GDP in China.
The third mismatch is between the shortage of land resources and the rapid expansion of construction land. The land for urban construction increased dramatically in the process of rapid urbanization in China, leading to disordered urban expansion and urban sprawl, which wasted many land resources. Many large and medium-sized cities in China have flocked to build new towns, industrial parks, university towns, and large plazas since 2000, resulting in land exploitation that has been out of control and construction land that has expanded too quickly. The total amount of cultivated land has declined year by year, and in particular, high-quality arable land in economically developed areas has been lost in large amounts. At present, the average plot ratio in China’s urban areas is only 0.51, and the overall plot ratio of China’s large cities is between 0.8 to 1.0, while that of foreign cities is generally between 0.8 to 1.2 [6], which is obviously higher than that of China. Massive redundant planning and rebuilding of common infrastructures exists in some urban agglomerations because each region considers its own interests and jurisdiction. The disordered expansion of rural construction land is even more serious in rural areas of China. Although the rural population has continued to decrease, rural residential land has continued to increase, imposing tremendous pressure on the red line of cultivated land. The data from China’s Ministry of Land and Resources reveal that the permanent residential population in rural areas of China decreased by 160 million from 2006 to 2014, whereas rural residential land increased by more than 20,000 km2. Rural construction land is 1.8 times the amount of urban construction land in China, with approximately 20% of rural housing being uninhabited year round. In 2015, Yujiang County of Jiangxi province had 92,300 rural houses, 23,000 of which were seated in hollow villages, accounting for a quarter of the county’s rural houses.
Regional imbalance is widespread in countries around the world, which has impeded regional sustainable development. Under this background, coordinated regional development has become an important goal of national governments’ macro control. Coordinated regional development not only includes the narrowing of the income gap between residents in different regions and the equalization of basic public services, but also includes the spatial balance of the population, the economy, resources, and the environment. Spatial balance does not mean “spatial equality” but refers to the spatial matching of the population, the economy, resources, and the environment among different regions through a reasonable set of institutional arrangements. To understand the status quo of spatial balance in China so as to better promote regional sustainable development, this study, from the perspective of the matching relationship between the spatial supply capacity and the development demand intensity, measures the spatial balance status of 290 prefecture-level cities in China by establishing an index system and an evaluation model that considers the economy, society, resources, and the environment. The results show that there is not a corresponding relationship between spatial supply capacity and development demand intensity in China’s regional development, indicating that most cities are in an imbalanced state in regional development. Only a few cities have reached spatial balance, while overexploitation is a common phenomenon.
2. Theoretical Basis
Spatial imbalance of regional development has been a serious issue attracting considerable attention from both the government and researchers because imbalanced development is an obstacle in attaining regional sustainable development [7]. With the spatial agglomeration of economic activities, population and resources are gradually gathered in regions with economic prosperity, causing an imbalanced spatial pattern of regional economy, population, resources, and infrastructure. Many studies have demonstrated that an inverted-U relationship exists between agglomeration and the economy [8]. Agglomeration can greatly promote regional development in early stages while leading to a decline in the regional economy after the agglomeration exceeds the limits. The sustained imbalanced development will eventually affect regional sustainability if there is no policy regarding balance [9]. Therefore, understanding the state of the spatial balance is critical for ensuring regional sustainable development.
Previous researchers usually considered spatial imbalance as a disparity of economic growth among regions [10,11]. Existing studies on spatial imbalance mainly deal with three “how” issues: how spatial imbalance emerges, how spatial imbalance evolves, and how spatial imbalance is eliminated. In 1965, Williamson observed an inverted U-shaped pattern of regional imbalance in economic growth through regional data from the United States and cross-country evidence. Many studies have been conducted to support these findings [12,13,14]. However, some studies found evidence in some countries that did not fully support this hypothesis. Studies revealed that the regional disparities in the United States decreased steadily from 1880 to the 1970s, with a halt in the 1980s [15]. Regional imbalance in Italy unfolded a pattern of convergence between the northern and central regions after reaching a peak [16]. The causes of spatial imbalance also have been explored in previous studies. Galvis and Meisel posited that the regional disparities in Colombia were attributed to the growth of a huge metropolis [17]. However, Barrios and Strobl reckoned that regional imbalance was created through the concentration of technological shocks (industrialization) because regions had their own specific factor endowments and/or institutions [18]. Three indices are commonly employed in measuring regional imbalance, namely the coefficient of variation (CV), Gini coefficient, and Theil index. Li and Wei explored the interregional, interprovincial and intraregional imbalance of China with those three statistical indices [19]. Tirado et al. calculated a population-weighted coefficient of variation (WCV) with decadal regional GDP to study the evolution of regional imbalance in Spain [11].
Spatial balance in the existing work is commonly reckoned as the geographically equal distribution of income, infrastructure, or resources [20,21,22]. However, some researchers realized that spatial balance should not be reflected only in regional economic development. Bluszcz and Kijewska [23] and Kates et al. [24] pointed out that in order to maintain sustainable development, balance should be achieved in economic, social, and environmental dimensions at once. Fan and Li believed that the spatial balance was the implementation of sustainable development concept in space, which referred to an overall equality of the comprehensive development status among regions, including the economy, society, ecology, and so on [25]. Lu and Fan argued that the purpose of implementing balanced regional development was to achieve a human-centered comprehensive development from the aspects of economic, social, and ecological development, with the principle of maximizing the overall benefits of the three [26]. Zhuo et al. posited that the implementation of spatial balance could coordinate the spatial development effectively, providing intensive growth space and high niche protection space at a low cost by clarifying the economic, social, ecologic, and environmental functions performed by different spaces [27]. The concept of spatial balance was redefined under this perspective. Chen et al. reckoned spatial balance as a matching state of spatial supply capacity and development-protection demands that can realize the coordination of spatial economic growth and ecological protection [28]. Zhuo et al. thought that spatial balance meant the optimal state of “Pareto efficiency” in the spatial coordination of the population, the economy, resources, and the environment, namely the optimal spatial allocation of economic goods and economic activities [27]. Sheng et al. believed that spatial balance indicated that each region could reasonably choose development and protection activities according to the region’s functional orientation and that residents in each region could roughly enjoy the same living standards [29]. In addition, some scholars have explored the impacts of spatial balance on sustainable development, arguing that policy interventions were necessary when considering both socioeconomic and environmental conditions [30,31]. Yang even proposed incorporating “spatial balance” into the national economic and social development plan of China [32].
Based on the new understanding of spatial balance, many studies have incorporated ecological and environmental analysis into the measurement of spatial balance. Zhang established an evaluation model for the spatial balance of the Yangtze River Delta region, creating an overall analysis of the economic-social-ecologic balance [33]. Chen et al. elaborated on the spatial matching relationship of the regional supply capacity and development intensity by analyzing the supply and demand curves from a theoretical perspective [28]. Zhang et al. constructed an evaluation model of regional spatial balance based on the supply-demand relationship and conducted an empirical analysis of Shandong province. The results revealed that the overall situation of the spatial balance in Shandong province was not optimistic, and only three cities reached a high level of balance [34].
In this study, spatial balance does not mean geographical equality in the regional development, but refers to a spatial matching status of population, economy, resources, and environment in different types of regions through a reasonable set of institutional arrangements. In the regions achieving spatial balance, the economy, society, environment, and ecology are coordinated with regional resources and environmental endowments so that the regions can maintain sustainable development. In other words, spatial balance can be understood as the spatial matching of the regional supply capacity of the various factors and the demand intensity for regional development. The region with strong regional comprehensive supply capacity (the comprehensive supply capacity includes not only the resource and environmental carrying capacity, but also the transportation capacity and industrial base) should gather more population and industries. If the regions with weak regional comprehensive supply capacity ignore their ecological constraints or the limitations of their own supply capabilities, unreasonable exploitation and over-exploitation will affect their regional sustainability.
Therefore, an evaluation index system is constructed in this study regarding the matching relationship between regional supply capacity and development demand intensity that considers the economy, society, resources, environment, and ecology to measure the spatial balance status of the 290 prefecture-level cities in China.
3. Data and Methods
Based on the above theoretical analysis of spatial balance, whether a region reaches spatial balance or not is reflected mainly by the matching relationship between spatial supply capacity and regional development demand intensity which, therefore, is employed in this study to evaluate the spatial balance of China’s regional development.
3.1. Study Area and Data Source
This study aims to evaluate the spatial balance of the regional development across China, with prefecture-level administration districts as the study unit. Considering Chinese realities, the geographical scale of this study is limited in the prefecture-level cities for three reasons: First of all, prefecture-level cities in China have more independent political rights than non-city prefectures, such as independent rights of economic development and taxation. Many non-city prefectures, such as districts and counties in China, are attached to the prefecture-level cities where they are located. Secondly, investigating the spatial balance at provincial level may cover up to some extent the mismatching relationship between the economic development and the resource carrying capacity in some parts within certain province, because the province usually has a large area. The average administrative area of China’s provincial administrative regions is 280,000 km2, equivalent to the size of the countries such as Italy, New Zealand and the United Kingdom. Thirdly, prefecture-level cities have relatively complete statistics, and the data is easy to obtain. Moreover, the geographical boundary of prefecture-level cities is relatively stable, while only a few cities have changed their boundary in recent years. However, this study is not affected by the changes since we only select the data for the year of 2015.
In 2015, China had a total of 333 prefecture-level administration districts. In light of data accessibility, the spatial balances of 290 prefecture-level cities were analyzed in this study, not including the prefecture-level autonomous prefectures, prefecture-level districts and leagues in the areas inhabited by minority nationalities.
The data used in this study are mainly collected from China City Statistical Yearbook 2016, an annual statistical publication that comprehensively reflects the socioeconomic development of China’s cities. The data in China City Statistical Yearbook 2016 were collected by China’s National Bureau of Statistics, covering the main statistical data on the social and economic development of 656 designated cities (including prefecture-level cities and county-level cities) in 2015. Data regarding population, land resources, the economy, foreign investments, fixed asset investment, and the environment and resources in the China City Statistical Yearbook 2016 provide a sound basis for the following analyses in this study.
3.2. Index and Weight
3.2.1. Spatial Supply-Demand Curve
Spatial balance can also be understood as the spatial matching of the supply and demand of various factors for regional development, which include the economy, society, and ecology. A mismatch will lead to the regional development intensity not coordinating with the supply capacity of the economic, social, environmental and resource factors, thereby leading to a spatial imbalance, which can be seen from the relationship between the spatial supply curve and the demand curve.
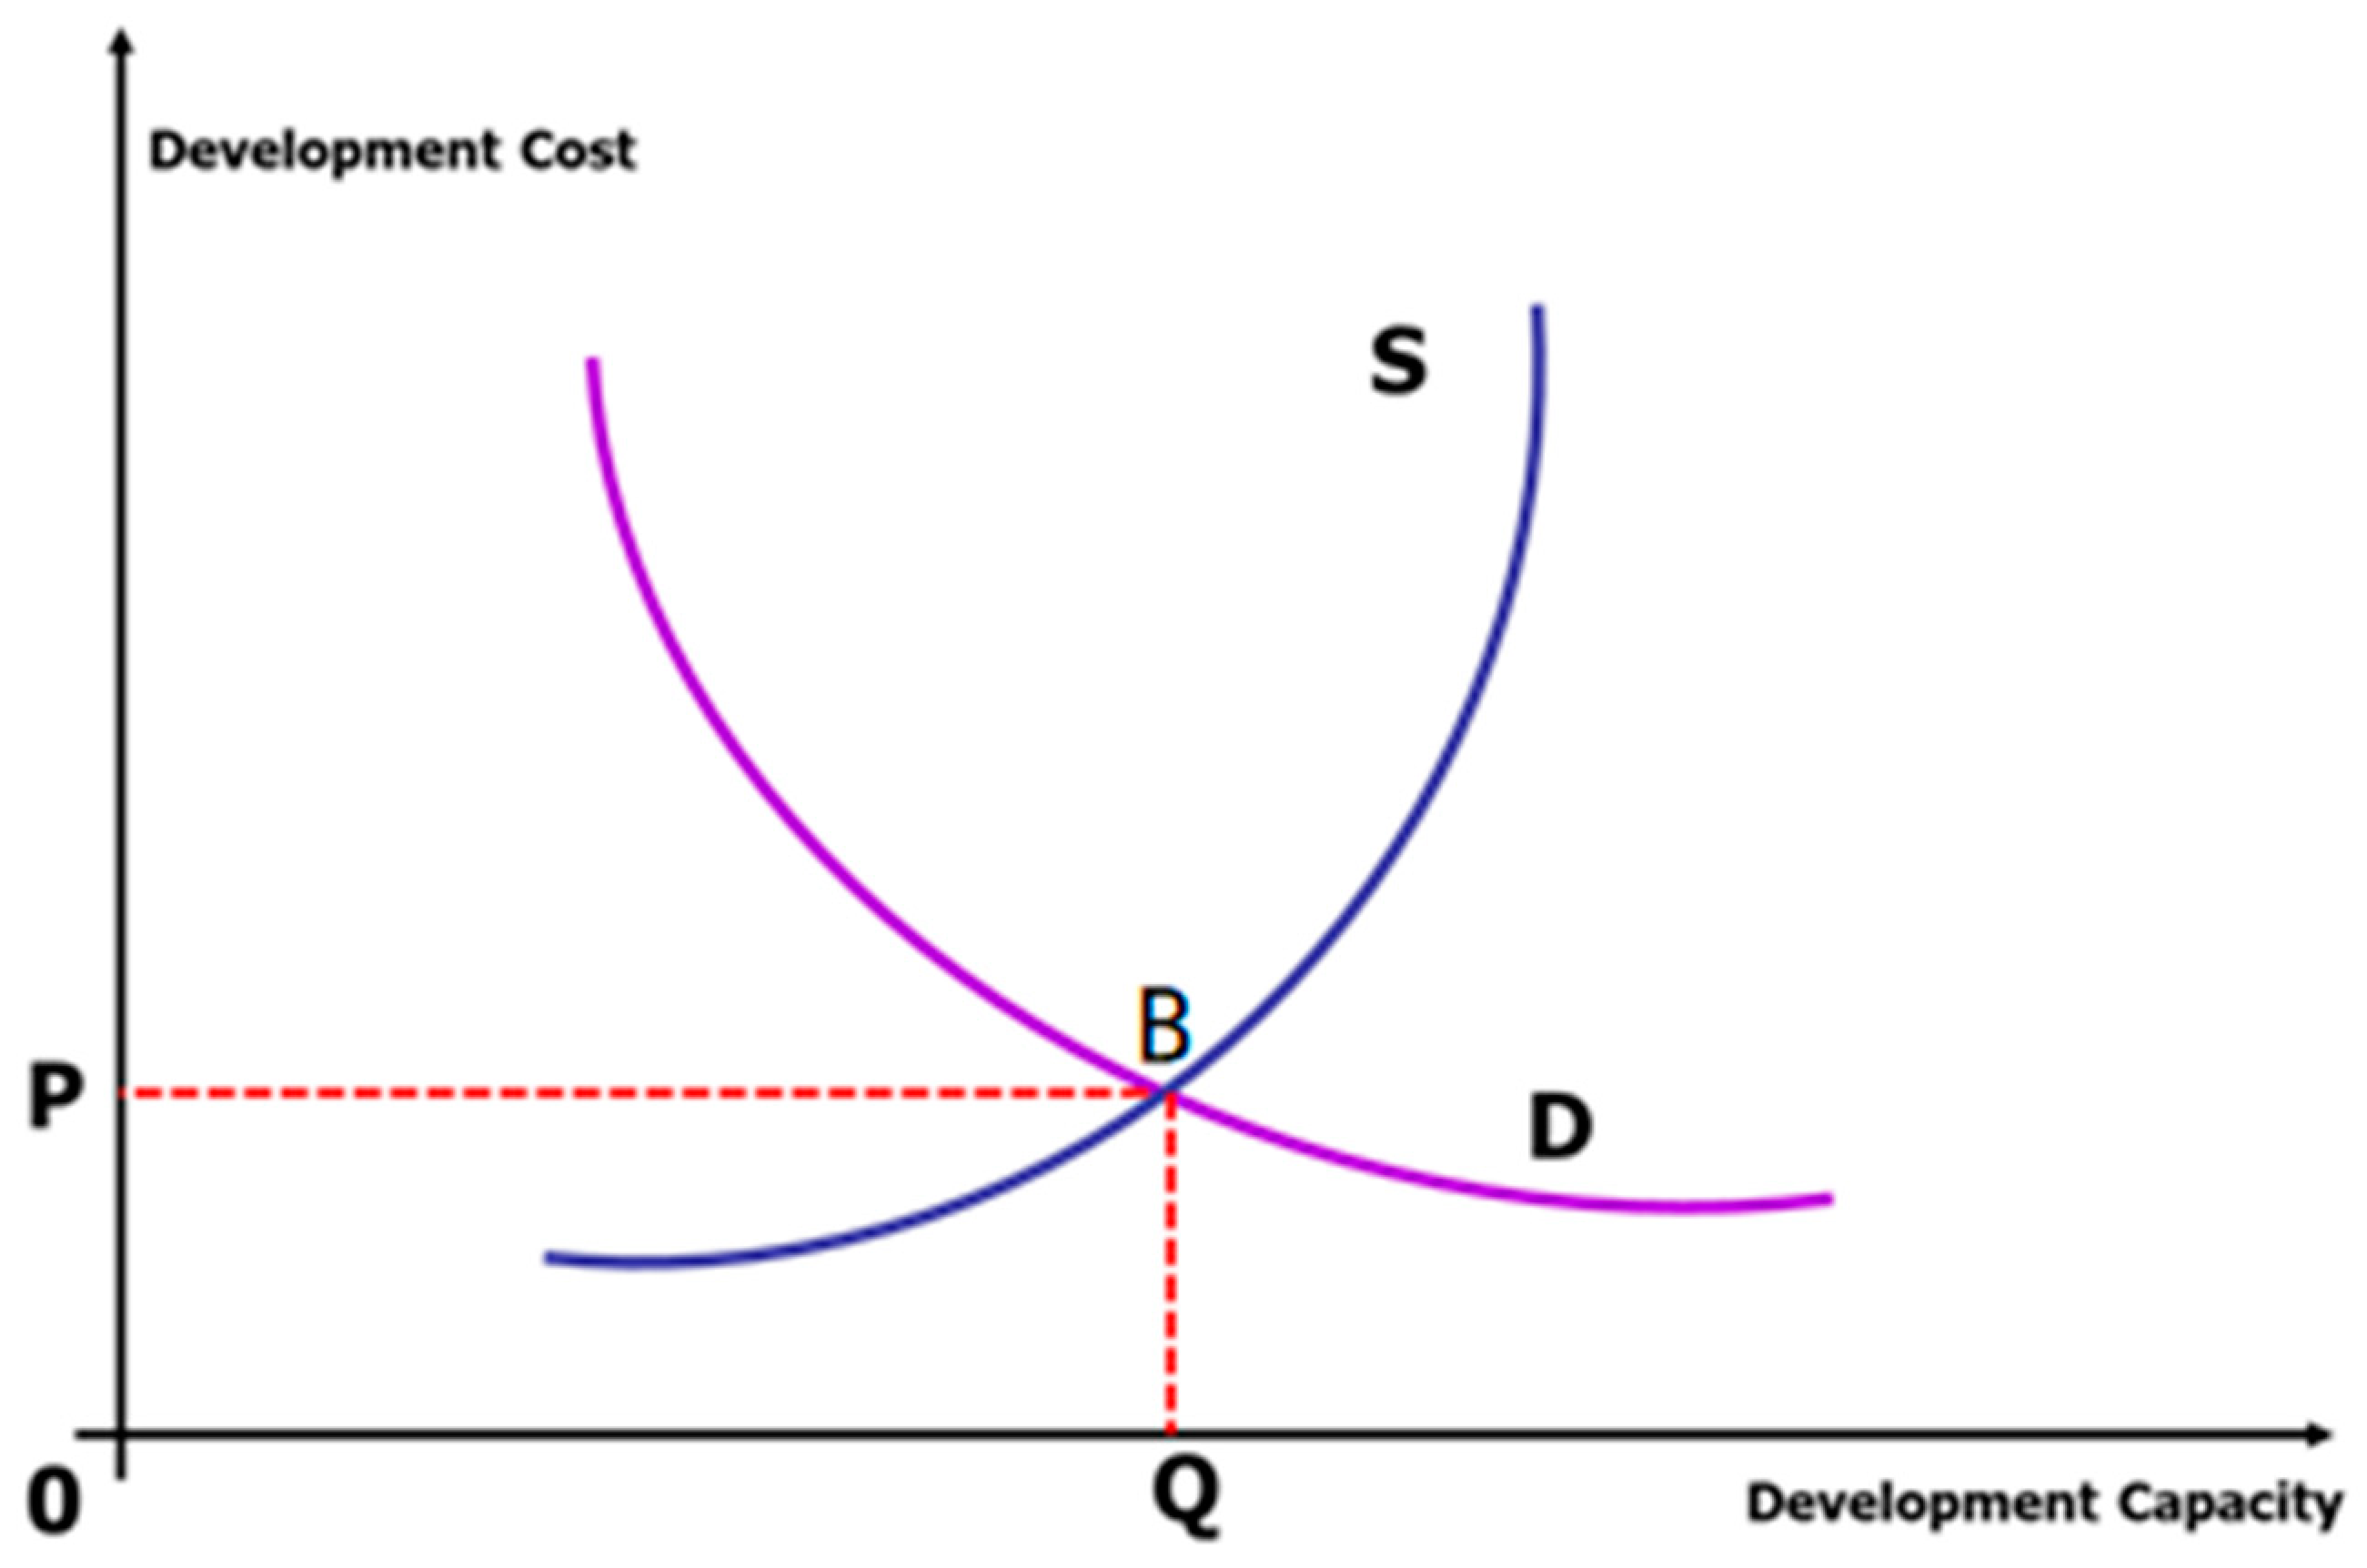
According to related studies [28,34], the cost of development is generally low when a region’s development demand intensity is high. The development demand will decrease as development cost increases, and the spatial demand curve D will concave downward. The spatial supply for regional development will increase when the development price is higher. In theory, the development capacity of each region has a certain limit, so the supply curve S is an upward concave, infinitely approaching the limit of the development capacity. The balance point B of supply and demand is reached when the regional development capacity Q matches the possible spatial supply capacity at the development cost of P (Figure 1).
Spatial imbalance will emerge when the scale and degree of regional development exceeds or fails to fully utilize the potential supply capacity of the area. The supply curve suddenly rises after exceeding the development capacity Q, meaning that a greater cost will be required when demand exceeds development capacity. In the case of Figure 2, the demand curve D shifts to the right to D1 when development demand is strong and development capacity reaches Q1. The supply curve S becomes steeper from Q to Q1 and the price paid for development rises to P1, indicating that the unit development cost rises sharply, which is often marked by the increase of social and environmental costs and the negative environmental effects from economic growth. B1 represents the imbalance point of the spatial demand expansion and overexploitation, implying that the scale and intensity of spatial development exceeds the potential spatial supply capacity for development, bringing about problems such as resource depletion, pollution aggravation, and ecological deterioration, etc.
Figure 3 shows that the demand curve D shifts to the left to D2 due to the lack of development demands, with the development capacity only reaching Q2 and the price paid for development P2. The supply curve S from Q to Q2 is quite flat, meaning that the return of development will be great as long as the development cost increases slightly. B2 represents the imbalance point of insufficient development demand and spatial underdevelopment, indicating that the scale and intensity of regional spatial development is far lower than the supply capacity, which usually leads to resource waste.
3.2.2. Index System and Weight
The Delphi method is employed in this study to determine the index system and weights by three rounds of scoring from experts in the field. Since the spatial balance is reflected mainly by the regional correspondence between spatial supply capacity and development demand intensity, the index system should be constructed from these two aspects, taking into account regional economy, society, resources, and environment. Adhere to the principles of scientific nature, completeness and independence, this study constructed the initial evaluation index system incorporating economic support, social support, resource support, environmental support, and ecological constraint. Then, a questionnaire based on the initial target index system was designed and the first round of selection of evaluation indicators was conducted by 20 invited experts in the field of regional economy, geography, and the environment, who made independent judgments on the indicators and their importance. The importance of the indicators was divided into five levels: very important, important, general, unimportant, and very unimportant. Experts assigned each indicator according to their own cognition. After collecting the questionnaire, the authors calculated the arithmetic mean and variation coefficient of each expert’s scores, excluding the indicators that did not well reflect the objectives, and gave the feedback to the experts for reference. The arithmetic mean was calculated with Equation (1), while the variation coefficient (the concentration degree of the experts’ opinion) was calculated with Equations (2) and (3). The indicators with large variation coefficient in the first round were sent to the experts for a second and third round of evaluation, to make modifications or improvements. Finally, eight first-grade indices and ten second-grade indices were selected in this study to characterize the spatial balance of regional development in China.
where is the arithmetic mean of the scheme j; mj is the number of experts participating in the evaluation of the scheme j; Cij is the score on the scheme j given by the expert i; Vj is the variation coefficient (0–1) of the evaluation of the scheme j; and Sj is the standard deviation of the scheme j.
There are five first-grade indices involving the regional spatial supply capacity, including economic support, resource support, opening-up support, social support, and environmental constraint. Economic support reflects the regional ability to support regional development through economic means. Since fixed asset investment directly represents the capacity of local governments to promote economic development, the economic support index is embodied in per capita fixed asset investment, which is obtained by the total fixed investment of each prefecture-level city in 2015 divided by the total population of the city. Resource support reflects the guarantee of the quantity and quality of the resources such as water, land and other basic resources needed for development and construction. Land resource is embodied in per capita national land, while water resource is measured in per capita water supply. Transportation support indicates whether the region has location advantages from the perspective of transportation conditions. Considering the important impact of traffic volume on regional economic development, the freight volume is employed to indicate the supporting ability of each region for regional development. This study uses the total population to indicate regional social support because population support is an important driver for the sustainable development of the regional economy. Total population means the people located in the regional development, which can represent the production and consumption ability of the region. Environmental constraint is reflected by the industrial wastewater discharge per square kilometer and the industrial SO2 emissions per square kilometer. The more the industrial wastewater discharge per unit area and industrial SO2 emissions per unit area, the greater the pressure is on the regional environment, meaning that the spatial supply for discharge and emissions is less and the environmental constraints are higher on spatial development.
The regional development demand intensity is shown by three first-grade indices, which are economic development intensity, land development intensity, and social development intensity. Economic development intensity indicates the level of economic and social activities in the region and their occupancy of resources and the environment, which are measured by economic density in this study, that is, the proportion of national land occupied by construction land. Land development intensity is embodied by the ratio of national land occupied by construction land; the expansion of construction land means increases in paved ground and reductions in green space. Social development intensity covers a wide range of factors, including population structure, life expectancy, education level, social security and so on. The regional social development level in China is related positively to regional population density, so we use population density to indicate the social development intensity along with a consideration of the data availability and comparability.
The index system and corresponding weights are shown in Table 1.
3.3. Evaluation Method
Data collected from the China City Statistical Yearbook 2016 first are standardized to eliminate differences among the indices. Here, the z-score method is used, based on the mean and standard deviation of the raw data.
According to the weight of the indices, the comprehensive scores of the spatial supply capacity and the development demand intensity are then calculated, with the scores of the guiding indices taking a positive direction and those of constraining indices assuming the inverse position.
The formula used in this study is as follows:
where f represents the comprehensive scores of the spatial supply capacity and the development demand intensity; w1, w2, … wk represent the weights of various indices; n represents the number of indices; and ui represents the index value.
Regression analysis then is conducted on the relationship between the spatial supply capacity and the development demand intensity to obtain total correlations. Ordinary least squares (OLS)is then used to model the indices of spatial supply capacity and the development demand, and the correlation between supply capacity and demand intensity is discussed through the statistical tests to elaborate the strength of different supply factors on the development demand.
Finally, according to the calculation results, this study adopts cluster analysis and qualitative analysis to divide the regional supply capacity and demand intensity, respectively, into three categories, low, medium and high, which then are combined in pairs to form seven different types of balance states [34]: low-level balance, medium-level balance, high-level balance, underdevelopment, severe underdevelopment, overexploitation, and severe overexploitation (Figure 4).
4. Results
4.1. The Spatial Supply Capacity and Development Demand Intensity of China’s 290 Prefecture-Level Cities
The results of the model regression performed by OLS with SPSS software (IBM, Armonk, NY, USA) show that the interpretation degree of the indices to the development intensity is 71%, and the F-statistic is significant at a confidence level of 0.05, meaning that the five supply capacity indices have a significant impact on the development demand intensity.
However, the analysis of the correlation between spatial supply capacity and development demand intensity demonstrates that the overall development demand intensity of China’s regional development does not have a strong corresponding relationship with the spatial supply capacity, indicating that most cities are in a state of spatial imbalance, such as overexploitation or underdevelopment, while only a small number of cities have achieved spatial balance.
To investigate the spatial balance level of each city further, this study classifies both the spatial supply capacity and development demand intensity into three categories according to the standard and based on the calculation scores of the spatial supply capacity and development demand intensity, as shown in Table 2.
According to the classification results, only 6 cities have a high spatial supply capacity level, while 76 cities have a medium level and 208 cities have a low level. For the cities with a high spatial supply capacity level, their development demand intensity is at a low or medium level, indicating there is a mismatch in these cities. For cities with a medium spatial supply capacity level, 27 cities have a high development demand intensity level, most of which are provincial capitals or economically developed cities. Based on the classification standard, 208 cities have a low spatial supply capacity level, whereas 136 of them have a high or medium development demand intensity level, indicating that the spatial balance in those cities has not been achieved.
4.2. The Spatial Balance of China’s Regional Development
On the basis of matching relationships between supply capacity and demand intensity, the 290 cities are divided further into seven types: high-level balance, medium-level balance, low-level balance, severe overexploitation, overexploitation, severe underdevelopment, and underdevelopment. However, it should be noted that the score of the development demand intensity in Shenzhen is 7.06, which is much higher than that of other cities. This study considers the score for Shenzhen to be an extreme value. Shenzhen is evaluated separately to ensure that the study has made a scientific classification. Shenzhen is considered to be overexploited because the supply capacity of Shenzhen is at a medium level.
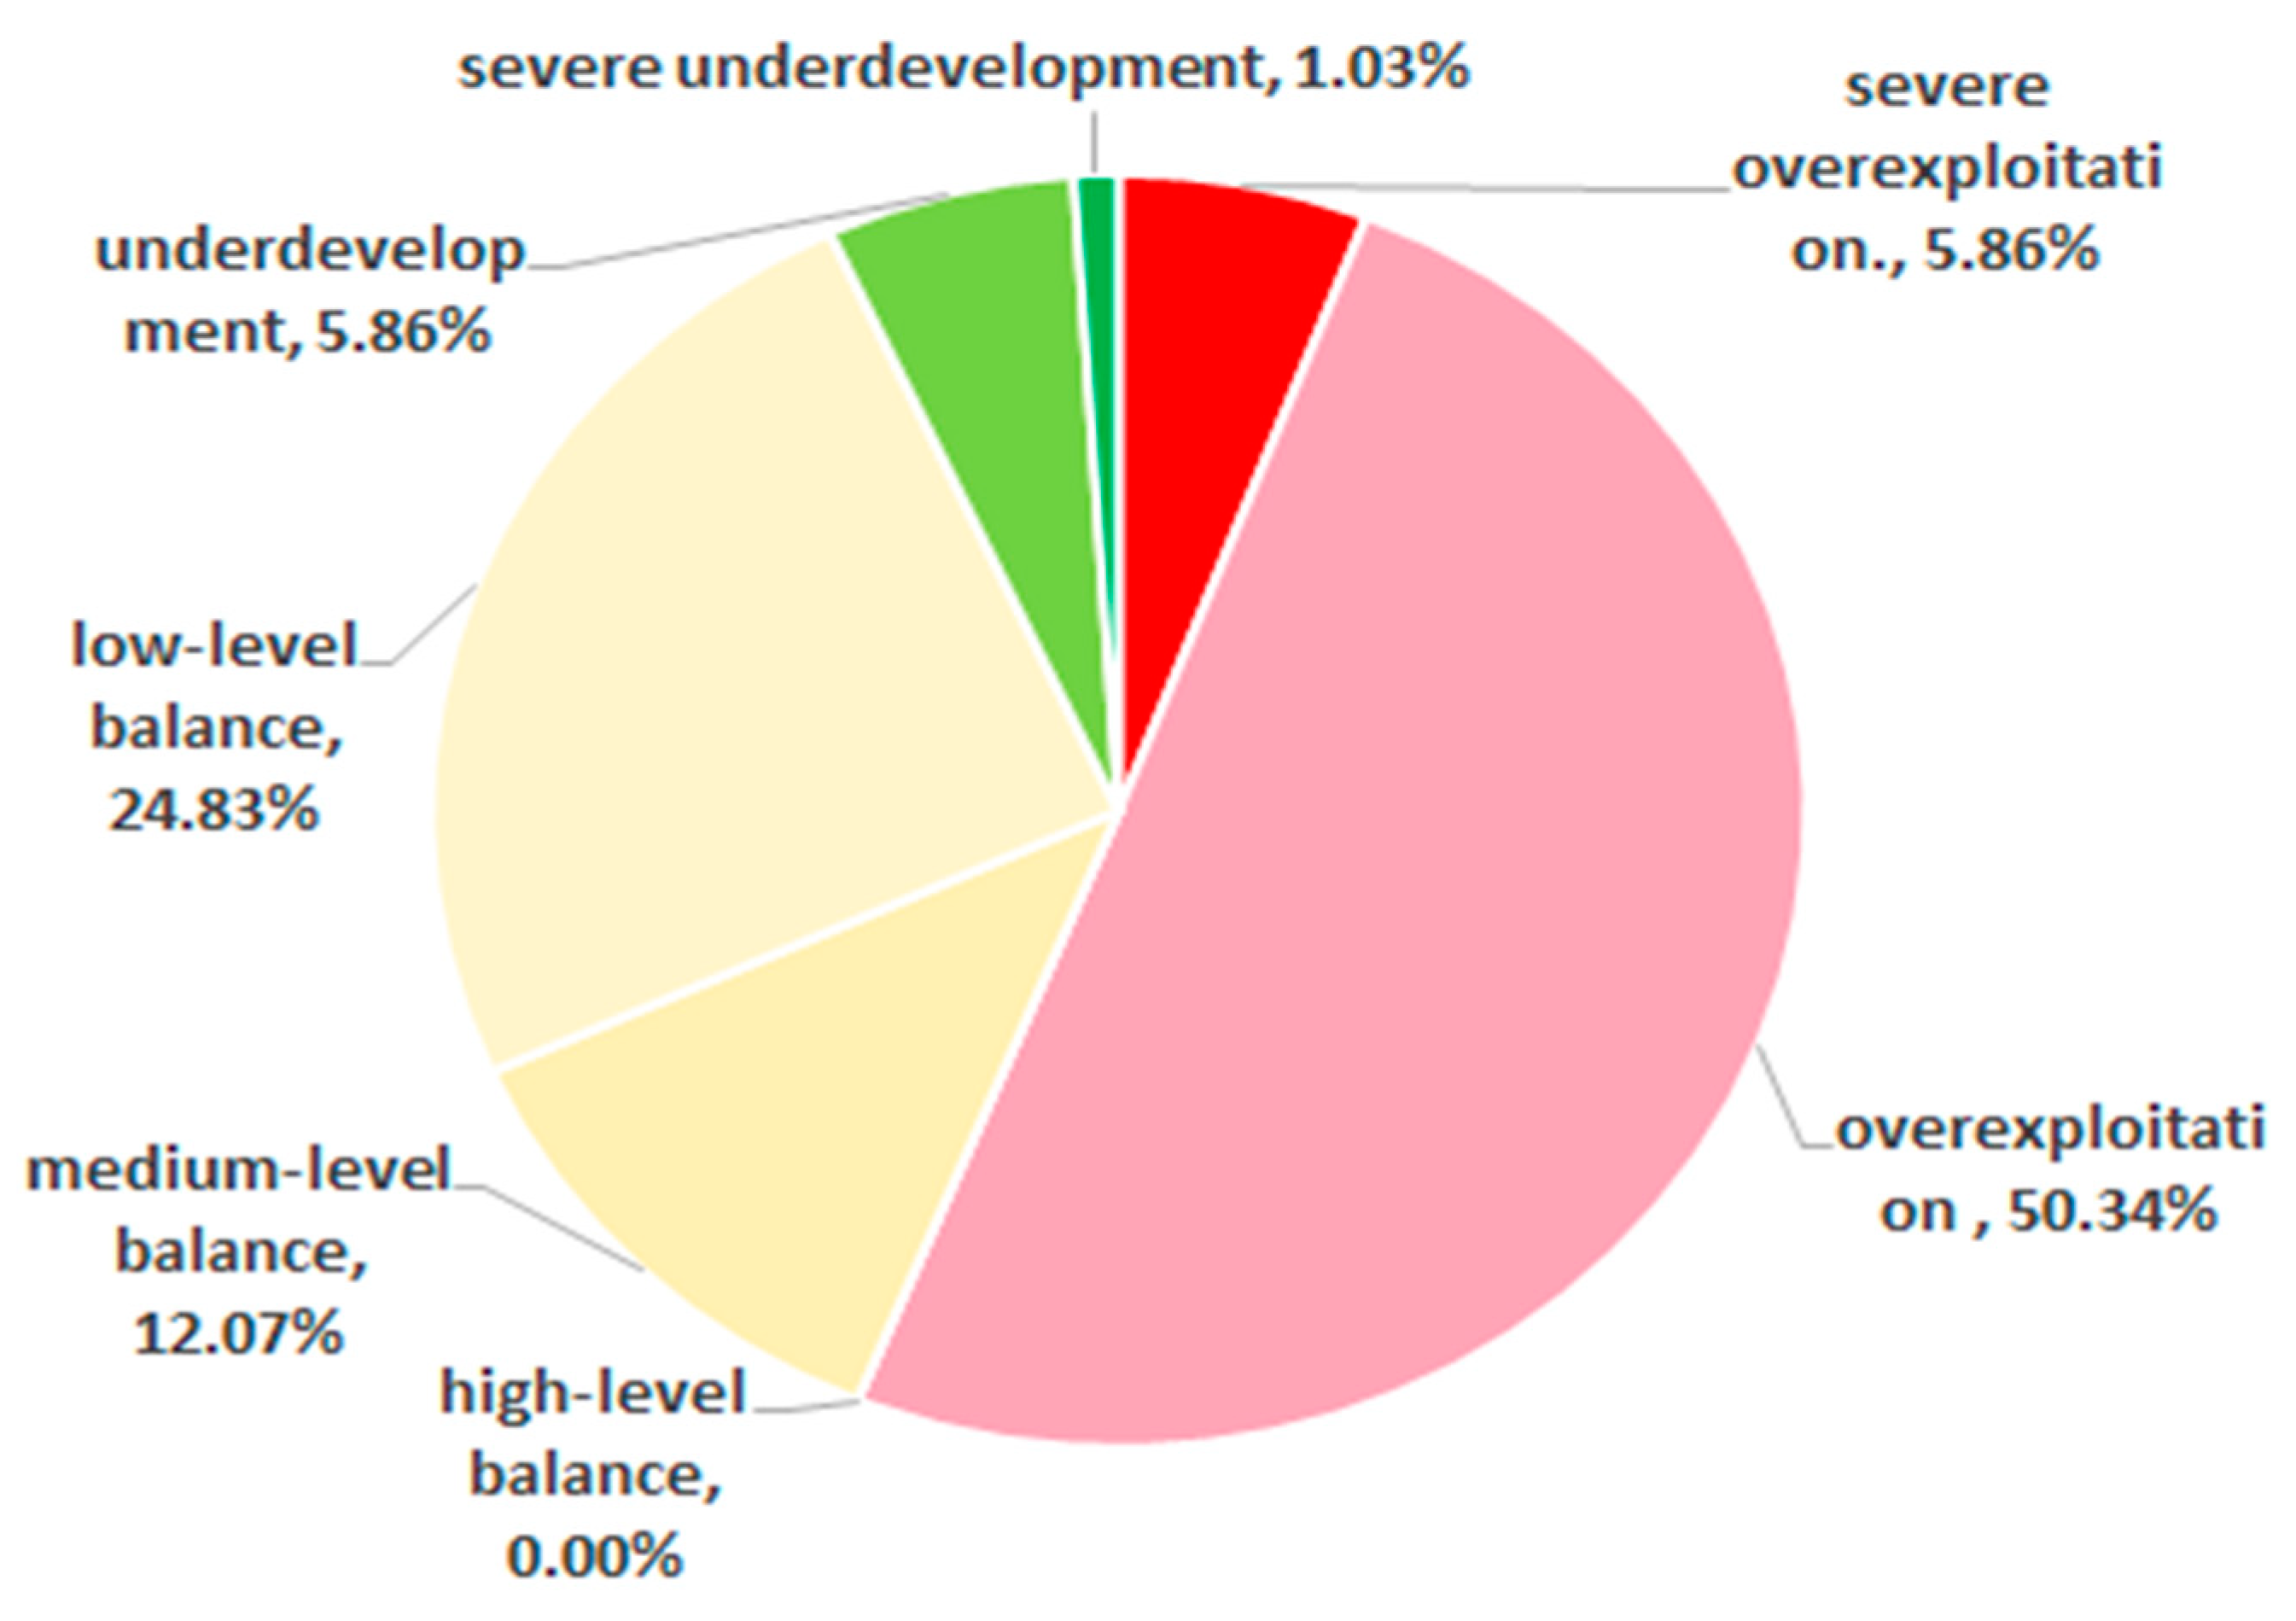
According to the matching relationship between supply capacity and demand intensity, spatial imbalance is common in China’s regional development. The findings of this study reveal that no cities in China have achieved high-level balance in regional development and that only 107 cities have reached a balanced state, accounting for 36.9% of the total, among which more than three quarters are in a low-level balance. The results indicate that overexploitation is a common phenomenon in China’s regional development because more than half of the prefecture-level cities in China are overexploited or severely overexploited, accounting for 56.21% of the total. Only a few cities are in a state of underdevelopment or severe underdevelopment, with a ratio of 6.89% in total (Figure 5).
4.3. The Distribution of Spatial Balance in China
The 290 prefectural-level cities are classified into six types based on the analysis results because no cities in China have reached a high-level balance. Among them, 17 cities are severely overexploited and 146 cities are overexploited. Only 20 cities are still in a state of underdevelopment, while three of them are severely underdeveloped. A total of 72 cities have reached low-level balance, while 35 cities are in medium-level balance.
Figure 6 displays the overall distribution of the spatial balance in China, from which we can see that most cities in eastern coastal China and along the Yellow River and Yangtze River are overexploited, while some cities in remote districts are underdeveloped.
The overexploitation areas of China’s regional development are distributed mainly in economically-developed regions, such as the Yangtze River Delta urban agglomeration, the Beijing-Tianjin-Hebei urban agglomeration, the Central Plain urban agglomeration, the Middle and Southern Liaoning urban agglomeration, the Chengdu-Chongqing urban agglomeration, and the Yangtze River Economic Belt, as the rapid expansion of construction land and extensive economic development have exerted great pressure on the local resources and environment in these regions. The phenomena are particularly prominent in megapolises, provincial capitals, and resource-based cities, such as Beijing, Shanghai, Guangzhou, Shenzhen, Tianjin, and Nanjing. In addition, due to the previously implemented development strategies in China, resource-based cities such as Taiyuan, Handan, Jiaozuo, Anshan, Fushun, Benxi, and Liupanshui are generally of overexploitation or severe overexploitation.
The underdeveloped cities are mainly in Central and Western China, the northern and western parts of Northeast China, and the interprovincial border areas in Central and Eastern China. These cities, such as Jiuquan, Baoji, Pu’er, Jiamusi, and Mudanjiang, are usually dominated by traditional industries that cannot bring a new economic boom. However, they often have a great supply capacity with a relatively low cost of labor, land, and other factors, which provide a basis for their balanced development. With their improving traffic conditions and development demand intensity, these cities will become China’s new spaces for economic development.
Cities reaching a balance state are mainly the second-tier and third-tier cities in middle and eastern China, most of which have a good traffic location and a large resource and environmental carrying capacity. These cities have been exploited at a moderate intensity, reaching only a low-level or medium-level balance. Since China does not yet have high-level balance cities, it is necessary to promote the transformation of the economic development mode and urban development pattern in cities with a low-level or medium-level balance and allow them to achieve a high level of balance.
5. Discussion
The results of this study revealed that most of China’s prefecture-level cities are spatially imbalanced in regional development, with a common phenomenon of overexploitation, which can be interpreted theoretically and institutionally.
In theory, the imbalanced regional development in China is the effect of “the tragedy of the commons” and “the tragedy of the anti-commons”, which reflect the problems of public goods. In 1968, Professor Garrett Hardin first proposed the theory of “the tragedy of the commons”, which means that under the single property rights, the users of each public goods are non-exclusive to others, resulting in excessive use of resources, which may eventually destroy resources. Forests with extensive deforestation, overfished fishery resources, and heavily polluted rivers and air are typical examples of “the tragedy of the commons” [35,36]. The main proponent of “the tragedy of the anti-commons” is American property law expert Michael Heller. Heller argued that “the tragedy of the anti-commons” meant that when the property rights of a particular resource was controlled by multiple owners and each property owner was exclusive, it would result in the idle or inefficient use of the resource [37,38]. “The tragedy of the commons” is the result of the excessive use of public goods, whereas “the tragedy of the anti-commons” is the waste of resources caused by the idleness of public goods. The former is caused by unclear property rights, which means the property rights must be clarified to avoid this tragedy. The latter occurs due to fragmented property rights, which means property rights must be integrated to avoid the tragedy. Since the reform and opening up, as the economic growth has become the main driving force of development, vicious economic competition has caused serious damage to China’s ecological environment, resulting in a typical tragedy of the commons [39]. In particular, one of the reasons for the extensive spatial development lies in that the land property rights are not well understood [40]. Spatial development in China has the characteristics of “common land”, leading to the existence of the two “tragedy” phenomena. In China, the diversification of stakeholders and lack of effective institutional arrangements make it difficult to protect the natural ecological space efficiently, resulting in the loss of ecological space and cultivated land, which can be called a “tragedy of the commons”. In some places, the implicit or explicit idleness of many spatial resources exist because of the fragmentation of property rights and the complicated procedures for administrative examination and approval, which leads to a phenomenon of the “tragedy of the anti-commons”.
From an institutional perspective, spatial imbalance in China is a product of regional segmentation management and inter-sectoral interest conflicts. According to the statistics, among the 53 eco-environmental management functions of the central government, 40% are undertaken by the Environmental Protection Department, while 60% by the other nine departments; among the 21 functions undertaken by the Environmental Protection Department, the Department independently assumes 52%, with 48% as cross-department functions [41]. A poor management system brings about the expansion of sectoral interests, the unbalanced system of centralization and decentralization, and the conflicts between central and local interests, thus resulting in overlapping management and short-sighted behaviors in China’s spatial management, which severely reduces management efficiency. The number of various ecological protection areas in China reached more than 10,000 locations in 2017, including nature reserves, forest parks, scenic spots, geological parks, wetland parks, world cultural natural heritages, and drinking water sources. Since the boundaries of various protected areas are unclear, one protected area is under the management of different functional departments, leading to low management efficiency, for each department makes decisions only in consideration of its own interests. In addition, a lack of effective operational means and policy supporting systems for spatial development in management, finance, taxation, and human resources has stunted regional balanced development. Using national geological parks and forest parks as an example, most received little financial support from the central and local governments. Therefore, “ticket economy” became the main operational mode for the parks in China so as to subsidize their daily expenses with operational income. Parks usually brought overexploitation for the area because managers and operators of these areas tended to seek more and more profit.
As China’s regional development is in a different state of spatial balance, pertinent governance measures need to be taken. In the overexploitation areas, the ecological products must be increased and the intensity of economic development should be controlled appropriately. Industrial production can be increased moderately in the underdevelopment areas. Areas with relatively balanced regions must be promoted from a low-level balance to a high-level balance. Additionally, basic institutional support that combines guidance and regulation is required to achieve spatial balance in regional development. Therefore, rules for the spatial allocation of the population, land, and environmental capacity should be established, and the threshold of the industrial classification must be determined. It is necessary to improve the management systems, including factor management, fiscal and taxation policies, financial transfer payments, supervision and punishment measures, and regional cooperation systems.
6. Conclusions
This study aims to measure the balance state of the regional development in China from the perspective of the matching relationship between the spatial supply capacity and development demand intensity. An index system and an evaluation model are constructed to investigate the 290 prefecture-level cities, revealing that most of the 290 prefecture-level cities in China are in an imbalanced state. No cities in China have achieved high-level balance in regional development and only 107 cities have reached a balanced state, among which more than three quarters are in a low-level balance. The overexploitation is common seen in China’s regional development because more than half of the prefecture-level cities in China are overexploited or severely overexploited. Only a few cities are in a state of underdevelopment or severe underdevelopment, with a ratio of 6.89% in total.
The findings have proved that the strategies and measures of China in the last few years have brought about a spatial imbalance in the regional development while boosting the economic growth ata rapid pace, which have caught the attention of Chinese government. In recent years, studies on resource and environmental carrying capacity have been extensive and the government has conducted the Major Function Oriented Zone Planning to achieve a spatial balance.
This study displays an overall perspective on the state of spatial balance in China by evaluating the spatial balance of 290 prefecture-level cities, providing a sound basis for implementing pertinence governance measures in different regions. But due to data accessibility, the index system in this study could be improved in future research, and multilevel models could be established to provide a more comprehensive evaluation on spatial balance. In addition, considering Chinese realities, the geographical scale studied in this paper is limited to the prefecture-level cities. However, it would be interesting to investigate the spatial balance of the provinces or non-city prefectures in China in the future, as some new findings may be revealed. Delphi method is employed in this study to weight the indices, which greatly depends on the experts’ experience and judgment. Although the subjectivity has tried to be reduced to a certain extent through several rounds of consultation and mathematical statistics, the influence of subjectivity cannot be completely eliminated. The future research should employ more objective methods to determine the index system and weights, so as to make the findings more accurate.
Author Contributions
Conceptualization: H.S. and F.T.; methodology: F.T.; writing—original draft preparation: H.S.; writing—review and editing, H.S.; supervision, J.S.
Funding
This research was funded by the public welfare industry research special fund project of China’s Ministry of Land and Resources ”The simulation technology for the spatial pattern evolution of China’s capital land use”, grant number (201211001); the major project of China’s National Social Science Fund “Expanding the new space of China’s regional development”, grant number (15ZDC016); and the key project of Chinese Academy of Macroeconomic Research ”Research on spatial development”, grant number (A2017051010).
Conflicts of Interest
The authors declare no conflict of interest.
References
- Sun, J.W.; Sun, X.Y. Cultivate economic belt: Remold region development strategy. Hebei Acad. J. 2017, 37, 114–120. [Google Scholar]
- Bo, W.G.; An, H.S. The evolution of China’s regional development and its prospect. Nankai J. 2016, 3, 115–124. [Google Scholar]
- Huang, L. Exploring the strength and limits of strong and weak sustainability indicators: A case study of the assessment of China’s megacities with EF and GPI. Sustainability 2018, 10, 349. [Google Scholar] [CrossRef]
- Yin, Y.H.; Han, X.; Wu, S.H. Spatial and temporal variations in the ecological footprints in Northwest China from 2005 to 2014. Sustainability 2017, 9, 597. [Google Scholar] [CrossRef]
- Liu, Z.J.; Huang, H.Q.; Saskia, E.W.; Yan, D. Construction area expansion in relation to economic-demographic development and land resource in the Pearl River Delta of China. J. Geogr. Sci. 2016, 26, 188–202. [Google Scholar] [CrossRef]
- Zhang, J. Comparison of the volume of large cities home and abroad. Urban Probl. 2015, 237, 12–16. [Google Scholar] [CrossRef]
- Zhang, M.D.; Xiao, H.; Sun, D.Q.; Li, Y. Spatial Differences in and Influences upon the Sustainable Development Level of the Yangtze River Delta Urban Agglomeration in China. Sustainability 2018, 10, 411. [Google Scholar] [CrossRef]
- Jin, R.; Gong, J.Y.; Deng, M.; Wan, Y.L.; Yang, X.Y. A framework for spatiotemporal analysis of regional economic agglomeration patterns. Sustainability 2018, 10, 2800. [Google Scholar] [CrossRef]
- Pîrvu, R.; Bădîrcea, R.; Manta, A.; Lupăncescu, M. The effects of the cohesion policy on the sustainable development of the development regions in Romania. Sustainability 2018, 10, 2577. [Google Scholar] [CrossRef]
- Williamson, J.G. Regional Inequality and the Progress of National Development—A Description of the Patterns. Econ. Dev. Cult. Chang. 1965, 13, 1–84. [Google Scholar] [CrossRef]
- Tirado, D.A.; Díez-Minguela, A.; Martinez-Galarraga, J. Regional inequality and economic development in Spain, 1860–2010. J. Hist. Geogr. 2016, 54, 87–98. [Google Scholar] [CrossRef]
- Combes, P.; Lafourcade, M.; Thisse, J.F.; Toutain, J.C. The rise and fall of spatial inequalities in France: A long-run perspective. Explor. Econ. Hist. 2011, 48, 243–271. [Google Scholar] [CrossRef] [Green Version]
- Badia-Miro, M.; Guilera, J.; Lains, P. Regional incomes in Portugal: Industrialization, integration and inequality, 1890–1980. Rev. Hist. Econ. 2012, 30, 225–244. [Google Scholar] [CrossRef]
- Geary, F.; Stark, T. What happened to regional inequality in Britain in the twentieth century? Econ. Hist. Rev. 2016, 69, 215–228. [Google Scholar] [CrossRef]
- Kim, S. Economic integration and convergence: US regions, 1840–1987. J. Econ. Hist. 1998, 58, 659–683. [Google Scholar] [CrossRef]
- Felice, E. Regional value added in Italy (1891–2001) and the foundation of a long-term picture. Econ. Hist. Rev. 2011, 64, 929–950. [Google Scholar] [CrossRef]
- Galvis, L.A.; Meisel, A. Regional Inequalities and Regional Policies in Colombia: The Experience of the Last Two Decades. In Regional Problems and Policies in Latin America; Cuadrado-Roura, J., Aroca, P., Eds.; Advances in Spatial Science (The Regional Science Series); Springer: Berlin/Heidelberg, Germany, 2013; pp. 197–223. ISBN 978-3-642-39673-1. [Google Scholar]
- Barrios, S.; Strobl, E. The dynamics of regional inequalities. Reg. Sci. Urban Econ. 2009, 39, 575–591. [Google Scholar] [CrossRef] [Green Version]
- Li, Y.R.; Wei, Y.H.D. The spatial-temporal hierarchy of regional inequality of China. Appl. Geogr. 2010, 30, 303–316. [Google Scholar] [CrossRef]
- Castells-Quintana, D.; Royuela, V. Agglomeration, inequality and economic growth. Ann. Reg. Sci. 2014, 52, 343–366. [Google Scholar] [CrossRef] [Green Version]
- Van Timmeren, A.; Zwetsloot, J.; Brezet, H.; Silvester, S. Sustainable urban regeneration based on energy balance. Sustainability 2012, 4, 1488–1509. [Google Scholar] [CrossRef]
- Zhou, X.; Chen, X.H.; Zhang, T.R. Impact of megacity jobs-housing spatial mismatch on commuting behaviors: A case study on central districts of Shanghai, China. Sustainability 2016, 8, 122. [Google Scholar] [CrossRef]
- Bluszcz, A.; Kijewska, A. Challenges of sustainable development in the mining and metallurgy sector in Poland. Metalurgija 2015, 54, 441–444. [Google Scholar]
- Robert, K.W.; Parris, T.M.; Leiserowitz, A.A. What is sustainable development? Goals, indicators, values, and practice. Environ. Sci. Policy Sustain. Dev. 2005, 47, 8–21. [Google Scholar] [CrossRef]
- Fan, J.; Li, P.X. The scientific foundation of Major Function Oriented Zoning in China. J. Geogr. Sci. 2009, 19, 515–531. [Google Scholar] [CrossRef]
- Lu, D.D.; Fan, J. 2050: The Regional Development in China; Science Press: Beijing, China, 2009; pp. 38–66. ISBN 9787030258106. [Google Scholar]
- Zhuo, Z.K.; Chen, W.; Sun, W. Study on frame work of productive forces based on the theory of spatial balance: With Wuxi as a case. Areal Res. Dev. 2008, 27, 19–27. [Google Scholar]
- Chen, W.; Sun, W.; Zhao, H.X. The spatial imbalanced pattern and state assessment of regional development. Acta Geogr. Sin. 2010, 65, 1209–1217. [Google Scholar]
- Sheng, K.R.; Fan, J.; Yang, H.C. Progress and prospect of modern regional function theory and its application. Econ. Geogr. 2016, 36, 1–7. [Google Scholar] [CrossRef]
- Hube, M.; Owen, A.; Cinderby, S. Reconciling socio-economic and environmental data in a GIS context: An example from rural England. Appl. Geogr. 2007, 27, 1–13. [Google Scholar] [CrossRef]
- Ogneva-Himmelberger, Y.; Pearsall, H.; Rakshit, R. Concrete evidence & geographically weighted regression: A regional analysis of wealth and the land cover in Massachusetts. Appl. Geogr. 2009, 29, 478–487. [Google Scholar] [CrossRef]
- Yang, W.M. The mission and direction of China’s planning system reform. Macroecon. Manag. 2003, 4, 4–8. [Google Scholar]
- Zhang, M.D.; Lu, Y.Q. Analysis of spatial equilibrium in the Yangtze River Delta. Yangtze River 2008, 39, 7–27. [Google Scholar] [CrossRef]
- Zhang, Y.Z.; Zhang, J.L.; Chen, Y.; Ren, J.L. Study on the meaning of space balance and condition assessment from the perspective of supply and demand driven: A case of Shandong Province. Soft Sci. 2016, 30, 54–58. [Google Scholar] [CrossRef]
- Garrett, H. The Tragedy of the Commons. Science 1968, 162, 1243–1248. [Google Scholar] [Green Version]
- Zeng, X.G.; Tang, K.H.; Lu, Y.L. Fence Effect: Property Division and Integrity of Grassland Ecosystem. ChinaPopul. Resour. Environ. 2014, 24, 88–93. [Google Scholar]
- Heller, M.A. The tragedy of the anti-commons: Property in the transition from Marx to markets. Harv. Law Rev. 1998, 111, 621–688. [Google Scholar] [CrossRef]
- Heller, M.A. The tragedy of the anti-commons: A concise introduction and lexicon. Mod. Law Rev. 2013, 76, 6–25. [Google Scholar] [CrossRef]
- Ge, Z.Q.; Xie, W.; Zhang, B. Study on “the tragedy of the commons” in the economic growth of China. Ecol. Econ. 2005, 1, 43–46. (In Chinese) [Google Scholar]
- Li, L.; Jiang, G.H.; Chen, C.H.; Qin, Y.J. Probing the drawbacks of integrated spatial plans in China. Land Resour. Inf. 2016, 3, 30–34. [Google Scholar]
- Zhang, H.Y.; Hao, H.G.; Zhai, R.X.; Wang, Y.C. Issues and suggestions on constructing ecological security during the 13th Five-Year period. Environ. Prot. 2017, 45, 25–30. [Google Scholar] [CrossRef]
Figure 1.
Spatial supply and demand balance. D: demand curve; S: supply curve; B: balance point; Q: regional development capacity; P: development cost of P.
Figure 1.
Spatial supply and demand balance. D: demand curve; S: supply curve; B: balance point; Q: regional development capacity; P: development cost of P.

Figure 2.
Demand expansion and overexploitation.

Figure 3.
Insufficient demand and underdevelopment.

Figure 4.
Seven types of spatial balance states.

Figure 5.
The spatial balance of China’s regional development.

Figure 6.
The distribution of spatial balance in China.


Table 1.
Evaluation index system and weight.
| System-Level | First Grade Index | Weight | Second Grade Index | Weight |
|---|---|---|---|---|
| Spatial supply capacity | Economic support | 0.25 | Per capita fixed asset investment | 0.25 |
| Resource support | 0.20 | Per capita national land | 0.10 | |
| Per capita water supply | 0.10 | |||
| Transportation support | 0.20 | Freight volume | 0.15 | |
| Social support | 0.15 | Total population | 0.15 | |
| Environmental constraint | 0.20 | Industrial wastewater discharge per square kilometre | 0.10 | |
| Industrial SO2 emissions per square kilometre | 0.10 | |||
| Development demand intensity | Economic development intensity | 0.35 | Economic density | 0.35 |
| Land development intensity | 0.35 | Ratio of national land occupied by construction land | 0.35 | |
| Social development intensity | 0.30 | Population density | 0.30 |
Table 2.
Classification standard.
| Spatial Supply Capacity | Development Demand Intensity | |
|---|---|---|
| Low | Lower than 0.10 | Lower than −0.5 |
| Medium | 0.10~1.4 | −0.5~0.7 |
| High | Higher than 1.4 | Higher than 0.7 |
© 2018 by the authors. Licensee MDPI, Basel, Switzerland. This article is an open access article distributed under the terms and conditions of the Creative Commons Attribution (CC BY) license (http://creativecommons.org/licenses/by/4.0/).
Share and Cite
MDPI and ACS Style
Shen, H.; Teng, F.; Song, J. Evaluation of Spatial Balance of China’s Regional Development. Sustainability 2018, 10, 3314. https://doi.org/10.3390/su10093314
AMA Style
Shen H, Teng F, Song J. Evaluation of Spatial Balance of China’s Regional Development. Sustainability. 2018; 10(9):3314. https://doi.org/10.3390/su10093314
Chicago/Turabian StyleShen, Hongyan, Fei Teng, and Jinping Song. 2018. "Evaluation of Spatial Balance of China’s Regional Development" Sustainability 10, no. 9: 3314. https://doi.org/10.3390/su10093314
Note that from the first issue of 2016, this journal uses article numbers instead of page numbers. See further details here.