Agricultural Transition and Technical Efficiency: An Empirical Analysis of Wheat-Cultivating Farms in Samarkand Region, Uzbekistan


Department of Agricultural & Resource Economics, Kangwon National University, Chuncheon 24341, Korea
*
Author to whom correspondence should be addressed.
Sustainability 2018, 10(9), 3232; https://doi.org/10.3390/su10093232
Submission received: 31 July 2018
/
Revised: 3 September 2018
/
Accepted: 7 September 2018
/
Published: 10 September 2018
(This article belongs to the Special Issue Agroecology: Principles and Application for Efficient and Sustainable Agricultural Production)
Abstract
:Wheat and wheat products are an important part of the daily diet of Uzbek people, and thus, are under strategic consideration in terms of food security in Uzbekistan since the beginning of independence. In this study, wheat production during agricultural transition is reviewed and determinants of technical efficiency of wheat-cultivating farms in the Samarkand region are analyzed. Analyses are accomplished in two steps. In the initial step, technical efficiency of wheat farms is estimated using data envelopment analyses (DEA) and determenants of inefficiencies are analyzed by the Tobit model in the second step. Data for this study were collected from 124 randomly sampled private farms engaged in wheat production in the Samarkand region. The mean value of technical efficiency scores of wheat-growing farmers were found to be 0.79 and 0.82 under constant return to scale (CRS) and variable return to scale (VRS) assumptions. Empirical results suggest that there is a considerable scope for increasing production through reallocation of existing resources or that private farmers can reduce their input costs by 21 and 18 percent while holding the same production levels. The age of farmers, farmers’ education on agriculture, soil fertility, and the quality of seeds were found as the main determinants of technical efficiency in the study area.
1. Introduction
Agriculture is the largest and most important sector for the economy of Uzbekistan, especially in terms of food security, employment, rural livelihood, and export [1]. Since the beginning of independence, reforms in the agricultural sector have been focused on intensification of agricultural production while recent policies are more addressed to diversification of cropping systems and supporting the development of high-value crop production for domestic and export markets [2]. The share of agriculture is 17.6% in national GDP and it employs 27% of labor force in the country [3]. Importantly, about 49% of country’s population lives in rural areas and 25.9% of them are associated with agricultural production [3].
After the independence of the country in 1991, the main strategic development plans were identified and a number of laws were issued in order to establish the legal base of the agricultural system [4]. Uzbekistan is pushing for a gradual transition to market-oriented economy though efforts such as land reformation, market liberalization, farm restructuring, and supporting the market infrastructure in the republic [4]. Furthermore, the main attentions were addressed to change the structure of property rights in agriculture and to provide sufficiently the needs of the country’s population by increasing the volume of agricultural production [5].
Following independence, there have been crucial changes in agricultural policy. Food security issues have become a main concern for the new republic. Because agriculture was totally oriented to cotton production, almost 70% of total raw cotton of the former Soviet Union (FSU) was produced in Uzbekistan, and almost all wheat and wheat products were imported from the other republics of the FSU [1]. Therefore, increasing wheat production and achieving grain independency were identified as the second major strategic goal in Uzbek agricultural policy [5]. The Uzbek government has implemented gradual reforms in the agricultural sector, targeting the stabilization of food security in the country [6].
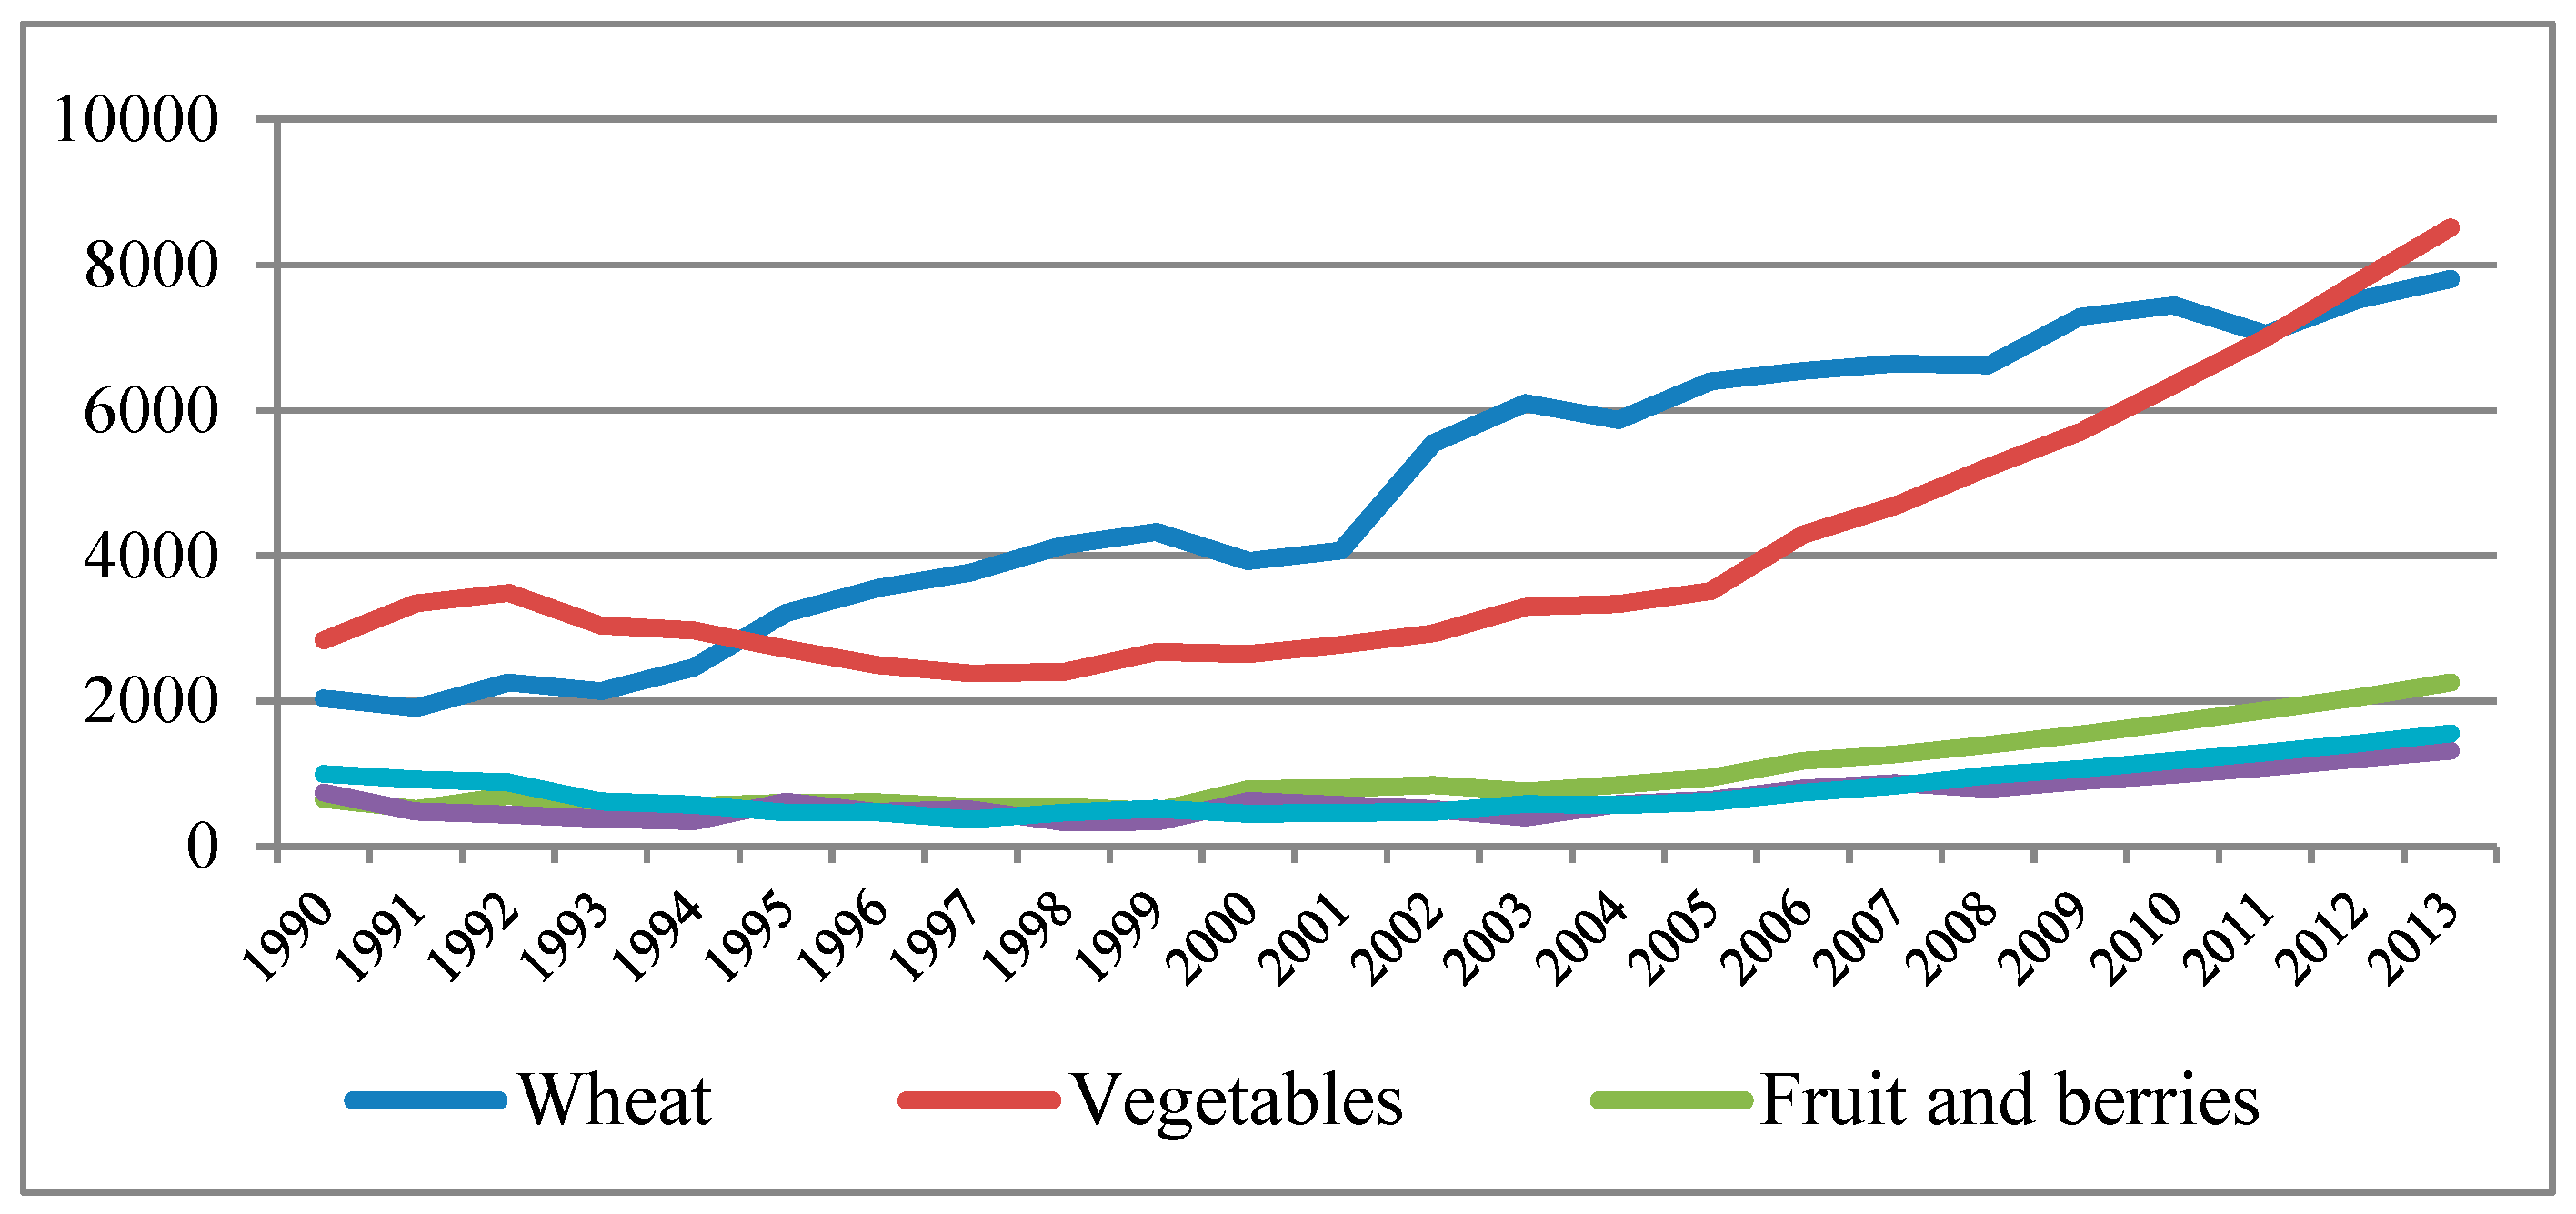
During the transition, the agricultural sector demonstrated steady positive growth of 6–7% annually, and the volume of agricultural production has more than doubled [7]. As shown in Figure 1, production of wheat has become a main concern for farmers and the government, and the amount of production gradually increased across the country. In addition, recent reformations on crop diversification were initiated by the government in order to intensify the export potential of the agricultural sector [7]. Since 2005, production of vegetables has rapidly increased [7].
Expansion of wheat production became widespread around 1993–1994 in the framework of the national program on self-sufficiency in foods [6]. After the gradual policy implications in the country, most of the cotton harvesting areas were subdivided into cereals, especially for wheat production [1]. As a consequence, dependence on imports of wheat was eliminated, and grain independency was achieved in the country [8]. With the implementation of the farm restructuring policy, agricultural production systems turned into a dual system, with two types of producers—private and smallholder farms [4]. Private farms became the main producers of wheat and currently produce about 82% of the total wheat in the country [9]. Private farmers produce state procurement targets, while in return, farmers are subsidized by input resources, such as seeds, fertilizers, chemicals, and fuel [8]. According to Rudenko [10], private farms receive only 20% of their operating profit, and it is less than other type of agricultural products. Nonetheless, unlike private farms engaged in cotton production, wheat farmers can sell any remaining stocks at market prices after fulfilling the obligations of state quotas.
After the gradual implementation of reforms on wheat production, Uzbekistan has succeeded rapidly in increasing grain production during the transition. As shown in Table 1, irrigated land for wheat production increased from 487,200 hectares in 1991 to approximately 1.4 million hectares in 2015, with substantial declines in cotton areas, consequently pushing the overall wheat production from 609,500 tons in 1991 to 7.2 million tons in 2015. Similarly, yields have also been increased, as it was only 1.2 ton/ha in 1991, reaching to 4.8 ton/ha in 2015 [7]. High yield were obtained mainly due to the intensification of agricultural production, improvement in varieties and development of modern agricultural technologies.
Despite the implications on improvement of productivity, wheat yield has remained low in Uzbekistan comparing with countries in Europe [11]. In addition, due to unfavorable climatic conditions and low levels of precipitation in winter, wheat output declined by 15% and the price raised by 7% in 2018 [11]. According to Karimov et al. [12], the efficient use of input resources plays a fundamental role in maximizing grain productivity. The level of provision and quality of input resources in agriculture and their rational use determine the efficient production. On the other hand, improper use of inputs leads to low productivity [13].
Recent studies also imply the necessity of the adoption of new technologies in order to save on inputs, or the possibilities of production maximization with current technologies [14]. This is also a major challenge to Uzbekistan given its only recent involvement in irrigated wheat production. In addition, due to water scarcity, land degradation, and imperfect market conditions, the cost of inputs increased rapidly in recent years, and farmers also have little incentive to use of inputs more efficiently in the country [15]. As long as wheat is a strategic crop in terms of food security in the country, it is, therefore interesting to analyze how efficiently private farms engaged in wheat production are performing with respect to available resource endowments. In these regards, we aimed to analyze the technical efficiency and its determinants of wheat-cultivating farms under agricultural transition in the country.
The main objectives of this study is to provide comprehensive understanding of wheat production under agricultural transition in Uzbekistan and to develop a framework for analyzing the performance of wheat-cultivating farmers in the Samarkand region.
To date, many studies have been conducted on technical efficiency, and the determinants of inefficiencies of wheat-growing farmers are limited in the region and even in the country. Hasanov et al. [15] estimated the technical efficiency of private and household farms in Samarkand region using data envelopment analysis (DEA), while Karimov [12] applied output-oriented DEA in order to measure the technical and scale efficiencies of wheat producing farms in the Khorezm and Fergana regions of Uzbekistan. Sanaev [4] in his recent scientific research analyzed the technical efficiency of tomato production in the Eastern part of the Samarkand region and he applied parametric stochastic frontier analyses (SFA). Apart from the previous studies, this study conducted the empirical analyses in two steps. In addition, findings of this research could bring valuable implications to policy makers in order to rationalize the input resources in the future, especially in the case of wheat production in the country.
2. Material and Methods
2.1. Study Site
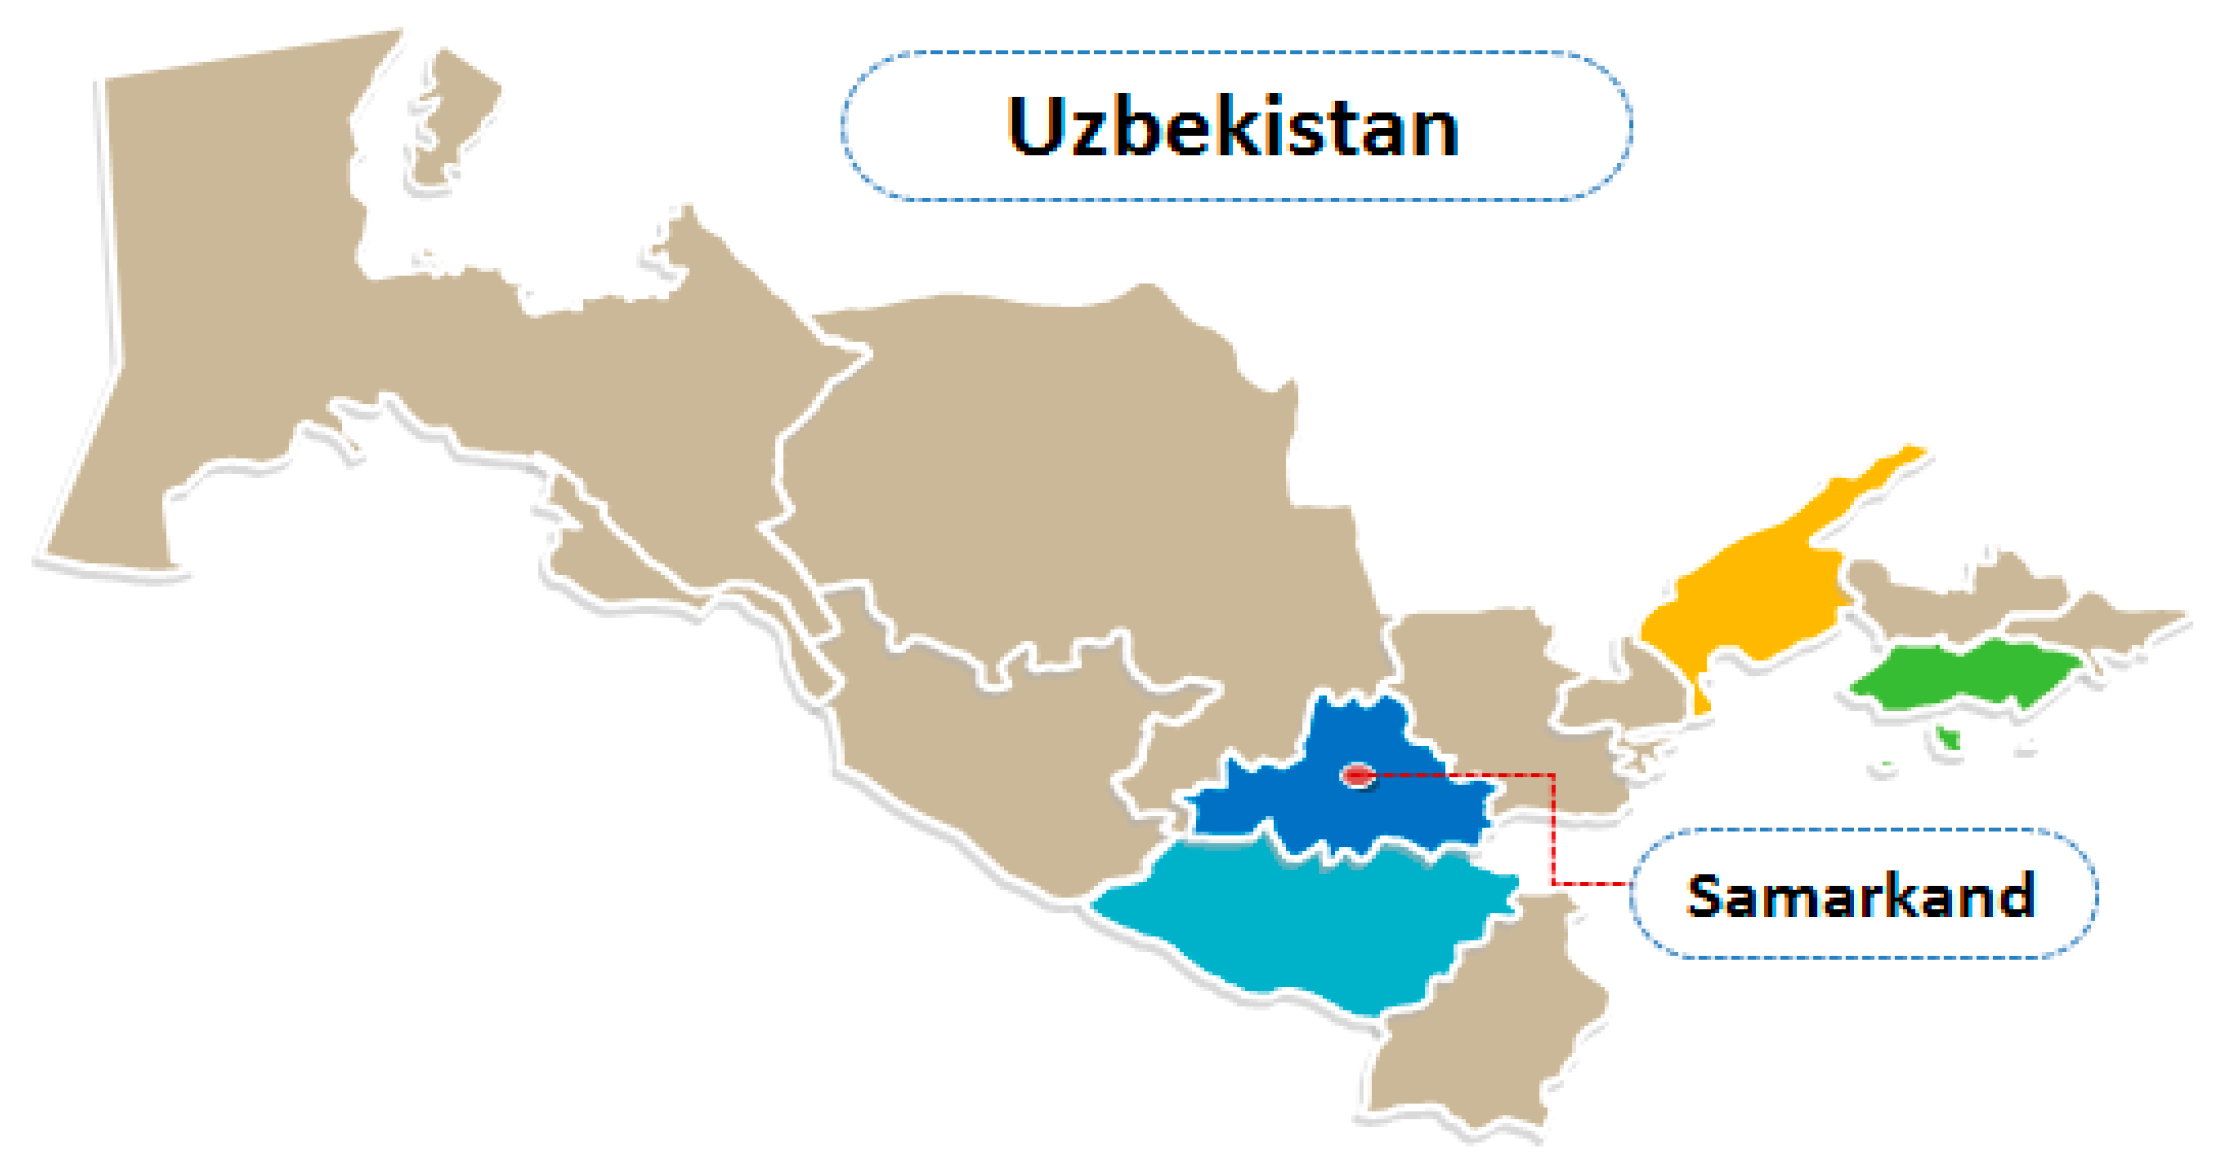
In this study, Samarkand region was chosen for an analyses which is located in the central part of Uzbekistan, as shown in Figure 2. Samarkand region occupies 3.7% of the country’s total area and more than 11% of the whole population of Uzbekistan is living within this region [7].
Irrigated agriculture in Samarkand has developed via the nearby Zarafshan River and into territory of the Zarafshan Valley. The valley occupies mainly three regions of Uzbekistan: Samarkand, Navoiy, Bukhara, and partly the southern areas of Jizzakh and northern areas of Kashkadarya regions, which mainly produces fruits, vegetables, cotton, grain, and other agricultural commodities for the country [4]. Samarkand region plays a key role for the valley’s agriculture, where agricultural land exceeds 402,900 hectares or about 10% of the irrigated land of the country, and the region’s economy is more agro-industrial oriented, while the region provides 13.1% of the country’s GDP [7]. Wheat production occupies a significant portion—42% of the total crop area in the region [17].
2.2. Material
In this study, farm-level, cross-sectional data was used for estimations and primary data was collected through survey questionnaires from randomly sampled private farms by following the 2016–2017 growing season in the region. The period of the survey was from 15 July 2017 to 15 August 2017. During one month, 124 wheat producing farmers were interviewed face to face in two Pastdargom and Payarik districts of Samarkand region. Private farms are mostly specialized in the production of wheat and cotton in these districts. The survey questionnaire form was structured based on the conditions of wheat farmers including demographic questions and input accessibility of farmers. Numerous human capital variables such as farmer’s age (FAge; years), farmer’s education on agriculture (AgEdu; Yes = 1; No = 0), and environmental variables like soil fertility (SFer; index 1–100), water availability (Wav; enough = 1; not enough = 0) and quality of seeds (SQual; Yes = 1; No = 0) were incorporated to structured questionnaire form and collected through conducting survey. These variables have been also used in previous studies by Coelli and Battese [18], Karimov [14], and Sanaev [4]. In addition, all other materials and secondary data were gathered from the State Statistical Committee of the Republic of Uzbekistan on Statistics and Statistical Department of Samarkand region.
In the first stage of efficiency analysis, one output and four input variables were included. Output (dependent variables) is a total yield of produced wheat by farmers in the sample. Inputs (independent variables) used in analysis are seeds (SD), labor (LF), and the total amount of employed organic (OrFer) and chemical fertilizers (ChFer). All inputs employed in production specified in quantitative unit (kg/ha).
In the second stage of efficiency analysis in Tobit model six independent variables estimated upon the DEA efficiency scores. The first independent variable is age of farmers specified in years. Age squared criteria is used as second variable so as to identify the effective contribution of farmers under certain ages. The third independent variable is soil fertility/bonitet score, which captures the land productivity and indexed from 1–100 scores in sampled farmers. The fourth variable is farmer’s education on agriculture, expressed as a dummy indicator. Farmer’s satisfaction from seed quality is the fifth variable and expressed as a dummy indicator. The last variable is the water availability, which plays significant role in determining productivity of crops [19]. Since water usage was not directly observed, it was not possible to provide sufficient information on water utilization during the survey.
2.3. Methods
In this study, estimations are implemented in two steps. In the first step, a DEA model was used in order to measure the technical efficiencies of farms as an explicit function of discretionary variables. In addition, the Cobb–Douglas production function was applied in order to analyze the actual contribution of production factors to total yield of wheat. In the second step, farm specific variables are assumed that affect to efficiency of farm and Tobit regression framework is used to identify the determinants of efficiencies from measured scores.
There are two principal nonparametric data envelopment analysis (DEA) and parametric stochastic analysis (SFA) methods for efficiency analysis. Each method has it’s advantages and disadvantages. Stochastic frontier analysis (SFA) can assume the relationship between inputs and output under the given functional form [20]. Data envelopment analysis is one of the well-known mathematic technique, based on linear programming as well as it widely used in order to measure the relative efficiencies of decision making units (DMU) with multiple inputs and/or multiple outputs [20]. According to Coelli et al. [21], the DEA approach has the following advantages: it does not require any explicit functional form to specify the relationship between the inputs and output as well as DEA can easily accommodate the multiple inputs. As introduced by Farrell [22], Charnes [23] and Banker [24] there are two most widely used DEA models for measuring of technical efficiency is an input oriented measure (Input-oriented DEA)—by how much the amount of inputs could be reduced while holding the same level of output and/or alternative way is an output oriented measure (output-oriented DEA)—by how much could the amount of output increase from the set of given inputs. The measure of technical efficiency has subsequently been extended to accommodate multiple inputs and outputs [20].
As we have already pointed out, the DEA model focused on minimizing the amount of resources and increasing production. In both directions, the result obtained in constant return to scale (CRS) (farms operate under constant return to scale with overall technical efficiency) conditions would be the same, and in variable return to scale (VRS) (farms operate under variable return to scale with pure technical efficiency) conditions would be different. The production resources are subsidized to private farms at the macro level by the state in Uzbekistan, such as in wheat production. In addition, wheat farmers are not free on their cropping pattern and they produce for state procurement (SP) targets. Under these conditions, models aimed at saving input resources involved in production are more appropriate. Therefore, an input-oriented VRS DEA method was applied in this study. Nonetheless, efficiency scores of the wheat farms under constant return (CRS) and scale efficiencies (SE) (scale efficiency indicates the farm size optimality) were also calculated.
Banker [24] modified Charnes’s [23] CRS DEA model in order to account for variable return to scale conditions by adding convexity constraint. An input-oriented VRS DEA model is specified as follow for N decision Making Units (DMU), each producing output by using K different inputs [20].
where, θ is a scalar and N1′ is convexity constraint and λ is N*1 vector of constant. Y and X represents an output and input matrixes respectively. The value of θ obtained will be the efficiency score of i-th decision-making unit. It will satisfy θ ≤ 1, with the value of 1 indicating a point on the frontier and hence technical efficient farm, according to Farrell [22] definition. This linear programming problem must be solved N times and one for each firm in the sample.
In addition, this study employs the Cobb–Douglas functional form of production frontier, whereas widely used in economics and productivity studies to represent the relationship between inputs and outputs. According to Aigner D. [25], Battese, Malik, and Gill [26], Cobb–Douglas production function can handle multiple outputs in its generalized form and it does not introduce any distortions of its own, even though there are some imperfections in the market. Production refers the transformation of input resources into outputs. In this study we analyzed the actual contribution of inputs into total yield of wheat by using Cobb–Douglas production function and most of variables in our equation have already been specified by other scholars in their previous studies [24,26,27,28]. The results of the Cobb–Douglas production function could indicate the farmer’s access to inputs, and thus can be valuable source to determine the causes of inefficiencies in the second step of analysis. The logarithmic form of production function equation specified as follow:
where, Yi represents the output, while total yield of wheat for each farm in the sample. Input resource variables are contributed as follow: SD—Seeds, amount of employed seed (kg/ha), OrFer—Organic fertilizer/manure (kg/ha), CHFer—Chemical fertilizers (kg/ha), LF—Labor force, man days (hour/ha), vi—ui is standard error; i subscript represents i-th firm. All inputs employed in production, such as seeds, organic and chemical fertilizers and labor has vital influence on wheat yield. Without employing any of them it’s impossible to achieve expected output. Therefore, these inputs were taken as main variables for efficiency analysis in this study. In addition, correlations (Correlations: Y-SD (0.90), Y-OrFer (0.81), Y-ChFer (0.90), Y-LF (0.90)) between inputs and output were calculated. Accordingly, all inputs employed in wheat production highly correlated with wheat yield.
ln Yi = β0 + β1 ln SDi + β2 ln OrFeri + β3 ln ChFeri + β4 ln LFi + vi − ui
It is also of considerable interest to explain efficiency scores obtained from the DEA model by analyzing the determinants of technical efficiency. After measuring technical efficiency scores in the DEA model, a Tobit regression model was used in order to determine the causes of inefficiency. Tobit model was introduced by James Tobin in 1958 and this model is well- known as censored regression model where expected errors do not equal to zero [29]. In this study, technical efficiency of wheat producing farmers is obtained in the first step and DEA scores fall between the interval of 0 and 1. Therefore, Tobit model is considered as most appropriate technique in this study to handle characteristics of the distribution of censored efficiency scores and it has also been widely used in many previous studies around the world.
Several factors were regressed upon the VRS DEA scores in this model. In the second stage of analysis study aimed to explore relationship between the technical efficiency scores and other relevant human capital and environmental variables such as farmer’s age, background of farmers on agriculture, soil fertility, water availability and seed quality by using Tobit model. Following the Maddala [30], Tobit equation is specified as follow:
where, vi is an independent and normally distributed error term; FAge—Age of farmers; ASq—Age squared; SFer—Soil fertility; AgEdu—Farmers’ background on agriculture; SQual—Seed quality; WAv—Water availability; β’s is vector of unknown parameters, respectively. i subscript represents i-th firm; The yi* is a latent variable and yi is the DEA scores.
yi* = β0 + β1FAgei + β2ASqi + β3SFeri + β4AgEdui + β5SQuali + β6WAvi + vi
yi = yi* if yi* > 0
yi = 0, otherwise
I = 1, 2, ….., n,
yi = yi* if yi* > 0
yi = 0, otherwise
I = 1, 2, ….., n,
3. Results
3.1. Summary Statistics
Based on the survey data, Table 2 shows the descriptive statistics of output and input variables used in efficiency analyses. Following the table, the average age of farmers is 40 years old and most of them have not studied in agricultural colleges and universities The yield of wheat ranged from 2270 kg/ha to 6000 kg/ha among sampled farmers in the region.
3.2. Technical Efficiency of Farms
It is quite usual case to incorporate some functional form analysis with DEA model in order to identify the relationships between output and input variables. In this regard, Cobb–Douglas production function was fitted upon the data and estimation results of econometric function is given in Table 3. According to estimation results in table, the value of Adjusted R square is equal to 0.88 while explains the good relationship between the output and inputs. In addition, all factors employed in production were found to have a positive influence on wheat yield. The coefficients of all explanatory variables were found statistically significant at 1% or 5% level. That implies, farmers have good access to input resources employed on wheat production as well as inputs, such as the total amount of seeds, organic manure, chemical fertilizers and labor have positive contribution on wheat yield in study area.
An input-oriented VRS DEA model was used to estimate overall technical (TECRS), pure technical (TEVRS) and scale efficiencies of wheat-growing farmers. Table 4 shows the performance of wheat farms in study area. The estimated technical efficiency scores differ among sampled wheat farmers and ranging from 0.53 to 1.0. Accordingly, out of 124 studied wheat farms, 9 farms under CRS and 21 farms under VRS were found fully efficient. Since, the highest technical efficiency achieved at score 1.0, model results can imply that, there is considerable room for increasing the technical efficiency with the current production resources. The mean values of technical efficiency scores under CRS and VRS were found 0.79 and 0.82 respectively, whereas sample farms with average technical efficiencies may save their inputs by 21% and 18% while holding the same production level. Furthermore, scale efficiencies were also calculated. Causes of inefficiencies are usually can be due to inappropriate scale or misallocation of production resources. In this study, the mean scale efficiency of farms is relatively high 0.96%, while they are operating near to their optimal size. Therefore, we propose that farmers can improve their efficiency through saving of existing inputs.
There are various factors affecting to technical efficiency in agriculture. Several environmental factors were regressed upon the efficiency scores in order to identify the determinants of efficiencies. The results of Tobit regression for efficiency scores obtained from DEA are given in Table 5.
The results of the table show that all specific variables have a positive impact on technical efficiency. The coefficient of the farmer’s age has a positive effect on efficiency and was found to be statistically significant at the 5% level, while implying that the aged farmers with their experiences are more efficient. Nevertheless, it should be considered that the relationship between efficiency and a farmer’s age can be non-monotonic [4,31]. Thus, the age of farmers may have both a positive and negative impact on technical efficiency, where older farmers are more experienced or slower to accept new technologies than younger farmers. In addition, we added age squared to the age variable in the model, which allows us to identify more accurately the effect of age, which may have a non-linear relationship with the independent variable. The sign of age squared was found to be negative and statistically significant. This implies the efficiency of wheat production is gradually diminished when the farmer’s age is greater than a certain age. Soil fertility and seed quality factors had a positive sign and were found statistically significant at the 5% level, whereas soil fertility levels and quality of seeds captured higher productivity. As we described in the previous chapter, Samarkand region is divided into four zones and soil fertility levels differ among these zones. Farmers have lands with different levels of soil fertility, while implying that farmers are efficient in more fertile lands [14]. Water availability was not statistically significant. Irrigation has been a severe issue for the country since the Soviet era, and farmers still face constraints on their production [32,33]. In addition, the majority of farmers in surveyed areas use pump irrigation. Farmers’ background on agricultural education had a positive effect on efficiency and was found statistically significant at the 5% level, implying that more educated farmers, especially those who graduated agricultural colleges/universities were found to be more technically efficient.
4. Discussion
Following food security issues since the beginning of the independence years of the country, the government has supported national program on grain self-sufficiency. As a result of these policies, wheat production has increased, and proportionally it has led to a decrease in cotton growing areas due to an overlap of growing seasons. With the implementation of gradual reforms, there have been feasible achievements in wheat production. Total wheat sown area, productivity, and production amounts have increased during the transition years [10]. Nevertheless, the country still remains one of the biggest flour importers due to the low quality of local flours and differences in the efficiency of production which hamper the sustainability of wheat production [14]. Therefore, it is important for Uzbekistan to analyze the efficiency of wheat farmers. Since wheat is considered a strategic crop in terms of food security, it is necessary to analyze the performance of private farms engaged in wheat production in the country. In this regard, this study analyzed the technical efficiency and the determinants of inefficiencies of wheat farmers.
Analyses were accomplished in Samarkand region. Farm-level cross-sectional data was used for analyses and the most important input variables, such as land, seeds, organic and nitrogen fertilizers, and labor force were listed by their importance in production. This paper found that all inputs employed in production have a positive influence on total yield and that farmers have good access to inputs in the region. However, technical efficiency scores of DMUs (decision-making units) were different, and few farmers were found to be technically efficient in their production. Hence, there is considerable scope for inefficient DMUs to increase their efficiency.
It should be noted that inefficient farmers may not become efficient by simply reducing input costs. Therefore, we considered to incorporate several human capital and environmental variables in order to identify the determinants of inefficiencies. These determinants may reveal more precise aspects that farmers could use to increase their efficiency. Findings indicate that farmer’s age, farmer’s education on agriculture, soil fertility, and the quality of seeds were found as the main determinants of efficiency. This implies that aged and educated farmers, particularly farmers with agricultural backgrounds, were found to be more technically efficient. In addition, scale efficiencies of farmers were also calculated and it was relatively high, implying that farmers are operating near to their optimal size. In sum, causes of inefficiencies may be due to improper use or misallocation of input resources.
Empirical analyses on technical efficiency and the knowledge of actual constraints facing wheat farmers, their resources utilization, and productivity situations are important for the policy makers regarding wheat production in the future. However, allocative and economic efficiencies are also important and should be studied in the region. Due to time limitations and budget constraints, we could manage only 124 face-to-face interviews with wheat farmers. If the sample size was larger, better outcomes could be achieved. According to the findings of this study, we propose the following suggestions:
- Main focus should be on the improving of the quality of seeds and developing of new varieties for high-quality wheat flour. In this regard, the roles and responsibilities of universities and research institutions should be strengthened.
- The government should develop extension services and offer comprehensive training programs for agricultural producers.
5. Conclusions
This study reviewed the recent trend of wheat production under agricultural transition in Uzbekistan and analyzed the technical efficiency of wheat-cultivating farms in the Samarkand region. This study revealed empirical evidence on technical efficiency and determinants of inefficiencies of wheat growing farms in the Samarkand region. Findings of this paper show that, although farmers have good access to inputs in the region, they are not using them appropriately. Therefore, we propose that inefficient wheat farmers could increase their production through saving existing resources in the Samarkand region of Uzbekistan.
Author Contributions
K.-R.K. identified research questions; S.H.L. and B.S. made the statistical analysis; B.S. also wrote the paper.
Funding
There was no funding for this research.
Acknowledgments
The authors would like to thank the editor and anonymous referees for the constructive feedback and suggestions that have improved the article.
Conflicts of Interest
The authors of this research declare no conflict of interest.
References
- Abdullaev, I.; De Fraiture, C.; Giordano, M.; Yakubov, M.; Rasulov, A. Agricultural water use and trade in Uzbekistan: Situation and potential impacts of market liberalization. Int. J. Water Resour. Dev. 2009, 25, 47–63. [Google Scholar] [CrossRef]
- FAO. Partnering for Sustainable Production Intensification and Food Security; FAO and Uzbekistan: Ankara, Turkey, 2016. [Google Scholar]
- World Bank. World Bank Group—Uzbekistan Partnership: Country Program Snapshot. 2016. Available online: http://pubdocs.worldbank.org/pubdocs/publicdoc/2016/10/420141446025649239/Uzbekistan-Snapshot.pdf (accessed on 21 May 2018).
- Sanaev, G.; Kim, K. Analysis of Technical Efficiency of Tomato Production in Samarkand region, Uzbekistan. J. Reg. Stud. Dev. 2017, 26, 247–271. [Google Scholar]
- Lerman, Z. Agricultural Development in Uzbekistan: The effect of Ongoing Reforms; The Hebrew University of Jerusalem Discussion Paper 7; The Center for Agricultural Economic Research: Rehovot, Israel, 2008. [Google Scholar]
- Kienzler, K.M.; Djanibekov, N.; Lamers, J.P. An agronomic, economic and behavioral analysis of application to cotton and wheat in post-Soviet Uzbekistan. Agric. Syst. 2011, 104, 411–418. [Google Scholar] [CrossRef]
- SCRUz. The State Committee of the Republic of Uzbekistan on Statistics; SCRUz: Tashkent, Uzbekistan, 2017. [Google Scholar]
- Kienzler, K.M.; Rudenko, I.; Ruzimov, J.; Ibragimov, N.; Lamers, J.P. “Winter wheat quantity or quality” Assessing food security in Uzbekistan. Food Secur. 2011, 3, 53–64. [Google Scholar] [CrossRef]
- Djanibekov, N.; Van Assche, K.; Bobojonov, I.; Lamers, J.P. Farm restructuring and land consolidation in Uzbekistan: New farms with old barriers. Eur.-Asia Stud. 2012, 64, 1101–1126. [Google Scholar] [CrossRef]
- Rudenko, I.; Nurmetov, K.; Lamers, J.P. Cotton, Water, Salts and Soums–economic and ecological restructuring in Khorezm, Uzbekistan. In State Order and Policy Strategies in the Cotton and Wheat Value Chains; Martius, C., Rudenko, I., Lamers, J.P.A., Vlek, P.L.G., Eds.; Springer: Dordrecht, The Netherlands, 2012; pp. 371–387. [Google Scholar]
- FAOSTAT. FAO Statistics Division. 2018. Available online: http://ref.data.fao.org/database?entryId=262b79ca-279c-4517-93de-ee3b7c7cb553 (accessed on 12 April 2018).
- Karimov, A.A.; NiÇo-Zarazffla, M. Assessing Efficiency of Input Utilization in Wheat Production in Uzbekistan; V&R Unipress GmbH: Göttingen, Germany, 2015. [Google Scholar]
- Hasanov, S. Agricultural Polices To Enhance The Development Of Fruit And Vegetable Subsectors in Uzbekistan. Eur. Sci. J. 2016, 12. [Google Scholar] [CrossRef]
- Karimov, A.A. Factors affecting efficiency of cotton producers in rural Khorezm, Uzbekistan: Re-examining the role of knowledge indicators in technical efficiency improvement. Agric. Food Econ. 2014, 2, 1. [Google Scholar] [CrossRef] [Green Version]
- Hasanov, S.; Ahmed, M.N. Agricultural efficiency under resource scarcity in Uzbekistan: A data envelopment analysis. Bus. Econ. Horiz. 2011, 4, 81–87. [Google Scholar] [CrossRef]
- Available online: www.yourfreetemplates.com (accessed on 3 May 2018).
- SCRUz. Statistical Department of Samarkand Region; SCRUz: Tashkent, Uzbekistan, 2015. [Google Scholar]
- Coelli, T.J.; Battese, G.E. Identification of factors which influence the technical inefficiency of Indian farmers. Aust. J. Agric. Econ. 1996, 40, 103–128. [Google Scholar] [CrossRef]
- Tischbein, B.; Awan, U.K.; Abdullaev, I.; Bobojonov, I.; Conrad, C.; Jabborov, H.; Forkutsa, I.; Ibrakhimov, M.; Poluasheva, G. Cotton, Water, Salts and Soums–economic and ecological restructuring in Khorezm, Uzbekistan. In Water Management in Khorezm: Current Situation and Options for Improvement (Hydrological Perspective); Martius, C., Rudenko, I., Lamers, J.P.A., Vlek, P.L.G., Eds.; Springer: Dordrecht, The Netherlands, 2012; pp. 69–92. [Google Scholar]
- Coelli, T.; Prasada Rao, D.; O’Donnnel, C.H.; Battese, G. An Introduction to Efficiency and Productivity Analysis, 2nd ed.; Springer: New York, NY, USA, 2005. [Google Scholar]
- Coelli, T.; Rahman, S.; Thirtle, C. Technical, Allocative, Cost and Scale Efficiencies in Bangladesh Rice Cultivation: A Non-parametric Approach. J. Agric. Econ. 2002, 53, 607–626. [Google Scholar] [CrossRef]
- Farrell, M.J. The measurement of productive efficiency. J. R. Stat. Soc. Ser. A 1957, 120, 253–290. [Google Scholar] [CrossRef]
- Charnes, A.; Cooper, W.W.; Rhodes, E. Evaluating program and managerial efficiency: An application of data envelopment analysis to program follow through. Manag. Sci. 1981, 27, 668–697. [Google Scholar] [CrossRef]
- Banker, R.D.; Charnes, A.; Cooper, W.W. Some models for estimating technical and scale inefficiencies in data envelopment analysis. Manag. Sci. 1984, 30, 1078–1092. [Google Scholar] [CrossRef]
- Aigner, D.; Lovell, C.A.K.; Schmidt, P. Formulation and Estimation of Stochastic Frontier Production Function Models. J. Econ. 1977, 6, 21–37. [Google Scholar] [CrossRef]
- Battese, G.E.; Malik, S.J.; Gill, M.A. An Investigation of Technical Inefficiencies of Production of Wheat Farmers in Four Districts of Pakistan. J. Agric. Econ. 1996, 47, 37–49. [Google Scholar] [CrossRef]
- Bozoğlu, M.; Ceyhan, V. Measuring the technical efficiency and exploring the inefficiency determinants of vegetable farms in Samsun province, Turkey. Agric. Syst. 2007, 94, 649–656. [Google Scholar] [CrossRef]
- Alemdar, T.; Oren, M.N. Determinants of Technical Efficiency of Wheat Farming in Southern Anatolia, Turkey: A Nonparametric technical efficiency analysis. J. Appl. Sci. 2006, 6, 827–830. [Google Scholar]
- Amemiya, T. Tobit models: A survey. J. Econ. 1984, 24, 3–61. [Google Scholar] [CrossRef]
- Maddala, G. Introduction to Econometrics: Business Econometrics, 2nd ed.; University of Florida, MacMillan Pub. Comp.: New York, NY, USA, 1992; 631p. [Google Scholar]
- Kumbhakar, S.C.; Wang, H.; Horncastle, A.P. A Practitioner’s Guide to Stochastic Analysis Using Stata; Cambridge University Press: Cambridge, UK, 2015. [Google Scholar]
- Bekchanov, M.; Müller, M.; Lamers, J.P. Cotton, Water, Salts and Soums–economic and ecological restructuring in Khorezm, Uzbekistan. In A Computable General Equilibrium Analysis of Agricultural Development Reforms: National and Regional Perspective; Martius, C., Rudenko, I., Lamers, J.P.A., Vlek, P.L.G., Eds.; Springer: Dordrecht, The Netherlands, 2012; pp. 347–370. [Google Scholar]
- Conrad, C.; Dech, S.W.; Hafeez, M.; Lamers, J.; Martius, C.; Strunz, G. Mapping and assessing water use in a Central Asian irrigation system by utilizing MODIS remote sensing products. Irrig. Drain. Syst. 2007, 21, 197–218. [Google Scholar] [CrossRef] [Green Version]
Figure 1.
Dynamics of main food crop production in Uzbekistan (1000 tons). Source: Reference [7].
Figure 1.
Dynamics of main food crop production in Uzbekistan (1000 tons). Source: Reference [7].

Figure 2.
The map of Uzbekistan and Samarkand. Source: References [16].
Figure 2.
The map of Uzbekistan and Samarkand. Source: References [16].


Table 1.
Characteristics of wheat production in Uzbekistan during the transition.
| Uzbekistan | |||||||
|---|---|---|---|---|---|---|---|
| Units | 1991 | 1995 | 2000 | 2005 | 2011 | 2015 | |
| Total harvested area | thousand ha | 487.2 | 1164.3 | 1355.8 | 1439.7 | 1466.3 | 1445.7 |
| Yield | tons/ha | 1.25 | 2.02 | 2.61 | 4.12 | 4.65 | 4.82 |
| Total production | thousand tons | 609.5 | 2346.9 | 3532.0 | 5927.8 | 6657.3 | 7115.6 |
| Samarkand region | |||||||
| Total harvested area | thousand ha | 119.3 | 196.8 | 188.4 | 161.1 | 165.4 | 174.8 |
| Yield | tons/ha | 1.14 | 1.46 | 2.58 | 4.41 | 5.83 | 4.62 |
| Total production | thousand tons | 136.1 | 287.3 | 336.1 | 634.8 | 756.1 | 808.2 |
Source: Reference [7].
Table 2.
Summary statistics of output and input variables and Farm specific factors.
| Variables | Markings | Unit of Measurement | Mean | Standard Deviation | Min. | Max. |
|---|---|---|---|---|---|---|
| Output: | ||||||
| Wheat yield | Y | kg/ha | 3794.78 | 741.463 | 2270 | 6000 |
| Inputs: | ||||||
| Seeds | SD | kg/ha | 218.282 | 20.956 | 180 | 250 |
| Organic fertilizer | OrFer | kg/ha | 1009.048 | 313.734 | 500 | 3200 |
| Chemical fertilizers | ChFer | kg/ha | 270.258 | 60.026 | 100 | 460 |
| Labor | LF | man-days/ha | 128.733 | 20.2473 | 84 | 187 |
| Farm-specific factors | ||||||
| Age of farmer | Age | years | 40.5403 | 8.6498 | 24 | 67 |
| Age squared | ASq | age2 | 1662.452 | 684.2309 | 576 | 3249 |
| Soil fertility/(Bonitet score) | SFer | Index (1–100) | 50.2741 | 5.8048 | 38 | 67 |
| Agricultural education | AgEdu | (Yes = 1; No = 0) | 0.3870 | 0.4890 | 0 | 1 |
| Satisfaction from seed quality | AQual | (Yes = 1; No = 0) | 0.4032 | 0.4925 | 0 | 1 |
| Water availability | WAv | (enough = 1; not enough = 0) | 0.5161 | 0.5017 | 0 | 1 |
Table 3.
Coefficients of Cobb-Douglas production function.
| Variables | Markings | Coefficients | Standard Error | t-Statistics |
|---|---|---|---|---|
| Intercept | 2.45,677 *** | 0.35.097 | 7.00 | |
| Ln (Seed) | lnSD | 0.20,888 ** | 0.10.781 | 1.94 |
| Ln (Organic Fertilizer) | lnOrFer | 0.28,868 *** | 0.04.984 | 5.79 |
| Ln (Chemical Fertilizer) | lnChFer | 0.22,029 *** | 0.06/7419 | 3.43 |
| Ln (Labor) | lnLF | 0.29,079 *** | 0.1036.57 | 2.81 |
| Adjusted R-squared | 0.88 | |||
| Number of observations | 124 | |||
Note: **, *** Indicate significance at 1% and 5% level.
Table 4.
Frequency distribution of technical efficiency scores in Data Envelopment Analysis.
| Efficiency Scores | CRS | VRS | SE |
|---|---|---|---|
| 1.00 | 9 | 21 | 16 |
| 0.90–1.00 | 20 | 19 | 92 |
| 0.80–0.90 | 30 | 31 | 11 |
| 0.70–0.80 | 33 | 31 | 3 |
| 0.60–0.70 | 28 | 17 | 2 |
| 0.50–0.60 | 4 | 5 | |
| Mean efficiency | 0.79 | 0.82 | 0.96 |
| Minimum efficiency | 0.53 | 0.54 | 0.65 |
| Maximum efficiency | 1.00 | 1.00 | 1.00 |
| Standard deviation | 0.12 | 0.12 | 0.06 |
CRSTE = technical efficiency from constant return to scale DEA; VRSTE = technical efficiency from variable return to scale DEA; SCALE = scale efficiency = CRSTE/VRSTE.
Table 5.
Results of Tobit regression for efficiency scores.
| Variables | Markings | Coefficients | Standard Error | t-Statistics |
|---|---|---|---|---|
| Constant | 0.40931 *** | 0.10336 | 3.96 | |
| Age of farmer | Age | 0.00696 ** | 0.00270 | 2.58 |
| Age_squared | ASq | −0.00006 * | 0.00003 | −1.94 |
| Soil fertility (SFer) | SFer | 0.00405 ** | 0.00174 | 2.32 |
| Agricultural education | AgEdu | 0.04340 ** | 0.02097 | 2.07 |
| Seed quality | AQual | 0.04184 ** | 0.02104 | 1.99 |
| Water availability | WAv | 0.00939 | 0.02013 | 0.47 |
| Number of observations | 124 | |||
| Log likelihood | 95.18208 |
Note: *, **, *** Indicate significance at 1%, 5% and 10% level respectively.
© 2018 by the authors. Licensee MDPI, Basel, Switzerland. This article is an open access article distributed under the terms and conditions of the Creative Commons Attribution (CC BY) license (http://creativecommons.org/licenses/by/4.0/).
Share and Cite
MDPI and ACS Style
Sherzod, B.; Kim, K.-R.; Lee, S.H. Agricultural Transition and Technical Efficiency: An Empirical Analysis of Wheat-Cultivating Farms in Samarkand Region, Uzbekistan. Sustainability 2018, 10, 3232. https://doi.org/10.3390/su10093232
AMA Style
Sherzod B, Kim K-R, Lee SH. Agricultural Transition and Technical Efficiency: An Empirical Analysis of Wheat-Cultivating Farms in Samarkand Region, Uzbekistan. Sustainability. 2018; 10(9):3232. https://doi.org/10.3390/su10093232
Chicago/Turabian StyleSherzod, Babakholov, Kyung-Ryang Kim, and Sang Hyeon Lee. 2018. "Agricultural Transition and Technical Efficiency: An Empirical Analysis of Wheat-Cultivating Farms in Samarkand Region, Uzbekistan" Sustainability 10, no. 9: 3232. https://doi.org/10.3390/su10093232
Note that from the first issue of 2016, this journal uses article numbers instead of page numbers. See further details here.