Article

An Approach to Generating Reference Information for Technology Evaluation

1
Interdisciplinary Program of Management of Technology, Pukyong National University, 45 Yongso-ro, Nam-gu, Busan 48513, Korea
2
Graduate School of Management of Technology, Pukyong National University, 365 Sinseon-ro, Nam-gu, Busan 48547, Korea
3
Division of Interdisciplinary Industrial Studies, Hanyang University, 222 Wangsimni-ro, Seongdong-gu, Seoul 04763, Korea
*
Author to whom correspondence should be addressed.
Sustainability 2018, 10(9), 3200; https://doi.org/10.3390/su10093200
Submission received: 24 July 2018 / Revised: 31 August 2018 / Accepted: 4 September 2018 / Published: 7 September 2018

Abstract

:
A system for technology evaluation is essential for successfully implementing a technology-based financial support system. Technology evaluation has generally relied on the qualitative evaluation performed by the relevant experts. When evaluating the technologies that a certain target firm possesses, the previous evaluation results for other firms that are similar to the target firm are used together for the purpose of improving the efficiency of the qualitative evaluation. To do this, technology evaluation institutes including, KOTEC, have presented a way to create a peer group and generate reference information in order to provide a clear guidance to the evaluators. However, the current approaches have limitations in that they cannot explore the detailed features of the individual firms. Therefore, this study proposes a systematic approach to generate reference information that facilitates efficient technology evaluation. We first create a peer group by collecting the relevant firms that have similarities with a certain target firm, and then measure the internal and external similarities between the target firm and all of the firms included in the peer group. We define the average value of similarities according to each evaluation rating as density, and finally generate the distribution and the descriptive statistics for the density as reference information. We expect that this study can contribute to improving the efficiency of qualitative evaluation work by provide practical reference information. Furthermore, the reliability of the technology evaluation will also be improved by reducing the difference in the evaluation results due to the individual differences of the evaluator.

1. Introduction

As the transition to the knowledge-based economy accelerates, intangible assets represented by technology, knowledge, and information are recognized as key sources for creating sustainable competitive advantages for the firms [1,2,3,4]. Obviously, in the knowledge-based economy, knowledge rather than traditional production factors plays a key role in sustaining the competitive advantages [5]. Capabilities that allow firms to identify, access, and leverage new knowledge can ensure that the competencies that are needed for firms’ innovation are secured [6]. To achieve these capabilities, it is important to select and adopt the knowledge management systems that align well with the knowledge, along with a knowledge strategy to clearly manage firms’ knowledge [7]. However, even if these strategies and systems are well-established, they cannot guarantee sustainable competitive advantages unless they are closely associated with the corporate-wide efforts. Only by attempting to align the knowledge strategy with the corporate strategy to comprehensively manage the implicit and explicit knowledge does it become possible to secure the competitive advantages [8]. Therefore, the creation of a virtuous cycle system to create, manage, and utilize these intangible assets, including knowledge, is an essential element for raising corporate competitiveness based on technological innovation capabilities [9,10]. For the successful establishment of this system, various activities are required. Among them, technology finance for allocating financial resources to innovation activities that occur throughout the entire period of technological innovation is considered the most important requirement [11,12,13]. Technology financing refers to a system that provides financial support based on a quantitative and qualitative evaluation of the innovation and technology commercialization capabilities of individual firms [13,14]. It helps firms overcome the lack of financial resources that arise from the banks’ prevalent collateral-based lending practices [13]. In order to facilitate innovative businesses to turn technological inventions into commercial innovations, it is essential to ensure that financial support is processed in a timely manner. If the support is not processed on time, firms that need funds will be forced to fall into the valley of death [15,16]. Technology financing can serve as a bridge across the valley of death. Therefore, a technology-based financial support system is indispensable for firms to make practical achievements in the marketplace based on technological achievements. Moreover, it also contributes to the enhancement of national innovative capabilities by fostering innovation. Under this recognition, governments as well as private sectors are taking a key role in financing the technology-based businesses [16]. However, there is a high information asymmetry between the fund providers and the firms needing the funds [17,18,19], and there is a high uncertainty and risk of whether the technologies that the firms possess can produce influential outcomes in the actual market [20,21]. These make it difficult to make a clear evaluation of technology, thereby impeding the successful implementation of the technology-based financial support system. Therefore, in order to create a stable technology finance ecosystem, activities that efficiently support technology evaluation are essential.
Technology evaluation, which is the most fundamental basis for implementing technology finance, is usually carried out by a combination of quantitative evaluation based on the quantified data and qualitative evaluation performed by the relevant experts [22,23,24,25,26]. It also encompasses not only the evaluation of the technology itself, but also the evaluation of the firm that is the subject of the commercialization of the technology, since the technology-based organizational capabilities also have a huge impact on determining the value of technology [22,27,28]. The quantitative evaluation generally facilitates the qualitative evaluation. However, the qualitative evaluation based on the evaluator’s manual work generally tends to cause a difference in the evaluation results due to the individual differences of the evaluators. This means that there can be very different outcomes depending on who performs the evaluation for the same technology, which naturally causes the reliability of the evaluation results to be low. Therefore, it is important to ensure that these individual differences do not produce different evaluation results. To do this, this study aims to generate reference information that can be used together when processing a new evaluation for a target firm by utilizing the previous evaluation results for other firms that are similar to the target firm. The reference information is for the purpose of improving the efficiency and reliability of the qualitative evaluation. The currently used method for generating such reference information is to consider the commonality in terms of industrial and technological classifications. Firms classified in the same industry or technology categories as the target firm have been generally defined as similar firms, and their previous evaluation results have been used as the reference information. However, the currently used method has limitations in that it cannot explore the detailed features of the individual firms. Even if firms belong to the same industry or technology sector, their features are naturally very different. These differences make the previous evaluation results of similar firms very poorly usable as reference information for new evaluations. Therefore, this study proposes a systematic approach to generate reference information to facilitate efficient technology evaluation. To do this, it is necessary to define a way to find firms that have similarities with the target firm by exploring the level of similarity between them.
The similarity between firms has been defined in terms of structures such as market structure, organizational structure, resource structure, cost structure, and research and development (R&D) investment structure [29,30,31,32]. So, in this study, we also derive relevant firms with structural similarity to the target firm, define them as a peer group, and present their previous evaluation results as reference information. The firm structure can be divided into internal and external structures. The internal structure can be represented as firm size based on financial data, including sales, total number of employees, and total assets [33], and the external structure can be illustrated by interactions between firms through sales and purchases [34]. Therefore, this study also defines the firm structure from the internal and external perspectives, and creates a peer group by measuring the similarity in terms of the structures. To quantify the firm size that represents the structure of the internal perspective, we utilize the firm type as divided into individuals and corporations, the number of employees, gross sales, and total capital. The firm type clearly indicates the difference in the characteristics of firms’ business activities, and the number of employees, gross sales, and total capital used in the definition of small and medium enterprises are widely recognized as representative input and output indicators in analyzing the efficiency of business activities [35,36]. To quantify the degree of interactions that represent the structure of the external perspective, we utilize the business trade relations, including sales and purchases. Corporate business relations are defined as collaborative activities that create a sustainable competitive advantage based on an effort to build a special relationship with other firms [36,37]. Therefore, the degree of interactions based on these collaborations can also be used as a clear indication of the firm structure from an external perspective.
In this study, we create a peer group by deriving relevant firms with internal and external structural similarity with the target firm using the firm size and the trade relations. To measure the internal structural similarity, we calculate the vector similarity between the size data of the relevant firms and that of the target firm. To measure the external structural similarity, we represent sales and purchase relationships as sales and purchases vectors, respectively, and calculate the similarity between the vectors of the relevant firms and those of the target firm. The internal and external similarities are averaged to produce the comprehensive structural similarity, and finally, relevant firms with these structural similarities are grouped into a peer group. To enhance the meaning of reference information for technology evaluation, it is required to quantify the previous evaluation results of the firms belonging to the peer group. A commonly used method to do this is to calculate the weighted average of the similarities. However, it tends to generate only a small amount of evaluation ratings information, because most of the previous evaluation results, which are the basis for the generation of reference information, are limited to a narrow range of evaluation ratings. To remedy this problem, we define the average value of similarities according to each evaluation rating as density, and then generate the distribution and the descriptive statistics for the density as reference information. To show the applicability of the presented approach, we explore how well the generated reference information explains the original evaluation results, and compare it to that of the current approaches, which create a peer group using industry and technology categories. We expect that this study can contribute to improving the efficiency of qualitative technology evaluation work by providing practical reference information. Furthermore, the reliability of the technology evaluation will also be improved by reducing the difference in the qualitative evaluation results due to the individual differences among the evaluators.
The purpose of this study is to propose a systematic approach to generate reference information based on the firm similarity to help the technology evaluation work be done more efficiently. Therefore, a literature survey will be conducted from two perspectives to properly build the theoretical background. In the first perspective, since the research domain is technology evaluation, we start by examining its definition and meaning. Then, the major trends of previous studies on technology evaluation are briefly summarized in terms of evaluation targets and methods. Obviously, many government facilities, private firms, and individual researchers have developed qualitative and quantitative systems and models for technology evaluation. Therefore, we go through an overview of these previous systems and models, and complete an overall review of technology evaluation. Finally, we describe what reference information means and what role it plays in technology evaluation based on the existing evaluation model. In the second perspective, we are trying to utilize the firm similarity, so we list what factors or indicators have been previously used by other researchers to actually measure the similarity between firms. Since we design indicators based on these previous ones, this review will be the basis for ensuring the practical justification for the proposed indicators.

2. Literature Review

2.1. Reference Information for Technology Evaluation

To make decisions about R&D investment, it is necessary to review the expected results of R&D. This review includes the process of exploring the potential impacts of technological innovations [38], which is often called technology assessment. Technology assessment indicates a systematic attempt to analyze the consequences of introducing a specific technology that the R&D generates in all of the areas in which it may interact [39,40]. It investigates the effects on the society that can occur when introducing new technology [41]. Therefore, technology assessment is associated with extremely broad fields, including the diffusion of technology and the role of technology and society [42]. The goal of technology assessment can be thought of as providing policymakers with relevant information on policy alternatives. To effectively support strategic technology planning and management, it is necessary to assess the value of a patent portfolio, which has been thought as a straightforward proxy for capturing the rapidly evolving technological advancement [43,44]. The value assessment of patent portfolios is basically performed in the form of synthesizing the technologic–bibliometric information and the economic–strategic judgments [45]. It allows discussions regarding the assessment of strategic and technologic importance alongside market value and financial performance [45]. In general, the technology assessment includes the part that looks at the validity of the technology and the part that judges the economic value, where the former refers to evaluation and the latter refers to valuation. This study focuses on evaluating the validity and feasibility of technologies in terms of technology, business, and rights. It means that this study’s domain is a technology evaluation, which is much narrower than a technology assessment.
Previous studies related to technology evaluation have been discussed mainly in terms of evaluation targets and evaluation methods [22]. The former points out that not only the technology itself, but also the firm that utilizes the technology, has a very important meaning as an evaluation target [46]. The latter indicates that methods for technology evaluation are broadly categorized as quantitative and qualitative, and that their combined use can be useful for improving the reliability and efficiency of the evaluation [23,24]. The National Technology Transfer Center (NTTC) is a United States (US) technology assessment and transfer facility that operates programs to help federally generated technological developments be transferred to the private industry [47]. The NTTC had proposed the NTTC Technology Opportunity Potential (TOP) index as a technology assessment model, which consists of 10 qualitative technical evaluation factors, including technical merit, competitive environment, proprietary position, market attractiveness, manufacturability, regulatory issues, technical hurdles, time to market, organizational needs, and return on investment [48,49]. Japan’s Center of Technology Assessment (CTA) evaluates technology assets in relation to three factors, including the level of technology innovation, feasibility of technology, and marketability [50]. CTA also conducts evaluations, similar to NTTC, that focus on the commercialization of technologies based on qualitative assessment. The technology evaluation conducted by government facilities generally covers the consultation for specific commercialization planning and strategy, and therefore, the approaches are mostly based on the qualitative evaluation. In addition, individual researchers have proposed numerous methodologies to develop quantitative technology evaluation approaches [22]. These previous studies have attempted to measure technological characteristics using various quantifiable parameters and indicators, including developing real options-based mathematical models for technology valuation [51,52], suggesting priority determination models using multi-criteria decision-making analyses such as analytical hierarchy process [53,54,55,56], and establishing scoring models using a logistic model [57].
Based on these previous discussions, this study attempts to generate quantitative reference information about firms that are the subject of technology utilization and commercialization to facilitate the qualitative evaluation of their technology. Reference information has been utilized for various purposes in various forms, including design process and analysis structure [58]. For example, reference methods for prospective analyses of technology have been defined for the purpose of supporting future-oriented analyses of technologies [59]. These will allow researchers to access practically verified patterns that will be helpful in their research. As such, reference information can serve as a useful tool for a variety of research activities. Therefore, in this study, it can be seen that reference information can contribute to improving the efficiency of the manual evaluation work, in that it provides the evaluator who is performing the qualitative evaluation with useful information that can be referenced in the evaluation work. In addition, the reliability of the technology evaluation can be improved by reducing the variance of the qualitative evaluation results that can be caused by the individual differences of the evaluators [13].
The most representative technology evaluation model is the Kibo Technology Rating System (KTRS) developed by the Korea Technology Finance Corporation (KOTEC), which is a technology-based credit guarantee institution [60]. KTRS, which aims to assess the potential future value of technology, explores both aspects of business risk and financial risk. Among them, in the aspect of business risk, the evaluation of firms are conducted, and in this evaluation process, defining the peer group and generating the reference information becomes an important part [57,61,62]. However, currently, the peer groups are defined by simply grouping firms belonging to the same industry or technology areas. It has limitations in that it does not explore the detailed characteristics of the individual firms that were pointed out in the first of the major issues of technology evaluation, namely, the evaluation target. Therefore, in this study, we present a method to define the peer group from the viewpoint of internal and external structures so as to reflect the detailed characteristics of individual firms.

2.2. Structural Similarities between Firms

Firm similarity has generally been regarded as the similarity of activities that firms intend to implement [63]. Previous studies often argue that the structural similarity between firms tends to lead them to determine the intensity of competition or cooperation [29,30,64,65]. Similar firms can closely recognize the interdependences and predict the moves of rivals easily and accurately, which makes them generate a similar competitive strategy [29]. Firms with such similar strategies would also likely have the underlying resource endowments, which would lead these firms to face aggressive competition [31]. Moreover, firms are more likely to work with similar partners, because cognitive interaction processes can be improved and miscommunication would be less likely to occur [66]. To derive empirical evidence for these arguments, previous studies have suggested a number of methods to define and measure the structural similarity between firms from various perspectives. This structural similarity can be naturally divided into internal and external similarities. The internal structure explores the similarity of a firm’s internal activities, and is defined primarily around inputs including R&D expenditure, the number of employees, cost, and business capabilities and outputs including sales, assets, revenue, and the output share of products for those activities. The external structure examines the similarity of external interactions between firms, and is generally defined using the outputs of interfirm exchange activities, including resources, market shares, and customers (accounts).
Table 1 summarizes the various criteria that have been used in previous studies to measure the firm similarity regarding internal and external structures. They have mainly focused on exploring the impact of firm similarity on differences in the degree of competition between firms, or in creating synergistic effects of collaboration. Although there has been no previous academic study that directly uses the concept of firm similarity for the purpose of technology evaluation, it has been practically utilized by measuring the firm similarity to create a peer group and generate reference information. However, the currently used method has limitations in that it cannot explore the detailed features of the individual firms. In this study, we try to propose indicators for measuring the firm similarity so that we can overcome these limitations and create a more precise peer group. The design of these indicators is intended to reflect the viewpoint of the internal and external structures that have been utilized by many researchers for various purposes, as summarized in Table 1. Among the factors used in the previous studies related to the firm similarity measurement, we select the variables that can be clearly quantified to measure the similarity in both structures. Moreover, a variety of studies investigating the measurement of technological similarity for the purpose of technological planning and analysis have also been conducted by using multiple indicators. Among them, one study specifically divides the technological similarity into two forms of categorical similarity and semantic similarity, and uses the cosine measure and the tree-based similarity measure, respectively [67]. It has the advantage that the similarity can be precisely measured by reflecting the specific properties of the technology together with the viewpoint of the category to which the technology belongs. In particular, among the various similarity measurement indices, the cosine measure is known to be appropriate for the visualization of the vector space, since this measure is defined in geometrical terms [68]. Since this study also attempts to measure the vector similarity, the cosine measure can be seen as a very useful tool. However, the cosine measure is generally confined to the range from −1 to 1, which is not appropriate to use in this study as a weight value. Of course, considering more intangible aspects such as corporate culture and corporate foresight maturity will be very meaningful to fully reflect the individual firms’ characteristics. The corporate foresight maturity assessment model aims to measure the foresightedness of an organization based on a serial process of perceiving, prospecting, and probing [69,70]. However, lots of qualitative evaluation activities must be incorporated in order to reflect these aspects. The purpose of this study is to develop a quantitative reference information generation method, so we intend to use indicators that are much more simple and quantifiable directly and unambiguously.

3. Methods

This section briefly describes the data and methods used in this study and the expected final deliverables of the proposed approach, as shown in Figure 1. A more detailed explanation of the approach itself will be covered in the next section. First, we gather financial data and sales and purchases data that can represent the firm size and business trade relations of the firms that have already been evaluated, respectively. The firms’ previous evaluation results are also gathered, since the reference information is basically generated by using the previous results. We then use filtering methods to collect the firms that are relevant to the target firm that is the subject of a new evaluation. Second, we measure the similarity between the target firm and the relevant firms using the gathered data. Since this measurement is based on calculating the vector similarity, the data is transformed into a vector form. To calculate the similarity between the vectors, we use the Bray–Curtis dissimilarity index-based methods. Finally, we generate reference information using the concept of density. The final outputs include the density distribution, the descriptive statistics for the density, and the box plot using the density data. The final outputs as reference information in the graphical and summarized statistical form can allow the evaluators to view various information related to the previous evaluation results of the relevant firms.

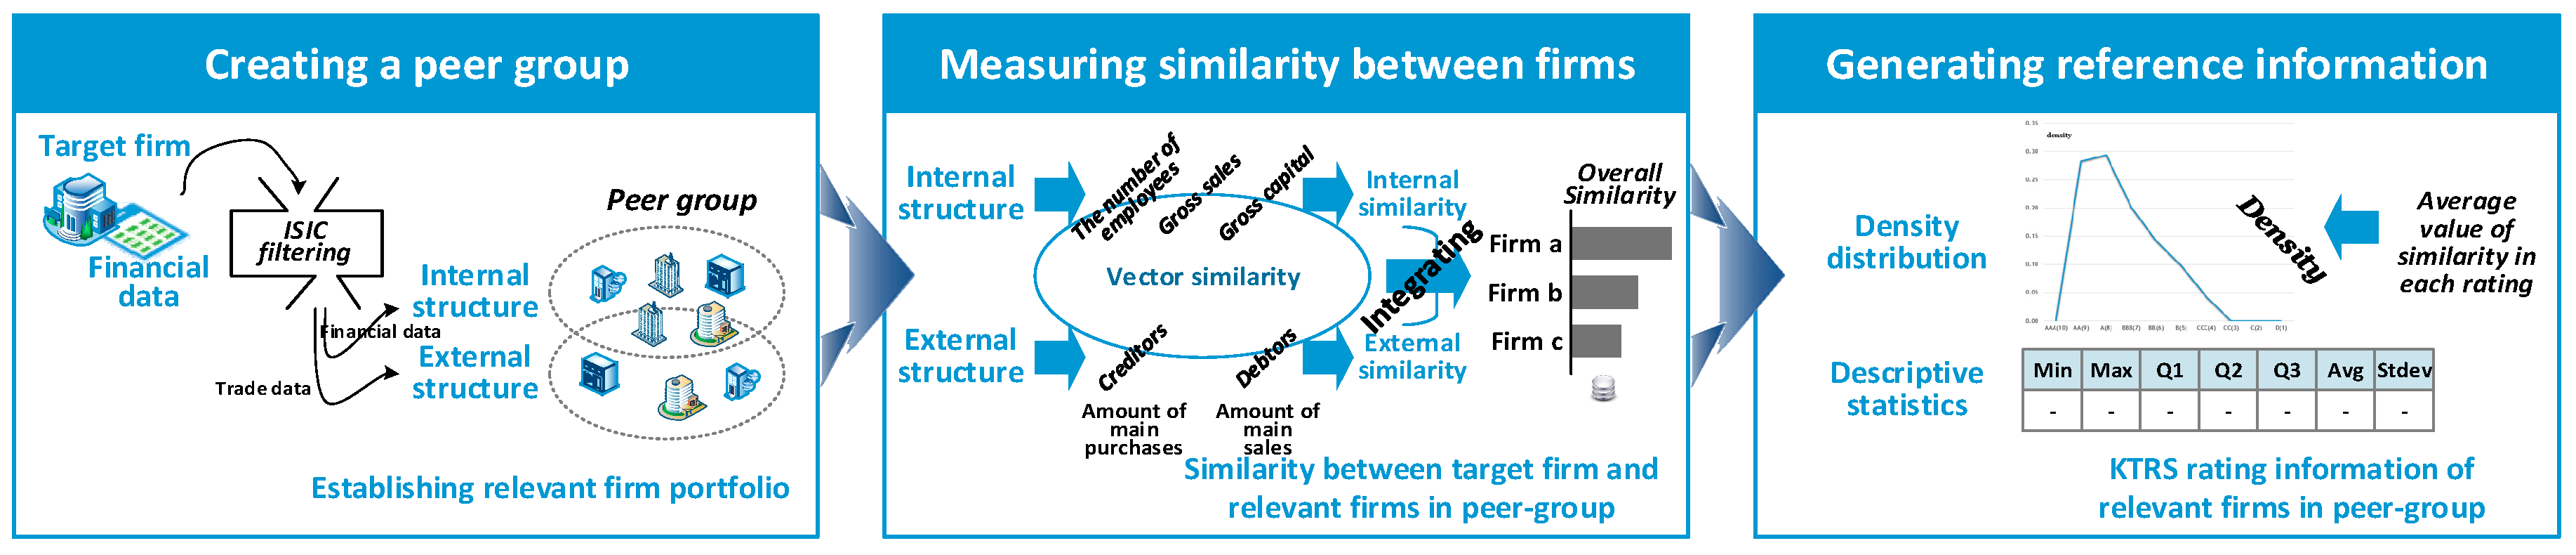
4. Approach to Generating Reference Information for Technology Evaluation

There is already a way to define a peer group by collecting firms with similarities to a target firm and generating reference information from them, since the reference information is widely utilized to improve the efficiency and reliability of the qualitative technology evaluation. However, the previous method has limitations: it considers only the commonality in terms of industrial and technological classifications. It cannot explore the detailed features of the individual firms. This study is motivated to address this limitation. To explore how to create the peer group using the structural similarity between firms and generate the reference information from the group, we present a procedural framework that consists of three steps, as shown in Figure 2: (1) creating a peer group based on the similarity between a certain target firm and other firms that have already been evaluated, (2) measuring the internal and external similarities between the target firm and all of the firms included in the peer group, and (3) generating reference information by deriving the density that combines the similarity values with the previous evaluation results of the firms in the peer group.

4.1. Creating Peer Groups

The reference information for a target firm is basically generated by using the previous evaluation results of the firms that have already been evaluated. We first identify the firms that are similar to the target firm, and then generate the reference information by summarizing the previous evaluation results of these similar firms. However, it must be highly inefficient to measure the similarity of all of the firms, because the number of firms that have been evaluated is extremely huge. Therefore, in this step, we create a peer group that includes only a list of firms based on two filtering phases, as shown in Figure 3. In the first phase, industrial classification code-based filtering is carried out. Firms that have been classified in the same industry category tend to share many common and similar features in general [30,74]. To put only those firms that have features similar to the target firm into the peer group, we select the ones that belong to the same International Standard Industrial Classification (ISIC) code as the target firm. To ensure that we have enough relevant firms to generate reference information, we use the first two digits of the ISIC code. In the second phase, internal and external similarity-based filtering is performed. From the perspective of the internal structure, since we utilize the firm types that are divided into individuals and corporations, the number of employees, gross sales, and total capital, we select only those firms that have a commonality with the target firm in these factors. From the perspective of the external structure, since we utilize the business trade relations including sales and purchases, we select only those firms that have similarities with the target firm in these relations. This step makes it possible to define a peer group that is composed of a suitable number of companies, and furthermore, a reference information generation work that is based on the similarity measurement can be more effectively executed.

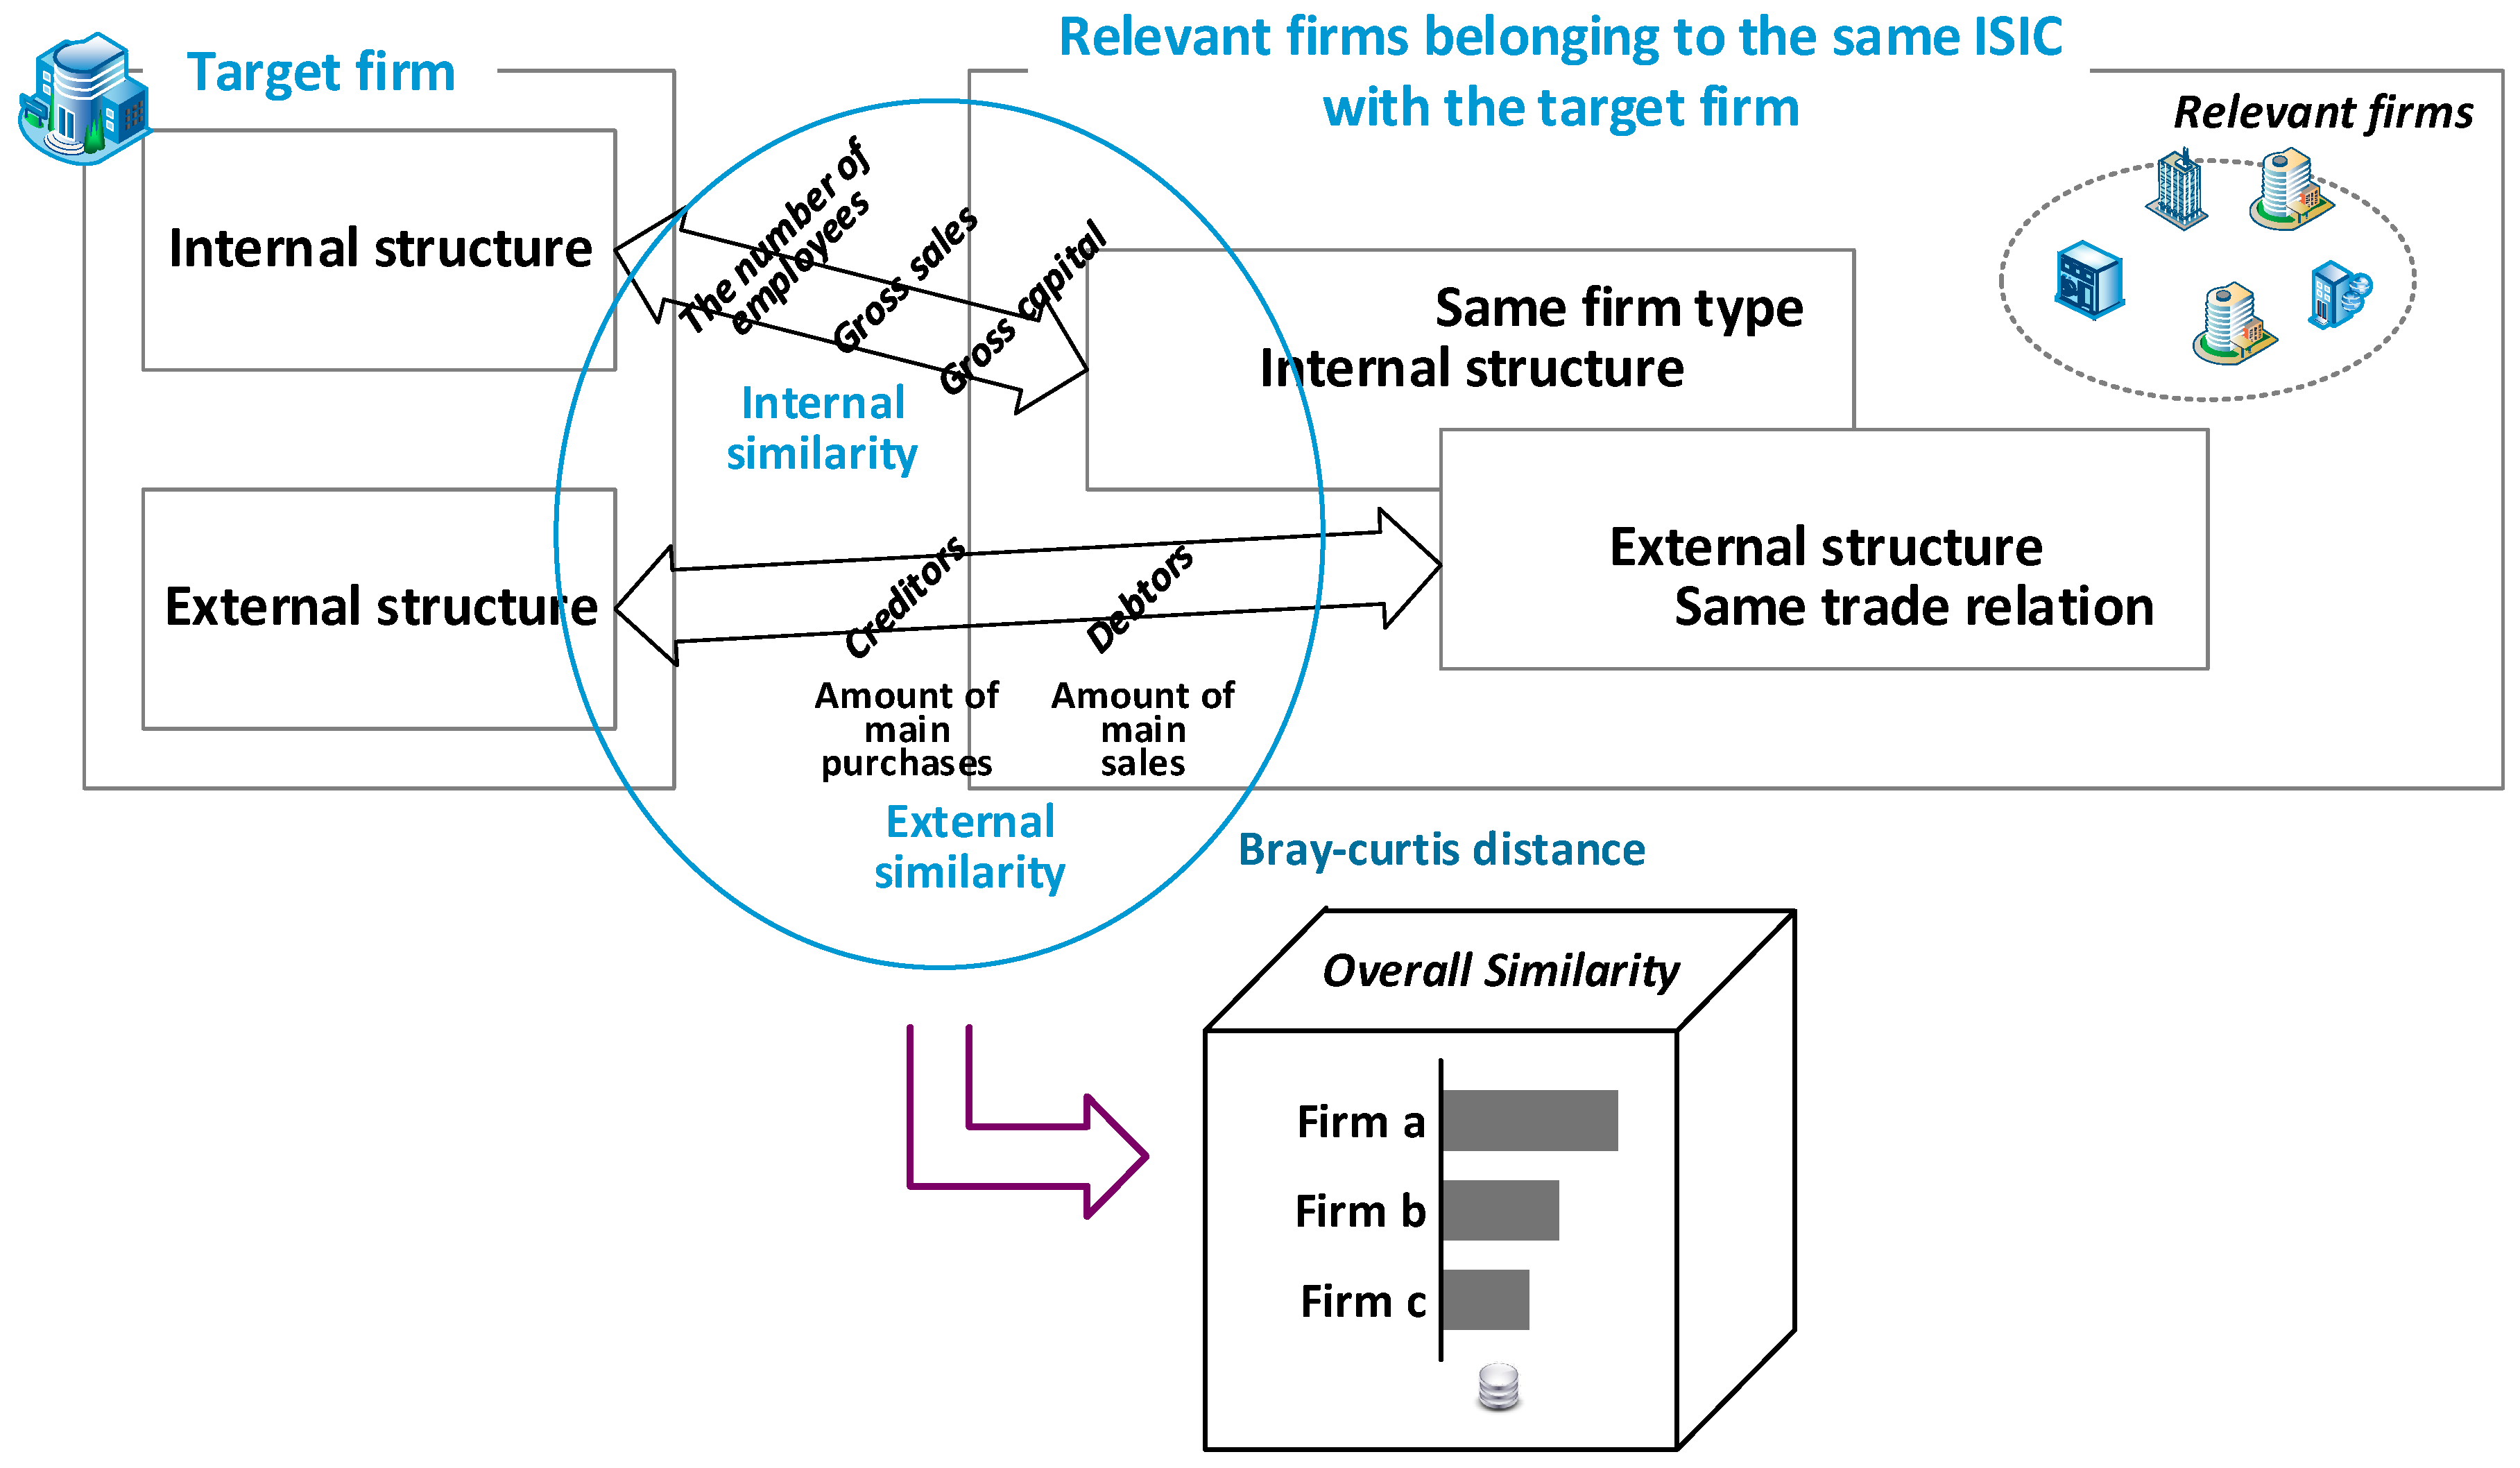
4.2. Measuring Similiarity between Firms

The synthesis of the previous evaluation results of relevant firms belonging to the peer group leads to the generation of reference information. This synthesis is accomplished using the weights given by the degree of similarity between the relevant firms and the target firm. Therefore, this step measures the similarity between firms. It is measured from two points of view—internal and external structures—and then computed as the average of the normalized values for each of them. The internal structure, which is described as firm size, can be quantified by using the financial data, including the firm types, the number of employees, gross sales, and total capital. Therefore, we can assess the internal structural similarity by calculating the vector similarity between the size data of the relevant firms and that of the target firm. The external structure, which is illustrated by trade interactions, can be quantified by using the business trade relations, including sales and purchases. Therefore, we can assess the external structural similarity by representing the sale and purchase relations as sale and purchase vectors, respectively, and calculating the similarity between the vectors of the relevant firms and those of the target firm. To calculate the similarity between two vectors, we use the Bray–Curtis dissimilarity index, which is defined as the ratio of the absolute difference in the individual elements to the sum of the individual elements of the two vectors [77]. Since the Bray–Curtis dissimilarity is confined to the range from 0 to 1 [78], it can be easily used as a weight when performing the synthesis of the previous evaluation results. Consequently, for a certain target firm i and a relevant firm j, the overall similarity between them can be calculated as:
O S i j = ( n o r ( I S i j ) + n o r ( E S i j ) ) 2 ,
I S i j = 1 ( k | s c a l e d ( x i k ) s c a l e d ( x j k ) | k ( s c a l e d ( x i k ) + s c a l e d ( x j k ) ) ) ,
E S i j = 1 ( ( k | s i k s j k | k ( s i k + s j k ) ) + ( k | p i k p j k | k ( p i k + p j k ) ) ) 2 ,
s c a l e d ( v ) = ( v m i n ( · ) ) ( m a x ( · ) m i n ( · ) ) ,
n o r ( S i j ) = S i j j S i j
where I S i j and E S i j denote the similarity between firms i and j in terms of internal structure and external structure, respectively. I S i j is defined using the Bray–Curtis dissimilarity between vectors representing the size of firms i and j, where x indicates the individual element of the vectors. E S i j is calculated as the average of the similarity between sale vectors and the similarity between purchase vectors, where s and p mean the individual elements of sale vectors and purchase vectors, respectively. The sale and purchase vectors represent the sale and purchase relationships, respectively. s c a l e d ( v ) denotes the unity-based normalization used to bring all of the values within a confined range (0, 1), and n o r ( S i j ) indicates the result of the normalization so that the sum of the values is equal to 1.

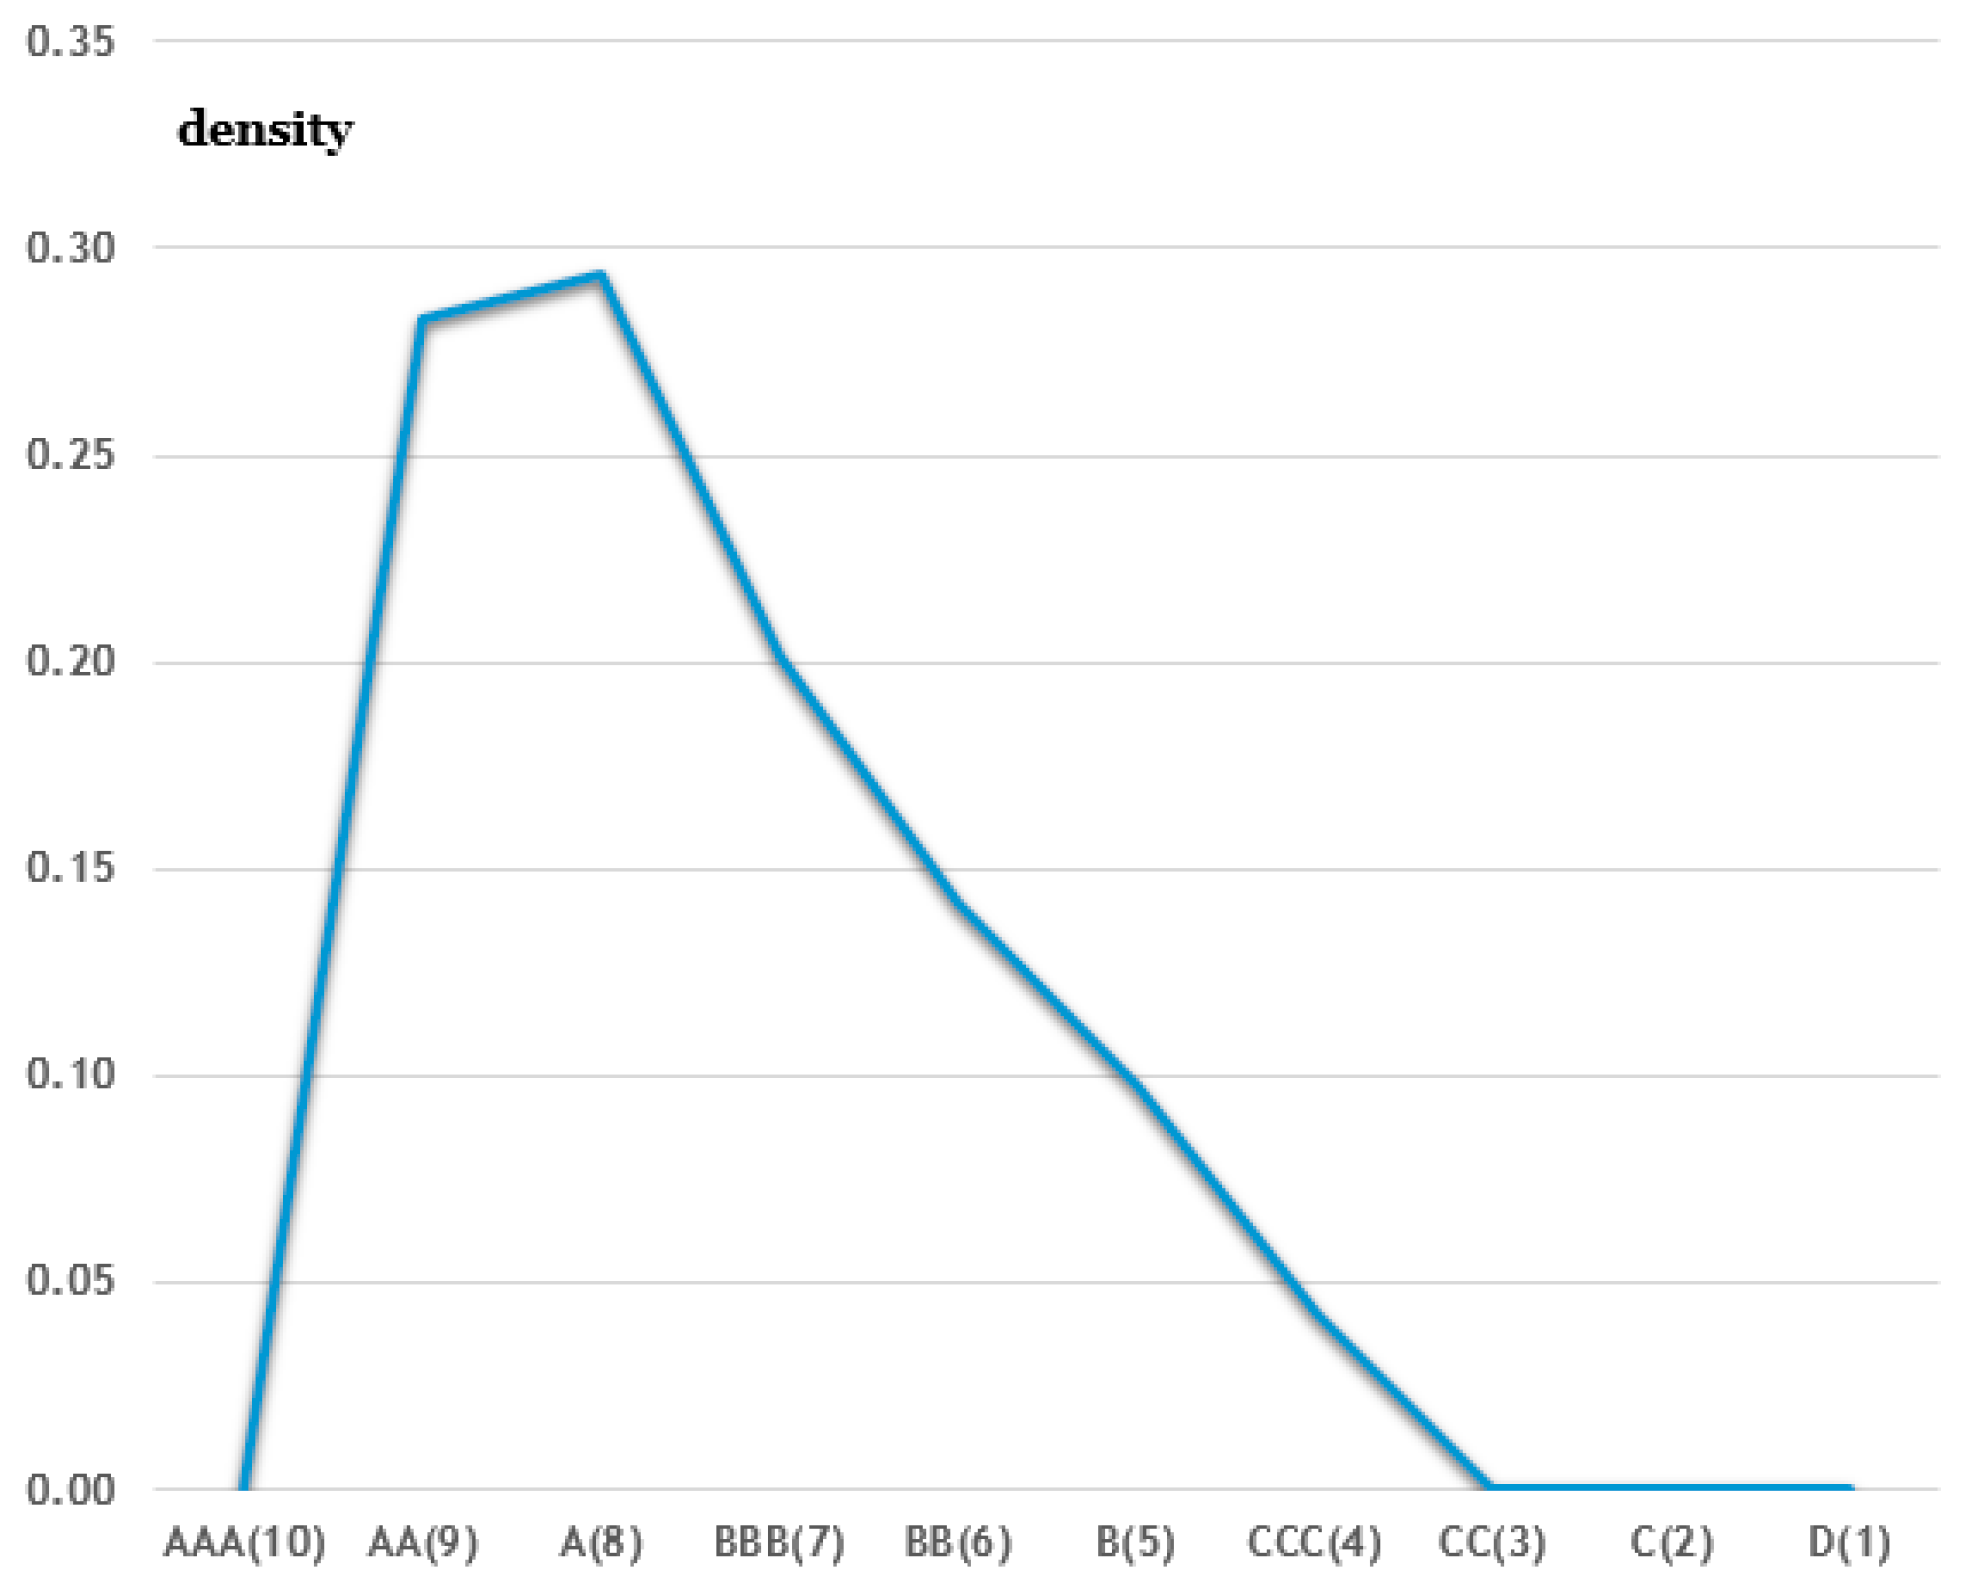
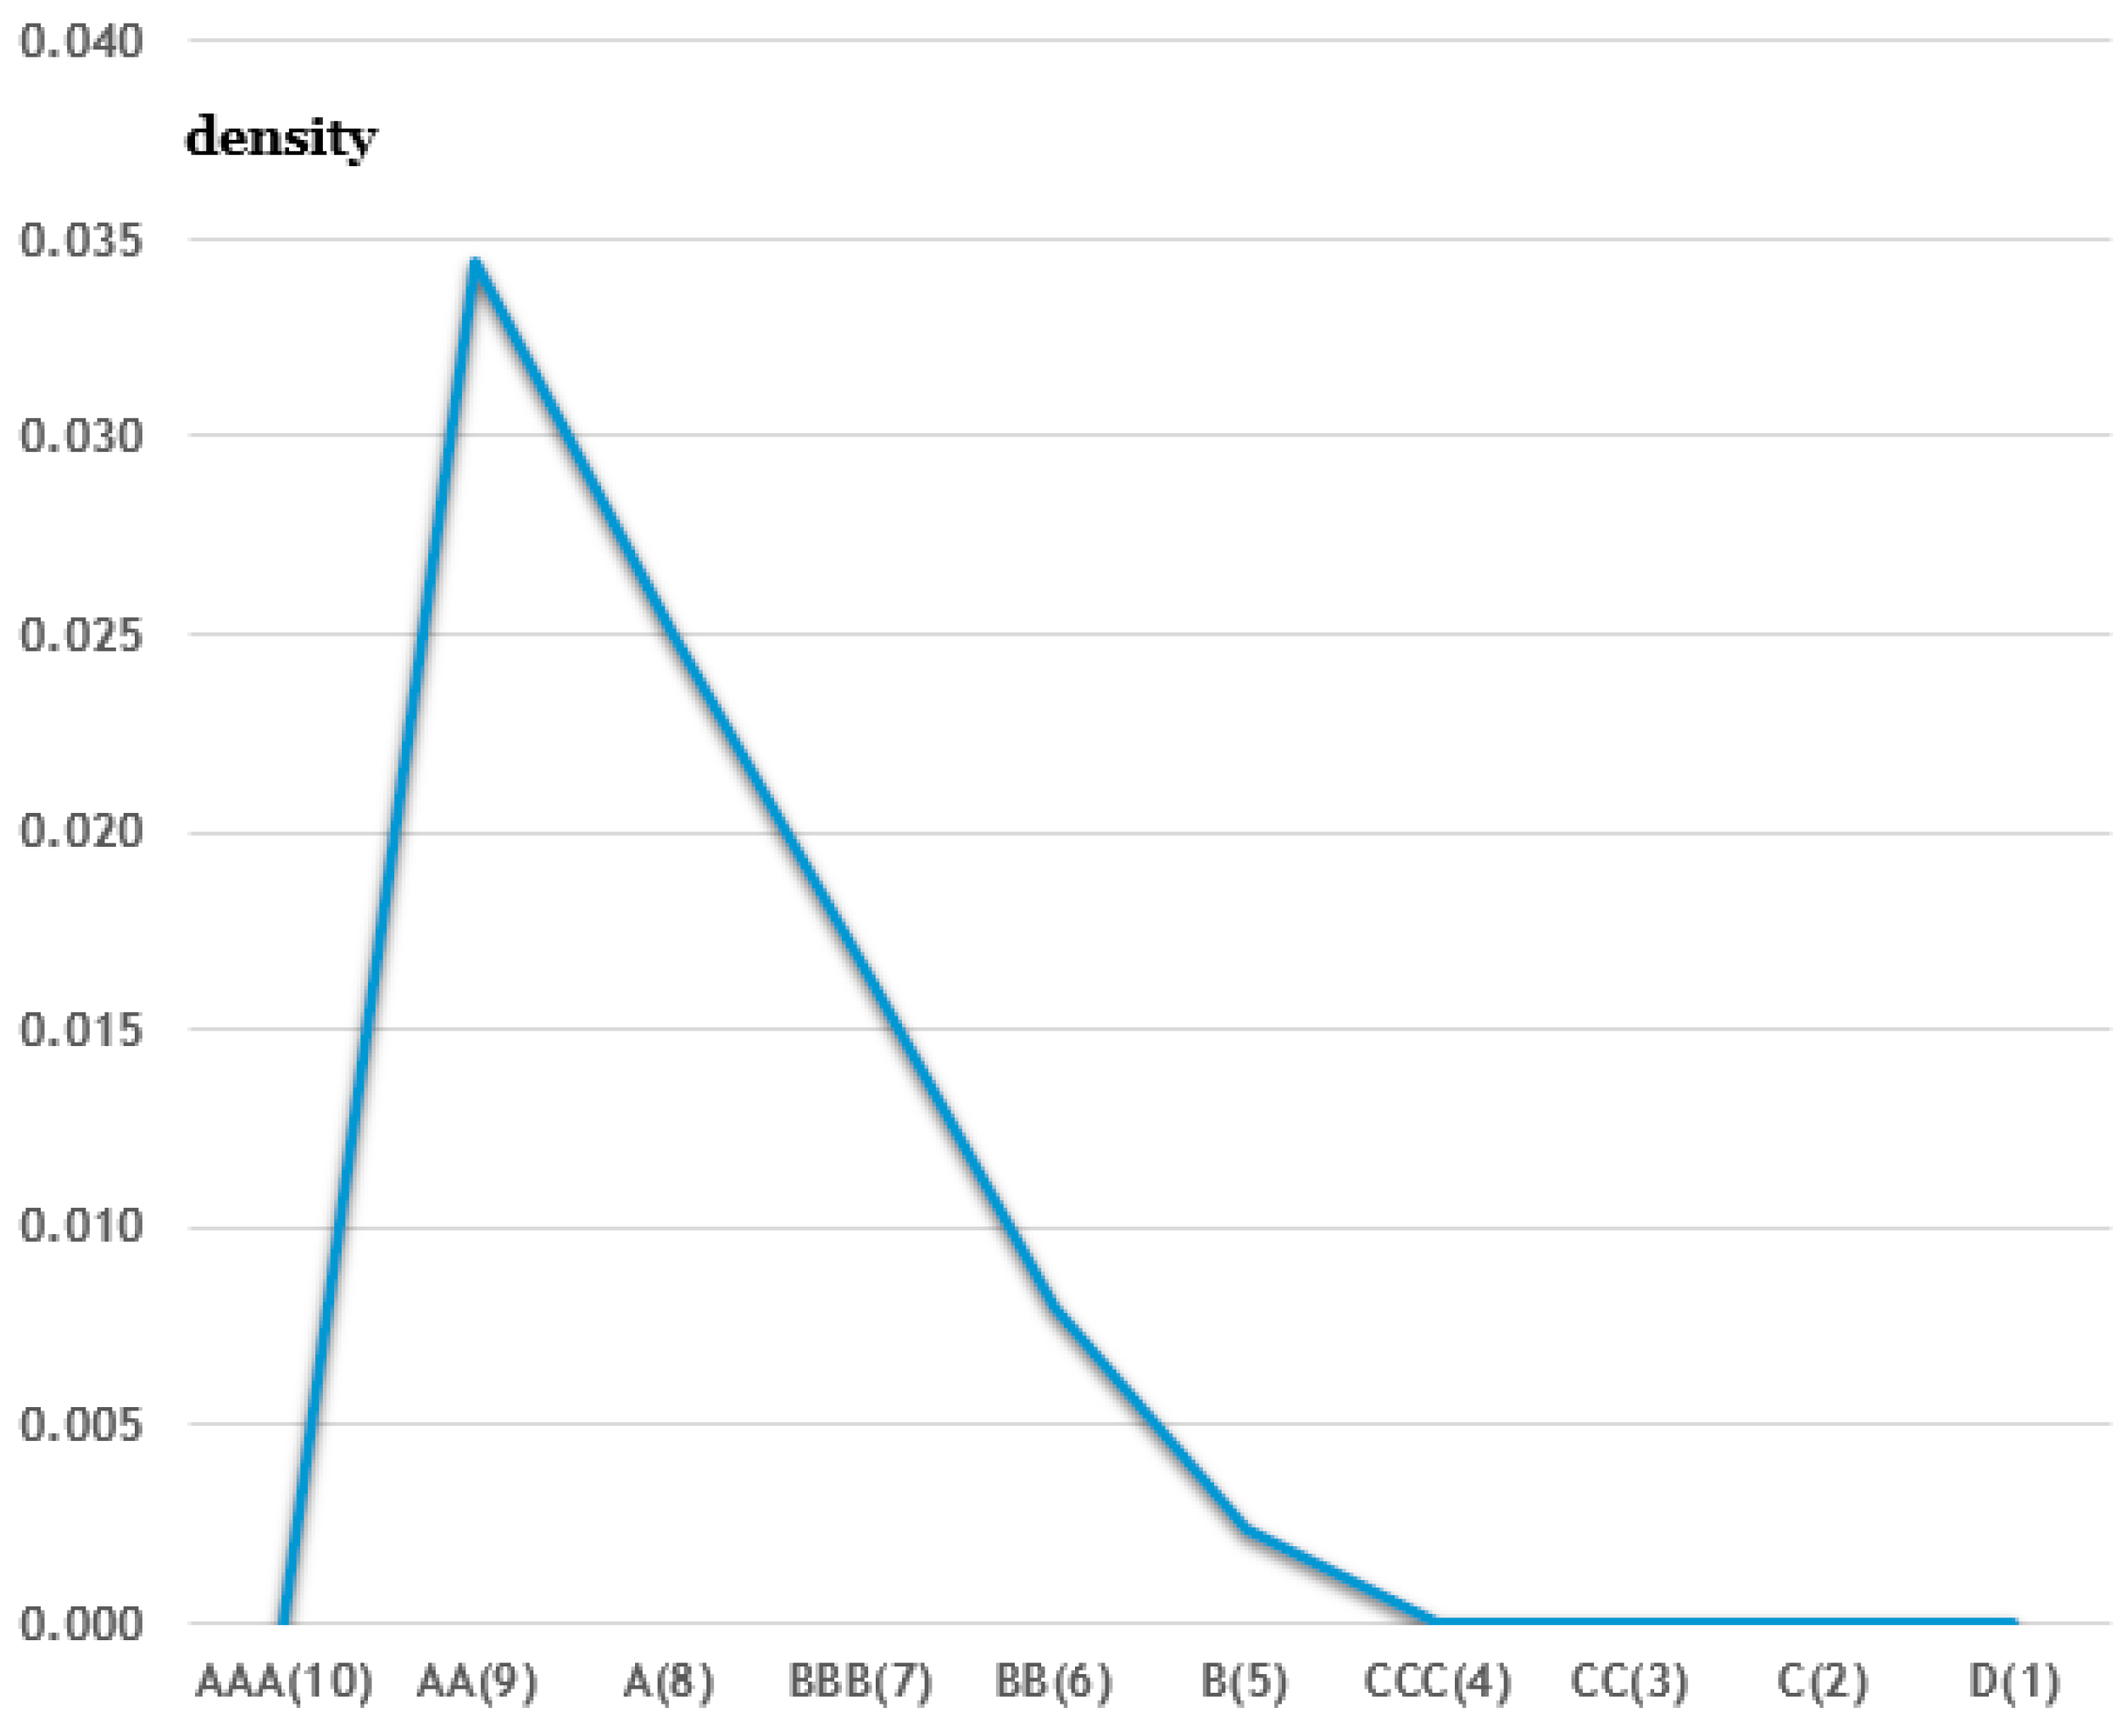
4.3. Generating Reference Information

This step finally generates the reference information by combining the similarity values of the relevant firms in the peer group and their previous evaluation results. The easiest way to do this is to calculate the weighted average of the similarity values. However, this method tends to produce almost similar results, because the previous evaluation results of the relevant firms do not evenly include all of the ratings. The total number of ratings used in the evaluation by the KOTEC’s KTRS is 10 (AAA, AA, A, BBB, BB, B, CCC, CC, C, and D), of which the three ratings account for 89% of the previous evaluation results. The relevant firms would also have been given mostly these three ratings in the previous evaluation, so if we calculate the weighted average of the similarities to generate the reference information, we will naturally acquire similar results every time, which will cause a fade in the meaning of the reference information. To remedy this problem, we propose the concept of density, which is defined as:
d e n s i t y i r = j r O S i j n u m ( r )
where j r O S i j denotes the sum of the overall similarity between the target firm i and the relevant firm j with the previous evaluation rating r. n u m ( r ) means the number of relevant firms that have been rated r in the previous evaluation. d e n s i t y i r indicates the density for the rating r of the target firm i. We finally generate the distribution and the descriptive statistics for the density as reference information. The density shows the sum of the similarities between the target firm and the relevant firms for each rating level. The evaluator will be able to see the distribution of the evaluation results given to the relevant firms that are similar to the target firm in terms of internal and external structures by being provided with the graphical and summarized statistical form of the reference information.

5. Illustration

5.1. Peer Group Creation

To illustrate the process of generating reference information, we conduct a case study by selecting one target firm. The basic information of the target firm is shown in Table 2. In this step, we create a peer group for the target firm by selecting the relevant firms with similarities to the target firm. The peer group creation is done through two filtering phases: industrial classification code-based and internal and external similarity-based. First, since the firm is classified under the ISIC code 58, we list only those firms classified under the same code. We then add other firms that have similarities to the target firm in terms of internal and external structures to the list. From the perspective of internal structure, the target firm’s type is corporate, so corporate firms are selected. From the perspective of external structure, firms that have trade relations with the target firm’s creditors or debtors are chosen. Through these two filtering phases, we found 1520 relevant firms, some of which are summarized in Table 3. We create a peer group for the target firm by grouping these relevant firms. Note that the features selected in this study to model firms’ internal and external structures reflect only the characteristics of the firms, and not those of the technologies that the firms possess. This is because these features are designed solely for the purpose of measuring the similarity between firms. It means that these features can contribute only to the creation of a peer group by grouping relevant firms with similar characteristics to the target firm from the perspective of the firms’ structures. The synthesis of the previous evaluation results of the relevant firms belonging to the peer group leads to the generation of reference information. The generated reference information can be used when processing a new technology evaluation for the target firm. Consequently, the reference information can play a pivotal role in providing the evaluators with a clear guidance that can help in the evaluation work so as to improve the consistency and reliability of the manual work.

5.2. Firm Similarity Measurement

This step measures the internal and external similarities between the target firm and the relevant firms in the peer group created in the previous step. IS, which denotes the internal similarity, is obtained by constructing vectors that are related to the elements of the size data, including the number of employees, gross sales, and total capital, and by calculating the Bray–Curtis dissimilarities between the vectors. However, these firm size-related data have very different variances, so we normalize each element before calculating the dissimilarities. ES, which represents the external similarity, is obtained by constructing vectors using the business trade relations including sales and purchases, and by measuring the vector similarities in the same way as calculating the IS. Since the business trade relations are divided into two types—sales and purchases—we calculate the vector similarities independently from each relation, and then calculate their average. ES_sale, the external similarity in the sales relation, is measured based on the vectors with elements of the amount of main sales for each debtor, and ES_purc, the external similarity in the purchases relation, is calculated based on the vectors with elements of the amount of main purchases for each creditor. Finally, OS, the overall similarity, is obtained by calculating the average of these internal and external similarities. However, the number of firms with internal similarity is generally much larger than the number of firms with external similarity, so simply calculating their average can lead to mainly reflect the aspect of internal similarity. To remedy this problem, we normalize each of these, and calculate the average value to finally produce the OS values. Table 4 shows the obtained similarities between the target firm and the relevant firms using this approach. In addition, the previous evaluation results of the relevant firms are also described in the table. Note that the ES_sale values are all zero, which means that the relevant firms with high overall similarity do not have any commonality with the target firm in the sales relation.
We define and use similarity measure indicators from the viewpoint of internal and external structures to create a peer group. Moreover, in terms of external structure, we define external similarity by combining sale and purchase relations, which are the main factors in trade relations. Therefore, it is necessary to confirm that these indicators do not have interrelations. If interrelations exist between them, it becomes impossible to merely combine them under the assumption that they are independent. So, we want to see if there are problems with possible correlations. In addition to this, we will also examine the correlations between them and the other indicators used in the current approaches. Table 5 shows the Pearson’s correlation coefficients. There is no significant correlation between the indicators used in the proposed approach. Note that there is a positive correlation between the internal similarity indicator and the current indicator based on the industry categorization. It can be presumed that the firm sizes of firms classified in the same industry categories are generally similar.

5.3. Reference Information Generation

In this step, the similarity of the relevant firms obtained in the previous step and the number of firms by each KTRS rating are combined to generate density as reference information, which will be referred to for our evaluation of the target firm. The reference information generated by this study consists of two types, including the distribution and the descriptive statistics for the density. Figure 4 shows the distribution of the density, with the density ratings of A and AA being the highest. The target firm’s previous evaluation result (KTRS rating) was A, and in light of this, the generated density information can be seen as quite reasonable. Table 6 shows the summary of descriptive statistics for the reference information after assigning the highest rating, AAA, to 10, and the lowest rating, D, to 1. The minimum, maximum, median, and average values are 4, 9, 8, and 7.374, respectively. A box plot using the density data is depicted in Figure 5. These types of reference information allow the evaluators to identify what evaluation ratings the relevant firms in the peer group have previously received. The reference information can provide the evaluators with a clear guidance that can help in the evaluation work, so as to improve the consistency and reliability of the manual work, since it would be able to reduce the difference in the evaluation results due to the individual differences of the evaluators.
Figure 6 shows the results of generating the density distribution for the target firm using the peer group creation approaches that are currently used in KOTEC. The current approaches consider the firms classified in the same industry or technology categories as the target firm as relevant firms, and create a peer group by grouping the relevant firms. Therefore, we set the similarity values of the relevant firms and the remaining firms to 1 and 0, respectively, and then generate a density distribution by averaging the two density values by ISIC and technology classification codes. Unlike the results of the proposed approach, the density value is the highest, at the rating AA. As mentioned above, the target firm’s previous evaluation result was A, and in light of this, it can be concluded that the proposed approach is far more reasonable than the current approaches.
The technology evaluation is mainly based on the evaluator’s manual work, which tends to cause the difference in the evaluation results due to the individual differences of the evaluators. Therefore, it is very important to provide the evaluators with guidance that can help in the evaluation work, so as to improve the consistency and reliability of the manual work. The reference information generated by the method presented in this study can serve as a clear guidance. It can allow the evaluators to easily identify the trends in the previous evaluation results of the relevant firms.

6. Discussion

External information, such as technology and market trends, as well as internal information about technology itself, is generally used together in the technology evaluation. KOTEC has also been actively utilizing the previous evaluation results of the relevant firms as reference information when conducting a new evaluation [61]. To generate such reference information, KOTEC has simply created a peer group by grouping firms that belong to the same industry or technology sector. However, it has limitations in that it does not explore the detailed features of the individual firms. This study proposed a novel approach to define peer groups using the structural similarity between firms and generating the reference information. To examine the feasibility of the proposed approach, we now investigate how the reference information for a target firm generated by our approach explains the actual evaluation results of the firm. The total number of technology evaluation cases used in this feasibility verification process is 738. We compare the reference information generated by the proposed approach and current approaches with the actual evaluation results. The performance comparison results are shown in Table 7. In terms of accuracy and macro-averaged and micro-averaged f1 scores, the proposed approach appears to have a slightly better performance than the current approaches. Note that the purpose of our approach and the previous approaches currently used in KOTEC is never to predict the evaluation results. The reference information generated by the approaches use only the previous evaluation results of relevant firms. It should not be used as an evaluation result, because the technology evaluation requires a consideration of various factors. We only want to compare our approach with the current approaches using several performance measurement metrics. In this sense, we can conclude that the approach proposed in this study has better performance than the reference information generation model currently used in the KOTEC.
This study proposes an approach to generate reference information in a quantitative way so that the qualitative evaluation based on manual work can be done more efficiently and consistently. Therefore, in order for this study to have a contribution from a practical perspective, a system implementation of the proposed approach should be made. Of course, the system implementation is beyond the scope of this study, but we would like to discuss the conceptual design of this system implementation. Basically, it should be preceded by a built database that includes the firm size and trade relation data along with the basic information about the firms that have already been evaluated. All of the corresponding data of a target firm that is the subject of a new evaluation is used as input data. This input data is combined with the data of the database and processed through the following three steps. First, the system creates a peer group that includes only a list of firms based on two filtering phases: industrial classification code-based and internal and external similarity-based. Second, it measures the similarity between the target firm and the relevant firms. Since this measurement is based on calculating the vector similarity, the data is transformed into a vector form. Finally, it generates reference information using the concept of density. The final outputs include the density distribution, the descriptive statistics for the density, and the box plot using the density data. The final outputs as reference information in the graphical and summarized statistical form can allow the evaluators to view various information that is related to the previous evaluation results of the relevant firms.

7. Conclusions

For a successful execution of the technology financing system, it is absolutely essential to have a clear system for the technology evaluation. Its evaluation target is not only the technology itself, but also the firm that is the subject of the commercialization of the technology, since the technology-based organizational capabilities also have a great influence on determining the value of the technology. The technology evaluation work is generally carried out by a combination of quantitative evaluation based on the quantified data, and qualitative evaluation performed by the relevant experts. However, the qualitative evaluation based on manual work tends to cause the evaluation results to vary depending on the tendencies of the individual evaluators. To improve the consistency and reliability of the manual work, technology evaluation institutes, including the KOTEC, have usually generated reference information and provided guidance to the evaluators using the information. However, the approaches that are currently used have limitations in that they cannot explore the detailed features of the individual firms when creating peer groups. This causes the previous evaluation results of relevant firms in the peer group to not be well used as reference information in the new evaluation. To remedy this problem, this study proposed a systematic approach to generate reference information to facilitate efficient technology evaluation. We first created a peer group by collecting the relevant firms that have similarities with a certain target firm, which is the subject of a new evaluation, and then measured the internal and external similarities between the target firm and all of the the firms included in the peer group. From this, we can generate the reference information by combining the similarity values of the relevant firms in the peer group and their previous evaluation results. A commonly used method for this purpose is to calculate the weighted average of the similarities. However, this method generally tends to produce almost similar results every time, since most of the previous evaluation results are limited to a narrow range of evaluation ratings. Therefore, this study defines the average value of similarities according to each evaluation rating as density, and finally generates the distribution and the descriptive statistics for the density as reference information. We expect that this study can contribute to improving the efficiency of qualitative technology evaluation work by providing practical reference information. Furthermore, the reliability of the technology evaluation will also be improved by reducing the difference in the qualitative evaluation results due to the individual differences of the evaluator.
Firms have generally been concentrating their efforts to acquire and utilize various technologies to secure a sustainable competitive advantage and win the global competition. In terms of technology acquisition, they are actively exploiting open innovation to identify and acquire external technologies. To carry out these identification and acquisition activities properly, an efficient technology evaluation system is indispensable. In terms of technology utilization, firms are seeking the support of technology finance to secure the necessary funds for technology commercialization in a timely manner. The demand for the vitalization of a technology financial support system also requires an efficient technology evaluation system. We found that the proposed method of generating reference information is useful and practical in supporting technology evaluation activities compared to the current methods. It is expected that the proposed method will be able to improve the efficiency of these activities, which are mainly conducted manually by relevant experts. Therefore, we believe that this study can contribute to enabling firms to secure sustainable competitive advantages and pursue sustainable growth, as it has provided the basis for supporting the process of acquiring and utilizing technology. Furthermore, beyond the perspective of individual firms, in order to strengthen the competitiveness of local societies, it is necessary to create a system that enables firms in the societies to actively exploit open innovation. To do this, various strategic policies are needed to support technology transfer among firms, universities, and research institutes. These policies should include a variety of activities that support the whole procedure of technology assessment. Examples of these activities include the establishment of a mechanism for the technology market, the development of practical technology marketing initiatives such as technology auctions, and the provision of de facto standards for technology evaluation procedures. Although the scope of this study is limited to a specific approach, which is very narrow, the combination of diverse studies on technology evaluation will ultimately contribute directly or indirectly to innovation performance through open innovation in local systems as well as individual firms.
Despite this contribution, further research issues still remain to be examined. First, we only considered the firms’ structural similarities when creating a peer group. However, since the ultimate evaluation target is technology, it is necessary to additionally consider the similarity in terms of technological properties. It can be implemented by collecting technology descriptions from patent documents and applying Document-to-Vector (Doc2Vec) to the collection of descriptions, which can lead us to determine the degree of similarity between technological descriptions. Second, when measuring the structural similarities between firms, we used only very limited data, such as size and trade relation data. We need to design more precise measures to assess the firms’ structural similarities. We will be able to make progress in this problem by fully utilizing the financial database of domestic firms. Third, we used the Bray–Curtis dissimilarity index to calculate the vector similarity, since it can be easily used as a weight value in that it is confined to the range from 0 to 1. There are numerous indices that are available for measuring the similarity, including the Minkowski distance and Canberra distance, so more efforts should be made to measure the similarity precisely by utilizing them in a complex and convergent way. Finally, we used indicators based on quantitative data, including enterprise size data and trade relation data, to create a peer group in a quantitative way. However, to examine the detailed features of individual firms further, the processes that reflect the intangible aspects, including corporate culture and corporate foresight maturity, will have to be further investigated.

Author Contributions

All authors conceived the research idea and approach of this study; E.K. and W.S. conceived and designed the experiments; Y.S.O. and S.-J.S. analyzed the data; E.K. and Y.S.O. carried out the performance comparisons; E.K., S.-J.S. and W.S. wrote the paper.

Funding

This research was supported by the Technology Innovation Program (Graduate School of Management of Technology) funded by the Ministry of Trade, Industry and Energy (N0001613).

Conflicts of Interest

The authors declare no conflict of interest.

References

  1. Grant, R.M. Toward a knowledge-based theory of the firm. Strateg. Manag. J. 1996, 17, 109–122. [Google Scholar] [CrossRef]
  2. Park, S.; Lee, S.-J.; Jun, S. A network analysis model for selecting sustainable technology. Sustainability 2015, 7, 13126–13141. [Google Scholar] [CrossRef]
  3. Yu, C.; Zhang, Z.; Lin, C.; Wu, Y.J. Knowledge creation process and sustainable competitive advantage: The role of technological innovation capabilities. Sustainability 2017, 9, 2280. [Google Scholar] [CrossRef]
  4. Lin, H.-P.; Hu, T.-S. Knowledge interaction and spatial dynamics in industrial districts. Sustainability 2017, 9, 1421. [Google Scholar] [CrossRef]
  5. Zhu, H.; Chen, K.W.; Dai, J. Beyond apprenticeship: Knowledge brokers and sustainability of apprentice-based clusters. Sustainability 2016, 8, 1279. [Google Scholar] [CrossRef]
  6. Martins, J.T. Relational capabilities to leverage new knowledge: Managing directors’ perceptions in UK and portugal old industrial regions. Learn. Organ. 2016, 23, 398–414. [Google Scholar] [CrossRef]
  7. Centobelli, P.; Cerchione, R.; Esposito, E. How to deal with knowledge management misalignment: A taxonomy based on a 3D fuzzy methodology. J. Knowl. Manag. 2018, 22, 538–566. [Google Scholar] [CrossRef]
  8. Bagnoli, C.; Giachetti, C. Aligning knowledge strategy and competitive strategy in small firms. J. Bus. Econ. Manag. 2015, 16, 571–598. [Google Scholar] [CrossRef]
  9. Bassi, L.J. Harnessing the power of intellectual capital. Train. Dev. 1997, 51, 25–31. [Google Scholar]
  10. Bismuth, A.; Tojo, Y. Creating value from intellectual assets. J. Intellect. Cap. 2008, 9, 228–245. [Google Scholar] [CrossRef]
  11. Shangzhen, L.I. A literature review of technology and finance. Can. Soc. Sci. 2015, 11, 89–93. [Google Scholar]
  12. Trang, D.T.V. Experiences of green credit development—Lessons learned to vietnam. Rev. Bus. Econ. Stud. 2016, 4, 85–91. [Google Scholar]
  13. Choi, S.; Noh, M.S.; Yoon, J.; Park, H.; Seo, W. Analyzing technological spillover effects between technology classes: The case of korea technology finance corporation. IEEE Access 2018, 6, 3573–3584. [Google Scholar] [CrossRef]
  14. Wonglimpiyarat, J. Management and governance of venture capital: A challenge for commercial bank. Technovation 2007, 27, 721–731. [Google Scholar] [CrossRef]
  15. Kobayashi, H.; Kato, M.; Maezawa, Y.; Sano, K. An R&D management framework for eco-technology. Sustainability 2011, 3, 1282–1301. [Google Scholar]
  16. Wonglimpiyarat, J. Technology financing toward effective economies In Technology Financing and Commercialization; Palgrave Macmillan: London, UK, 2015; pp. 239–256. [Google Scholar]
  17. Sufi, A. Information asymmetry and financing arrangements: Evidence from syndicated loans. J. Financ. 2007, 62, 629–668. [Google Scholar] [CrossRef]
  18. North, D.; Baldock, R.; Ullah, F. Funding the growth of uk technology-based small firms since the financial crash: Are there breakages in the finance escalator? Ventur. Cap. 2013, 15, 237–260. [Google Scholar] [CrossRef]
  19. Kassicieh, S.; Ahluwalia, S.; Majadillas, M.A. Financial analysis in management of technology programs: Links in a clinical approach. Technol. Forecast. Soc. Chang. 2015, 100, 66–77. [Google Scholar] [CrossRef]
  20. Abereijo, I.O.; Fayomi, A.O. Innovative approach to SME financing in Nigeria: A review of small and medium industries equity investment scheme (SMIEIS). J. Soc. Sci. 2005, 11, 219–227. [Google Scholar] [CrossRef]
  21. Lee, S.H.; Lim, E.-S.; Hwang, J. Do credit guarantees for small and medium enterprises mitigate the business cycle? Evidence from korea. Empir. Econ. 2017, 52, 1367–1378. [Google Scholar] [CrossRef]
  22. Noh, H.; Seo, J.-H.; Yoo, H.S.; Lee, S. How to improve a technology evaluation model: A data-driven approach. Technovation 2018, 72–73, 1–12. [Google Scholar] [CrossRef]
  23. Shen, Y.-C.; Chang, S.-H.; Lin, G.T.R.; Yu, H.-C. A hybrid selection model for emerging technology. Technol. Forecast. Soc. Chang. 2010, 77, 151–166. [Google Scholar] [CrossRef]
  24. Yu, P.; Lee, J.H. A hybrid approach using two-level SOM and combined AHP rating and AHP/DEA-AR method for selecting optimal promising emerging technology. Expert Syst. Appl. 2013, 40, 300–314. [Google Scholar] [CrossRef]
  25. Jun, S.; Park, S.; Jang, D. A technology valuation model using quantitative patent analysis: A case study of technology transfer in big data marketing. Emerg. Mark. Financ. Trade 2015, 51, 963–974. [Google Scholar] [CrossRef]
  26. Wortley, S.; Tong, A.; Lancsar, E.; Salkeld, G.; Howard, K. Public preferences for engagement in Health Technology Assessment decision-making: Protocol of a mixed methods study. BMC Med. Inform. Decis. Mak. 2015, 15, 52. [Google Scholar] [CrossRef] [PubMed]
  27. Chiu, Y.-J.; Chen, Y.-W. Using ahp in patent valuation. Math. Comput. Model. 2007, 46, 1054–1062. [Google Scholar] [CrossRef]
  28. Kim, S.K.; Lee, B.G.; Park, B.S.; Oh, K.S. The effect of R&D, technology commercialization capabilities and innovation performance. Technol. Econ. Dev. Econ. 2011, 17, 563–578. [Google Scholar]
  29. Caves, R.E.; Porter, M.E. From entry barriers to mobility barriers: Conjectural decisions and contrived deterrence to new competition. Q. J. Econ. 1977, 91, 241–261. [Google Scholar] [CrossRef]
  30. Chen, M.-J. Competitor analysis and interfirm rivalry: Toward a theoretical integration. Acad. Manag. Rev. 1996, 21, 100–134. [Google Scholar] [CrossRef]
  31. Fuentelsaz, L.; Gómez, J. Multipoint competition, strategic similarity and entry into geographic markets. Strateg. Manag. J. 2006, 27, 477–499. [Google Scholar] [CrossRef]
  32. D’Aveni, R.A.; Dagnino, G.B.; Smith, K.G. The age of temporary advantage. Strateg. Manag. J. 2010, 31, 1371–1385. [Google Scholar] [CrossRef]
  33. Belderbos, R.; Olffen, W.V.; Zou, J. Generic and specific social learning mechanisms in foreign entry location choice. Strateg. Manag. J. 2011, 32, 1309–1330. [Google Scholar] [CrossRef]
  34. Brennan, N.; Connell, B. Intellectual capital: Current issues and policy implications. J. Intellect. Cap. 2000, 1, 206–240. [Google Scholar] [CrossRef]
  35. Lin, C.; Ma, Y.; Su, D. Corporate governance and firm efficiency: Evidence from China’s publicly listed firms. Manag. Decis. Econ. 2009, 30, 193–209. [Google Scholar] [CrossRef] [Green Version]
  36. Su, D.; Dai, J. A stochastic frontier analysis of firm efficiency in China. Afr. J. Bus. Manag. 2012, 6, 11254–11265. [Google Scholar]
  37. McDonald, M.; Millman, T.; Rogers, B. Key account management: Theory, practice and challenges. J. Mark. Manag. 1997, 13, 737–757. [Google Scholar] [CrossRef]
  38. Coates, J.F. What is technology assessment. Impact Assess. 1982, 1, 20–24. [Google Scholar] [CrossRef]
  39. Braun, E. Technology in Context: Technology Assessment for Managers; Routledge: London, UK, 1998. [Google Scholar]
  40. Nazarko, Ł. Future-oriented technology assessment. Procedia Eng. 2017, 182, 504–509. [Google Scholar] [CrossRef]
  41. Coates, J.F. Technology-assessment-tool kit. Chemtech 1976, 6, 372–383. [Google Scholar]
  42. Banta, D. What is technology assessment? Int. J. Technol. Assess. Health Care 2009, 25 (Suppl. 1), 7–9. [Google Scholar] [CrossRef] [PubMed]
  43. Ko, N.; Yoon, J.; Seo, W. Analyzing interdisciplinarity of technology fusion using knowledge flows of patents. Expert Syst. Appl. 2014, 41, 1955–1963. [Google Scholar] [CrossRef]
  44. Seo, W.; Yoon, J.; Park, H.; Coh, B.-Y.; Lee, J.-M.; Kwon, O.-J. Product opportunity identification based on internal capabilities using text mining and association rule mining. Technol. Forecast. Soc. Chang. 2016, 105, 94–104. [Google Scholar] [CrossRef]
  45. Grimaldi, M.; Cricelli, L.; Giovanni, M.D.; Rogo, F. The patent portfolio value analysis: A new framework to leverage patent information for strategic technology planning. Technol. Forecast. Soc. Chang. 2015, 94, 286–302. [Google Scholar] [CrossRef]
  46. Roure, J.B.; Keeley, R.H. Predictors of success in new technology based ventures. J. Bus. Ventur. 1990, 5, 201–220. [Google Scholar] [CrossRef]
  47. Estep, J.; Daim, T. A framework for technology transfer potential assessment. In Proceedings of the Portland International Conference on Management of Engineering and Technology (PICMET), Honolulu, HI, USA, 4–8 September 2016; IEEE: Piscataway, NJ, USA, 2016. [Google Scholar]
  48. Benjamin, C.O. A framework for evaluating new technologies. Int. J. Technol. Transf. Commer. 2006, 5, 181–194. [Google Scholar] [CrossRef]
  49. Baek, D.-H.; Sul, W.; Hong, K.-P.; Kim, H. A technology valuation model to support technology transfer negotiations. R D Manag. 2007, 37, 123–138. [Google Scholar] [CrossRef] [Green Version]
  50. Sohn, S.Y.; Kim, H.S.; Moon, T.H. Predicting the financial performance index of technology fund for sme using structural equation model. Expert Syst. Appl. 2007, 32, 890–898. [Google Scholar] [CrossRef]
  51. Van Zee, R.D.; Spinler, S. Real option valuation of public sector R&D investments with a down-and-out barrier option. Technovation 2014, 34, 477–484. [Google Scholar]
  52. Wang, J.; Wang, C.-Y.; Wu, C.-Y. A real options framework for R&D planning in technology-based firms. J. Eng. Technol. Manag. 2015, 35, 93–114. [Google Scholar]
  53. Daim, T.; Yates, D.; Peng, Y.; Jimenez, B. Technology assessment for clean energy technologies: The case of the pacific northwest. Technol. Soc. 2009, 31, 232–243. [Google Scholar] [CrossRef]
  54. Hsu, Y.-L.; Lee, C.-H.; Kreng, V.B. The application of fuzzy delphi method and fuzzy ahp in lubricant regenerative technology selection. Expert Syst. Appl. 2010, 37, 419–425. [Google Scholar] [CrossRef]
  55. Kalbar, P.P.; Karmakar, S.; Asolekar, S.R. Selection of an appropriate wastewater treatment technology: A scenario-based multiple-attribute decision-making approach. J. Environ. Manag. 2012, 113, 158–169. [Google Scholar] [CrossRef] [PubMed]
  56. Lee, S.; Kim, W.; Kim, Y.M.; Lee, H.Y.; Oh, K.J. The prioritization and verification of it emerging technologies using an analytic hierarchy process and cluster analysis. Technol. Forecast. Soc. Chang. 2014, 87, 292–304. [Google Scholar] [CrossRef]
  57. Sohn, S.Y.; Moon, T.H.; Kim, S. Improved technology scoring model for credit guarantee fund. Expert Syst. Appl. 2005, 28, 327–331. [Google Scholar] [CrossRef]
  58. Hernández Pardo, R.J.; Bhamra, T.; Bhamra, R. Sustainable product service systems in small and medium enterprises (SMEs): Opportunities in the leather manufacturing industry. Sustainability 2012, 4, 175–192. [Google Scholar] [CrossRef] [Green Version]
  59. Halicka, K. The reference methodology of prospective analysis of technology in production engineering. In Proceedings of the 8th International Conference on Engineering, Project, and Product Management (EPPM 2017), Amman, Jordan, 20–22 September 2017; Springer: Cham, Switzerland, 2017; pp. 99–107. [Google Scholar]
  60. Liu, Y.-J.; Liu, S.-J. The intellectual property policy of Taiwan: A strategic viewpoint. In Proceedings of the IEEE International Engineering Management Conference, Singapore, 18–21 October 2004; IEEE: Piscataway, NJ, USA, 2004; pp. 42–46. [Google Scholar]
  61. Ruskov, P.; Tsolova, S.; Panov, S. Model for technology adoption supporting system. In Proceedings of the International Scientific Conference—UNITECH, Gabrovo, Bulgaria, 18–19 November 2016. [Google Scholar]
  62. Ju, Y.; Sohn, S.Y. Technology credit scoring based on a quantification method. Sustainability 2017, 9, 1057. [Google Scholar] [CrossRef]
  63. Csaszar, F.A.; Siggelkow, N. How much to copy? Determinants of effective imitation breadth. Organ. Sci. 2010, 21, 661–676. [Google Scholar] [CrossRef]
  64. Peteraf, M.A. The cornerstones of competitive advantage: A resource-based view. Strateg. Manag. J. 1993, 14, 179–191. [Google Scholar] [CrossRef]
  65. Gimeno, J.; Woo, C.Y. Hypercompetition in a multimarket environment: The role of strategic similarity and multimarket contact in competitive de-escalation. Organ. Sci. 1996, 7, 322–341. [Google Scholar] [CrossRef]
  66. Zeng, M. Managing the cooperative dilemma of joint ventures: The role of structural factors. J. Int. Manag. 2003, 9, 95–113. [Google Scholar] [CrossRef]
  67. Zhang, Y.; Shang, L.; Huang, L.; Porter, A.L.; Zhang, G.; Lu, J.; Zhu, D. A hybrid similarity measure method for patent portfolio analysis. J. Inform. 2016, 10, 1108–1130. [Google Scholar] [CrossRef]
  68. Leydesdorff, L. On the normalization and visualization of author co-citation data: Salton’s cosine versus the jaccard index. J. Am. Soc. Inf. Sci. Technol. 2008, 59, 77–85. [Google Scholar] [CrossRef]
  69. Rohrbeck, R. Corporate Foresight: Towards a Maturity Model for the Future Orientation of a Firm; Physica-Verlag, Springer: Heidelberg, Germany, 2010. [Google Scholar]
  70. Rohrbeck, R.; Kum, M.E. Corporate foresight and its impact on firm performance: A longitudinal analysis. Technol. Forecast. Soc. Chang. 2018, 129, 105–116. [Google Scholar] [CrossRef]
  71. Park, S.H.; Ungson, G.R. The effect of national culture, organizational complementarity, and economic motivation on joint venture dissolution. Acad. Manag. J. 1997, 40, 279–307. [Google Scholar]
  72. Saxton, T. The effects of partner and relationship characteristics on alliance outcomes. Acad. Manag. J. 1997, 40, 443–461. [Google Scholar]
  73. Lee, G.K. Understanding the timing of ‘fast-second’ entry and the relevance of capabilities in invention vs. Commercialization. Res. Policy 2009, 38, 86–95. [Google Scholar] [CrossRef]
  74. Chen, F.; Li, F.; Meng, Q. Integration and autonomy in Chinese technology-sourcing cross-border M&As: From the perspective of resource similarity and resource complementarity. Technol. Anal. Strateg. Manag. 2017, 29, 1002–1014. [Google Scholar]
  75. Gong, B. Total-factor spillovers, similarities, and competitions in the petroleum industry. Energy Econ. 2018, 73, 228–238. [Google Scholar] [CrossRef]
  76. Signori, A.; Vismara, S. M&A synergies and trends in IPOs. Technol. Forecast. Soc. Chang. 2018, 127, 141–153. [Google Scholar]
  77. Wajeed, M.A.; Adilakshmi, T. Different similarity measures for text classification using KNN. In Proceedings of the 2nd International Conference on Computer and Communication Technology (ICCCT), Allahabad, India, 15–17 September 2011; IEEE: Piscataway, NJ, USA, 2011. [Google Scholar]
  78. Limberger, R.; Wickham, S.A. Disturbance and diversity at two spatial scales. Oecologia 2012, 168, 785–795. [Google Scholar] [CrossRef] [PubMed]
Figure 1. Procedural framework for generating reference information.
Sustainability 10 03200 g001
Figure 2. Procedural framework for generating reference information.
Sustainability 10 03200 g002
Figure 3. Process of creating a peer group based on two filtering phases.
Sustainability 10 03200 g003
Figure 4. Density distribution of relevant firms’ ratings using the proposed approach.
Sustainability 10 03200 g004
Figure 5. Box plot using density data.
Sustainability 10 03200 g005
Figure 6. Density distribution of relevant firms’ ratings using current approaches.
Sustainability 10 03200 g006
Table 1. Variables used to measure the firm similarity in previous studies. R&D: research and development.
Research PurposeFactors Used to Measure the Firm SimilarityReferences
Exploring the competition between firms with structural similarityInternal structure—R&D, advertising, cost structures[29]
Presenting a framework of competitor analysis considering resource similarity and market commonalityInternal structure—Industrial classification, products
External structure—Resources, customers (accounts)
[30]
Investigating the effects of strategic similarity on interfirm rivalryInternal structure—The number of times service performed
External structure—Market share, market density
[65]
Exploring the impact of the degree of firm similarity on interfirm collaborationInternal structure—Sales, organizational structure and process, business scopeExternal structure—Customers (accounts)[66,71,72]
Investigating the effect of similarity between firms‘ capabilities in invention and commercialization on timing of market entryInternal structure—The number of employees, R&D expenditure, return on assets, the number of product categories[73]
Examining the performance of technology innovation after technology-sourcing cross-border Mergers and Acquisitions (M&As) from the perspective of resource similarity and complementarityInternal structure—Industrial classification[74]
Investigating the effect of firm similarity on multi-dimensional competitions in the petroleum industryInternal structure—Output share of products
External structure—Output share of business segments and region
[75]
Measuring the potential M&A synergies based on text-based analysis of business similarityInternal structure—Products[76]
Table 2. Basic information of a target firm. ISIC: International Standard Industrial Classification, KTRS: Kibo Technology Rating System.
Firm IDISICFirm TypeNumber of EmployeesGross Sales (Million KRW)Total Capital (Million KRW)KTRS Rating
24892858Corporate3810,177400A
Table 3. Basic information of relevant firms in terms of internal and external structures.
Internal StructureExternal Structure
Firm IDFirm TypeNumber of EmployeesGross SalesTotal CapitalFirm IDNumber of Main CreditorsAmount of Main PurchasesNumer of Main DebtorsAmount of Main Sales
347396Corp.4110,1642002963423173955433
260847Corp.3411,7243003276955175792736
322389Corp.3813,9703003133233103991622
282356Corp.357243400351034--31119
150124Corp.4377273652643085113193666
253472Corp.385453400315926--71479
178440Corp.337703360331026477952680
226327Corp.4589256353166795328542
281998Corp.4381006252524055105054017
307142Corp.2710,367500302334--8541
Table 4. Similarity between target firm and relevant firms. OS: overall similarity.
Firm IDInternal Structure (IS)External Structure (ES)OSKTRS Rating
ISIS_norES_saleES_purcESES_nor
2963420.75490.79340.00000.39220.19611.00000.8967A
3510340.36290.38080.00000.26920.13460.68080.5308BBB
3473960.95121.00000.00000.00000.00000.00000.5000AA
2608470.92980.97750.00000.00000.00000.00000.4888A
3223890.92640.97400.00000.00000.00000.00000.4870AA
2823560.92230.96970.00000.00000.00000.00000.4848BBB
2643080.64880.68180.00000.11600.05800.28370.4827A
1501240.91600.96290.00000.00000.00000.00000.4815A
2534720.91290.95980.00000.00000.00000.00000.4799A
1784400.90790.95440.00000.00000.00000.00000.4772BBB
Table 5. Correlation coefficients between indicators used in the proposed approach and current approaches.
12345
1. IS1−0.0290.0190.604 *0.005
2. ES_sale 1−0.003−0.011−0.006
3. ES_purc 10.024−0.012
4. ISIC 10.109 *
5. Tech. code 1
* Statistically significant at the 0.01 level.
Table 6. Summary of descriptive statistics of reference information.
Number of Relevant FirmsMin.Max.Q1Q2Q3Avg.Stdev.
1520496897.37411.4393
Table 7. Comparison of performance of proposed approach and current approaches.
ApproachAccuracyMacro AverageMicro Average
PrecisionRecallF1 ScoreF1 Score
Proposed approach0.72360.82340.43060.56550.7236
Current approach (ISIC)0.63010.78290.34170.47580.6301
Current approach (Tech. code)0.65990.83220.41780.55630.6599

