Effects of Legal Designation and Management of a Multiple-Use Protected Area on Local Sustainability


Abstract
:1. Introduction
2. Materials and Methods
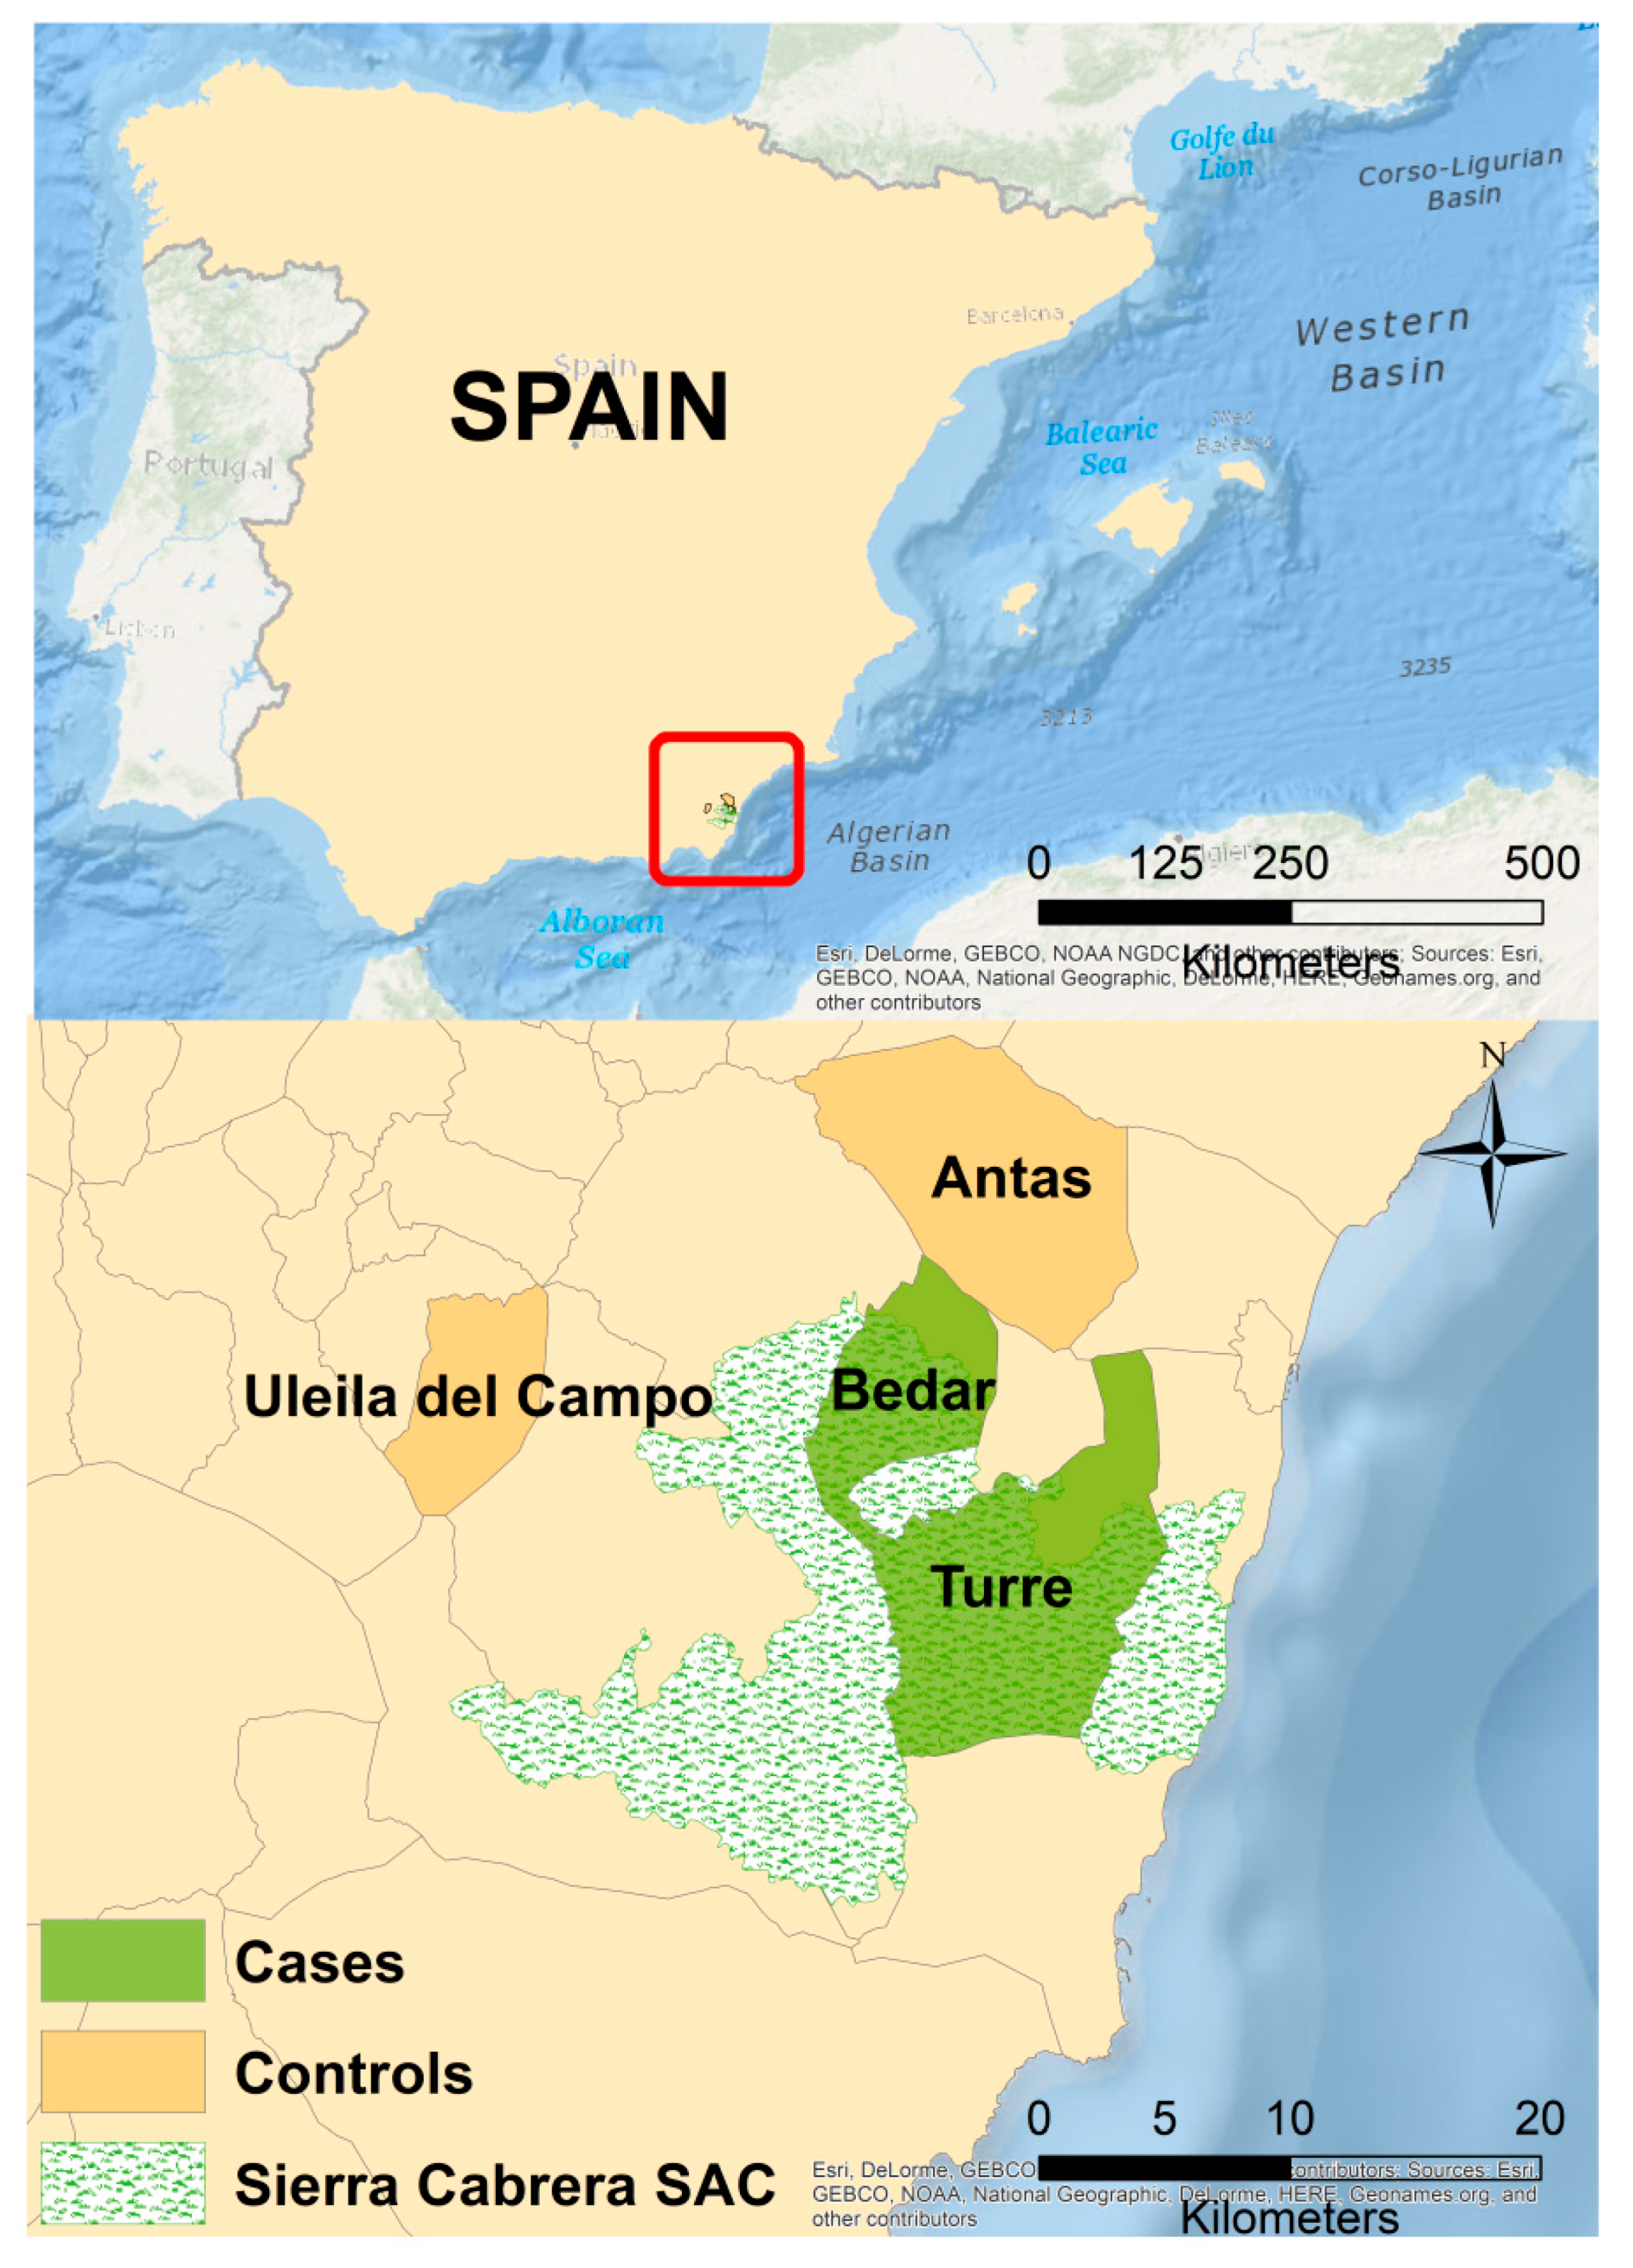
2.1. Study Area
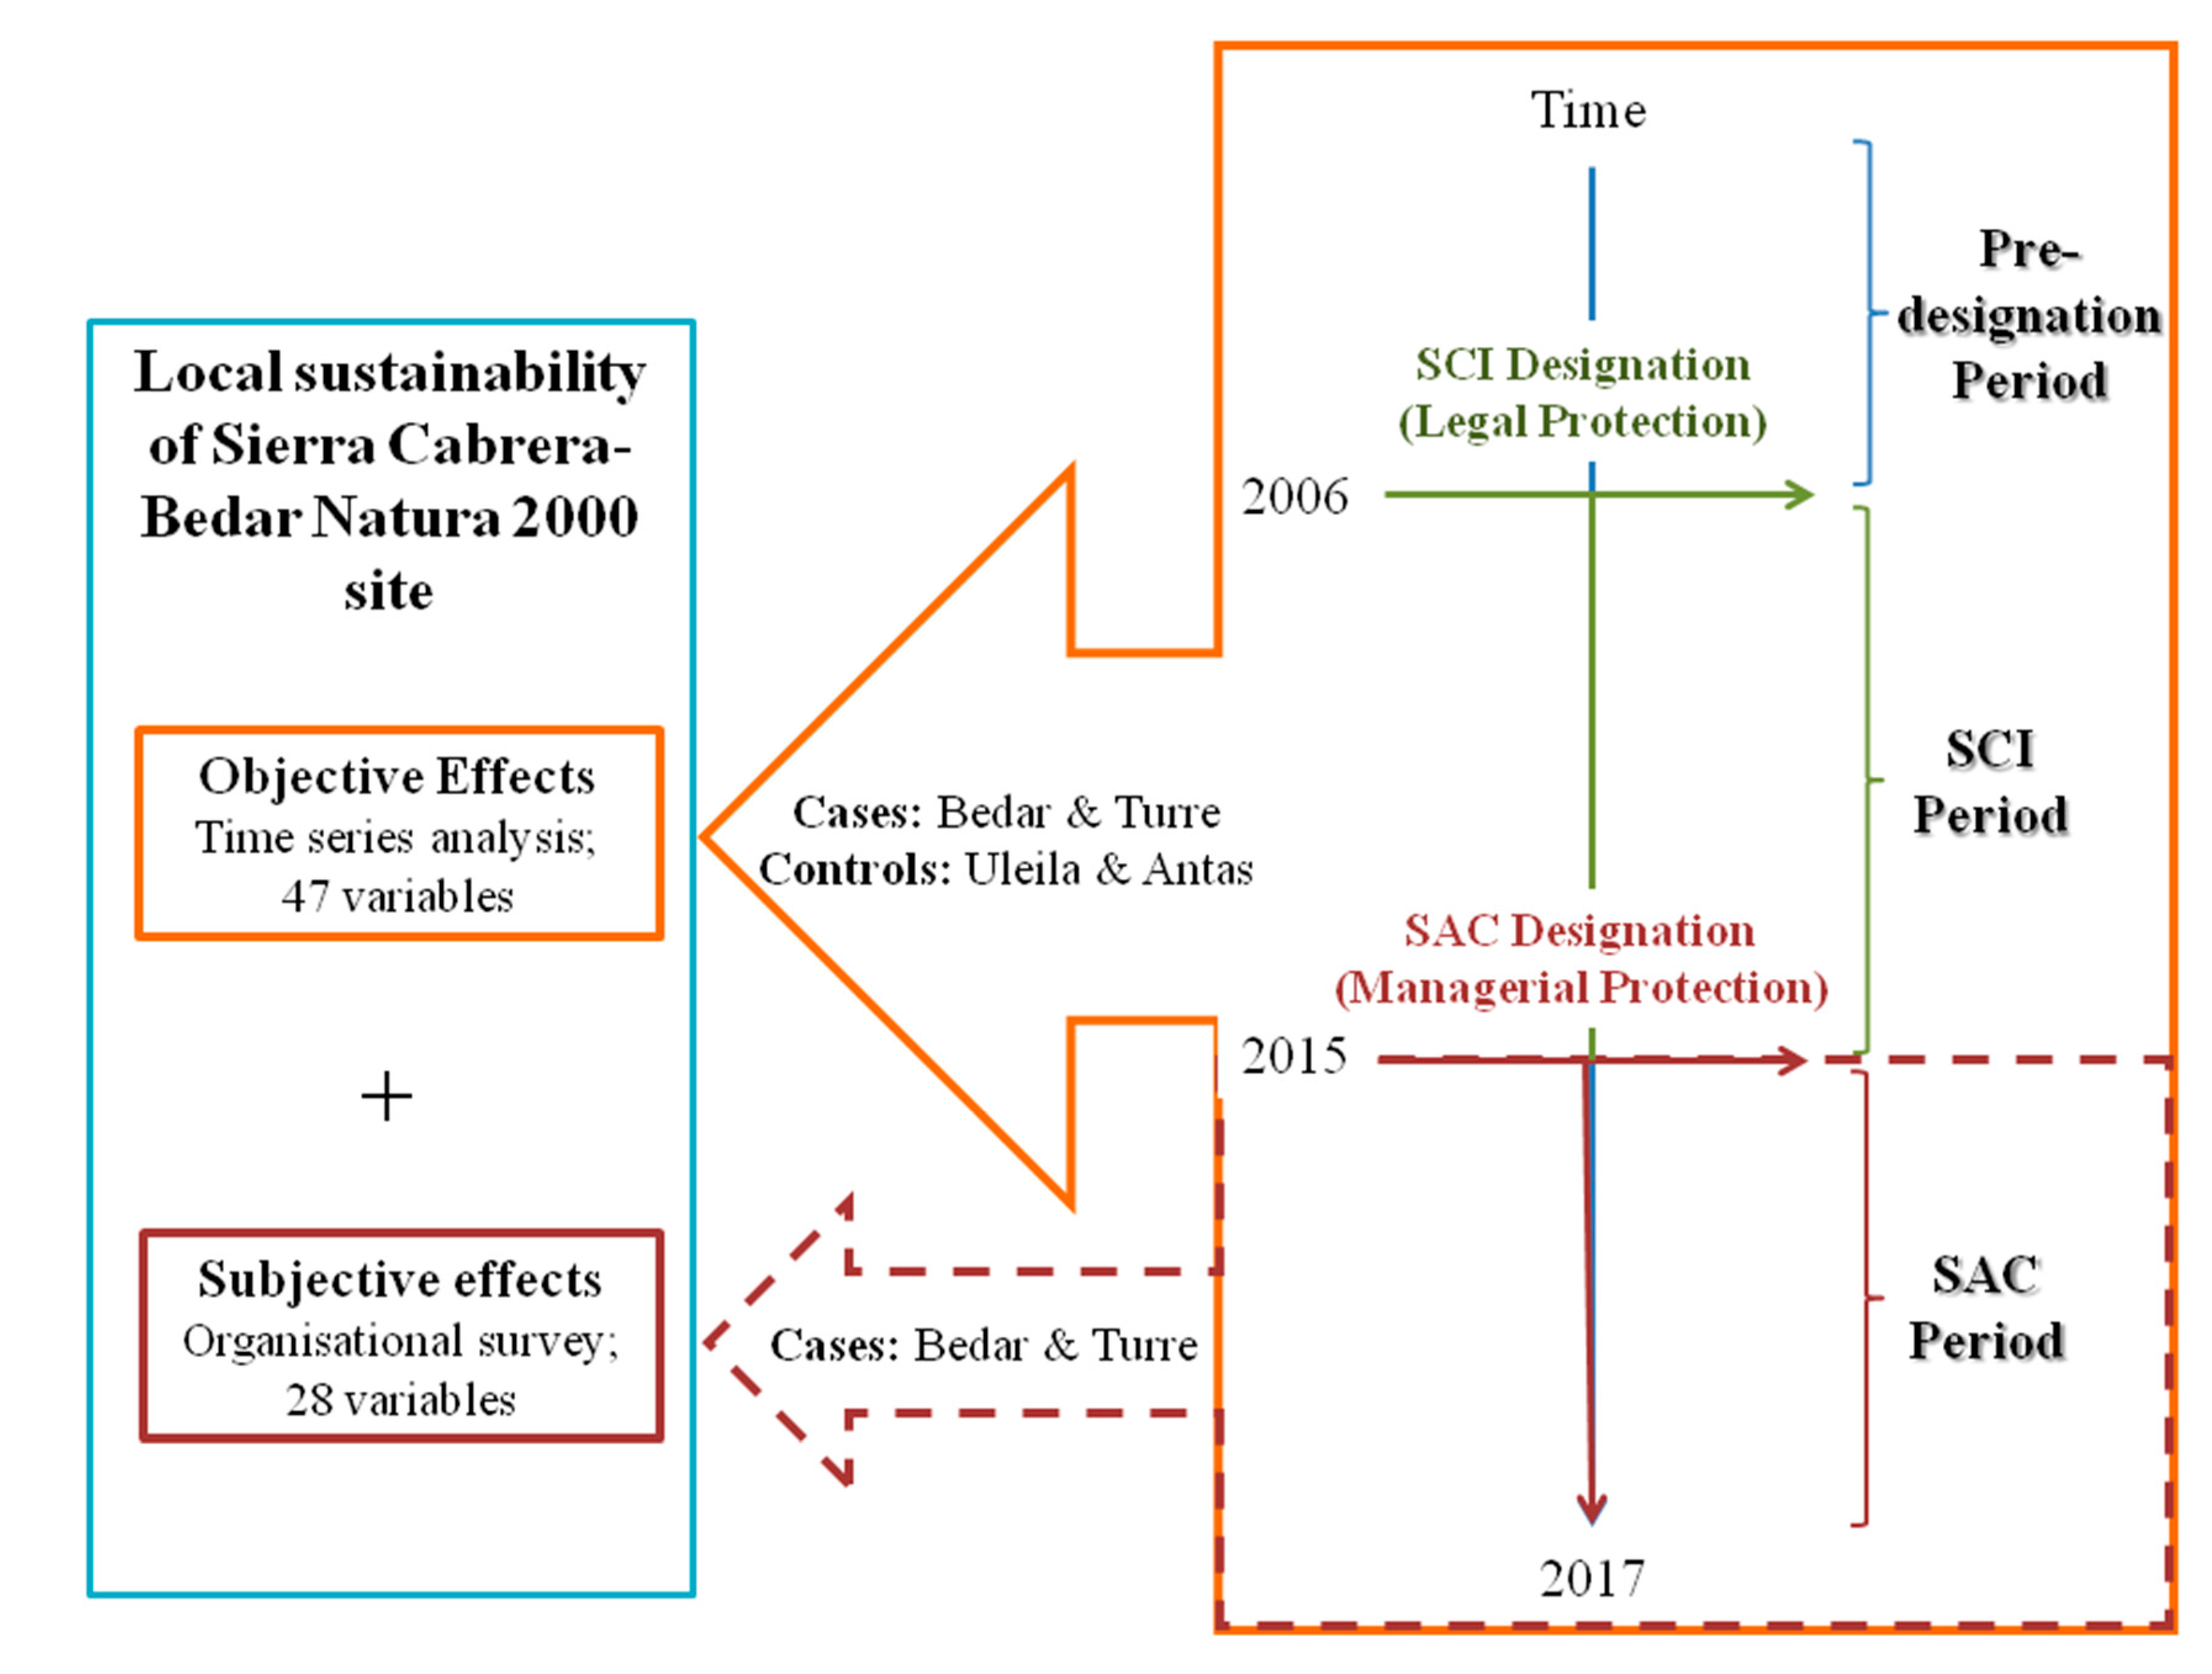
2.2. Common Methods
2.2.1. Time Series Analysis
2.2.2. Organisational Survey
3. Results
3.1. Time Series Results
3.2. Organisational Survey Results
3.2.1. Response Rate and Responding Organisations
3.2.2. Organisational Perception of the Effects of Sierra Cabrera-Bedar SAC Designation on Affected Municipalities
3.3. Degree of Agreement between Survey Results and Time Series’ Results
4. Discussion
4.1. Objective Effects: Time Series Analysis
4.2. Perceived Effects: Survey Analysis
4.3. Methodological Remarks
5. Conclusions
Supplementary Materials
Author Contributions
Funding
Acknowledgments
Conflicts of Interest
References
- Dudley, N. (Ed.) Guidelines for Applying Protected Area Management Categories; IUCN: Gland, Switzerland, 2008. [Google Scholar]
- Brooks, S.; Tolley, M.; Montes, C.; Jones, M.; Burguess, N.; Kingston, N.; Hutton, J. Protected Areas and the Extractive Industry: Challenges and Opportunities; UNEP-WCMC: Cambridge, UK, 2014. [Google Scholar]
- Rodríguez-Rodríguez, D.; Martínez-Vega, J. Protected area effectiveness against land development in Spain. J. Environ. Manag. 2018, 215, 345–357. [Google Scholar] [CrossRef] [PubMed] [Green Version]
- Hockings, M.; Stolton, S.; Leverington, F.; Dudley, N.; Courrau, J. Evaluating Effectiveness: A Framework for Assessing the Management of Protected Areas; IUCN: Gland, Switzerland; Cambridge, UK, 2006. [Google Scholar]
- Davis, M.; Naumann, S.; McFarland, K.; Graf, A.; Evans, D. Literature Review. The ecological Effectiveness of the Natura 2000 Network; ETC/BD Report to the EEA; EEA: Paris, France, 2014. [Google Scholar]
- Chaytor, B.; Gray, K.R. (Eds.) International Environmental Law and Policy in Africa; Kluwer Academic Publishers: Dordrecht, The Netherlands, 2003. [Google Scholar]
- Marzano, M.; Dandy, N.; Bayliss, H.R.; Porth, E.; Potter, C. Part of the solution? Stakeholder awareness, information and engagement in tree health issues. Biol. Invasions 2015, 17, 1961–1977. [Google Scholar] [CrossRef] [Green Version]
- Upton, C.; Ladle, R.; Hulme, D.; Jiang, T.; Brockington, D.; Adams, W.M. Are poverty and protected area establishment linked at a national scale? Orix 2008, 41, 19–25. [Google Scholar] [CrossRef]
- Andam, K.S.; Ferraro, P.J.; Sims, K.R.E.; Healy, A.; Holland, M.B. Protected areas reduce poverty in Costa Rica and Thailand. Proc. Natl. Acad. Sci. USA 2010, 107, 9996–10001. [Google Scholar] [CrossRef] [PubMed]
- Bennet, N.J.; Dearden, P. Why local people do not support conservation: Community perceptions of marine protected area livelihood impacts, governance and management in Thailand. Mar. Policy 2014, 44, 107–116. [Google Scholar] [CrossRef]
- Ferraro, P.J.; Pressey, R.L. Measuring the difference made by conservation initiatives: Protected areas and their environmental and social impacts. Philos. Trans. R. Soc. B 2015, 370, 20140270. [Google Scholar] [CrossRef] [PubMed]
- CBD, Convention on Biological Diversity (2010) Convention. Strategic Plan 2011–2020. Aichi Biodiversity Targets. Available online: https://www.cbd.int/sp/targets/ (accessed on 24 July 2018).
- Blicharska, M.; Orlikowska, E.H.; Roberge, J.-M.; Grozinska-Jurczak, M. Contribution of social science to large scale biodiversity conservation: A review of research about the Natura 2000 network. Biol. Conserv. 2016, 199, 110–122. [Google Scholar] [CrossRef]
- Schrekenberg, K.; Camargo, I.; Withnall, K.; Corrigan, C.; Franks, P.; Roe, D.; Scherl, L.M.; Richardson, V. Social Assessment of Conservation Initiatives: A Review of Rapid Methodologies; IIED: London, UK, 2010. [Google Scholar]
- Rodríguez-Rodríguez, D.; Rees, S.E.; Rodwell, L.D.; Attrill, M.J. IMPASEA: A methodological framework to monitor and assess the socioeconomic effects of marine protected areas. An English Channel case study. Environ. Sci. Policy 2015, 54, 44–51. [Google Scholar] [CrossRef]
- Franks, P.; Small, R. Social Assessment for Protected Areas (SAPA). Methodology Manual for SAPA Facilitators; IIED: London, UK, 2016. [Google Scholar]
- European Commission. Environment. Nature and Biodiversity. Natura 2000. 2018. Available online: http://ec.europa.eu/environment/nature/natura2000/index_en.htm (accessed on 1 August 2018).
- Ferranti, F.; Turnhout, E.; Beunen, R.; Behagel, J.H. Shifting nature conservation approaches in Natura 2000 and the implications for the roles of stakeholders. J. Environ. Plan. Manag. 2014, 57, 1642–1657. [Google Scholar] [CrossRef]
- Orlikowska, E.H.; Roberge, J.-M.; Blicharska, M.; Mikusinski, G. Gaps in ecological research on the world’s largest internationally coordinated network of protected areas: A review of Natura 2000. Biol. Conserv. 2016, 200, 216–227. [Google Scholar] [CrossRef]
- EEC, European Economic Community. Council Directive 92/43/EEC of 21 May 1992 on the Conservation of Natural Habitats and of Wild Fauna and Flora. 1992. Available online: http://eur-lex.europa.eu/legal-content/en/TXT/?uri=CELEX%3A31992L0043 (accessed on 1 August 2018).
- EEC, European Economic Community. Council Directive 79/409/EEC of 2 April 1979 on the Conservation of Wild Birds. 1979. Available online: https://eur-lex.europa.eu/legal-content/EN/TXT/HTML/?uri=LEGISSUM:l28046&from=EN (accessed on 1 August 2018).
- Médail, F.; Quézel, P. Biodiversity hotspots in the mediterranean basin: setting global conservation priorities. Conserv. Biol. 1999, 13, 1510–1513. [Google Scholar] [CrossRef]
- Andalusian Government. Información Ambiental. Espacios protegidos. Planificación en Espacios Protegidos. Documentos Aprobados. Almería. Plan de Gestión de la ZEC Sierra de Cabrera-Bédar (ES6110005). 2015. Available online: http://www.juntadeandalucia.es/medioambiente/portal_web/web/temas_ambientales/espacios_protegidos/planificacion/pg_aprobados/d_2_2015_oso/anexo2_2015_03_19_pg_cabrera.pdf (accessed on 1 August 2018).
- Spanish Government. Ley 42/2007, de 13 de diciembre, del Patrimonio Natural y de la Biodiversidad. Boletín Oficial del Estado 2007, 299, 51275–51327. [Google Scholar]
- Esteves, A.M.; Franks, D.; Vanclay, F. Social impact assessment: The state of the art. Impact Assess. Proj. A. 2012, 30, 34–42. [Google Scholar] [CrossRef]
- Bornmann, L. What is societal impact of research and how can it be assessed? A. literature survey. J. Am. Soc. Inf. Sci. Technol. 2013, 64, 217–233. [Google Scholar] [CrossRef]
- Jones, N.; McGinlay, J.; Dimitrakopoulos, P.G. Improving social impact assessment of protected areas: A review of the literature and directions for future research. Environ. Impact Assess. Rev. 2017, 64, 1–7. [Google Scholar] [CrossRef]
- Jiménez, L.M. (Director) Sostenibilidad en España, 2007; Observatorio de la Sostenibilidad en España: Alcalá de Henares, Spain, 2007.
- Addison, P. A Global Review of Long-Term Marine Protected Area Monitoring Programmes: The Application of a Good Framework to Marine Biological Monitoring. A Report Prepared for the Joint Nature Conservation Committee; Joint Nature Conservation Committee: Peterbourough, UK, 2011. Available online: http://jncc.defra.gov.uk/pdf/jncc455_Vol1_web.pdf (accessed on 1 August 2018).
- Andalusian Government. Sistema de Información Multiterritorial de Andalucía. Municipios. 2018. Available online: http://www.juntadeandalucia.es/institutodeestadisticaycartografia/iea/consultasActividad.jsp?CodOper=104&sub=38120 (accessed on 1 August 2018).
- UNIVERSIA. Guía de Empresas Españolas. 2016. Available online: https://guiaempresas.universia.es/ (accessed on 1 August 2018).
- Expansión. Directorio de Empresas. 2016. Available online: http://www.expansion.com/directorio-empresas.html (accessed on 1 August 2018).
- Dillman, D.A.; Christian, L.M.; Smyth, J.D. Internet, Phone, Mail, and Mixed-Mode Surveys: The Tailored Design Method, 4th ed.; Wiley: Hoboken, NJ, USA, 2015. [Google Scholar]
- De Sherbinin, A. Is poverty more acute near parks? An assessment on infant mortality rates around protected areas in developing countries. Oryx 2008, 42, 26–35. [Google Scholar]
- West, P.; Igoe, J.; Brockington, D. Parks and peoples: The social impact of protected areas. Annu. Rev. Anthropol. 2006, 35, 251–277. [Google Scholar] [CrossRef]
- Rodríguez-Rodríguez, D.; Martínez-Vega, J. Effect of legal protection and management of protected areas at preventing land development: A Spanish case study. Reg. Environ. Chang. 2018. [Google Scholar] [CrossRef]
- Lester, S.E.; Halpern, B.S. Biological responses in marine no-take reserves versus partially protected areas. Mar. Ecol. Prog. Ser. 2008, 367, 49–56. [Google Scholar] [CrossRef] [Green Version]
- Kati, V.; Hovardas, T.; Dieterich, M.; Ibisch, P.L.; Mihok, B.; Selva, N. The challenge of implementing the European network of protected areas Natura 2000. Conserv. Biol. 2015, 29, 260–270. [Google Scholar] [CrossRef] [PubMed] [Green Version]
- Borzel, T.A. Why there is no ‘southern problem’. On environmental leaders and laggards in the European Union. J. Eur. Public Policy 2000, 7, 141–162. [Google Scholar] [CrossRef]
- European Commission. Monitoring the Application of European Union law. Annual Report 2016. 2016. Available online: https://ec.europa.eu/info/sites/info/files/file_import/EU28_factsheet_2016_en_0.pdf (accessed on 1 August 2018).
- SEO-Birdlife. Indicadores de Gobernanza Ambiental en España. 2018. Available online: https://www.seo.org/wp-content/uploads/2018/07/Gobernanza-ambiental.interactivo_Def.pdf (accessed on 1 August 2018).
- GAN. Business Anti-Corruption Portal. Spain Corruption Report. 2018. Available online: https://www.business-anti-corruption.com/country-profiles/spain (accessed on 1 August 2018).
- Múgica, M.; Martínez, C.; Atauri, J.A.; Gómez-Limón, J.; Puertas, J.; García, D. EUROPARC-España. Anuario 2016 del Estado de las Áreas Protegidas en España; Fundación Fernando González Bernáldez: Madrid, Spain, 2017. [Google Scholar]
- Rodríguez-Rodríguez, D. Perception, use and valuation of protected areas by local populations in an economic crisis context. Environ. Conserv. 2012, 39, 162–171. [Google Scholar] [CrossRef]

| Municipality | In Protected Area | Type | Size (km2) | Population in 2016 | Forest Area (%) | Agricultural Area (%) | Closest Control-Case Distance (m) |
|---|---|---|---|---|---|---|---|
| Bédar | Yes | Case | 47 | 885 | 80.18 | 15.11 | |
| Uleila del Campo | No | Control | 38 | 871 | 49.31 | 45.73 | 10,500 (with Bédar) |
| Turre | Yes | Case | 108 | 3351 | 81.12 | 13.77 | |
| Antas | No | Control | 99 | 3159 | 59.78 | 29.51 | 0 (with Bédar) |
| Time Series Indicator (SAC Period) | Survey Indicator (SAC Period) |
|---|---|
| Population density | Number of residents |
| Population over 44 years old | Residents’ age |
| Number of public learning centres | Number of local education infrastructures |
| Electricity consumption | Residents’ environmental awareness |
| Number of public libraries | Local cultural, recreational and sport offer |
| Number of cinemas | Local cultural, recreational and sport offer |
| Number of public health centres | Number of local health infrastructures |
| Number of pharmacies | Number of local health infrastructures |
| Per head income | Residents’ income |
| Local council’s budget surplus | Local council’s budget |
| Local council’s per head income | Local council’s budget |
| Unemployment 1 | Local employment |
| Number of commercial establishments | Number of local enterprises and businesses |
| Number of enterprises | Number of local enterprises and businesses |
| Public transport vehicles | Number of local transport infrastructures |
| Beds in hotels | Local tourist activity |
| Beds in apartments | Local tourist activity |
| Beds in camps | Local tourist activity |
| Beds in rural guest houses | Local tourist activity |
| Sustainability Dimension | Indicator | Period | Relative Change of Cases Compared to Controls | Interpretation Regarding Sustainability |
|---|---|---|---|---|
| Environmental | Electricity consumption | SCI | Greater | Worse |
| Social | Immigrants | SCI | Fewer | Worse |
| Social | Foreigners | SCI | Fewer | Worse |
| Social | Young women | SCI | Fewer | Worse |
| Social | Health centres | SCI | Fewer | Worse |
| Economy | Hotel beds | SCI | Fewer | Worse |
| Environmental | Per head winter water consumption | SCI | Less | Better |
| Social | Population density | SCI | Greater | Better |
| Social | Public libraries | SCI | More | Better |
| Social | Mortality | SCI | Less | Better |
| Social | Selective waste containers | SCI | More | Better |
| Economy | Local council’s income | SCI | More | Better |
| Economy | Local council’s investment | SCI | More | Better |
| Social | Emigrants | SAC | More | Worse |
| Economy | Local council’s income | SAC | Less | Worse |
| Economy | Local council’s investment | SAC | Less | Worse |
| Economy | Unemployment | SAC | Less | Worse |
| Economy | New service enterprises | SAC | Fewer | Worse |
| Environmental | Electricity consumption | SAC | Less | Better |
| Social | Population over 44 years old (%) | SAC | Less | Better |
| Social | Immigrants | SAC | More | Better |
| Social | Public learning centres | SAC | More | Better |
| Social | Public libraries | SAC | More | Better |
| Social | Public health centres | SAC | More | Better |
| Economy | Per head net income | SAC | More | Better |
| Economy | Credit establishments | SAC | More | Better |
| Economy | Hospitality businesses | SAC | More | Better |
| Economy | Beds in hotels | SAC | More | Better |
| Economy | Beds in rural guesthouses | SAC | More | Better |
| Period | Environment | Society | Economy | |||
|---|---|---|---|---|---|---|
| SCI (n = 6) | SAC (n = 2) | SCI (n = 17) | SAC (n = 12) | SCI (n = 11) | SAC (n = 17) | |
| Variables where change was better in cases (%) | 50.00 | 100.00 | 41.20 | 58.30 | 36.40 | 47.10 |
| Variables where change was worse in cases (%) | 50.00 | 0.00 | 41.20 | 25.00 | 45.50 | 41.20 |
| Variables were change was equal to controls (%) | 0.00 | 0.00 | 17.60 | 16.70 | 18.20 | 11.80 |
| Organisation | Guild | Sector | Preliminary Stance on Protected Areas |
|---|---|---|---|
| Quesos Sierra de Bedar | Manufacturer | Secondary | Neutral |
| Construcciones y Reformas Índalo sl | Construction | Secondary | Negative |
| Arimet 1970 sl | Real state | Tertiary | Negative |
| SEPRONA | Ranger | Institutional | Positive |
| Turre Town Council | Governance | Institutional | Positive |
| Bedar Sostenible | Environmental NGO | Miscellaneous | Positive |
| Social Indicator | Mean | SD | CV |
|---|---|---|---|
| Residents’ environmental awareness | 0.50 | 0.55 | 109.54 |
| Number of local (non-commercial) associations | 0.50 | 0.55 | 109.54 |
| Local cultural. recreational and sport offer | 0.33 | 0.52 | 154.92 |
| Local traditions | 0.33 | 0.52 | 154.92 |
| Residents’ participation in local environmental decisions | 0.33 | 0.52 | 154.92 |
| Number of local health infrastructures | −0.50 | 0.84 | 167.33 |
| Number of local security and justice infrastructures | −0.50 | 0.84 | 167.33 |
| Restrictions to local property rights | 0.50 | 1.05 | 209.76 |
| Number of local education infrastructures | −0.33 | 0.82 | 244.95 |
| Health of residents | −0.33 | 0.82 | 244.95 |
| Number of residents | −0.33 | 1.03 | 309.84 |
| Scientific and/or technical research activities in/on the site | 0.25 | 0.96 | 382.97 |
| Educational degree of residents | −0.17 | 0.98 | 589.92 |
| Number of regulation breaches & sanctions | −0.17 | 0.98 | 589.92 |
| Vulnerability of local populations to natural disasters | −0.17 | 0.98 | 589.92 |
| Residents’ age | 0.17 | 1.33 | 797.50 |
| Economic Indicator | Mean | SD | CV |
| Residential construction | −1.20 | 1.10 | 91.29 |
| Local council’s budget | −0.60 | 0.89 | 149.07 |
| Number of local technological infrastructures | 0.33 | 0.52 | 154.92 |
| Local tourist activity | 0.20 | 0.45 | 223.61 |
| Residents’ income | −0.40 | 0.89 | 223.61 |
| Number of local enterprises and businesses | −0.50 | 1.22 | 244.95 |
| Number of local transport infrastructures | −0.50 | 1.22 | 244.95 |
| Local taxes | 0.33 | 0.82 | 244.95 |
| Local bureaucracy | 0.17 | 0.41 | 244.95 |
| Local quality of life | −0.33 | 0.82 | 244.95 |
| Local employment | −0.20 | 1.10 | 547.72 |
| Price of local products and services | 0.00 | 0.00 |
© 2018 by the authors. Licensee MDPI, Basel, Switzerland. This article is an open access article distributed under the terms and conditions of the Creative Commons Attribution (CC BY) license (http://creativecommons.org/licenses/by/4.0/).
Share and Cite
Rodríguez-Rodríguez, D.; López, I. Effects of Legal Designation and Management of a Multiple-Use Protected Area on Local Sustainability. Sustainability 2018, 10, 3176. https://doi.org/10.3390/su10093176
Rodríguez-Rodríguez D, López I. Effects of Legal Designation and Management of a Multiple-Use Protected Area on Local Sustainability. Sustainability. 2018; 10(9):3176. https://doi.org/10.3390/su10093176
Chicago/Turabian StyleRodríguez-Rodríguez, David, and Iván López. 2018. "Effects of Legal Designation and Management of a Multiple-Use Protected Area on Local Sustainability" Sustainability 10, no. 9: 3176. https://doi.org/10.3390/su10093176
APA StyleRodríguez-Rodríguez, D., & López, I. (2018). Effects of Legal Designation and Management of a Multiple-Use Protected Area on Local Sustainability. Sustainability, 10(9), 3176. https://doi.org/10.3390/su10093176