Article

Operational Efficiency of Chinese Provincial Electricity Grid Enterprises: An Evaluation Employing a Three-Stage Data Envelopment Analysis (DEA) Model

1
School of Economics and Management, North China Electric Power University, Beijing 102206, China
2
Beijing Key Laboratory of New Energy and Low-Carbon Development, North China Electric Power University, Beijing 102206, China
*
Author to whom correspondence should be addressed.
Sustainability 2018, 10(9), 3168; https://doi.org/10.3390/su10093168
Submission received: 16 August 2018 / Revised: 26 August 2018 / Accepted: 28 August 2018 / Published: 5 September 2018

Abstract

:
With the implementation of new round electricity system reform in China, the provincial electricity grid enterprises (EGEs) of China should focus on improving their operational efficiency to adapt to the increasingly fierce market competition and satisfy the requirements of the electricity industry reform. Therefore, it is essential to conduct operational efficiency evaluation on provincial EGEs. While considering the influences of exterior environmental variables on the operational efficiency of provincial EGEs, a three-stage data envelopment analysis (DEA) methodology is first utilized to accurately assess the real operational efficiency of provincial EGEs excluding the exterior environmental values and statistical noise. The three-stage DEA model takes the amount of employees, the fixed assets investment, the 110 kV and below distribution line length, and the 110 kV and below transformer capacity as input variables and the electricity sales amount, the amount of consumers, and the line loss rate as output variables. The regression results of the stochastic frontier analysis model indicate that the operational efficiencies of provincial EGEs are significantly affected by exterior environmental variables. Results of the three-stage DEA model imply that the exterior environmental values and statistical noise result in the overestimation of operational efficiency of provincial EGEs, and the exclusion of exterior environmental values and statistical noise has provincial-EGE-specific influences. Furthermore, 26 provincial EGEs are divided into four categories to better understand the differences of operational efficiencies before and after the exclusion of exterior environmental values and statistical noise.

1. Introduction

As one of the most significant energy sources of the fundamental industry of the national economy, the electricity industry plays a critical role in the economic progress. At the aim of maintaining the coordinated development with the economy, the electricity industry constantly explores the development path in the reform. In 2002, to improve the operational efficiency of electricity industry and to break the absolute monopoly of State Power Corporation (SPC), the central government of China issued No.5 Document to disclose the prolusion of the first round reform for electricity industry [1,2,3,4]. However, as the policies are not market-oriented, unfair competition constantly emerged and pricing mechanisms became distorted, which was not coordinated with the speed-up development of the society and economy [5,6,7]. Aiming at solving the above mentioned problems, a new round of electricity industry reform was started by conducting the ‘No.9 Government Document’ in 2015 [8]. The significant requests of the ‘No.9 Government Document’ contain the profit mode of electricity grid enterprises (EGEs) would be changed from obtaining the differential income between purchasing and selling electricity to the benefit mode of obtaining the net fee charged in accordance with the transmission and distribution price set by the government. Moreover, the competition would be introduced into the electricity selling side. The emergence of electricity retailers and the participation of ‘large users’ into the electricity sales market completely broke the monopoly of EGEs in electricity supplying [9]. To satisfy the requirements of the electricity industry reform, provincial EGEs of China should focus on improving their operational efficiency to adapt to the increasingly fierce market competition. Therefore, it is essential to conduct operational efficiency evaluation on provincial EGEs and to explore the pathways to improve operational efficiency so that provincial EGEs can maintain sustainable development under the context of electricity industry reform.
Generally, the data envelopment analysis (DEA) method is deemed as the representative and valid efficiency evaluation model [10]. The DEA approach was originally put forward by Charnes, Cooper, and Rhodes [11], and the established model was named as the CCR (C2R) model. Then, Banker, Charnes, and Cooper put forward the BCC (BC2) model under the hypothesis of variable scale returns [12]. To further reflect the complicated interrelationships of decision-making units (DMUs), Färe and Grosskopf put forward the framework of network DEA [13] and then established a specific DEA model on the basis of the network generation procedure [14]. The two stage DEA model on the basis of production procedure is a particular type of the network DEA method [15]. As the inefficiency of the evaluated DMU may be not only brought up by the internal misadministration, but also resulted from the exotic environmental influencing factors, such as the development level of economy, the amount of population, the economic structure, the urbanization process, and the scientific and technological development level [16,17]. Fried et al. [16] established the four-stage DEA method to analyze DMUs’ efficiency excluding the influences of exotic environmental factors. Nevertheless, the established model failed to eliminate the impacts of statistical noise on efficiency calculation. To resolve this issue, Fried et al. [17] established the three-stage DEA method integrating the stochastic frontier analysis (SFA) model with the non-parametric DEA model to identify and exclude the influences of statistical noise and exotic environmental factors on the efficiency evaluation aiming at reflecting the real efficiency of each DMU.
The three-stage DEA model has been extensively applied in regional or setoral eco-efficiency measurement [18,19,20], environmental efficiency evaluation [21,22,23], and energy efficiency assessment [24,25,26,27,28]. For EGEs operational efficiency evaluation, the conventional C2R model and super efficiency DEA model were utilized to assess and rank the operational efficiencies of electricity supply enterprises [29,30,31,32]. To our best knowledge, the three-stage DEA model has not been employed in EGEs’ operational efficiency measurement. Therefore, to fill the research gap, this investigation for the first time utilizes the three-stage DEA model integrating the traditional input-oriented BC2 model and SFA methodology to exclude the influences of statistical noise and exotic environmental factors on operational efficiency quantification to evaluate and rank the real operational efficiency of provincial EGEs in China so as to discover the development pathway of EGEs under the new electricity industry reform.
The remainder sections of this investigation are structured, as below. Section 2 introduces the fundamental methodologies integrated in the three-stage DEA model. Section 3 elaborates the input and output variables for DEA model and the selected exotic environmental factors influencing EGEs operational efficiency. Operational efficiency assessment results of Chinese provincial EGEs that are based on the three-stage DEA model are presented in Section 4. Section 5 comparatively discusses on the empirical analysis results. Primary conclusions are listed in Section 6.

2. Methodologies for the Three-Stage DEA Model

This investigation applies the three-stage DEA model that was established by Fried et al. [17] to evaluate the real operational efficiency of Chinese provincial EGEs. The framework of methodology is demonstrated in Figure 1. At the first stage, the operational efficiencies of provincial EGEs under the impacts of exotic environmental factors and statistical noise are calculated by the input-oriented BC2 model, which are named as comprehensive operational efficiencies in this research. At the second stage, the slack component of each input variable is decomposed into three categories, including environmental values, managerial inefficiency, and statistical noise, and the adjusted input variables values of each provincial EGE are obtained through eliminating the impacts of statistical noise and environmental values. At the third stage, the operational efficiencies of provincial EGEs are reevaluated while employing the input-oriented BC2 model, which is the same as the model that was used at the first stage but inputting the adjusted input variables values that were obtained from the second stage to calculate the real operational efficiencies of provincial EGEs.

2.1. The First Stage: Comprehensive Operational Efficiency Assessment

The DEA model could be categorized into two types: input oriented and output oriented DEA models. Since the input variables normally demonstrate the concerns of decision makers and are much more controllable when compared with output variables, hence this investigation employs the input oriented DEA model. When compared with the C2R model, the BC2 model can further evaluate the pure technical efficiency (PTE) and scale efficiency (SE) of each DMU. Therefore, this investigation selects the input oriented BC2 approach to assess the operational efficiency of provincial EGEs, the formula of which is expressed as:
min θ s . t . x i j 0   j = 1 n x i j λ j y r j 0 j = 1 n y r j λ j j = 1 n λ j = 1 λ j 0 , j = 1 , 2 , ... , n i = 1 , 2 , ... , m ; r = 1 , 2 , ... , s
where θ demonstrates the comprehensive operational efficiency value of each DMU, x i j and y r j are the i-th input and r-th output of the j-th DMU, m, s, and n represent the amount of input variables, output variables, and DMUs, and λ j implies a j dimensional weight vector of the DMU j.

2.2. The Second Stage: Excluding Statistical Noise and Exotic Environmental Factors

Through processing the first stage, we can not only obtain the comprehensive operational efficiency values of DMUs, but also get the input slacks of DMUs, which illustrates the difference between the ideal and actual inputs to achieve the optimum operational efficiency of every DMU. The corresponding input slack of x i j is s i j affected by the environmental values, statistical noise, and administration inefficiency. For the slack variable of the i-th input, the SFA model is established as:
s i j   = f i ( Q j , β i ) + ε i j ε i j = μ i j + v i j
where Q j is a vector of socio-economic variables affecting the operational efficiency of the j-th DMU, Q j = ( q 1 j , q 2 j , ... , q p j ) ( q p j represents the p-th socio-economic variable of j-th DMU), β i represents the coefficient of each socio-economic variable, f i ( Q j , β i ) is the function of the environmental values which are calculated by f i ( Q j , β i ) = Q j β i , v i j is the statistical noise for the i-th input of the j-th DMU and v i j N ( 0 , σ v i 2 ) , μ i j is the managerial inefficiency component for the i-th input of the j-th DMU and μ i j N + ( μ , σ μ i 2 ) . No relation exists between v i j and μ i j .
Supposing γ i = σ μ i 2 σ μ i 2 + σ v i 2 , the value of γ i closes to 1 demonstrating the influences of managerial factors administrate the inefficiency of DMUs and the SFA approach should be applied for estimation, while the value of γ i closes to 0 implying the influences of statistical noise administrate the inefficiency of DMUs and the ordinary least squares (OLS) approach is applicable. Hence, the value of γ i can be employed to examine whether the SFA model is applicable for regressing.
To obtain the adjusted input values of each DMU, the decomposition method that was established by Jondrow et al. [33] will be utilized, and the conditional expectation value of managerial inefficiency component μ i j is calculated by:
E ( μ i j   | μ i j + v i j ) = λ i σ i 1 + λ i 2 ( φ ( ε i j λ i σ i ) ϕ ( ε i j λ i σ i ) + ε i j λ i σ i )
where E ( μ i j | μ i j + v i j ) , ε i j , λ i , and σ i represent the estimated data of E ( μ i j | μ i j + v i j ) , ε i j , λ i , and σ i , respectively. λ i = σ μ i σ v i , σ i 2 = σ μ i 2 + σ v i 2 , φ and ϕ imply the probability frequency function and the cumulative distribution function for standardized normal distribution. The detailed mathematical derivations can refer to References [10,17].
Afterwards, on the basis of β i (estimated values for β i by the SFA approach), the conditional expectation values of v i j is computed by:
E ( v i j   | μ i j + v i j ) = s i j Q j β i E ( μ i j | μ i j + v i j ) .
Then, the adjusted input values x i j A are calculated by:
x i j   A = x i j + [ max i ( Q j β i ) Q j β i ] + [ max i ( E ( v i j | μ i j + v i j ) ) E ( v i j | μ i j + v i j ) ] .
The component [ max i ( Q j β i ) Q j β i ] in the Equation (5) implies the adjustment dispatching all the DMUs in the least desirable environment confronted by all DMUs. The term [ max i ( E ( v i j | μ i j + v i j ) ) E ( v i j | μ i j + v i j ) ] adjusted DMUs to a common condition of nature called the unluckiest condition confronted by all samples. The adjustment above dispatches all of the DMUs in the same exotic environment.

2.3. The Third Stage: Real Operational Efficiency Assessment

On the basis of the adjusted inputs values that were calculated at the second stage, as well as the initial outputs that were utilized at the first stage, the input-oriented BC2 model could calculate the real operational efficiencies of provincial EGEs, eliminating the influences of statistical noise and exotic environmental values.

3. Variables Selection and Data Sources

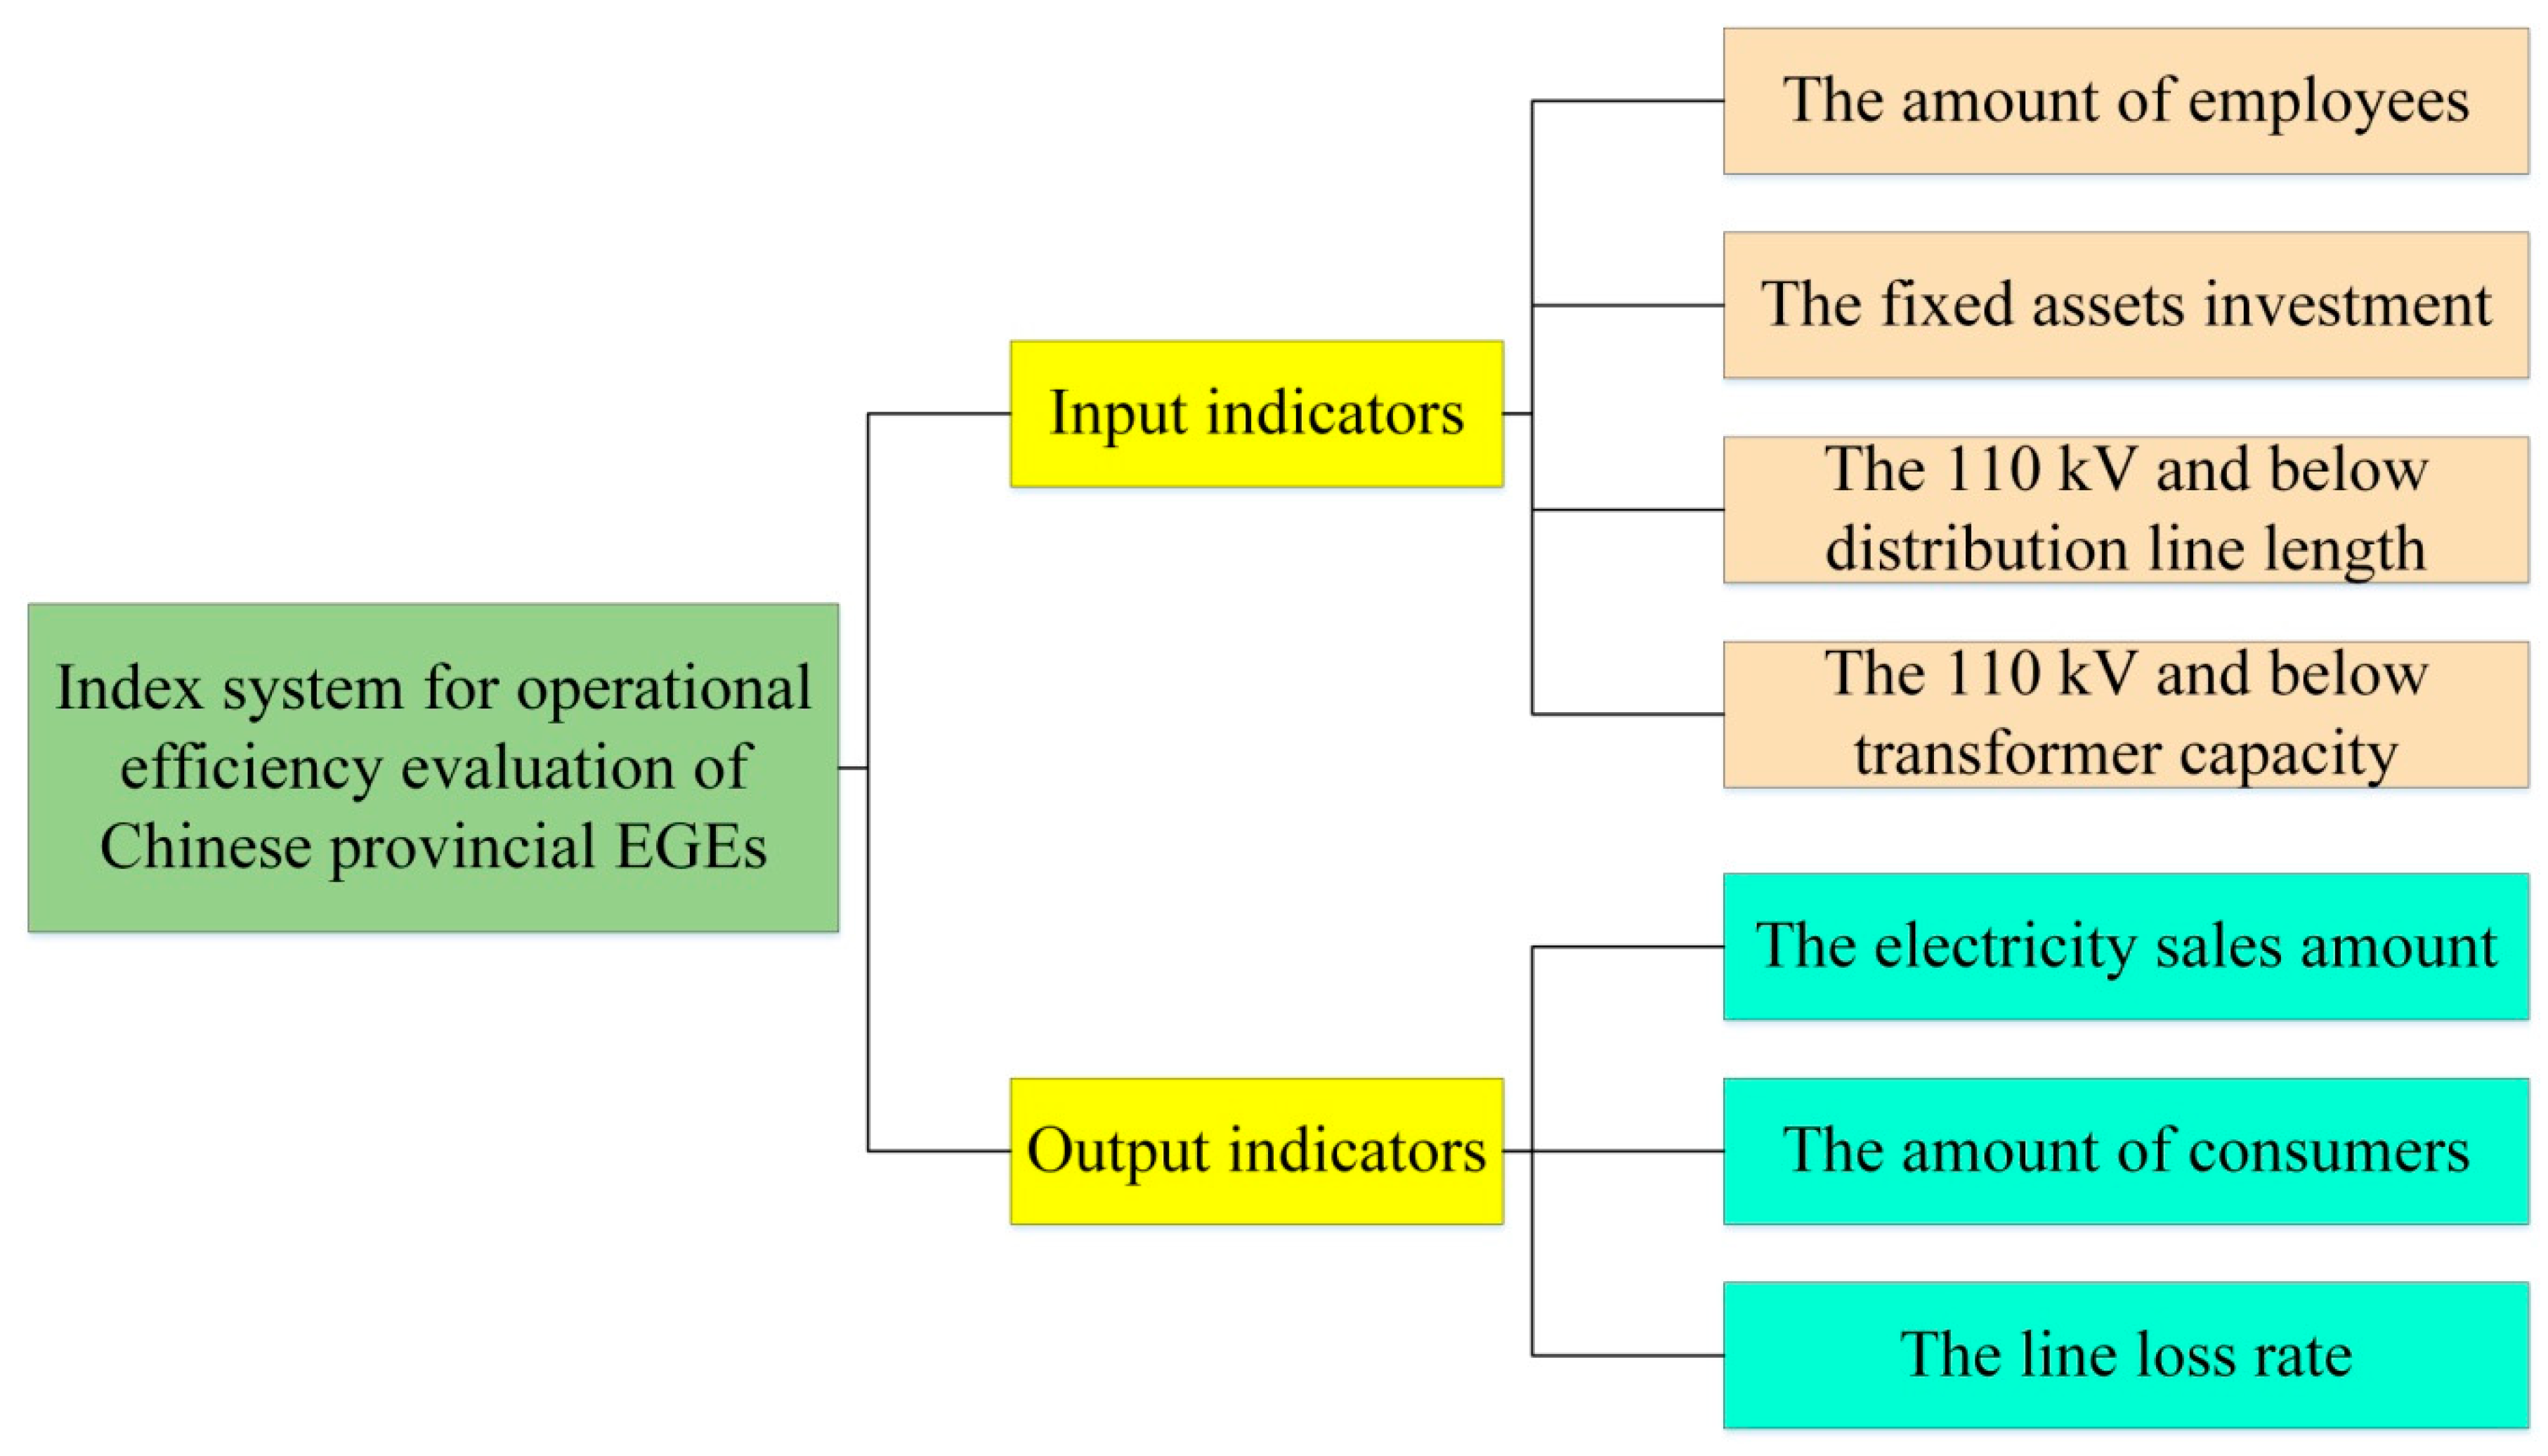
3.1. The Input and Output Variables of DEA Model Based on BC2 Approach

In this investigation, the DMUs refer to provincial EGEs in China. To completely and accurately evaluate the operational efficiency of each provincial EGE, while considering the existing researches on operational performance and efficiency evaluation of EGEs [34,35,36], the variables that are listed in Figure 2 are finally selected to be the input and output indicators for DEA method to assess the operational efficiency of the provincial EGEs of China.
Primary inputs of EGEs to guarantee the operational efficiency contain labor force, investment, and electric power grid infrastructure construction. In terms of labor force, we select the number of employees of the provincial EGE as input indicator. For investment, the fixed assets investment is chosen as an input indicator, as the control ability of fixed assets investment can reflect the operational performance of EGEs. For electric power grid infrastructure construction, as the most significant factor affecting the electricity supply capability of EGEs, the distribution line length and transformer capacity are the most critical indicators to measure the level of electric power grid infrastructure construction. Hence, the 110 kV and below distribution line length as well as the 110 kV and below transformer capacity are selected as the input indicators to represent electric power grid infrastructure construction. Therefore, the input indicators that are chosen for DEA model to assess the operational efficiency of provincial EGEs are the amount of employees of the provincial EGE, the fixed assets investment, the 110 kV and below distribution line length, and the 110 kV and below transformer capacity.
The final outputs of EGEs are the electricity products and services that are provided for consumers. We select the electricity sales amount and the amount of consumers to represent the electricity products and services that are provided for users. Additionally, the line loss rate is a significant indicator reflecting the transmission and distribution efficiency of electricity grid from the operational point of view which slightly depends on electricity line temperature [37]. Hence, the electricity sales amount, the amount of consumers, and the line loss rate are selected as the output indicators of DEA model to measure the operational efficiency of Chinese provincial EGEs.

3.2. Exterior Environmental Variables Influencing Operation Efficiencies of Provincial EGEs

The operational efficiencies of Chinese provincial EGEs are not only affected by internal input and output variables, but are also influenced by external factors, such as regional economic developing level. In terms of the related literature [38], this paper selects the GDP (gross domestic product) per capita, the proportion of the second industry added value in GDP, and the urbanization rate as the exotic environmental variables affecting the operational efficiency of provincial EGEs.
The development of EGEs is highly correlated with the regional economic developing level. Economic development level can exert decisive influences on the critical indicators of operational efficiency assessment for EGEs, such as electricity sales amount and investment. The economic development level determines the investment on infrastructure construction of EGEs, thus further influencing the distribution capacity, distribution line length, and structure. Meanwhile, the living standard of local people is also determined by the economic development level, which can affect the electricity consumption amount, thereby influencing the electricity sales amount of EGEs. While considering this, the GDP per capita representing the regional economic development level is selected as an exotic environmental variable affecting operational efficiency of provincial EGEs.
The secondary industry containing industry and construction is the large consumer of electricity. The production activities of industrial enterprises, especially energy intensive enterprises, are highly dependent on stable electricity supply. Simultaneously, the operation revenue of EGEs also depends on the profit of industrial enterprises. Currently, except for the megacities, like Beijing, Tianjin, and Shanghai, economic growth of most provinces in China relies on the secondary industry. Hence, the proportion of the second industry added value in GDP representing the development level of secondary industry is selected as an exterior environmental variable that is employed to adjust the input variables values to eliminate the influences of exotic environmental factors.
With the accelerating progress of urbanization of China, the development of urbanization will change people’s life styles and energy consumption structure, which will greatly prompt electricity consumption [39,40,41]. Simultaneously, with the increase of urban residents, the electricity load would increase, and the requirements for stable and high quality electricity supply would gradually increase, which will inspect the operational performance and efficiency of EGEs to a great extent. Hence, urbanization rate is also a significant exterior environmental variable influencing operational efficiency of EGEs. To accurately evaluate the real operational efficiency of EGEs, we need to take the urbanization rate that is represented by the proportion of urban population in total population into consideration to adjust input variables values eliminating the influences of exterior environmental values and statistical noise.

3.3. Data Sources

The data of input and output variables of provincial EGEs as well as exterior environmental variables of the corresponding province in the year of 2016 of this investigation are primarily collected from statistical systems of China. Specifically, the data of the amount of employees of the provincial EGEs, the fixed assets investment, the 110 kV and below distribution line length, and the 110 kV and below transformer capacity by the end of 2016, the electricity sales amount, the amount of consumers, and the line loss rate during 2016 used in DEA model are collected and summarized from the National Electricity Grid Corporations Yearbook of China in 2017 (shown in Table A1 in Appendix A) [42]. Limited by the statistical data in this yearbook, this paper researches 26 provincial EGEs of China (shown in Table 2). The data of the GDP per capita, the proportion of the second industry added value in GDP, and the urbanization rate of each province in 2016 are collected from China Statistical Yearbook in 2017 [43]. The descriptive statistics of the selected variables for 26 provincial EGEs in 2016 are indicated, as in Table 1. Taking the electricity sales amount as an example, the minimum statistic of the electricity sales amount means the minimum electricity sales amount of 26 provincial EGEs in 2016, the maximum statistic is the maximum electricity sales amount of 26 provincial EGEs in 2016, the mean statistic is the average electricity sales amount of 26 provincial EGEs in 2016, and the standard deviation statistic is the standard deviation of electricity sales amount of 26 provincial EGEs in 2016.

4. Operational Efficiency Evaluation Results of Provincial EGEs

4.1. The First Stage: The Comprehensive Operational Efficiency Results

At the first stage, the input-oriented BC2 based DEA model is utilized to quantify the comprehensive operational efficiency of provincial EGEs. The comprehensive operational efficiency assessment results are elaborated in Table 2. To further understand the comprehensive operational efficiency assessment results, the comprehensive operational efficiency is decomposed into PTE and SE. PTE excludes the operational scale effects, and SE can reflect the scale validity of each provincial EGE. The average values of comprehensive operational efficiency, PTE, and SE of 26 provincial EGEs are 0.905, 0.929, and 0.970, respectively, while considering the influences exerted by external environmental factors and statistical noise. The comprehensive operational efficiencies of 15 provincial EGEs achieve completely efficient (the values of comprehensive operational efficiency equal 1), while 11 provincial EGEs maintain inefficient (the values of comprehensive operational efficiency are less than 1), among which the operational performance of Henan EGE is technical efficiency and scale inefficiency (the value of PTE equals 1 and the value of SE is smaller than 1). Provincial EGEs of Liaoning, Shanghai, Jiangxi, and Henan are at the phase of decreasing returns to scale, which demonstrate that the growth proportion of output lags behind that of input. While the provincial EGEs of Shanxi, Inner Mongolia, Fujian, Shandong, Shaanxi, Gansu, and Xinjiang remain at the phase of increasing returns to scale, illustrating that the proportion increment of output exceeds input scale expansion rate.

4.2. The Second Stage: The Influences of Exterior Environmental Variables on Operational Efficiency

At this stage, the SFA model is utilized to regress input slacks variables, containing the slacks of the amount of employees of the provincial EGE, the fixed assets investment, the 110 kV and below distribution line length, and the 110 kV and below transformer capacity. Three exterior environmental variables are selected as the explanatory variables for the slacks, including the GDP per capita, the proportion of the second industry added value in GDP, and the urbanization rate of each province. The regression results of the SFA model are demonstrated in Table 3.
In accordance with Table 3, the LR examination values of the unilateral error of the regressions for the four input slacks with three exterior environmental variables are all higher than the threshold value of the mixed chi-square distribution examination and are under 1% confidence level, implying the robustness of the regression models. The values of γ i for four regression models are extremely close to 1, which demonstrate that the operational inefficiency primarily derives from managerial inefficiency; hence, it is essential to separate managerial inefficiency component and statistical noise item utilizing the SFA approach.
For the estimated coefficients in Table 3, all the coefficients are significant at 1% confidence level, illustrating that the selected exterior environmental variables exactly pose statistically critical impacts on operational efficiency of provincial EGEs. It is essential to exclude the exterior environmental influences on the operational efficiency and analyse the genuine operational efficiency of provincial EGEs. Additionally, the coefficients also indicate the various relationships between exterior environmental variables and input variables. The negative coefficients demonstrate that the increase of the exterior environmental variables’ value will reduce input slacks, which can improve operational efficiency. Contrarily, positive coefficients will exert undesirable impacts on operational efficiency improvement. The influences of every exterior environmental variable are elaborated as below.
For the GDP per capita, the coefficients of the GDP per capita are positive for the 110 kV and below distribution line length, the 110 kV and below transformer capacity, and the fixed assets investment, but negative for the amount of employees. This is primarily because with the increase of the GDP per capita, electricity demand is expected to increase resulting in the extension of distribution lines and the increase of investment on infrastructure construction. The improvement of consumption level will enlarge the difference between peak and valley, which requires higher load density, leading to the increase of transformer capacity. With the improvement of people’s living standard, the amount of employees of provincial EGEs will reduce. Thus, economic progress will propose higher requirements for the effective operation of EGEs, and exert undesirable influences on improving the operational efficiency of EGEs.
For the proportion of the second industry added value in GDP, the coefficients of this variable to four input slacks variables are all positive, demonstrating that the development of secondary industry will bring about the increase of employees amount, the extension of distribution line length, and the increase of transformer capacity leading to the increase of investment. However, with the implementation of economic structure adjustment policies, the development of Chinese economy will be transformed from relying on the development of secondary industry to depending on the development of the tertiary industry, especially the high-value added industries. While considering this, the development of the second industry will be controlled, which will not exert unfavorable influences on improving the operational efficiency of EGEs.
For the urbanization rate, the coefficients of urbanization rate are positive for the 110 kV and below transformer capacity, the amount of employees, and the fixed assets investment, but negative for the 110 kV and below distribution line length. With the acceleration of the urbanization process, the population density of urban areas is increasing, thus the electricity supply areas are more concentrated, which limit the expansion of distribution lines. Meanwhile, with the increase of urban residents, the load density will also increase requiring the improvement of transformer capacity and investment. Therefore, the increase of urbanization rate will not contribute to the improvement of operational efficiency of EGEs.
Through analyzing the regression results of the SFA model, it can be concluded that the selected three exterior environmental variables, including the GDP per capita, the proportion of the second industry added value in GDP, and the urbanization rate exert significantly various influences on the four input slacks of operational efficiency. The comprehensive operational efficiency embodying the impacts of external environmental values and statistical noise conceal the genuine operational efficiency level of EGEs.

4.3. The Third Stage: The Real Operational Efficiency Results

The values of four input variables are adjusted by Equation (5) via excluding the exterior environmental values and statistical noise through substituting the coefficients values, σ i 2 and γ i values of Table 3 into Equations (3) and (4). At the third stage, the genuine operational efficiencies of provincial EGEs with adjusted input values are calculated while using input-oriented BC2 based DEA model. The real operational efficiency results of provincial EGEs are listed in Table 4.
The average values of genuine operational efficiency, PTE, and SE of 26 provincial EGEs are 0.905, 0.937, and 0.962, respectively, excluding the influences that are posed by exterior environmental values and statistical noise. The genuine operational efficiencies of 14 provincial EGEs realize high efficiency, while 12 provincial EGEs are inefficient, among which the operational performances of Beijing, Henan, and Shaanxi are technical efficiency and scale inefficiency. Provincial EGEs of Liaoning, Shanghai, and Henan are at the phase of decreasing returns to scale. Provincial EGEs of Beijing, Shanxi, Inner Mongolia, Fujian, Shandong, Jiangxi, Shaanxi, Gansu, and Xinjiang are still at the phase of increasing returns to scale.

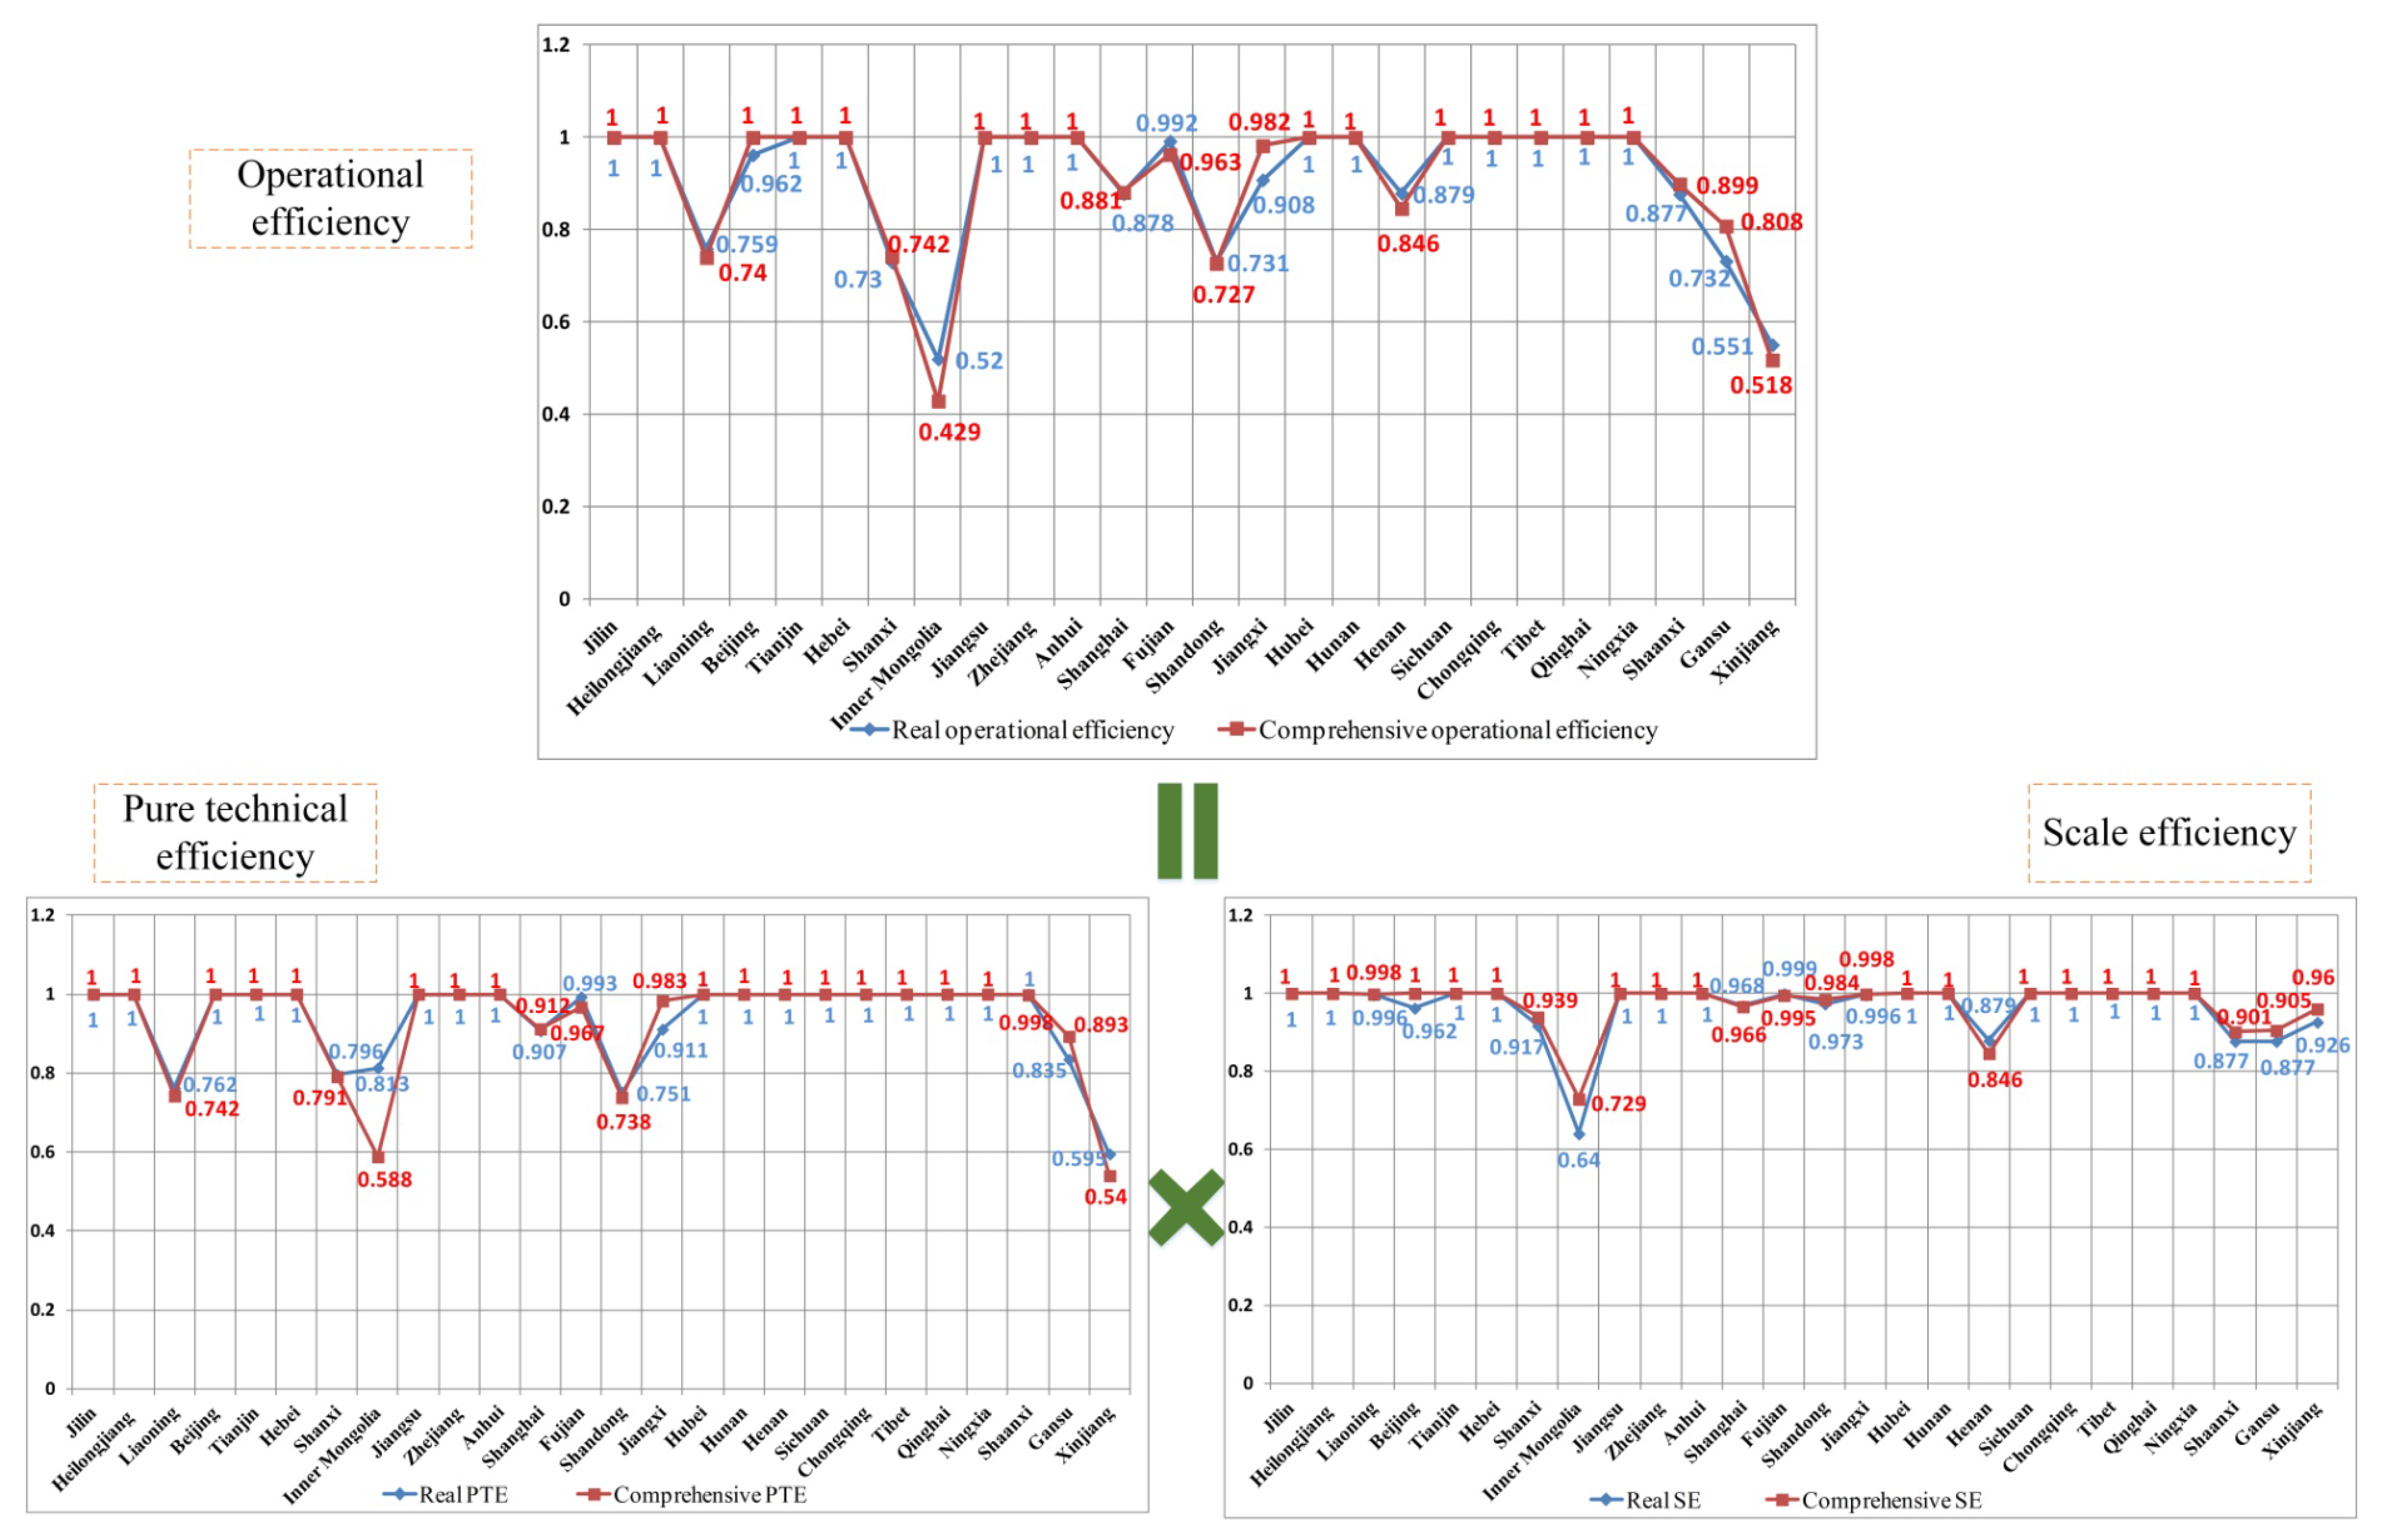
5. Comparative Discussion on the Comprehensive and Real Operational Efficiencies

After obtaining the comprehensive and genuine operational efficiencies evaluation results of the provincial EGEs, this section comparatively discusses the changes of operational efficiencies before and after excluding the influences of exterior environmental values and statistical noise. To further and better understand the operational efficiencies results, Figure 3 illustrates the decomposition results of comprehensive and genuine operational efficiencies. Generally, after excluding the influences of exterior environmental values and statistical noise, the mean values of operational efficiencies, PTE, and SE change from 0.9052, 0.929, and 0.970 to 0.9046, 0.937, and 0.962, respectively, demonstrating that the exterior environmental values and statistical noise result in the overestimation of operational efficiency. For individual provincial EGEs, the amount of provincial EGEs achieving completely operational efficient (at the operational efficiency frontier) reduces from 15 to 14 with Beijing EGE falling behind after excluding the influences of exterior environmental values and statistical noise, which demonstrates that the exterior environment of Beijing exerts desirable influences on operational performance of Beijing’s EGE.
For the provincial EGEs in Liaoning, Inner Mongolia, Fujian, Shandong, Henan, and Xinjiang, the operational efficiencies of these provincial EGEs increase 0.019, 0.091, 0.029, 0.004, 0.033, and 0.033, respectively, after eliminating the impacts of exterior environmental values and statistical noise indicating that the exotic environmental factors exert undesirable influences on the operational efficiency of EGEs. This is mainly because the proportions of the second industry added value in GDP of these provinces are relatively higher than other provinces with 50.29% of Fujian and 50.48% of Inner Mongolia. According to the coefficients that are listed in Table 3 based on the SFA model, the coefficients of the proportion of the second industry added value in GDP to four input slacks variables are all positive, indicating that the consideration of the proportion of the second industry added value in GDP will prompt the increase of inputs, leading to the decrease of operational efficiency of provincial EGEs. Additionally, the urbanization rates of these provinces are relatively higher than other provinces, with 67.37% of Liaoning, 62.59% of Fujian, 60.29% of Inner Mongolia, and 57.01% of Shandong. Higher urbanization rate will lead to the increase of the 110 kV and below transformer capacity, large amount of employees, and fixed assets investments input, which will result in operational inefficiency. Therefore, excluding exterior environmental factors will bring about the improvement of operational efficiency of provincial EGEs in Liaoning, Inner Mongolia, Fujian, Shandong, Henan, and Xinjiang.
For the provincial EGEs in Beijing, Shanxi, Shanghai, Jiangxi, Shaanxi, and Gansu, the operational efficiencies of these provincial EGEs decrease 0.038, 0.012, 0.003, 0.074, 0.022, and 0.076, respectively, after excluding the effects of exterior environmental values and statistical noise, demonstrating that the exotic environmental factors exert favorable influences on the operational efficiency of EGEs. For these provinces, the proportions of the second industry added value in GDP are relatively smaller than other provinces, with 19.74% of Beijing, 31.81% of Shanghai, 36.74% of Gansu, and 40.69% of Shanxi. In terms of the coefficients that were obtained by the SFA model listed in Table 3, the smaller proportions of the second industry added value in GDP will result in less input of the 110 kV and below distribution line length, the 110 kV and below transformer capacity, the amount of employees, and the fixed assets investment, leading to high operational efficiency. Additionally, the level of the GDP per capita of Gansu, Shanxi, Jiangxi, and Shaanxi are relatively lower than other provinces, which are 26,165, 34,919, 36,724, and 47,626 yuan per person, bringing about the relatively less input of the 110 kV and below distribution line length, the 110 kV and below transformer capacity, and the fixed assets investment, leading to high operational efficiency. These exterior environmental factors cause relatively higher operational efficiencies of these provincial EGEs when compared with the operational efficiencies, excluding exotic environmental values.
Figure 4 and Figure 5 illustrate the PTE and SE of the real and comprehensive operational efficiencies of provincial EGEs that do not achieve the operational efficiency frontier based on the results of the three-stage DEA model.
For High-High group, in terms of the PTE and SE results of real operational efficiency, only the values of Fujian and Beijing EGEs are higher than the average level, while considering the results of comprehensive operational efficiency, Jiangxi, Fujian, and Beijing are all higher than the average level. For Fujian EGE, after excluding the exterior environmental values and statistical noise, the values of PTE and SE increase from 0.967 to 0.993 and from 0.995 to 0.999, respectively. For Beijing and Jiangxi EGEs, the exterior environment prompts the improvement of operational efficiency, thus the values of PTE and SE of comprehensive operational efficiency are higher than that of real operational efficiency.
For the High-Low group, this group contains Henan and Shaanxi EGEs with PTE that is higher than average level and SE lower than average level. For Henan EGE, it has achieved technical efficiency, and the SE increases from 0.846 to 0.879 after eliminating exterior environmental values and statistical noise. For Shaanxi EGE, after excluding the exterior environmental variables, it realizes technical efficiency, but the SE decreases from 0.901 to 0.877. For these two provincial EGEs, the way to improve operational efficiency is to promote the enhancement of scale efficiency, such as expanding infrastructure construction, and increasing the amount of employees, consumers, fixed assets investment, and the electricity sales amount.
For the Low-High group, the SE values of real operational efficiency of Liaoning, Jiangxi, Shandong, and Shanghai EGEs are higher than average level, and the PTE values of the real operational efficiency of these provincial EGEs are lower than the average level. Nevertheless, while considering the influences of exterior environmental values and statistical noise, Shanghai EGE falls into Low-Low group, while Jiangxi EGE rises to High-High group. For provincial EGEs in the Low-High group, the direction for improving operational efficiency is to improve PTE via promoting technical innovation, increasing investment on research and development, and employing high-quality technical talents. Meanwhile, enhancing the SE of Shandong and Shanghai EGEs, which are slightly higher than the average level, should not be ignored.
For Low-Low group, in accordance with the PTE and SE results of real operational efficiency, the values of Xinjiang, Shanxi, Gansu, and Inner Mongolia EGEs are under the average level. Taking the influences of exterior environmental variables into consideration, these four provincial EGEs remain in the Low-Low group, and Shanghai EGE also falls into this group. For these provincial EGEs, decision makers should focus on improving both PTE and SE to prompt operational efficiency improvement. That means that these provincial EGEs should not only expand operational scale, but also improve technological level, such as expanding infrastructure construction so as to increase consumers and electricity sales amount, increasing research and development investment, and employing innovative talents.

6. Conclusions

The conventional DEA models neglect the impacts of exterior environmental values and statistical noise, which might lead to inaccurate efficiency evaluations. In this investigation, to accurately evaluate the operational efficiencies of provincial EGEs of China, the three-stage DEA model is utilized. The first stage is conducted while employing the traditional input-oriented BC2 approach based DEA model taking the amount of employees of the provincial EGE, the fixed assets investment, the 110 kV and below distribution line length, and the 110 kV and below transformer capacity as input variables and the electricity sales amount, the amount of consumers, and the line loss rate as output variables. The second stage is processed to separate the influences of exterior environmental values and statistical noise from initial input variables to obtain the adjusted input variables via SFA model through regressing initial input slacks with three selected exterior environmental variables including the GDP per capita, the proportion of the second industry added value in GDP, and the urbanization rate. The third stage is conducted based on the same DEA model that was utilized at the first stage with initial output variables values and adjusted input values to achieve the real operational efficiencies of provincial EGEs. The primary conclusions are summarized, as below.
(1) At the first stage, the average values of comprehensive operational efficiency, PTE, and SE of 26 provincial EGEs are 0.905, 0.929, and 0.970, respectively, and the comprehensive operational efficiencies of 15 provincial EGEs achieve high efficiency, while 11 provincial EGEs are inefficient.
(2) At the second stage, all the coefficients are significant at the 1% confidence level, illustrating that the selected exterior environmental variables exactly pose critical influences on operational efficiency of provincial EGEs. Coefficients of the GDP per capita are positive for the 110 kV and below distribution line length, the 110 kV and below transformer capacity, and the fixed assets investment, but negative for the amount of employees. Coefficients of the proportion of the second industry added value in GDP to four input slacks variables are all positive. Coefficients of urbanization rate are positive for the 110 kV and below transformer capacity, the amount of employees, and the fixed assets investment, but negative for the 110 kV and below distribution line length.
(3) At the third stage, the average values of genuine operational efficiency, PTE, and SE of 26 provincial EGEs are 0.905, 0.937, and 0.962, respectively, and 14 provincial EGEs realize high efficiency, while 12 provincial EGEs are inefficient.
(4) Through comparing the comprehensive operational efficiency results and genuine operational efficiency results, it is discovered that the exterior environmental values and statistical noise result in the overestimation of operational efficiency of provincial EGEs, and the exclusion of exterior environmental values and statistical noise has provincial-EGE-specific influences. For the provincial EGEs in Liaoning, Inner Mongolia, Fujian, Shandong, Henan, and Xinjiang, the operational efficiencies of these provincial EGEs increase after eliminating the impacts of exterior environmental values and statistical noise, indicating that the exotic environmental factors exert undesirable influences on operational efficiency of EGEs. For the provincial EGEs in Beijing, Shanxi, Shanghai, Jiangxi, Shaanxi, and Gansu, the operational efficiencies of these provincial EGEs decrease after excluding the effects of exterior environmental values and statistical noise, demonstrating that the exotic environmental factors exert favorable influences on the operational efficiency of EGEs.
(5) The comprehensive and real operational efficiencies of provincial EGEs are disintegrated into PTE and SE, the 26 provincial EGEs could be divided into four categories in accordance with the average level of PTE and SE, and each category has specific direction to improve operational efficiency of provincial EGEs, such as improving technological level and expanding economic scale of provincial EGEs.
Limited by the available data collected from National Electricity Grid Corporations Yearbook of China in 2017 and other statistical system of China, in the future research, we will investigate and survey provincial EGEs to collect data of some sophisticated indicators, such as electric vehicles amount, distributed generators penetration rate, and research and development investment. These indicators will be employed to evaluate the operational efficiencies of provincial EGEs.

Author Contributions

H.Z. (Huiru Zhao) proposed the research framework of this paper. H.Z. (Haoran Zhao) conducted empirical analysis and finished writing the paper. S.G. revised the paper.

Funding

This research is sponsored by the science and technology project of State Grid Corporation of China named Theoretical, Model, and Application Research of Effective Incentives for Transmission and Distribution Tariff under New Electricity Reform.

Acknowledgments

This research is sponsored by the science and technology project of State Grid Corporation of China named Theoretical, Model, and Application Research of Effective Incentives for Transmission and Distribution Tariff under New Electricity Reform.

Conflicts of Interest

The authors declare no conflict of interest.

Appendix A

Table A1. The data of input and output variables of provincial EGEs for the three-stage DEA model.
Provincial EGEsThe Electricity Sales Amount (108 kWh)The Amount of Consumers (104 Households)The Line Loss Rate (%)The 110 kV and below Distribution Line Length (104 m)The 110 kV and below Transformer Capacity (102 MVA)The Amount of Employees (Persons)The Fixed Assets Investment (108 yuan)
Beijing861762156741077826233
Tianjin645564153851051004143
Hebei146821491310476141485195
Shanxi130595914203410312030133
Shandong302797215457030602019335
Shanghai115999318104425151300231
Jiangsu436495023380043421900256
Zhejiang30866391523381164850432
Anhui206125521318104441995185
Fujian159115791413815042100175
Hubei2356220415598015131900125
Hunan103723241519913671370108
Henan2286361514490021602650275
Jiangxi86317371413992893304135
Sichuan1578270814236011401103310
Chongqing6471362146853432431124
Liaoning1592218915423822082531160
Jilin5011318161105207250654
Heilongjiang6761632141391278364048
Inner Mongolia289545122800332235087
Shaanxi903541111560702301464
Gansu7638121610013572832109
Qinghai58014534210141676283
Ningxia64232028921475122464
Xinjiang7787291938995632534162
Tibet34132369710441549

References

  1. Cheng, Y.S.; Wong, W.K.; Woo, C.K. How much have electricity shortages hampered China’s GDP growth? Energy Pol. 2013, 55, 369–373. [Google Scholar] [CrossRef]
  2. Zeng, M.; Ouyang, S.; Zhang, Y.; Shi, H. CCS technology development in China: Status, problems and countermeasures—Based on SWOT analysis. Renew. Sustain. Energy Rev. 2014, 39, 604–616. [Google Scholar]
  3. Zeng, B.; Zeng, M.; Xue, S.; Cheng, M.; Wang, Y.; Feng, J. Overall review of wind power development in Inner Mongolia: Status quo, barriers and solutions. Renew. Sustain. Energy Rev. 2014, 29, 614–624. [Google Scholar] [CrossRef]
  4. Fisher-Vanden, K.; Mansur, E.T.; Wang, Q.J. Electricity shortages and firm productivity: Evidence from China’s industrial firms. J. Dev. Econ. 2015, 114, 172–188. [Google Scholar] [CrossRef]
  5. Li, K.; Lin, B. The efficiency improvement potential for coal, oil and electricity in China’s manufacturing sectors. Energy 2015, 86, 403–413. [Google Scholar] [CrossRef]
  6. He, Y.; Wang, B.; Li, D.; Du, M.; Huang, K.; Xia, T. China’s electricity transmission and distribution tariff mechanism based on sustainable development. Int. J. Electr. Power Energy Syst. 2015, 64, 902–910. [Google Scholar] [CrossRef]
  7. Ma, C.; Zhao, X. China’s electricity market restructuring and technology mandates: Plant-level evidence for changing operational efficiency. Energy Econ. 2015, 47, 227–237. [Google Scholar] [CrossRef]
  8. The State Council of the People’s Republic of China. Relative Policies on Deepening the Reform of Power Industry. Available online: http://www.gov.cn/zhengce/xxgkzl.htm (accessed on 1 May 2018).
  9. Zeng, M.; Yang, Y.; Wang, L.; Sun, J. The power industry reform in China 2015: Policies, evaluations and solutions. Renew. Sustain. Energy Rev. 2016, 57, 94–110. [Google Scholar] [CrossRef]
  10. Zhang, J.; Liu, Y.; Chang, Y.; Zhang, L. Industrial eco-efficiency in China: A provincial quantification using three-stage data envelopment analysis. J. Clean. Prod. 2017, 143, 238–249. [Google Scholar] [CrossRef]
  11. Charnes, A.; Cooper, W.W.; Rhodes, E. Measuring the efficiency of decision making units. Eur. J. Oper. Res. 1978, 2, 429–444. [Google Scholar] [CrossRef]
  12. Banker, R.D.; Charnes, A.; Cooper, W.W. Some models for estimating technical and scale inefficiencies in data envelopment analysis. Manag. Sci. 1984, 30, 1078–1092. [Google Scholar] [CrossRef]
  13. Färe, R.; Grosskopf, S. Productivity and intermediate products: A frontier approach. Econ. Lett. 1996, 50, 65–70. [Google Scholar] [CrossRef] [Green Version]
  14. Färe, R.; Grosskopf, S. Network DEA. Socio-Econ. Plan. Sci. 2000, 34, 35–49. [Google Scholar] [CrossRef]
  15. Wang, C.H.; Gopal, R.D.; Zionts, S. Use of data envelopment analysis in assessing information technology impact on firm performance. Ann. Oper. Res. 1997, 73, 191–213. [Google Scholar] [CrossRef]
  16. Fried, H.O.; Schmidt, S.S.; Yaisawarng, S. Incorporating the operating environment into a nonparametric measure of technical efficiency. J. Prod. Anal. 1999, 12, 249–267. [Google Scholar] [CrossRef]
  17. Fried, H.O.; Lovell, C.A.K.; Schmidt, S.S.; Yaisawarng, S. Accounting for environmental effects and statistical noise in data envelopment analysis. J. Prod. Anal. 2002, 17, 157–174. [Google Scholar] [CrossRef]
  18. Zhang, C.; Liu, H.; Bressers, H.T.A.; Buchanan, K.S. Productivity growth and environmental regulations-accounting for undesirable outputs: Analysis of China’s thirty provincial regions using the Malmquist–Luenberger index. Ecol. Econ. 2011, 70, 2369–2379. [Google Scholar] [CrossRef]
  19. Li, K.; Lin, B. Impact of energy conservation policies on the green productivity in China’s manufacturing sector: Evidence from a three-stage DEA model. Appl. Energy 2016, 168, 351–363. [Google Scholar] [CrossRef]
  20. Jia, S.; Wang, C.; Li, Y.; Zhang, F.; Liu, W. The urbanization efficiency in Chengdu City: An estimation based on a three-stage DEA model. Phys. Chem. Earth Parts A/B/C 2017, 101, 59–69. [Google Scholar] [CrossRef]
  21. Xie, B.C.; Duan, N.; Wang, Y.S. Environmental efficiency and abatement cost of China’s industrial sectors based on a three-stage data envelopment analysis. J. Clean. Prod. 2017, 153, 626–636. [Google Scholar] [CrossRef]
  22. Wu, J.; Zhu, Q.; Chu, J.; Liu, H.; Liang, L. Measuring energy and environmental efficiency of transportation systems in China based on a parallel DEA approach. Transp. Res. Transp. Environ. 2016, 48, 460–472. [Google Scholar] [CrossRef]
  23. Wang, Z.; Li, Y.; Wang, K.; Huang, Z. Environment-adjusted operational performance evaluation of solar photovoltaic power plants: A three-stage efficiency analysis. Renew. Sustain. Energy Rev. 2017, 76, 1153–1162. [Google Scholar] [CrossRef]
  24. Cui, Q.; Li, Y. The evaluation of transportation energy efficiency: An application of three-stage virtual frontier DEA. Transp. Res. Transp. Environ. 2014, 29, 1–11. [Google Scholar] [CrossRef]
  25. Dong, F.; Long, R.; Bian, Z.; Xu, X.; Yu, B.; Wang, Y. Applying a Ruggiero three-stage super-efficiency DEA model to gauge regional carbon emission efficiency: Evidence from China. Nat. Hazards 2017, 87, 1453–1468. [Google Scholar] [CrossRef]
  26. Cui, Y.; Huang, G.; Yin, Z. Estimating regional coal resource efficiency in China using three-stage DEA and bootstrap DEA models. Int. J. Min. Sci. Technol. 2015, 25, 861–864. [Google Scholar] [CrossRef]
  27. Chen, Y.; Liu, B.; Shen, Y.; Wang, X. The energy efficiency of China’s regional construction industry based on the three-stage DEA model and the DEA-DA model. KSCE J. Civ. Eng. 2016, 20, 34–47. [Google Scholar] [CrossRef]
  28. Bi, G.-B.; Song, W.; Zhou, P.; Liang, L. Does environmental regulation affect energy efficiency in China’s thermal power generation? Empirical evidence from a slacks-based DEA model. Energy Policy 2014, 66, 537–546. [Google Scholar] [CrossRef]
  29. Zhu, L.; Zhan, X. An Empirical Analysis of Shandong Power Grid Operational Efficiency Based on DEA-Malmquist. Int. J. Inf. Syst. Supply Chain Manag. 2018, 11, 1–13. [Google Scholar] [CrossRef]
  30. You, Y.Q.; Jie, T. A study of the operation efficiency and cost performance indices of power-supply companies in China based on a dynamic network slacks-based measure model. Omega 2016, 60, 85–97. [Google Scholar] [CrossRef]
  31. Sun, Y.; Yu, X.; Tan, Z.; Xu, X.; Yan, Q. Efficiency evaluation of operation analysis systems based on dynamic data envelope analysis models from a big data perspective. Appl. Sci. 2017, 7, 624. [Google Scholar] [CrossRef]
  32. Thakur, T.; Deshmukh, S.G.; Kaushik, S.C. Efficiency evaluation of the state owned electric utilities in India. Energy Policy 2006, 34, 2788–2804. [Google Scholar] [CrossRef]
  33. Jondrow, J.; Lovell, C.A.K.; Materov, I.S.; Schmidt, P. On the estimation of technical inefficiency in the stochastic frontier production function model. J. Econ. 1982, 19, 233–238. [Google Scholar] [CrossRef]
  34. Sueyoshi, T. Tariff structure of Japanese electric power companies: An empirical analysis using DEA. Eur. J. Oper. Res. 1999, 118, 350–374. [Google Scholar] [CrossRef]
  35. Lo, F.Y.; Chien, C.F.; Lin, J.T. A DEA study to evaluate the relative efficiency and investigate the district reorganization of the Taiwan power company. IEEE Trans. Power Syst. 2001, 16, 170–178. [Google Scholar] [CrossRef]
  36. Tang, H.; Yu, S. Based on the Power Grid Enterprise Operation Efficiency DEA Evaluation Research. Res. Technol. Econ. Manag. 2012, 4, 8–11. (In Chinese) [Google Scholar]
  37. Wydra, M. Performance and Accuracy Investigation of the Two-Step Algorithm for Power System State and Line Temperature Estimation. Energies 2018, 11, 1005. [Google Scholar] [CrossRef]
  38. Zhu, C. Study on the Input-output Performance Evaluation of Power Grid Enterprise Based on Data Envelopment Analysis. Master’s Thesis, Chongqing University, Chongqing, China, June 2008. [Google Scholar]
  39. Karanfil, F.; Li, Y. Electricity consumption and economic growth: Exploring panel-specific differences. Energy Policy 2015, 82, 264–277. [Google Scholar] [CrossRef]
  40. Shahbaz, M.; Sbia, R.; Hamdi, H.; Ozturk, I. Economic growth, electricity consumption, urbanization and environmental degradation relationship in United Arab Emirates. Ecol. Indic. 2014, 45, 622–631. [Google Scholar] [CrossRef]
  41. Khanna, N.Z.; Guo, J.; Zheng, X. Effects of demand side management on Chinese household electricity consumption: Empirical findings from Chinese household survey. Energy Policy 2016, 95, 113–125. [Google Scholar] [CrossRef]
  42. National Electricity Grid Corporations Yearbook of China. Available online: https://books.google.com/books?id=OYSmtQEACAAJ (accessed on 10 May 2018).
  43. China Statistical Yearbook. Available online: http://www.stats.gov.cn/tjsj/ndsj/2017/indexch.htm (accessed on 10 May 2018).
Figure 1. Framework of the established three-stage data envelopment analysis (DEA) model utilized for operational efficiency assessment of provincial electricity grid enterprises (EGEs).
Sustainability 10 03168 g001
Figure 2. The index system for operational efficiency evaluation of provincial EGEs.
Sustainability 10 03168 g002
Figure 3. Decomposition of comprehensive and real operational efficiencies of provincial EGEs.
Sustainability 10 03168 g003
Figure 4. Pure technical efficiency (PTE) and scale efficiency (SE) of real operational efficiency.
Sustainability 10 03168 g004
Figure 5. PTE and SE of comprehensive operational efficiency.
Sustainability 10 03168 g005
Table 1. Descriptive statistics of selected variables for 26 provincial EGEs.
VariablesMinimumMaximumMeanStandard Deviation
The electricity sales amount (108 kWh)3443641350982
The amount of consumers (104 households)1336151320878
The line loss rate (%)2.97%8.92%6.47%1.36%
The 110 kV and below distribution line length (104 m)385598021581479
The 110 kV and below transformer capacity (102 MVA)104434210121026
The amount of employees (persons)415236,40019,259829
The fixed assets investment (108 yuan)4843216495
The GDP per capita (yuan per person)26,165107,96055,51723,482
The proportion of the second industry added value in GDP (%)19.74%50.48%43.87%7.27%
The urbanization rate (%)27.78%87.62%57.73%12.85%
Note: MVA means mega volt ampere.
Table 2. The comprehensive operational efficiency results of provincial EGEs.
RegionComprehensive Operational EfficiencyPure Technical Efficiency (PTE)Scale Efficiency (SE)Return to Scale
North-east ChinaJilin111Constant
Heilongjiang111Constant
Liaoning0.7400.7420.998Decreasing
North ChinaBeijing111Constant
Tianjin111Constant
Hebei111Constant
Shanxi0.7420.7910.939Increasing
Inner Mongolia0.4290.5880.729Increasing
East ChinaJiangsu111Constant
Zhejiang111Constant
Anhui111Constant
Shanghai0.8810.9120.966Decreasing
Fujian0.9630.9670.995Increasing
Shandong0.7270.7380.984Increasing
Jiangxi0.9820.9830.998Decreasing
Central ChinaHubei111Constant
Hunan111Constant
Henan0.84610.846Decreasing
South-west ChinaSichuan111Constant
Chongqing111Constant
Tibet111Constant
North-west ChinaQinghai111Constant
Ningxia111Constant
Shaanxi0.8990.9980.901Increasing
Gansu0.8080.8930.905Increasing
Xinjiang0.5180.540.96Increasing
Table 3. The regression results of the stochastic frontier analysis (SFA) model.
Slacks Explanatory VariableThe 110 kV and below Distribution Line LengthThe 110 kV and below Transformer CapacityThe Amount of EmployeesThe Fixed Assets Investment
Constant term−530.24
(−407.43) *
−4824.78
(−676.85) *
1290.48
(1240.19) *
−107.51
(−107.60) *
The GDP per capita368.25
(40.55) *
27.7
(10.79) *
−384.57
(−114.09) *
3.92
(6.51) *
The proportion of the second industry added value in GDP98.59
(14.01) *
57.27
(11.48) *
4.14
(11.59) *
1.31
(12.79) *
The urbanization rate−516.98
(71.00) *
445.53
(20.39) *
324.07
(119.54) *
5.65
(7.40) *
σ i 2 984,661.22433,055.96428,117.461605.18
γ i 0.99990.99990.99990.9999
LR test22.1618.9218.9621.09
Note: * Implies the 1% confidence level. Data in brackets represent t-statistics of the coefficients.
Table 4. The real operational efficiency results of provincial EGEs.
RegionReal Operational EfficiencyPure Technical Efficiency (PTE)Scale Efficiency (SE)Return to Scale
North-east ChinaJilin111Constant
Heilongjiang111Constant
Liaoning0.7590.7620.996Decreasing
North ChinaBeijing0.96210.962Increasing
Tianjin111Constant
Hebei111Constant
Shanxi0.730.7960.917Increasing
Inner Mongolia0.520.8130.64Increasing
East ChinaJiangsu111Constant
Zhejiang111Constant
Anhui111Constant
Shanghai0.8780.9070.968Decreasing
Fujian0.9920.9930.999Increasing
Shandong0.7310.7510.973Increasing
Jiangxi0.9080.9110.996Increasing
Central ChinaHubei111Constant
Hunan111Constant
Henan0.87910.879Decreasing
South-west ChinaSichuan111Constant
Chongqing111Constant
Tibet111Constant
North-west ChinaQinghai111Constant
Ningxia111Constant
Shaanxi0.87710.877Increasing
Gansu0.7320.8350.877Increasing
Xinjiang0.5510.5950.926Increasing

