Development of Large-Scale and Quasi Multi-Physics Model for Whole Structure of the Typical Solid Oxide Fuel Cell Stacks

1
School of Energy and Power, Jiangsu University of Science and Technology, Zhenjiang 212003, China
2
School of Energy and Power Engineering, Dalian University of Technology, Dalian 116000, China
3
College of Physics and Energy, Fujian Normal University, Fuzhou 350117, China
*
Author to whom correspondence should be addressed.
Sustainability 2018, 10(9), 3094; https://doi.org/10.3390/su10093094
Submission received: 11 August 2018
/
Revised: 22 August 2018
/
Accepted: 23 August 2018
/
Published: 30 August 2018
(This article belongs to the Section Energy Sustainability)
Abstract
:Although the performance and corresponding manufacturing technology of solid oxide fuel cells (SOFC) units have greatly improved and have met commercial requirements over the past decades, they are constructed such that they perform poorly and lack strong duration outputs. Therefore, achieving high performance and extending duration at a stack level are challenges faced by the development process. This paper develops a large-scale and multiphysics model for the complete structure of a typical 10-cell SOFC stack. It includes solid components, flow paths, and porous sections—solid ribs, interconnectors, anode support, anode function layer, electrolyte layer, cathode layer, air/fuel feed manifolds, feed header, rib channels, exhaust header and outlet manifolds. The multiphysics application includes momentum, mass, energy and quasi electrochemical transporting; and their mutual coupling processes within the stack. This new model can help us understand the working specifics of the large-scale stack, obtaining distribution details of static pressure, species fraction, and temperature gradient; further addressing optimization of structure and operation parameters. These details serve as guidelines for practical structural designs and parameters in real stack levels.
1. Introduction
Solid component fuel cells are considered to be promising energy conversion devices due to their fuel flexibility [1], high power density [2], and compactness, among others [3]. The planar solid oxide fuel cell (SOFC) stack, in particular, offers easy manufacturing and high power density outputting features, compared to the tubular type stack. Over the past decades, the fabrication technologies of both the SOFC unit and its corresponding materials had been well developed to satisfy commercial requirements. Several SOFC electrode materials have been exploited, which include the pure electronic conducting medium (i.e., Pt, Ni and La1−xSrxMnO3 as LSM), the O2− conducting materials (i.e., Sm0.2Ce0.8O2−δ as SDC and the yttrium-stabilized zirconia as YSZ), the e−/O2− mixed conducting mediums (i.e., La0.6Sr0.4Co0.2Fe0.8O3−δ as LSCF and Ba0.5Sr0.5Co0.8Fe0.2O3-δ [3]), H+ conducting mediums (i.e., BaZr0.7Pr0.1Y0.2O3_d [4] and BaZr0.1Ce0.7Y0.2O3_d as BZCY [5]), and their mixtures.
However, good performance cell units are always constructed as a poor performance stack. Thus, understanding the working details of a SOFC stack and further achieving a good structural design is one of the key tasks to maximizing its power density and duration. As the experimental and measurement process (especially the parameter-investigating process) is expensive and laborious, numerical simulation is considered to be a good approach to figure out the working details of a SOFC stack and further address the parameter-optimizing works at a stack level.
A multiphysics model for the conventional cathode-supported SOFC single cell was developed by W. Kong et al. [6] and A. Enrico [7] to optimize the interconnect ribs. A multiphysics model of solid oxide button cells that use mixed conducting materials has also been developed to compare the electrochemical property differences of LSCF-pore double phase boundaries and LSCF-SDC-pore three phase boundaries [8]. In addition, the effect of area ratio between the anode and the cathode on electrochemical performance of the corresponding SOFC button cell was further investigated by the multiphysics model [9]. M. Ni developed a model for proton-conducting SOFC button cells fueled by syngas [10], and a voltage control strategy was proposed by L. Sun et al. to achieve good fuel cell performance [11]. A two-dimensional CFD model (calculated fluid dynamics) for a specific molten carbonate fuel cell stack was proposed by H. Hirata et al.; they studied the dependence of flow distribution on different rib thicknesses [12]. Huang et al. developed a 3D CFD model for a one-cell stack to investigate the effects of flow uniformity on different interconnects and distributors [13]. Furthermore, a 2D CFD model for the 100-cell stack was developed by Koh. et al., which aimed to simulate pressure drop distribution characteristics between the inlet and outlet manifolds zones [14]. A. Cruz Rojas et al. optimized the operation process of an air supply system in a typical fuel cell stack with a plant simulator which incorporates the balance of plant (BOP) components [15] and Y. Qin et al. optimized a proper fuzzy adaptive proportional integral derivative controller design for a specific fuel cell power system [16]. D. Chen et al. developed two 3D CFD models for the fuel and air flow paths of the 10-cell planar stacks, with the aim to ascertain the proper flow arrangements patterns [17]. Recently, the CFD model was further coupled with a solid mechanics model to obtain the induced thermal stress distribution feature in SOFC stack heating-up [18]. Several 3D large-scale models have also been developed by researchers in a bid to find a general fluid dynamics conclusion that is independent of specific structural designs [19]. The effects of different cathode solid rib configurations on SOFC stack performances was numerically investigated by a 3D multi-physics model for the cathode flow path of a 20-cell stack [20]. A 3D multi-physics half model of the cathode flow path of a 49-tubular cell stack was developed to obtain the optimized external air flow path for the anode support tubular fuel cell stack [21].
All of these findings have enhanced our understanding of the working features of SOFC stacks and provide clear guidelines for the designing of stack structures. However, it is necessary to mention that although the CFD modeling approach is widely used in SOFC research, 3D multi-physics models of the entire large-scale planar SOFC stack structure are very few. This is owing to the fact that this structure has complex component interactions between the fuel flow anode and the air flow cathode.
In this paper, a large-scale, whole-component, quasi multiphysics model for the complete structure of a typical 10-cell SOFC stack is developed by coupling momentum, mass, energy and quasi electrochemical transporting equations. Section 2.1 presents the 10-cell 3D model structure and its corresponding parameters. It considers the solids, porous mediums and flow paths of both anode and cathode parts. In Section 2.2 addresses the corresponding multi-physics equations, boundary conditions and operation parameters. Section 2.3 outlines the mesh and calculation processes. Section 3 describes how the model is used to identify the distributing characteristics of fuel/air static pressures and flow rates among the piled cell layers and over each cell unit surface, H2 and O2 species mole fraction distributions characteristics within rib channels and over electrode-electrolyte interfaces, and the temperature distributions within the whole stack.
2. Materials and Methods
2.1. 3D Model Structure and Parameters
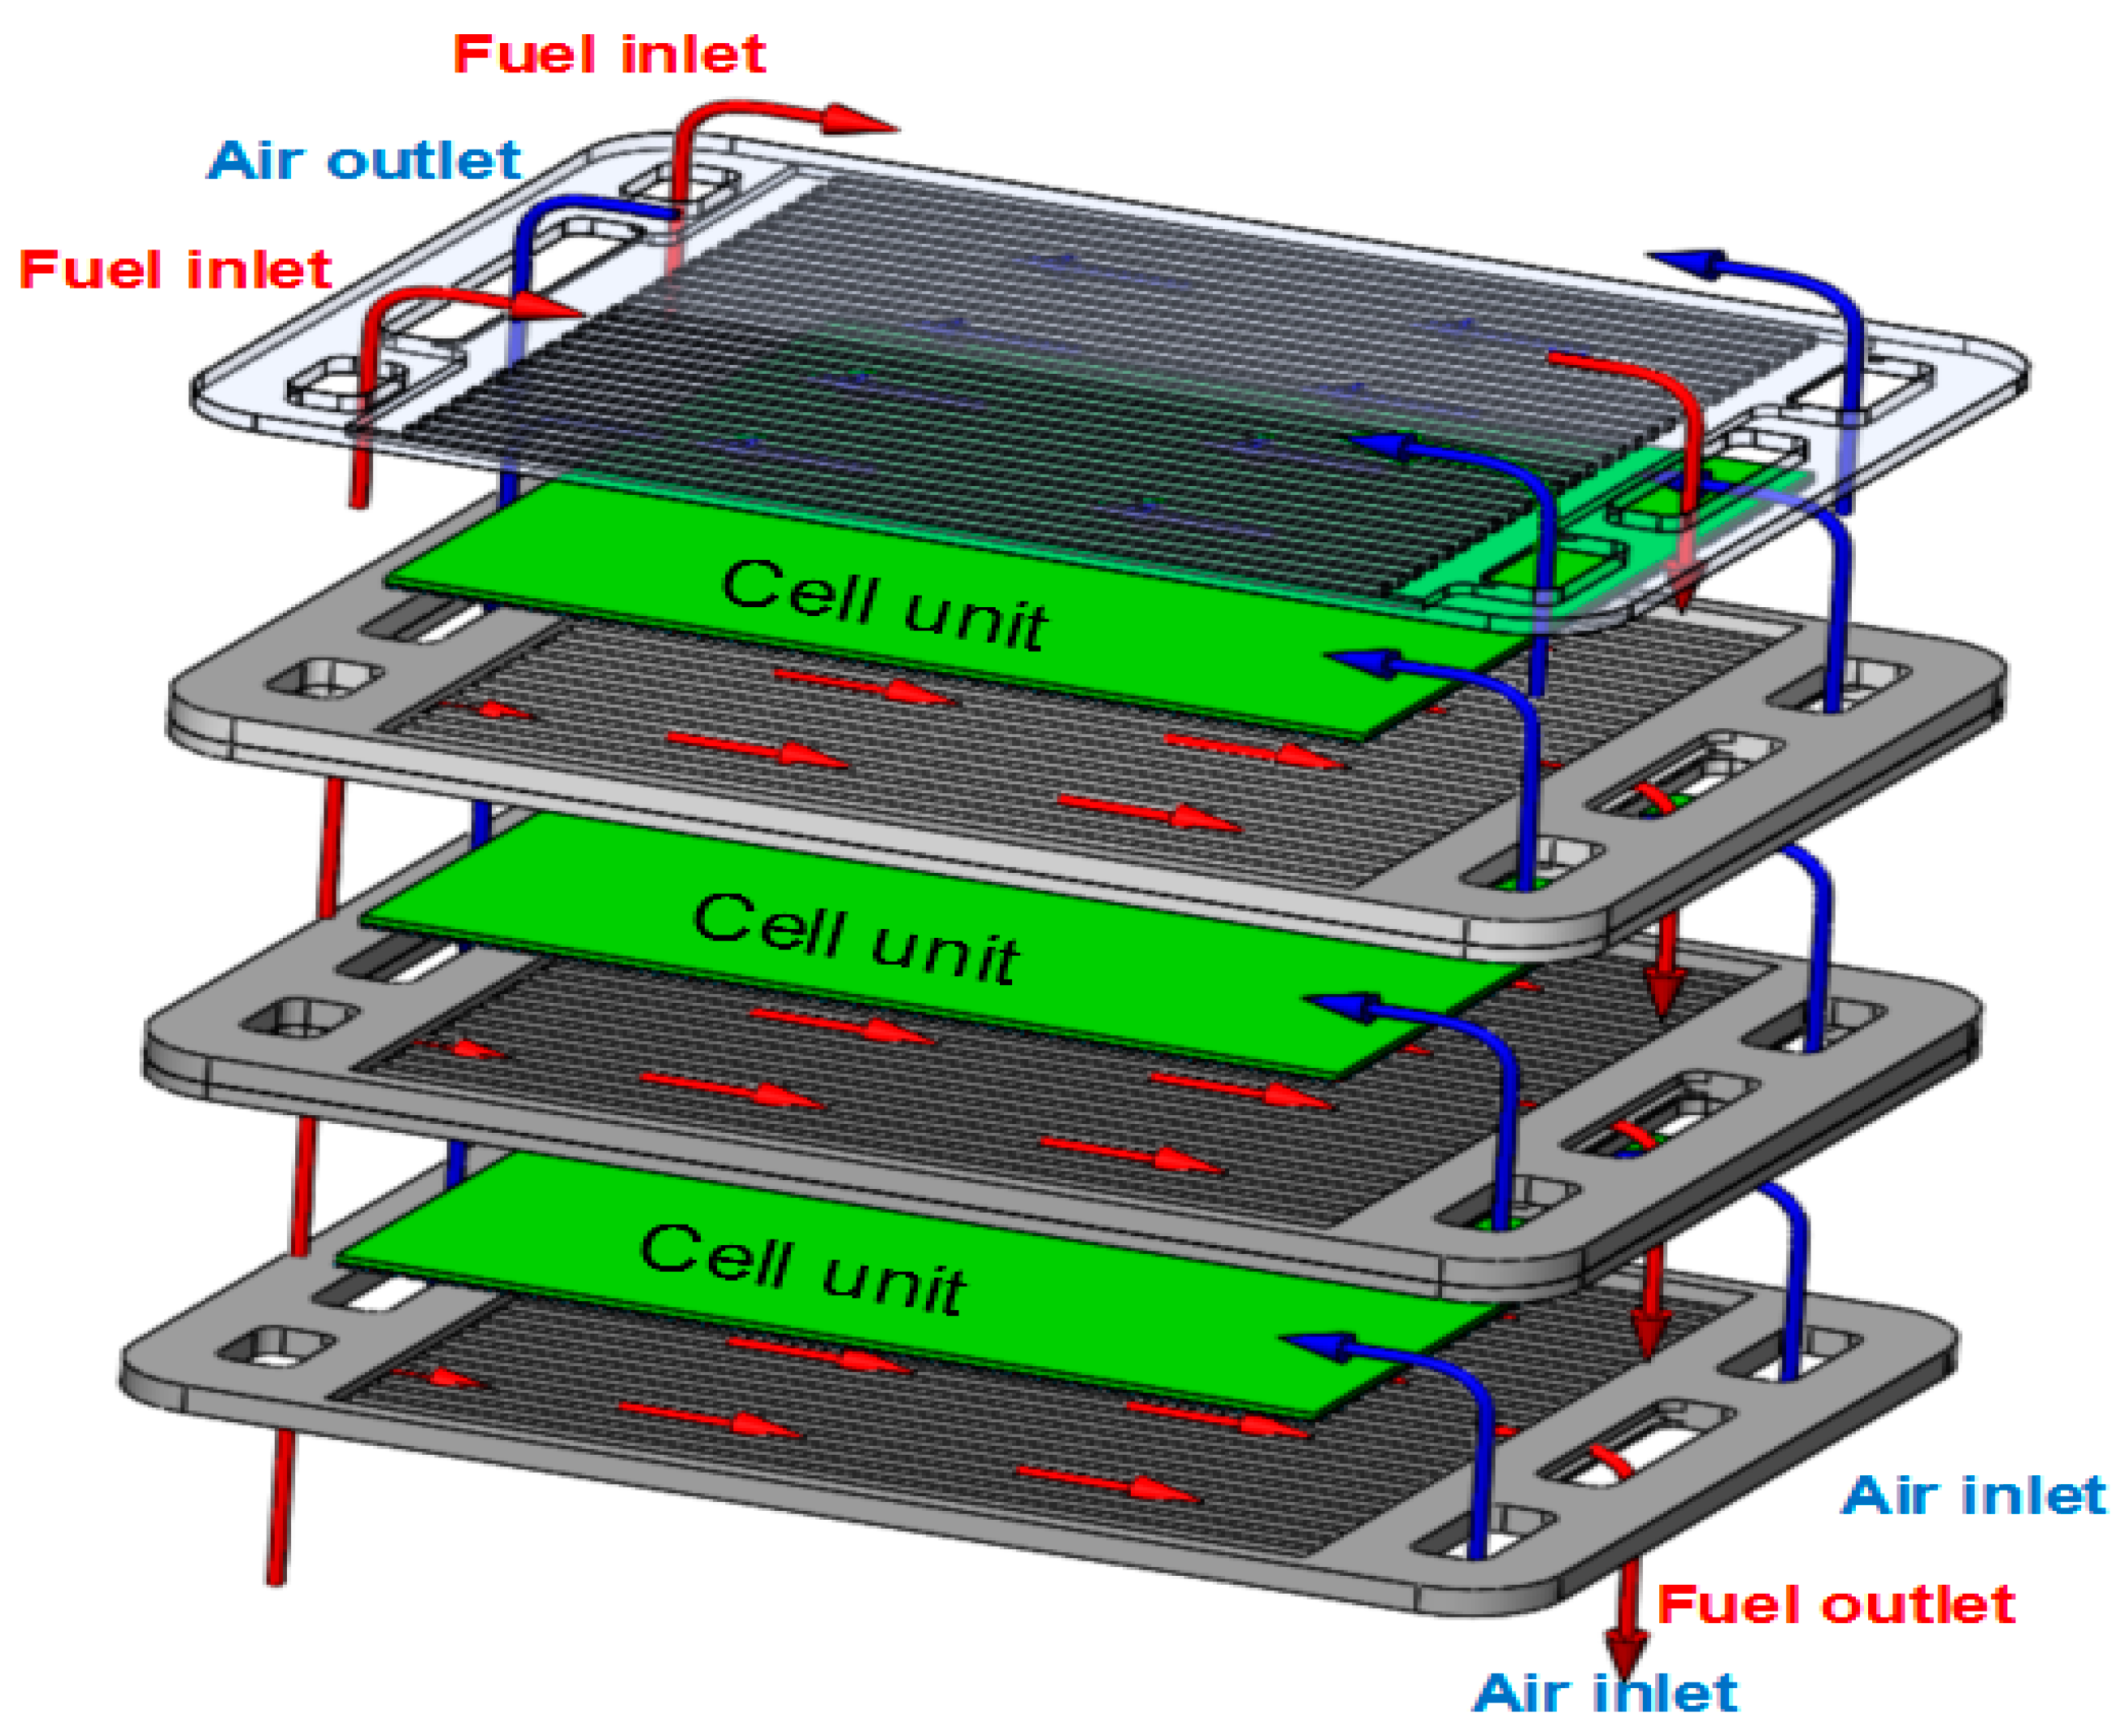
Figure 1 shows the schematic diagram of a conventional planar SOFC stack structure, designed by the German Jülich Research Center [22]. The 10-cell stack consists of solid components, porous electrodes and fuel/air flow paths. The solid parts include solid components and porous electrodes: (i) the membrane electrode assembly that includes anode support, electrolyte and porous cathode is the core component of SOFC. Chemical and electrochemical reactions are carried out in this area; (ii) the solid bipolar plate has several functions, which include connecting cell units and conducting electric current, separating the air and fuel flows, and respectively distributing the air and fuel flows over cathode and anode surfaces by solid ribs.
The fluid parts include separated fuel and air flow paths and porous electrodes. The air flow path of the SOFC consists of five flow parts: (i) inlet manifolds—used to divide the air flows into each SOFC unit and transport the remaining air to the next cell unit; (ii) the feeding header within each SOFC unit—further distributes air flow into the rib channels; (iii) rib channels—distributed over the surface of the SOFC unit to uniformly spread air flow over the cathode surface. In this case, oxygen is further transported to the electrochemical reaction sites through porous electrodes; (iv) exhausting header—collects the exhaust air flows and transport them to (v) outlet manifolds. The shape of both fuel and air manifolds in the current stack designs are rectangular (i.e., two inlet manifolds and one outlet manifold, as shown in Figure 1).
2.2. Multi-Physics Models and the Boundary Conditions
Fluent, a commercial software, is used to figure out the multi-physics coupling processes within the SOFC stack by addressing momentum, mass, energy and electrochemical conservation equations on a 3D largescale SOFC model (Figure 2).
The continuity and momentum conservation equations for the fuel/air flow paths are:
where is velocity vector of fuel/air flow. The density of mixture gas can be estimated by the ideal-gas state equation. The effective dynamic viscosity of fuel/air flow can be calculated according to the ideal gas mixing theorem:
where the dynamic viscosity of species i can be evaluated based on the Sutherland’s law:
where , , are the three reference coefficients, respectively.
For porous cathodes and anodes zones, the Brinkman equation can be used:
where is electrode porosity. Here, the porosities of both anode support and cathode current collector layers are 0.48, the anode and cathode functional layers are 0.4., and is porous medium permeability.
The mass conservation equation for each species addresses both the air/fuel flow paths and porous cathodes/anodes zones:
where is mass fraction of species i, is the corresponding effective diffusion coefficient, and is the generation/consumption rate. For the fuel/air manifolds, rib channels, anode support layer and cathode current collection layer zones, Si = 0; for the cathode function layer, however, Si should be expressed as:
where dca is the thickness of the cathode functional layer, Stot,ca is the generation/consumption rate of air flow within the cathode functional layers, and iop is the average operation current density.
For the anode function layer, source term Si can be expressed as:
where dan is the thickness of the anode functional layer, and Stot,an is the generation/consumption rate of fuel flow within the anode functional layers.
Energy conservation equation for the porous electrodes and fuel/air flow paths:
where is the specific heat capacity of mixture gas, is the effective thermal conductivity, is the change of enthalpy caused by species diffusion, is the energy change caused by viscous resistance, is the momentum tensor, and is the heat source term. For the cathode and anode function layer, the heat source term can be expressed as:
For the other parts of the model, . Vop is the output voltage of each single cell. While T = 1073.15 K, the molar enthalpy of the electrochemical reaction H2 + 0.5O2 = H2O is = 22,865.6 J mol−1.
The energy conservation equation for the solid parts (electrolytes and bipolar plates) is expressed as:
where is the surface area of electrolytes/bipolar plates; and is the thermal conductivity of electrolytes/bipolar plates. The detailed thermo-physical properties of the corresponding solid material in the electrolyte and bipolar plate areas are illustrated in Table 2.
Different boundary conditions for the multiphysics modeling are given in Table 3. For the momentum conservation equation, the inlet velocity boundary conditions for the entrances of the fuel and air inlet manifolds should be respectively estimated by:
where N = 10 is the SOFC unit number of the stack, Aact is the active area of each SOFC unit, F is faraday constant, and are the utilizations of fuel and air flows, respectively; and and are the total cross-section areas of the air and fuel inlet manifold entrances, respectively. The outlet manifolds are extended with a proper value to avoid the backflow phenomenon around the manifold outlets zones.
2.3. Mesh and Calculation
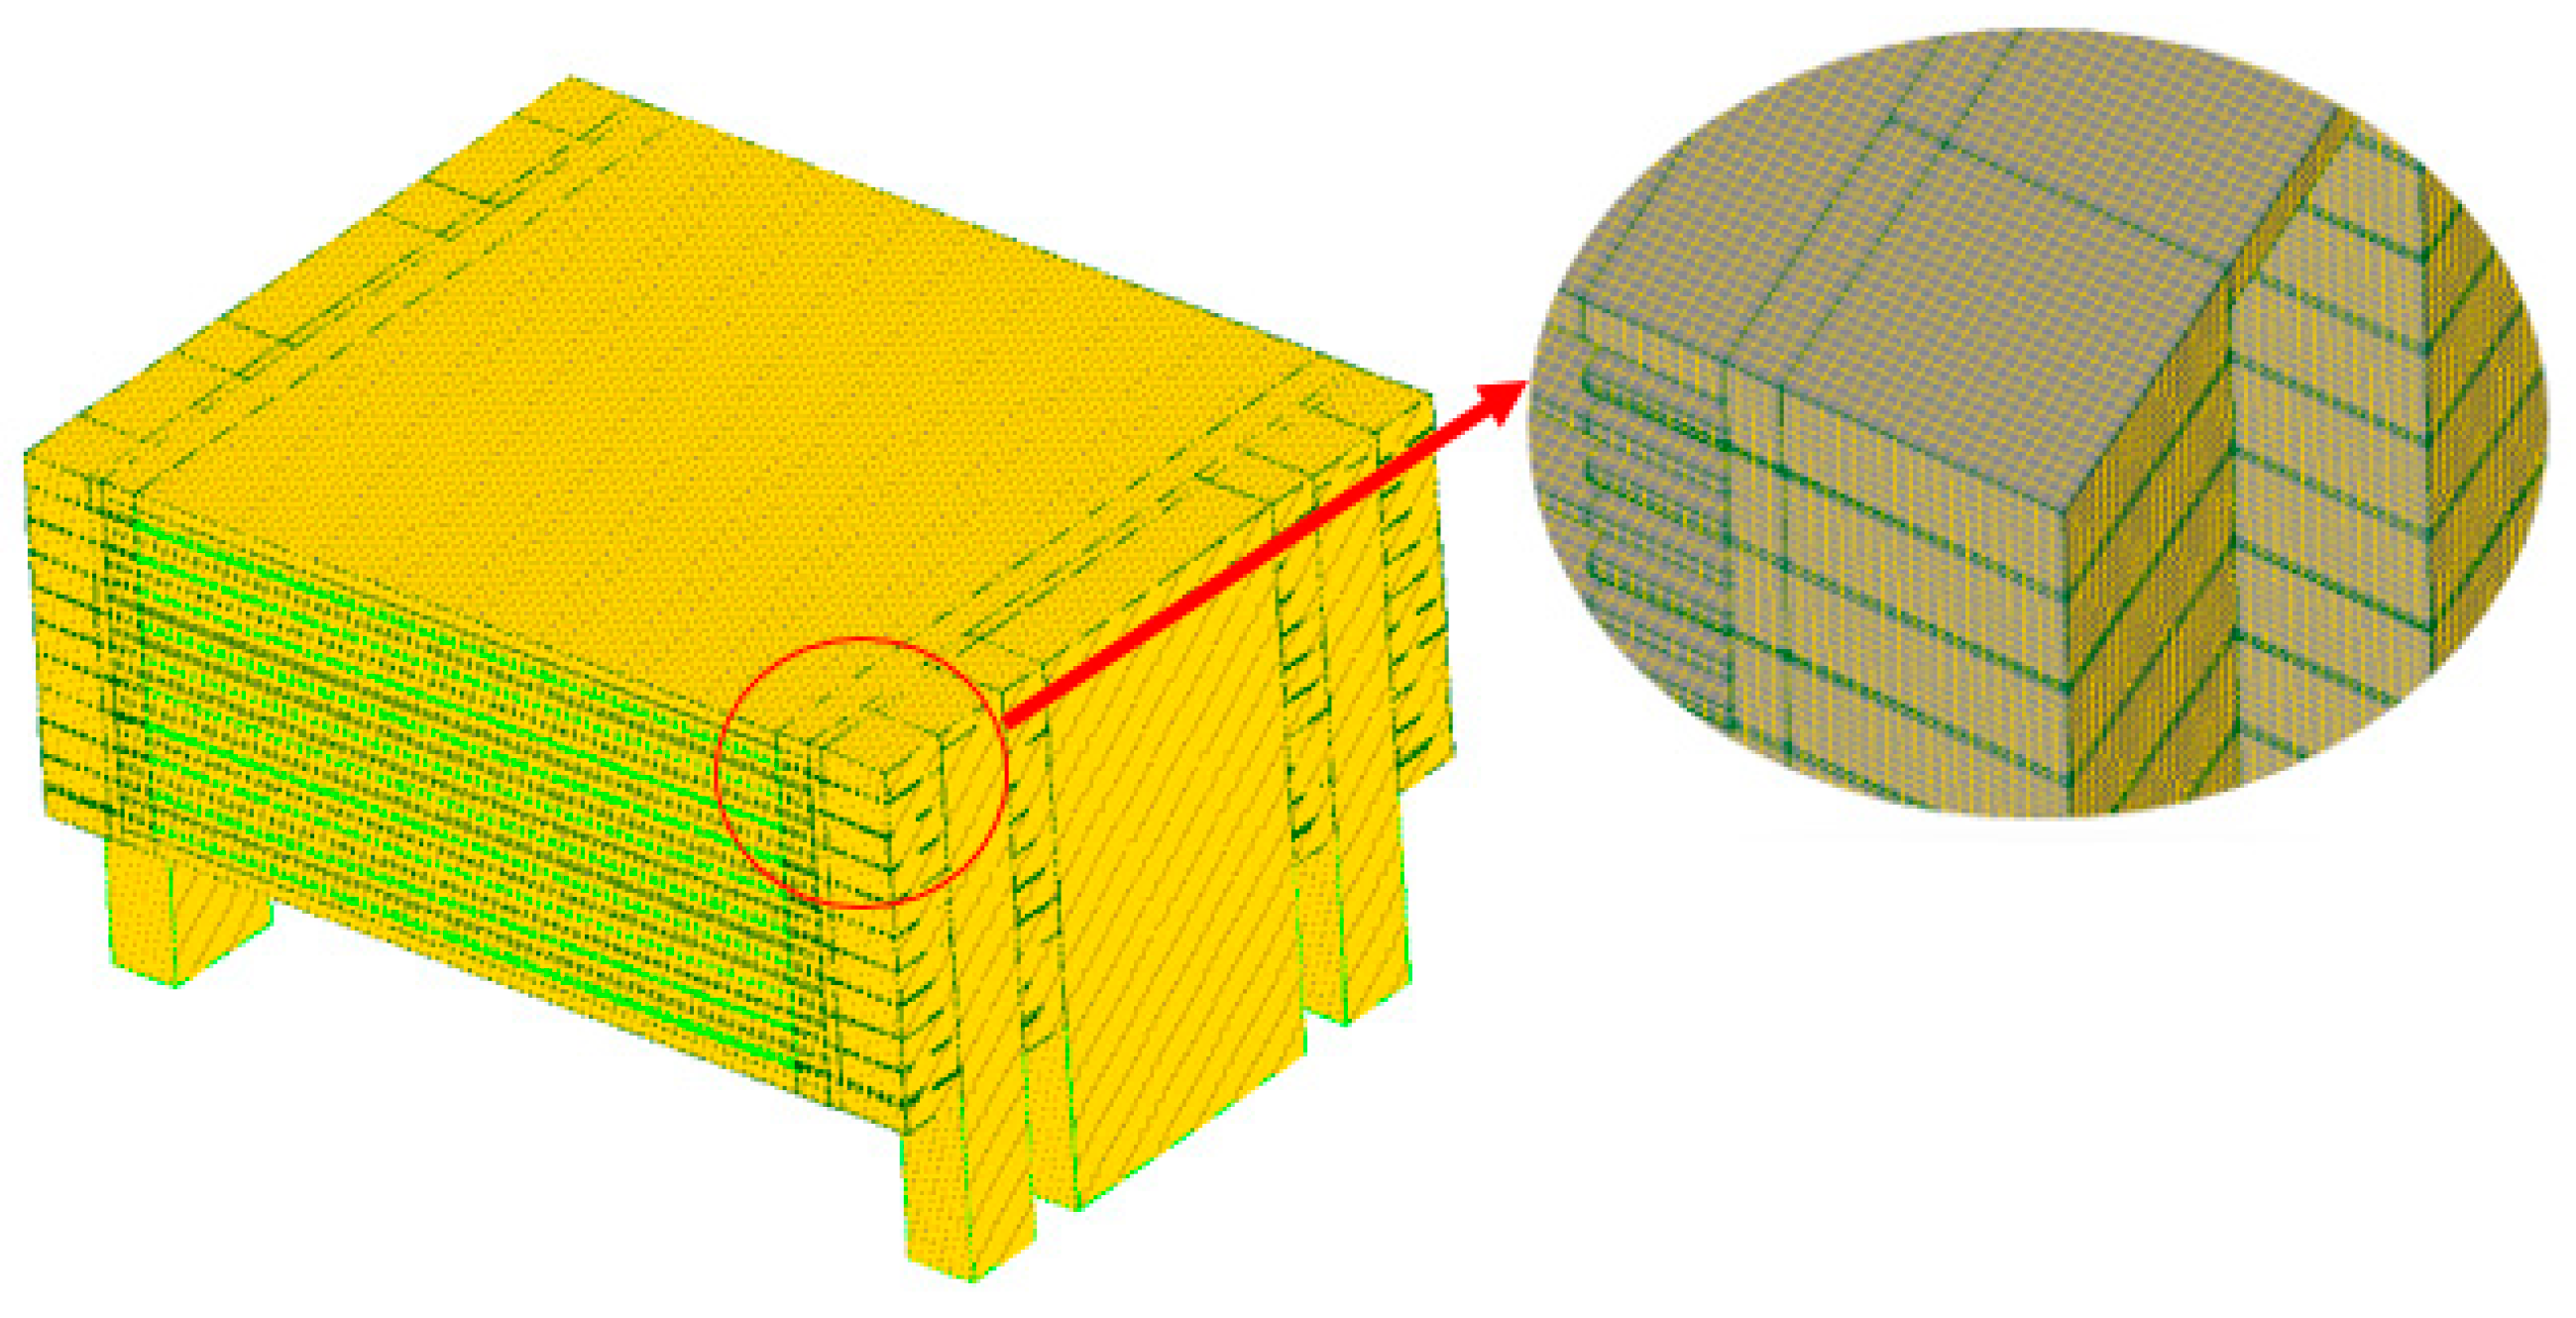
Mesh quality is of great importance in accurate 3D large scale model calculation. Figure 3 shows the mesh details for this model. Hexahedron meshes are used in the structured grids, and there is no mesh distortion or excessive aspect ratio in the model. The multi-physics equations mentioned above are coupling solved (based mainly on the finite volume method) by commercial software Fluent and C++ code with relative toleration convergence converge criteria 1 × 10⁻⁶. It is important to note that although this largescale and multi-physics model is developed on the basis of the 10-cell stack design shown in Figure 1, it can also be applied to other planar SOFCs with different configurations, cell numbers, and parameters.
3. Results
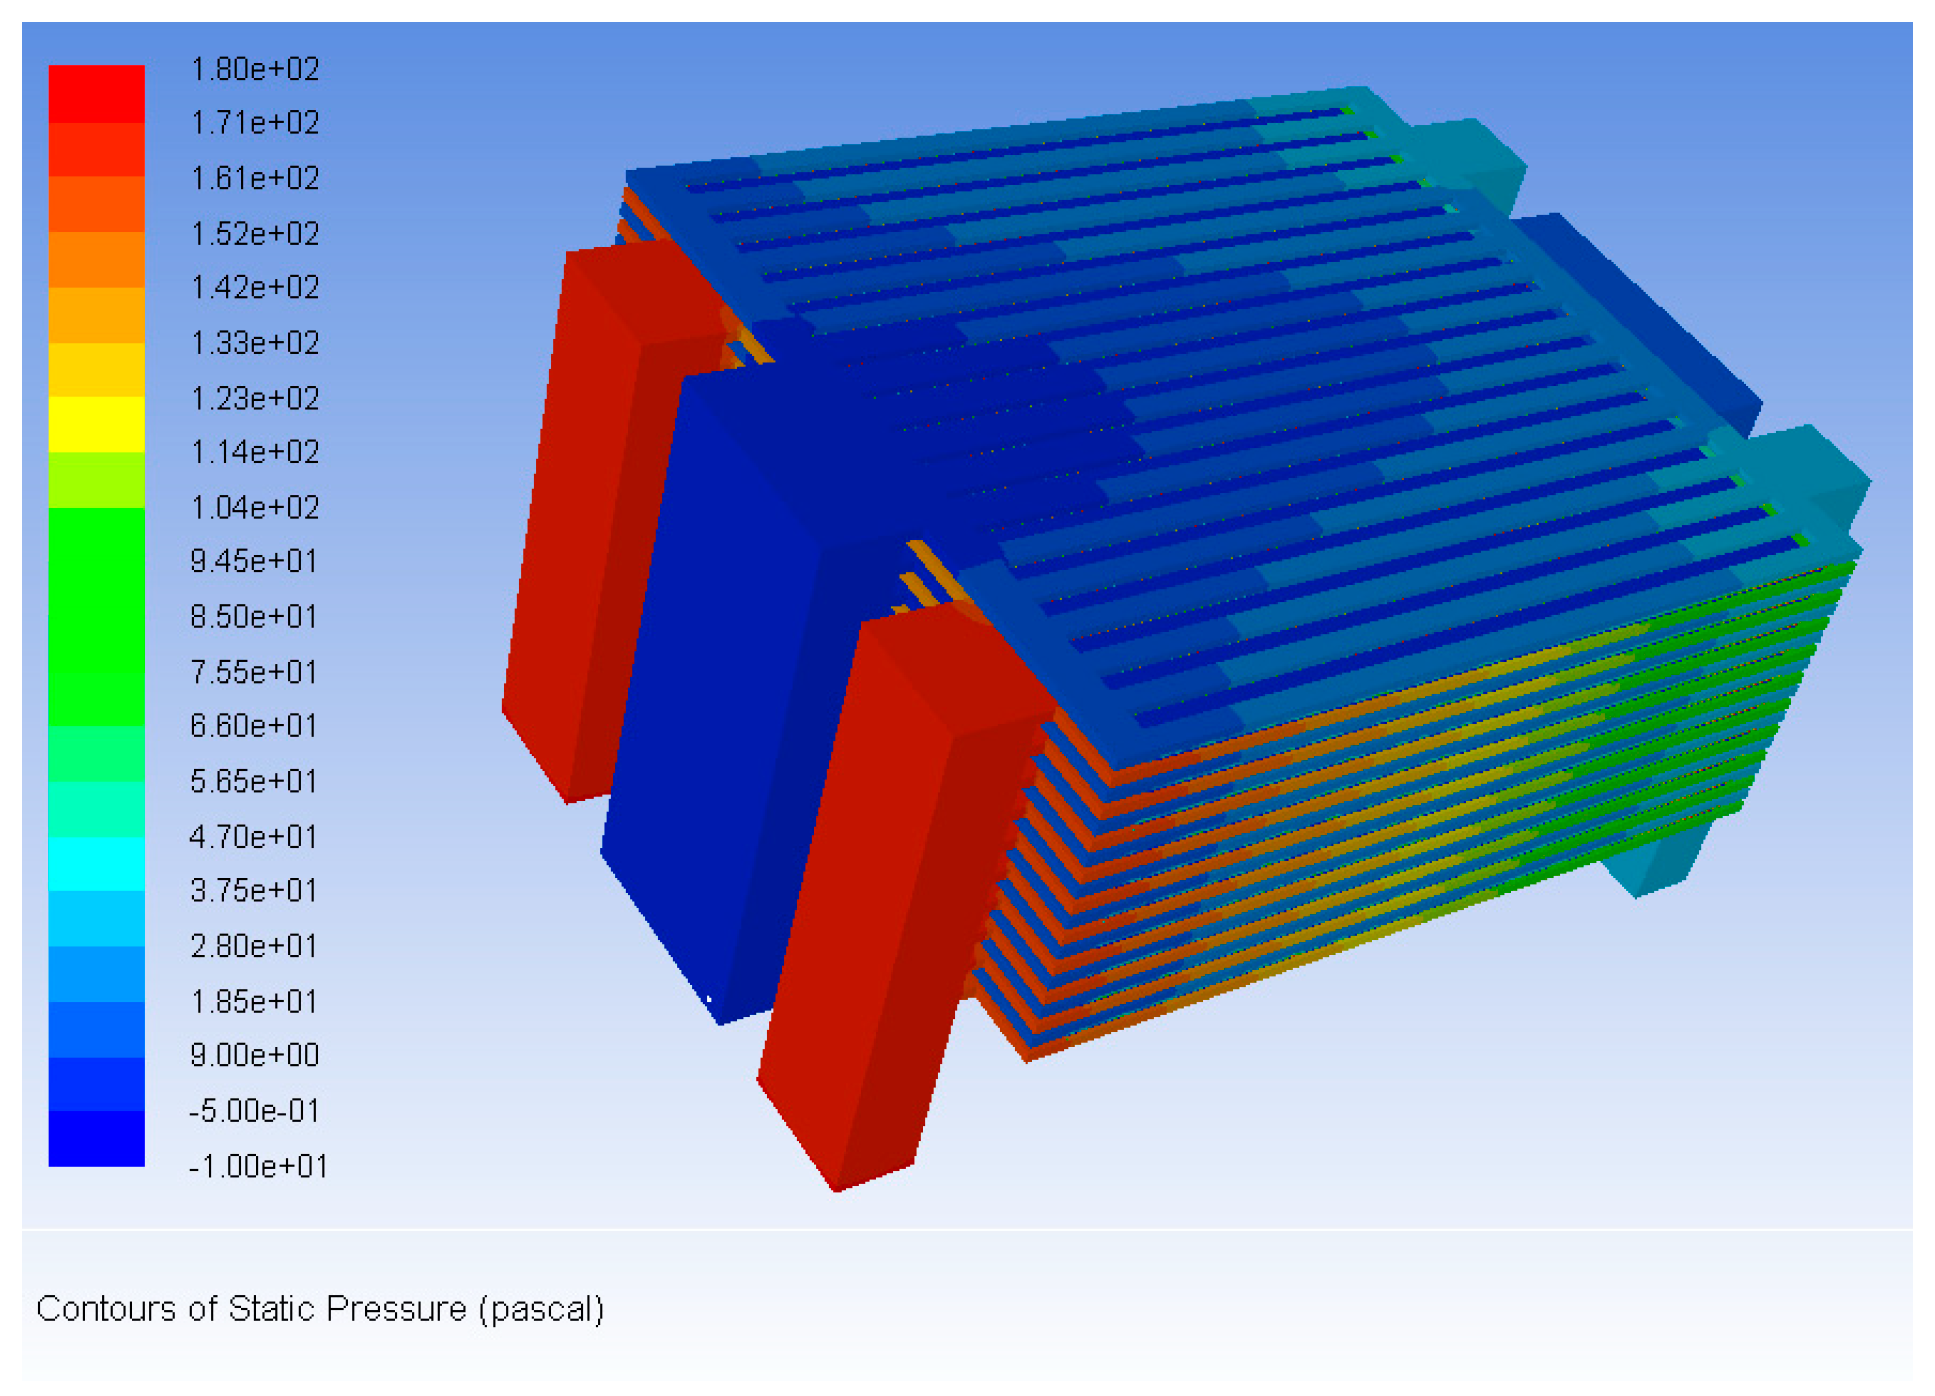
Figure 4 shows the 3D static pressure distributions within both fuel and air flow paths of the 10-cell planar stack. The static pressure within the fuel flow path is smaller than that within the air flow path due to the relatively higher air mass flow rates supplied to the stack. Furthermore, there are relative uniform pressure drops differences among the piled SOFC cells. is defined as the static pressure drop in each SOFC unit. This means that there is relative uniform airflow feeding rates in the piled SOFC units, while a small-scale cell number is adopted (i.e., N = 10 in current design). This result is consistent with both the experiment [23] and 3D calculated result based on the half SOFC stack [20].
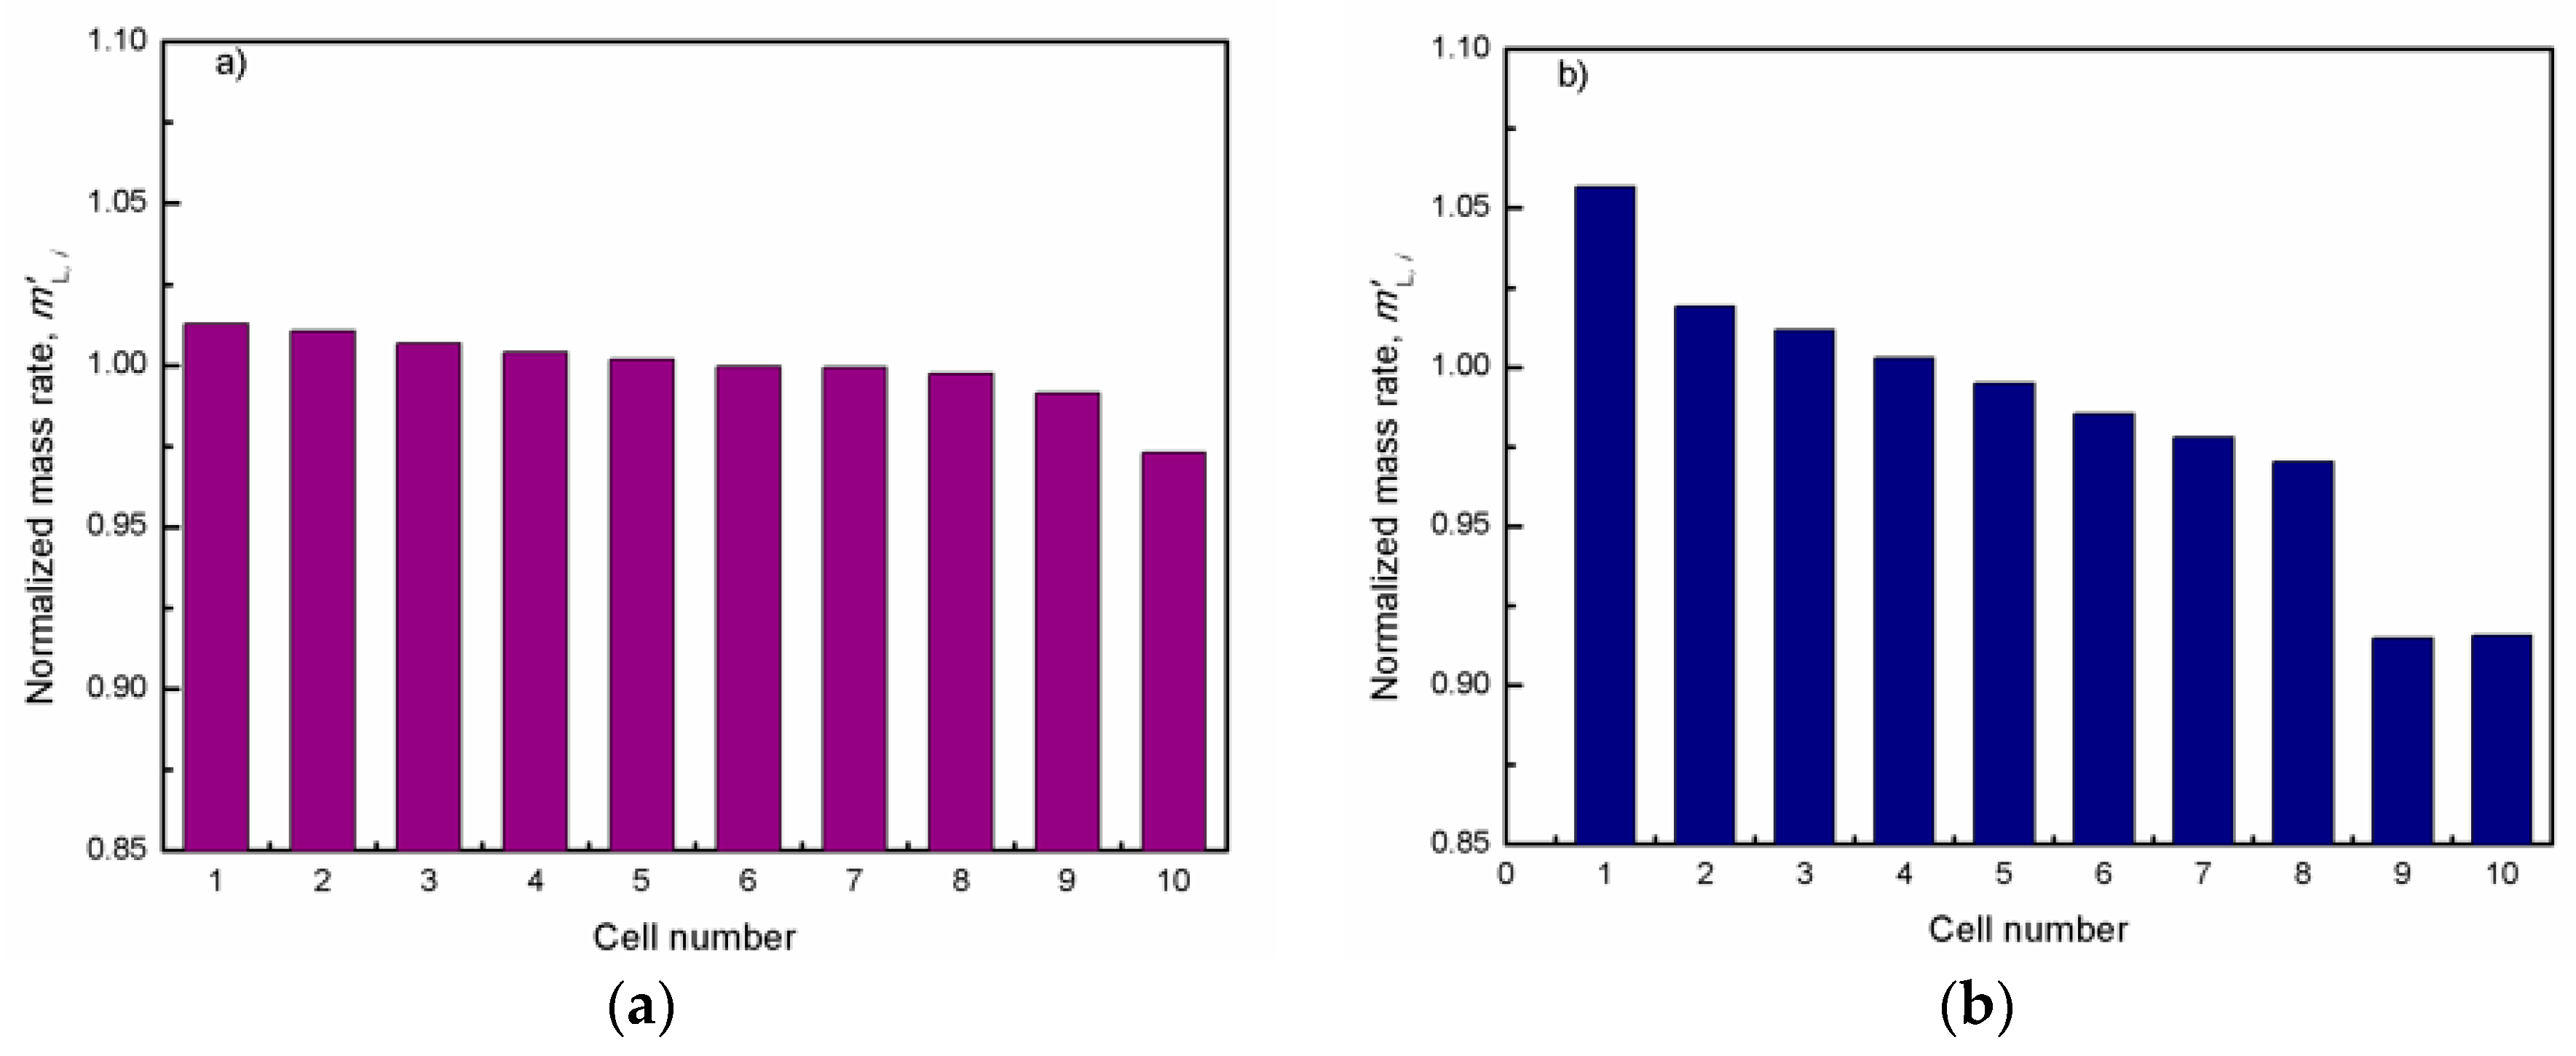
In Figure 5, the normalized fuel and air mass flow rates fed to each SOFC units, , are displayed. The corresponding cell number indexes are indicated in Figure 2. is the fuel (or air) mass flow rate obtained by the i-th SOFC unit. Normalized items help compare the performances of different SOFC stacks when different structure designs or operation parameters are adopted. When the SOFC cell unit is connected in a series, the minimum intake flow corresponding to the average mass flow rate is considered as the “stack uniformity index”, , which is used to characterize the flow distribution quality on a stack level.
For fuel distribution quality at stack level, the normalized mass flow rate of fuel flow fed to each SOFC unit monotonously decreases with increasing SOFC number; this trend is not obvious, and the difference between the layers is similar. Similarly, the normalized mass flow rate of airflow fed to layer 9 is significantly lower than that of the other layers; layer 10 is slightly higher than that of layer 9. However, it is necessary to mention that both the stack uniformity indexes of air and fuel flows (i.e., and ) are above 0.9. This is beneficial for the normal operation of SOFC, especially the small scale of the cell numbers (i.e., N = 10 in current design).
In addition to air/fuel flow distribution qualities at a stack level, the distribution qualities of fuel and air mass flow rates among the rib channels on a cell unit level also have a great effect on SOFC stack performance. Because the rib channels on the SOFC unit surface are arrayed in parallel, ensuring similar distribution of gas flow rates among the rib channels is essential for uniform electrochemical degradation induction on each SOFC unit surface and to further extend its duration.
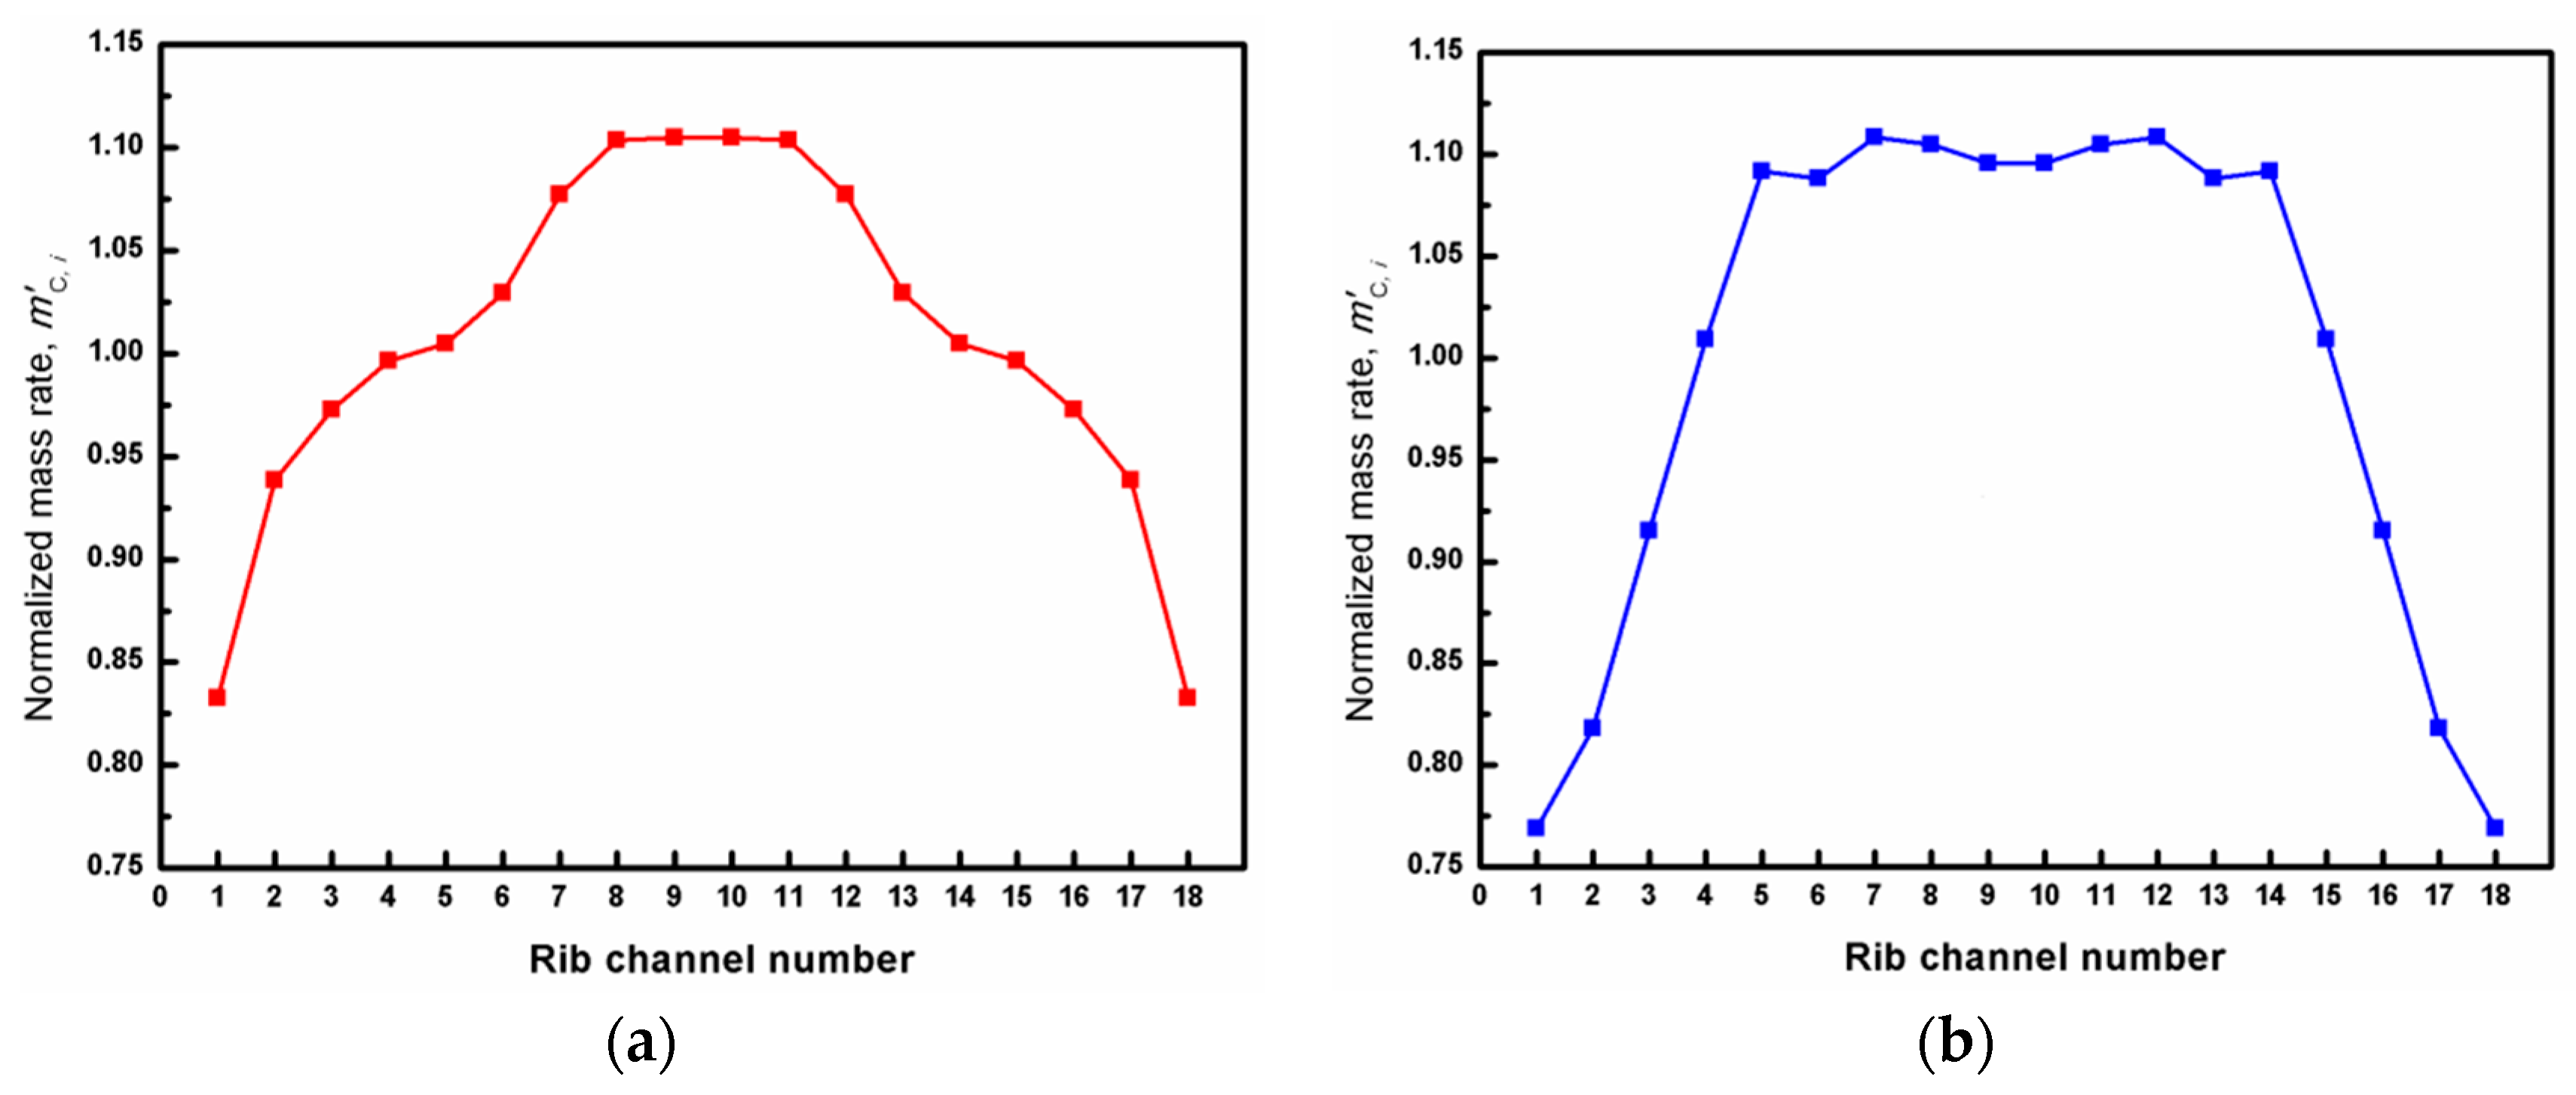
Taking the 5-th SOFC cell unit as an example, Figure 6 shows the normalized fuel and air mass flow rates, , distributions within the anode and cathode rib channels, respectively.is the mass flow rate flows through the i-th channel. As indicated in Figure 2, Nc is the total number of rib channels. It can be seen from the fuel flow channel that the fuel mass flow rate is symmetrically distributed within the rib channels. The smallest appears at the extreme ends of each cell unit, the minimum value is 0.83; and the maximum fuel flow rates appear around the rib channels of 8, 9, 10 and 11-ths. These results are well supported by the fluid dynamics analyzing results presented by the author of [19].
Similarly, the normalized mass rate of air flow obtained by the rib channels is symmetrically distributed. The normalized mass flow rate is the smallest at the extreme ends of the single cell, the minimum value is 0.76, and the peak value is distributed around the zone of 5-th to 14-th rib channels. Both show such a distribution trend, because the fluid resistance of the rib channels corresponding to the outlet manifold is the smallest, and the flow resistance in the first and ten rib channels away from the outlet manifold is large. In comparison, the peak flow width in the air flow channels is significantly larger than the fuel flow channels, which is related to the size of the outlet manifold; the fuel outlet manifold width is 30 mm, and the air outlet manifold width is 44 mm. Thus, we derive that the fuel and air flow distribution qualities of both stack and SOFC unit levels are accepted for current stack geometric and operation parameters.
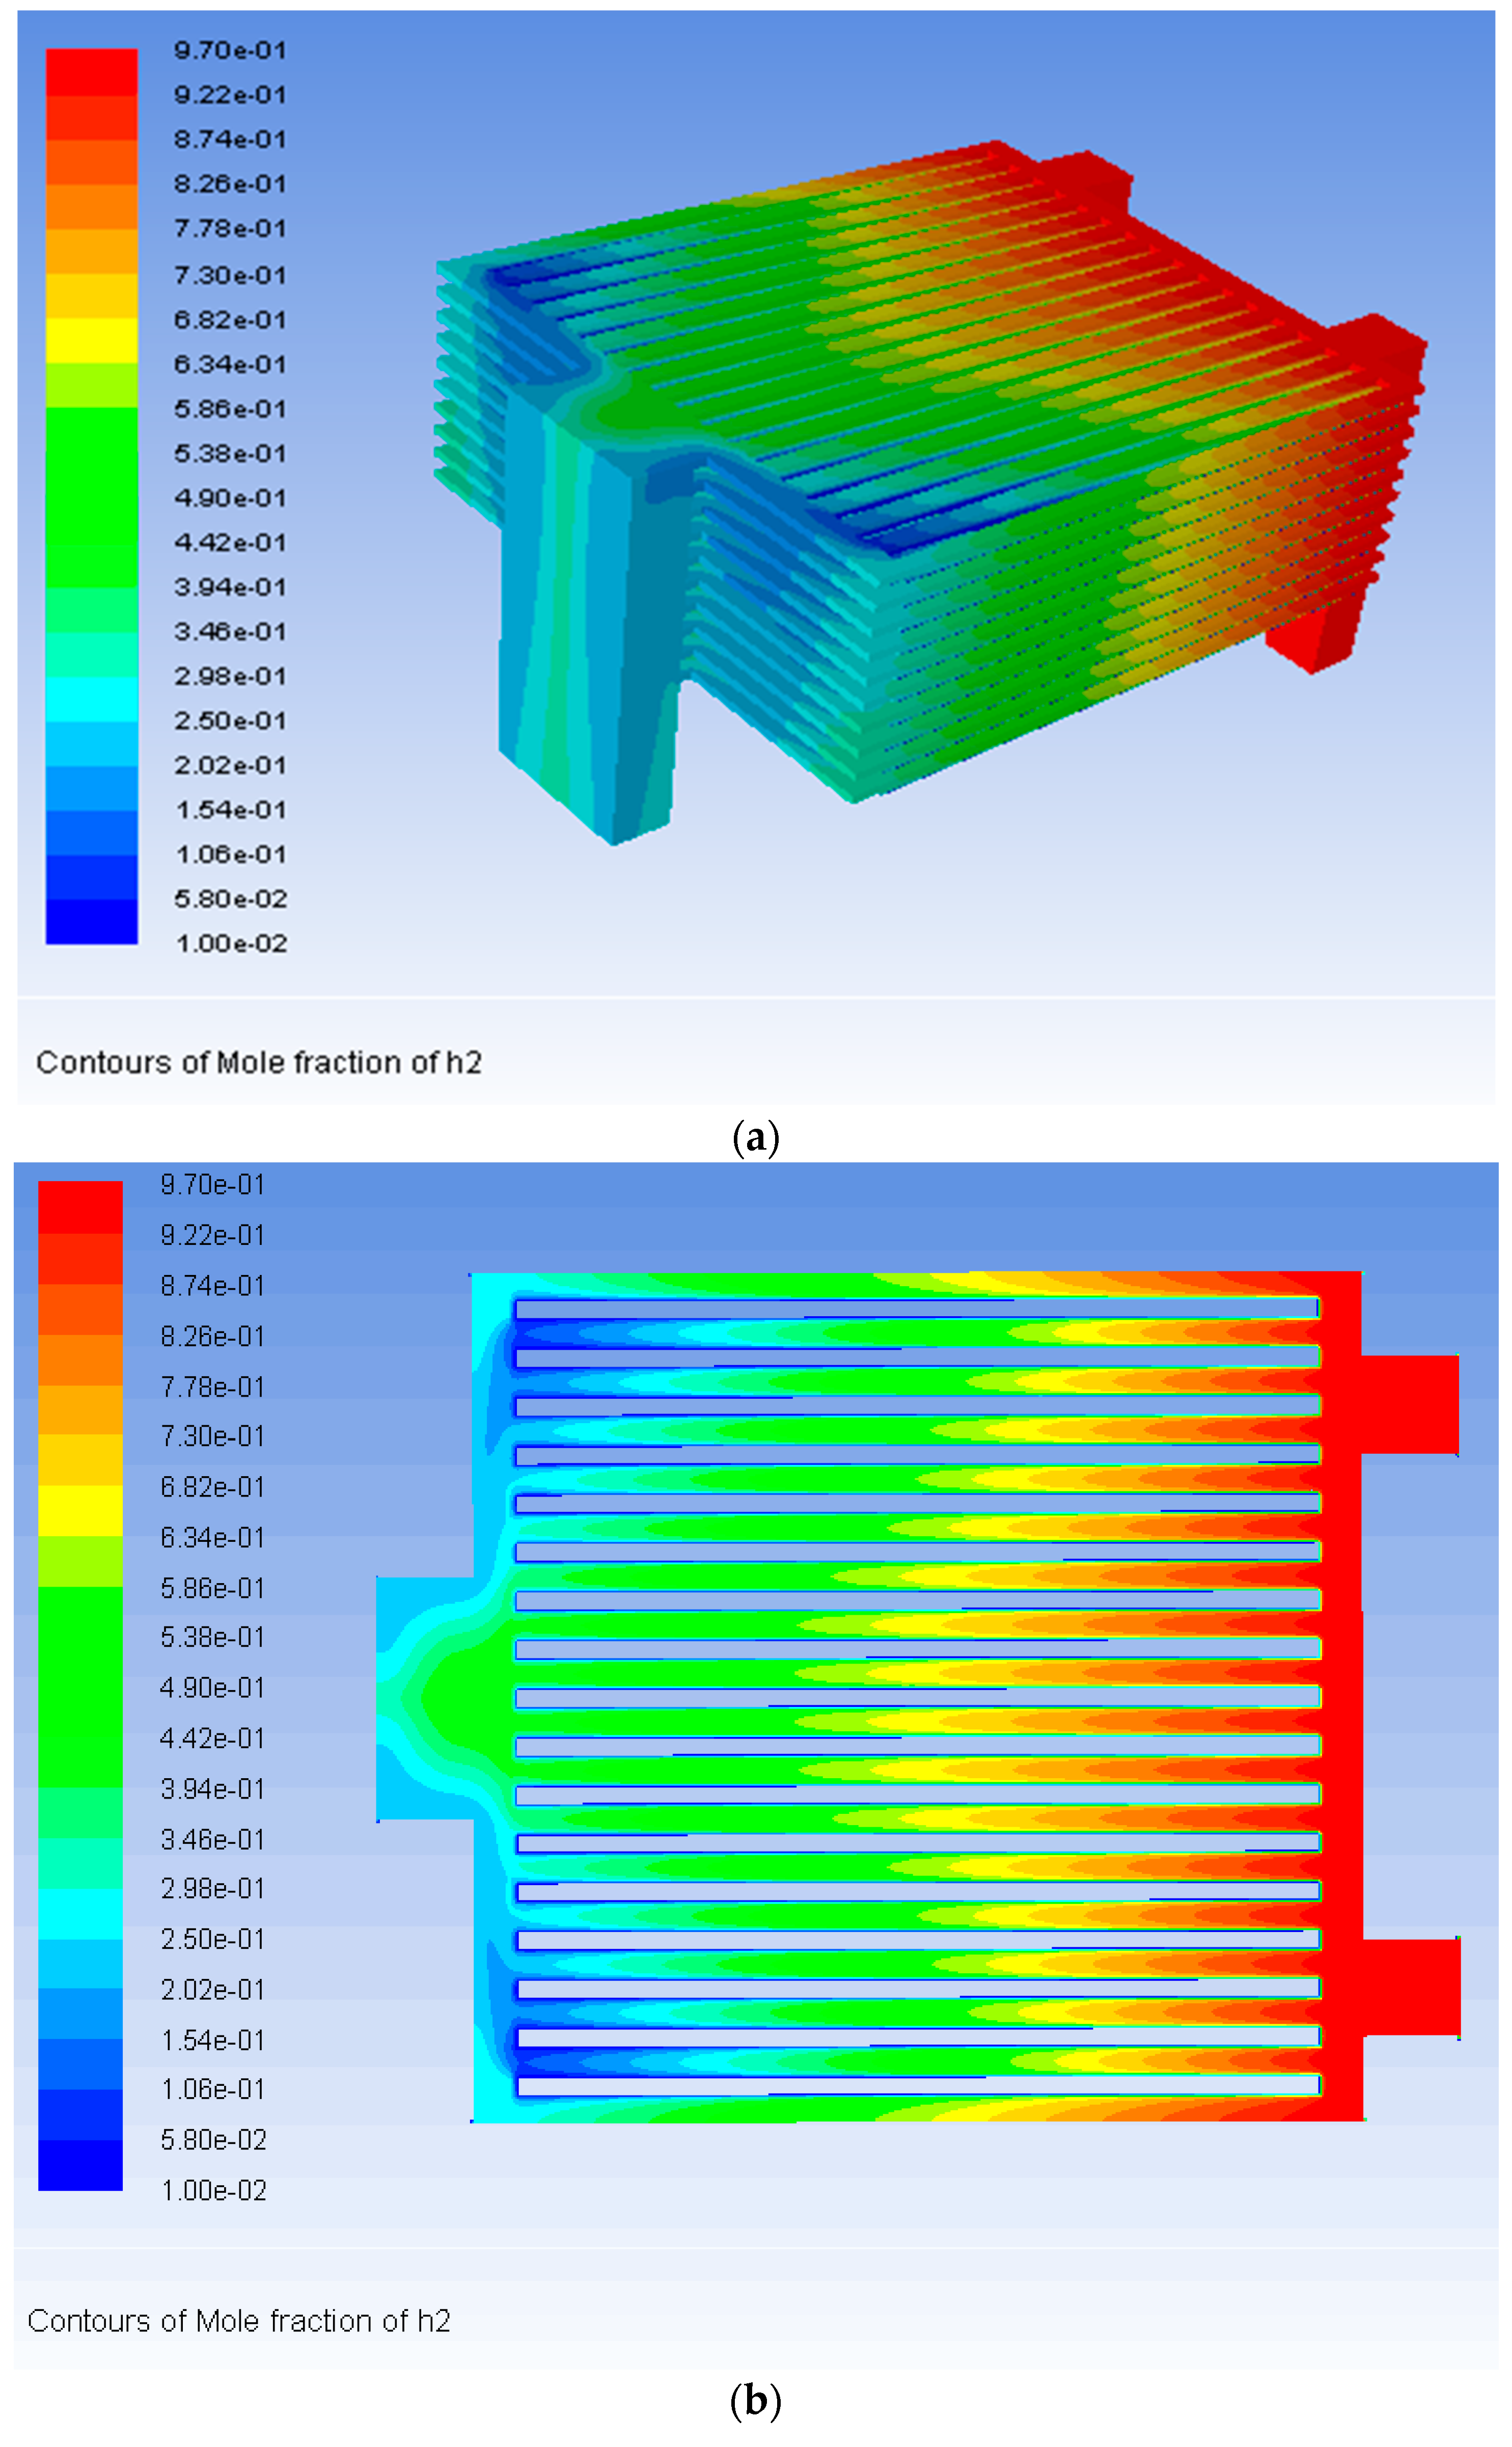
Figure 7a,b shows the hydrogen mole fraction distribution characteristics within the 10-layer SOFC stack, among the rib channels of 5-th cell unit. The hydrogen distribution within the flow channel appears to be “U-shaped”. In the same section, the hydrogen concentration in the rib channels corresponding to the outlet manifold is significantly higher than the two sides. Figure 7c further shows H2 mole fraction distribution characteristics over the anode-electrolyte interface of the 5-th cell unit. On comparing Figure 7c and Figure 7b, we conclude that the distribution of H2 mole fractions on the anode-electrolyte interface is consistent with the distribution trend within the rib channels. Even in the rectangular rib channels, the influence of the solid ribs on the H2 transport within the porous anode is negligible.
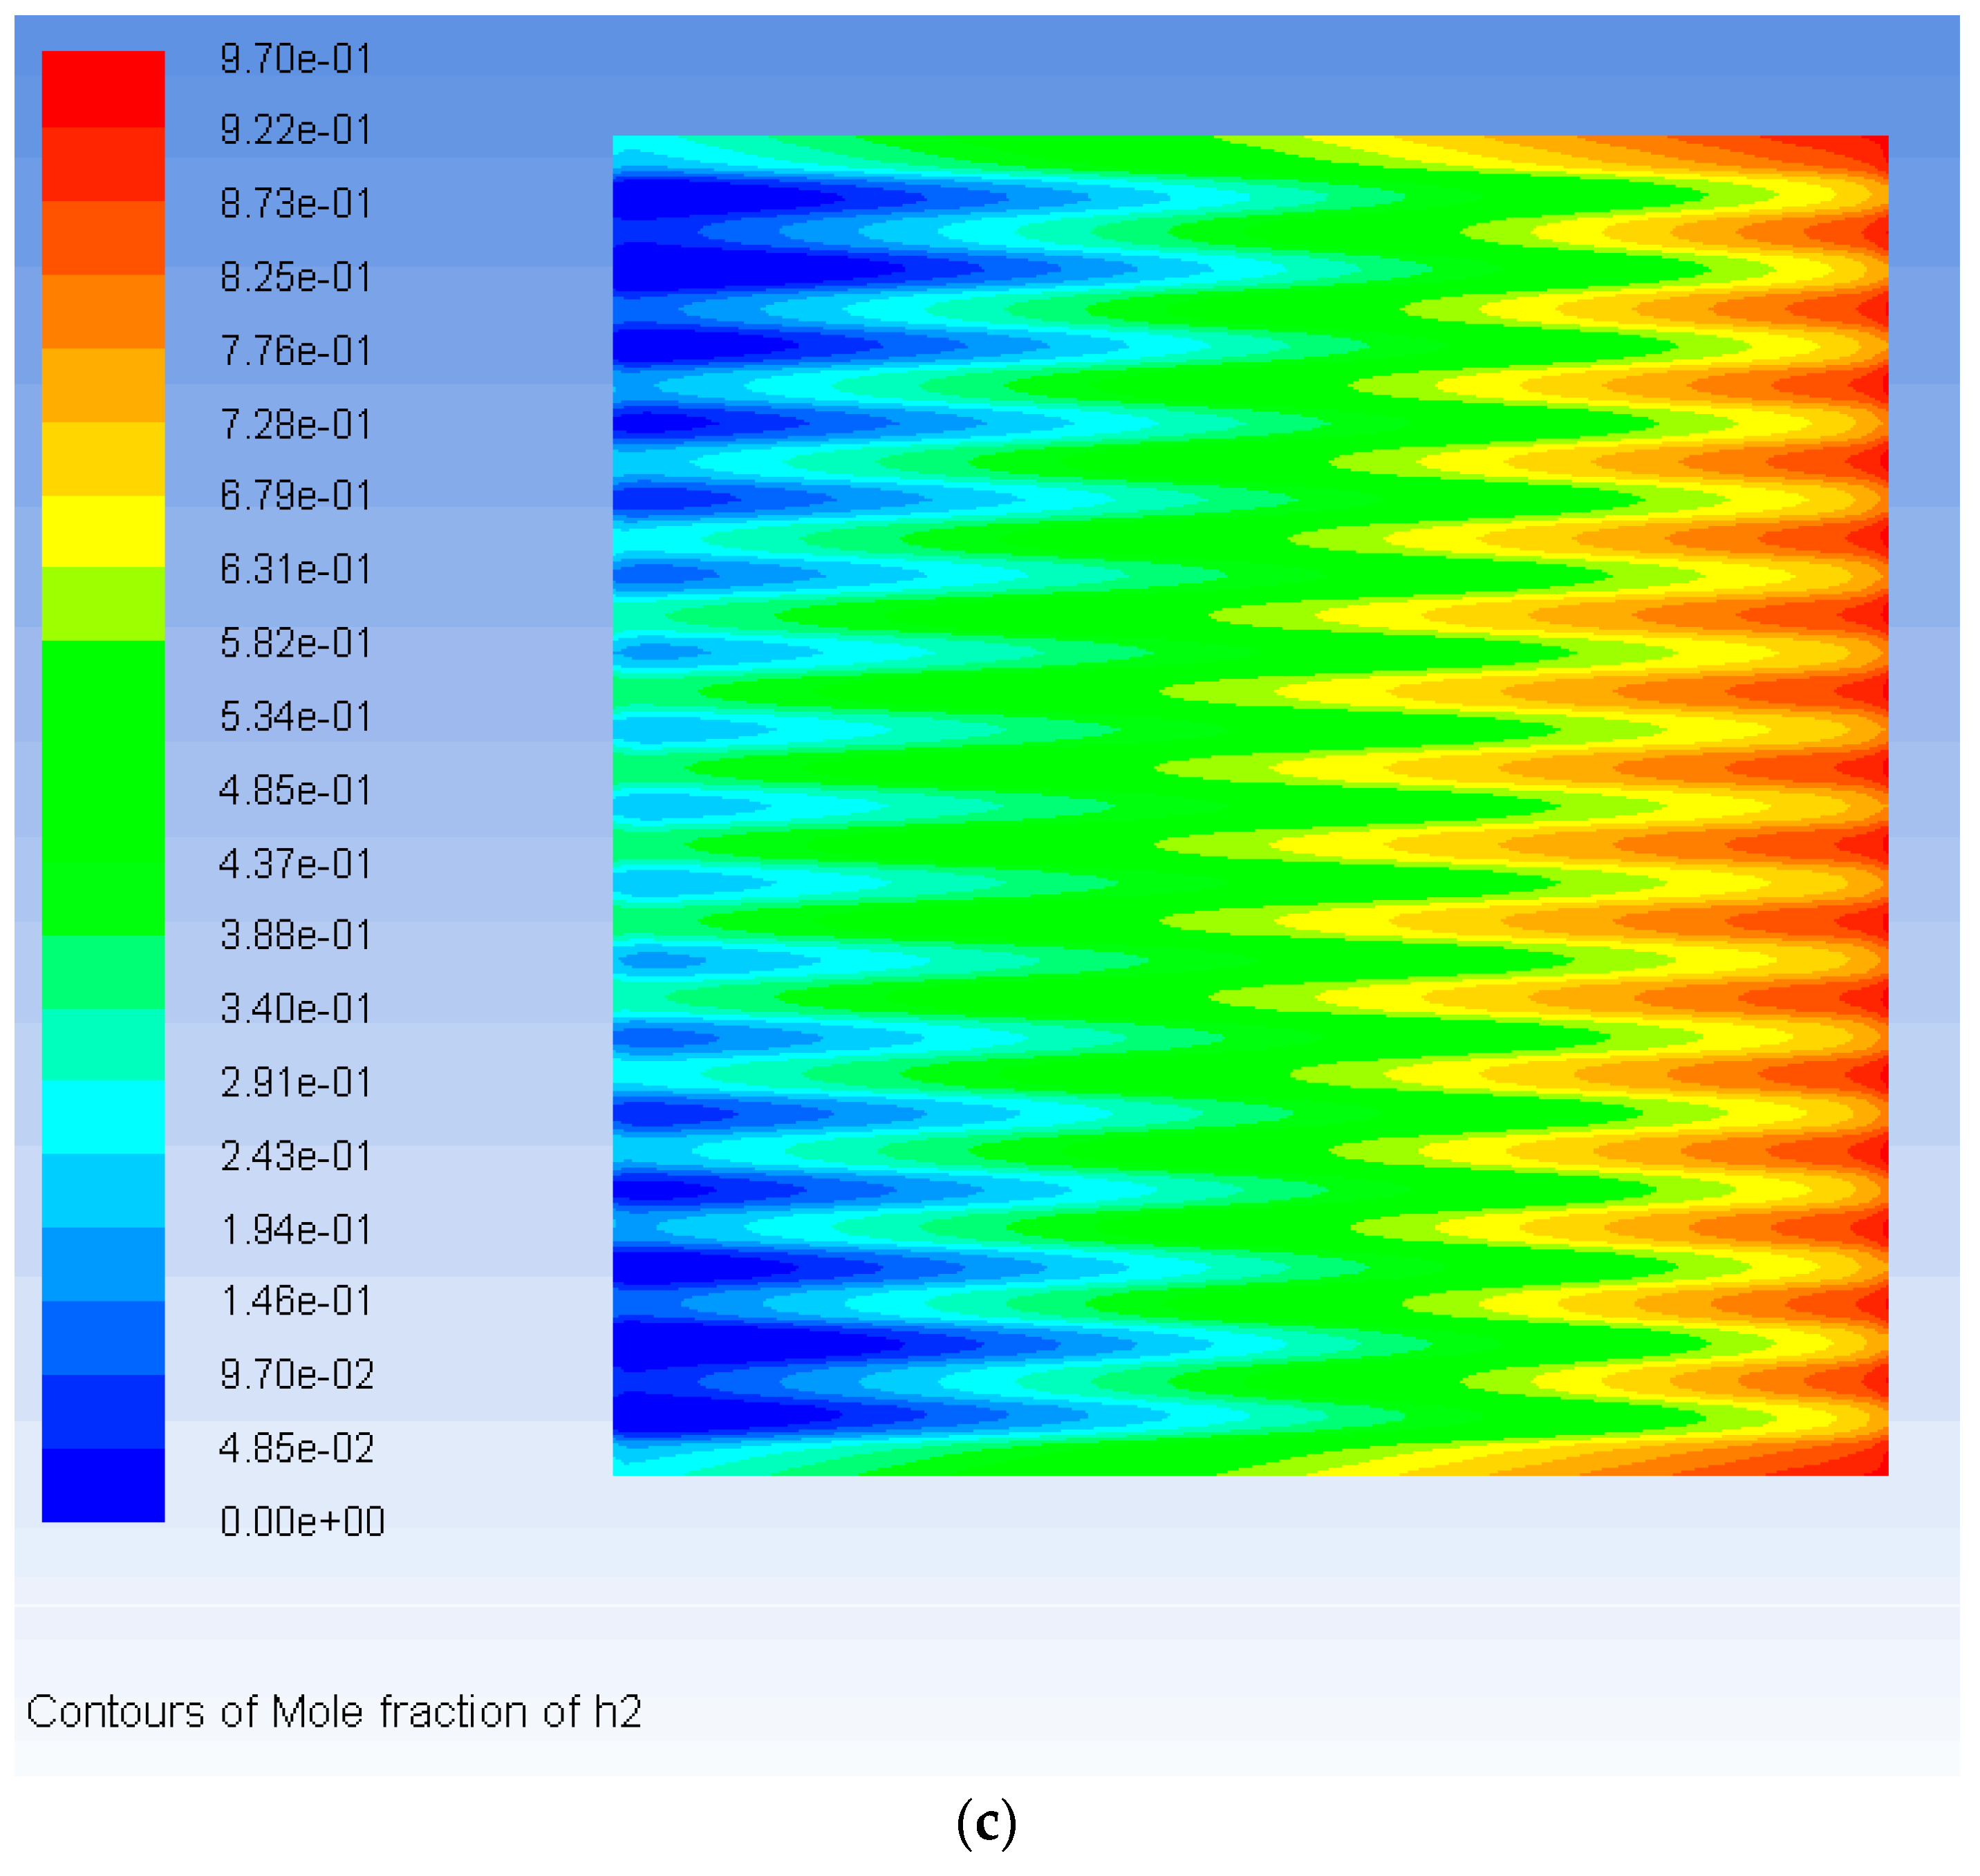
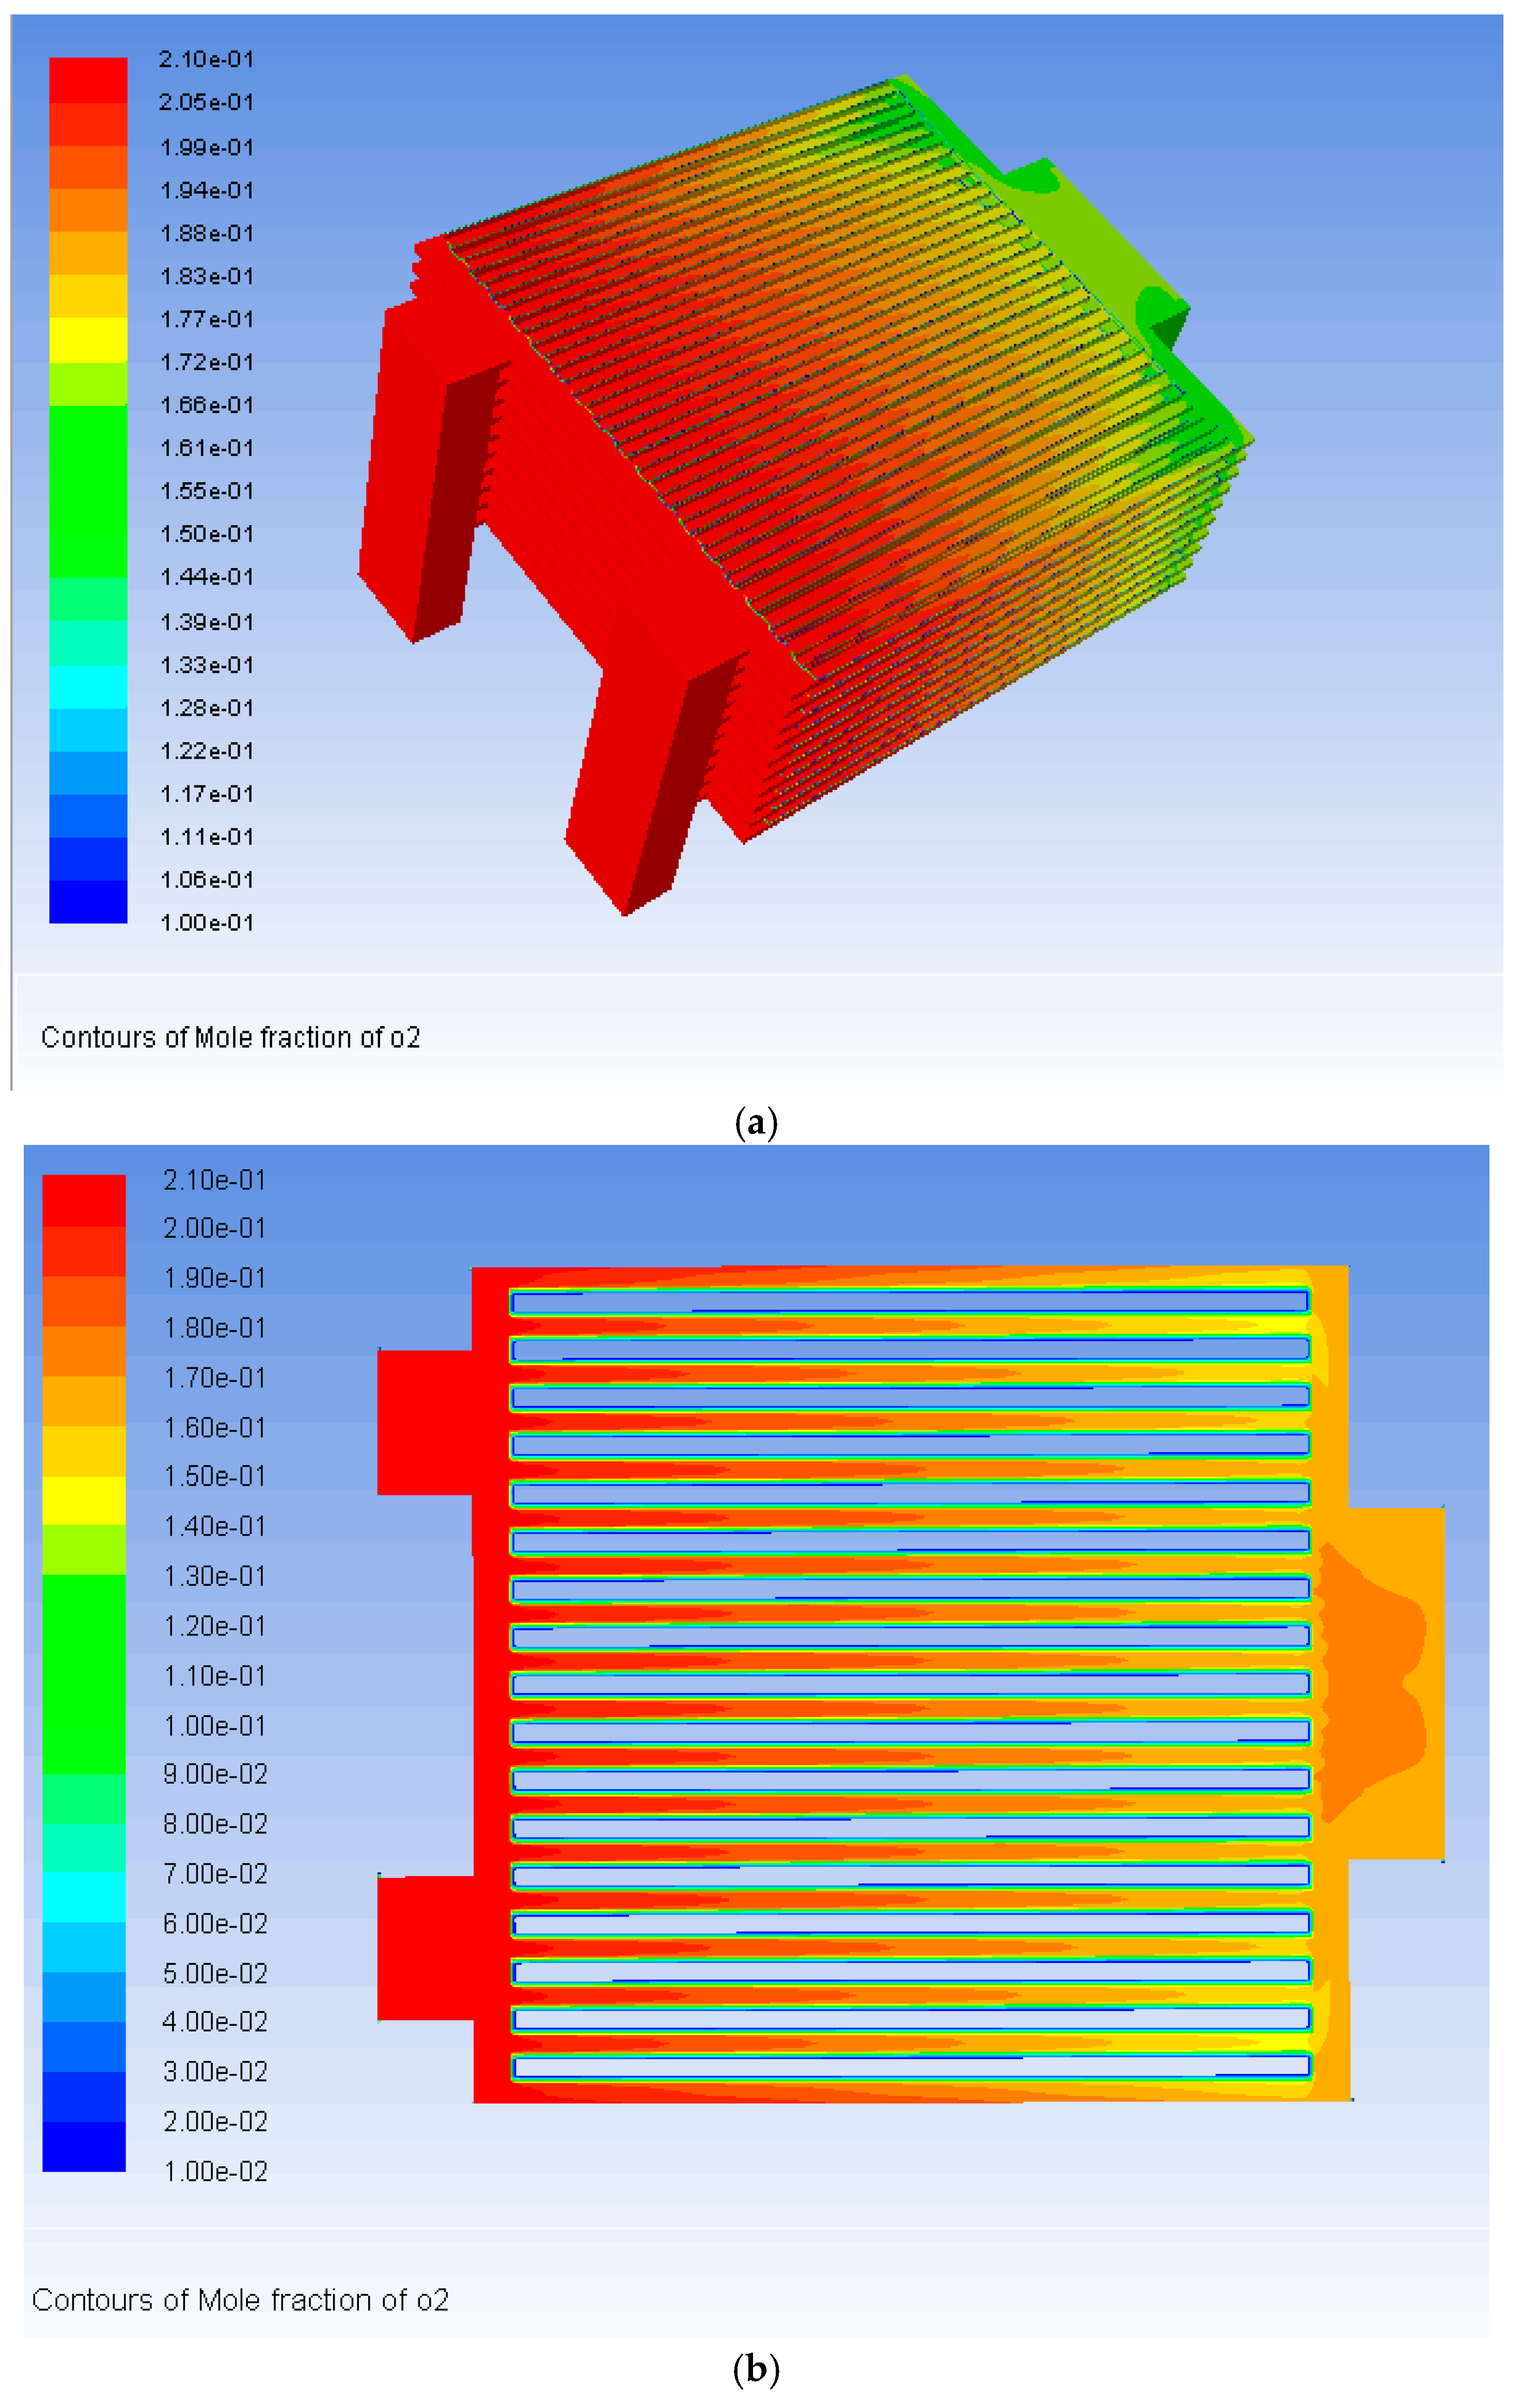
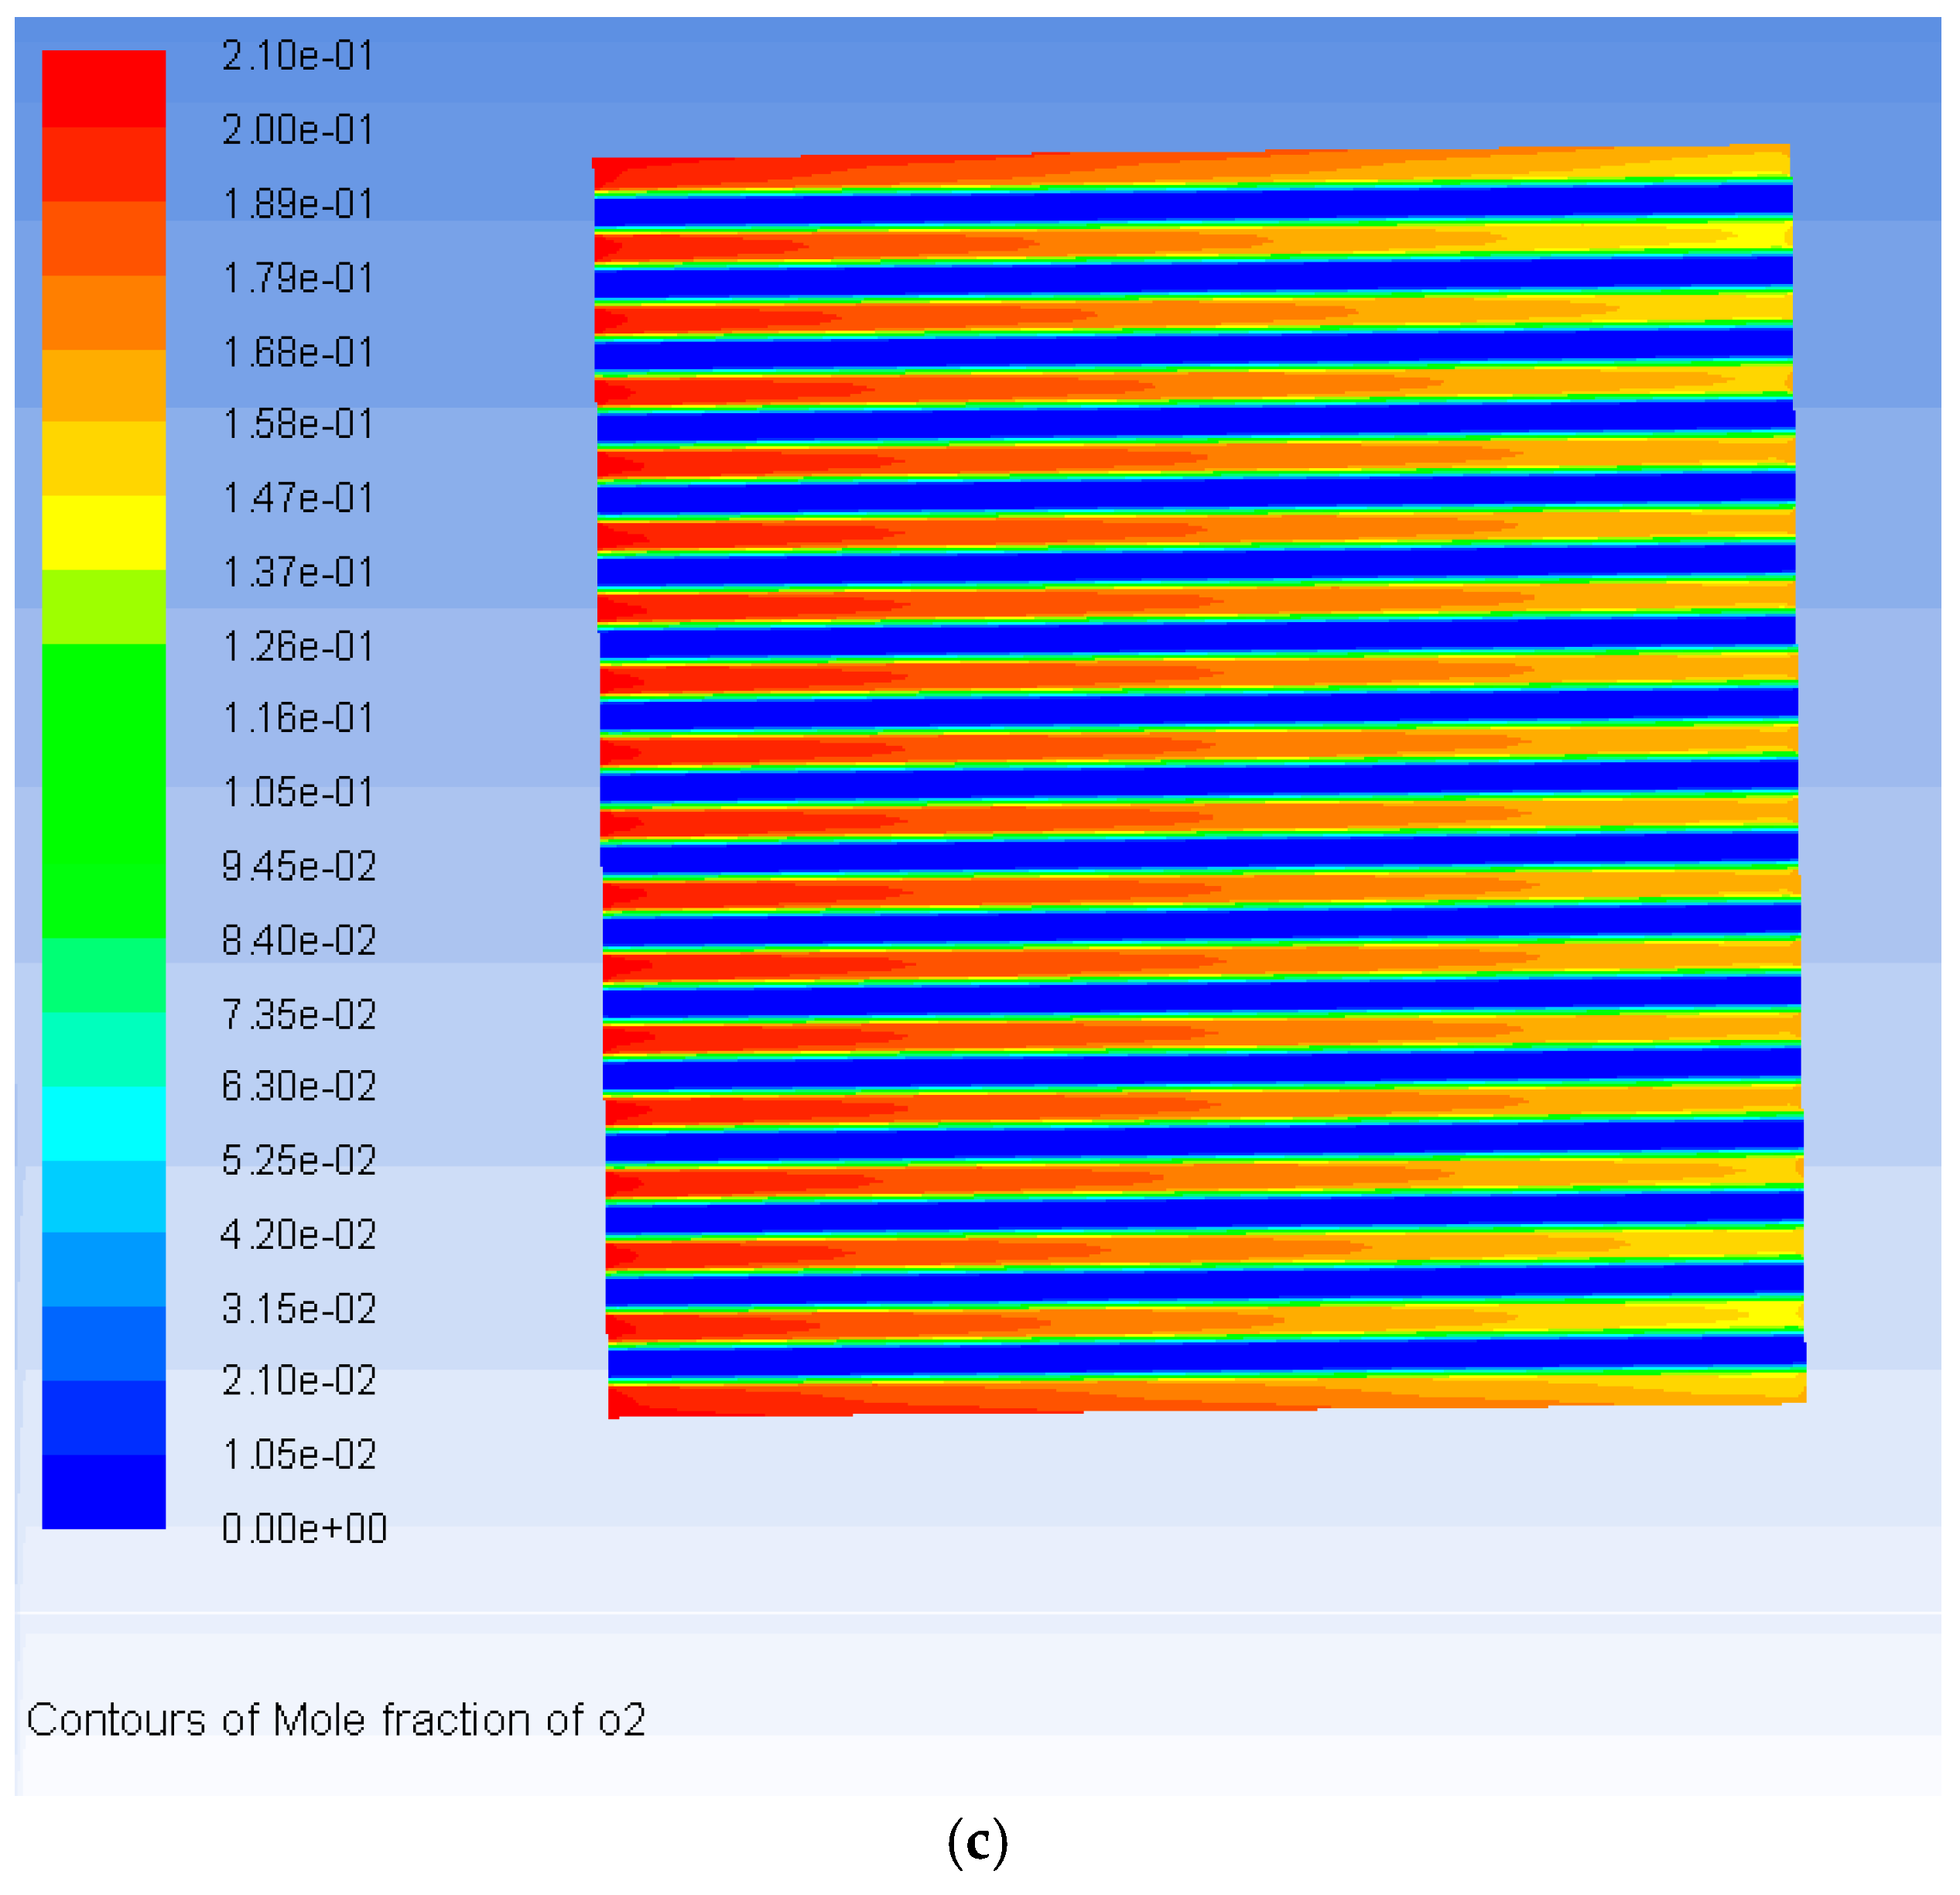
Similarly, Figure 8a–c shows the oxygen mole fraction distribution characteristics of the 10-layer SOFC stack, among the rib channels of the 5-th cell unit, and over the cathode-electrolyte interface. The fuel and air flow arrangement pattern in the current design is convection. The characteristics of the air flow distribution within the rib channels is similar to that of the fuel flow channels. The oxygen concentration in the rib channels, corresponding to the air outlet manifold, is obviously higher than that on both sides, but in comparison, the distribution trend of oxygen is more uniform than that of hydrogen. However, from Figure 8c, we can further understand that unlike the hydrogen diffusion within the anode side, the oxygen transport within the porous cathode is greatly affected by the shape of the solid rib configurations. As shown in both Figure 8b,c, similar oxygen mole fraction distributions can be seen between the rib channels zone and the cathode-electrolyte interface zone covered by rib channels. The other cathode-electrolyte interface zone covered by the solid ribs can only get very little oxygen. This means that the solid rib configurations in the cathode sides greatly affect the O2 being transported within the porous cathode.
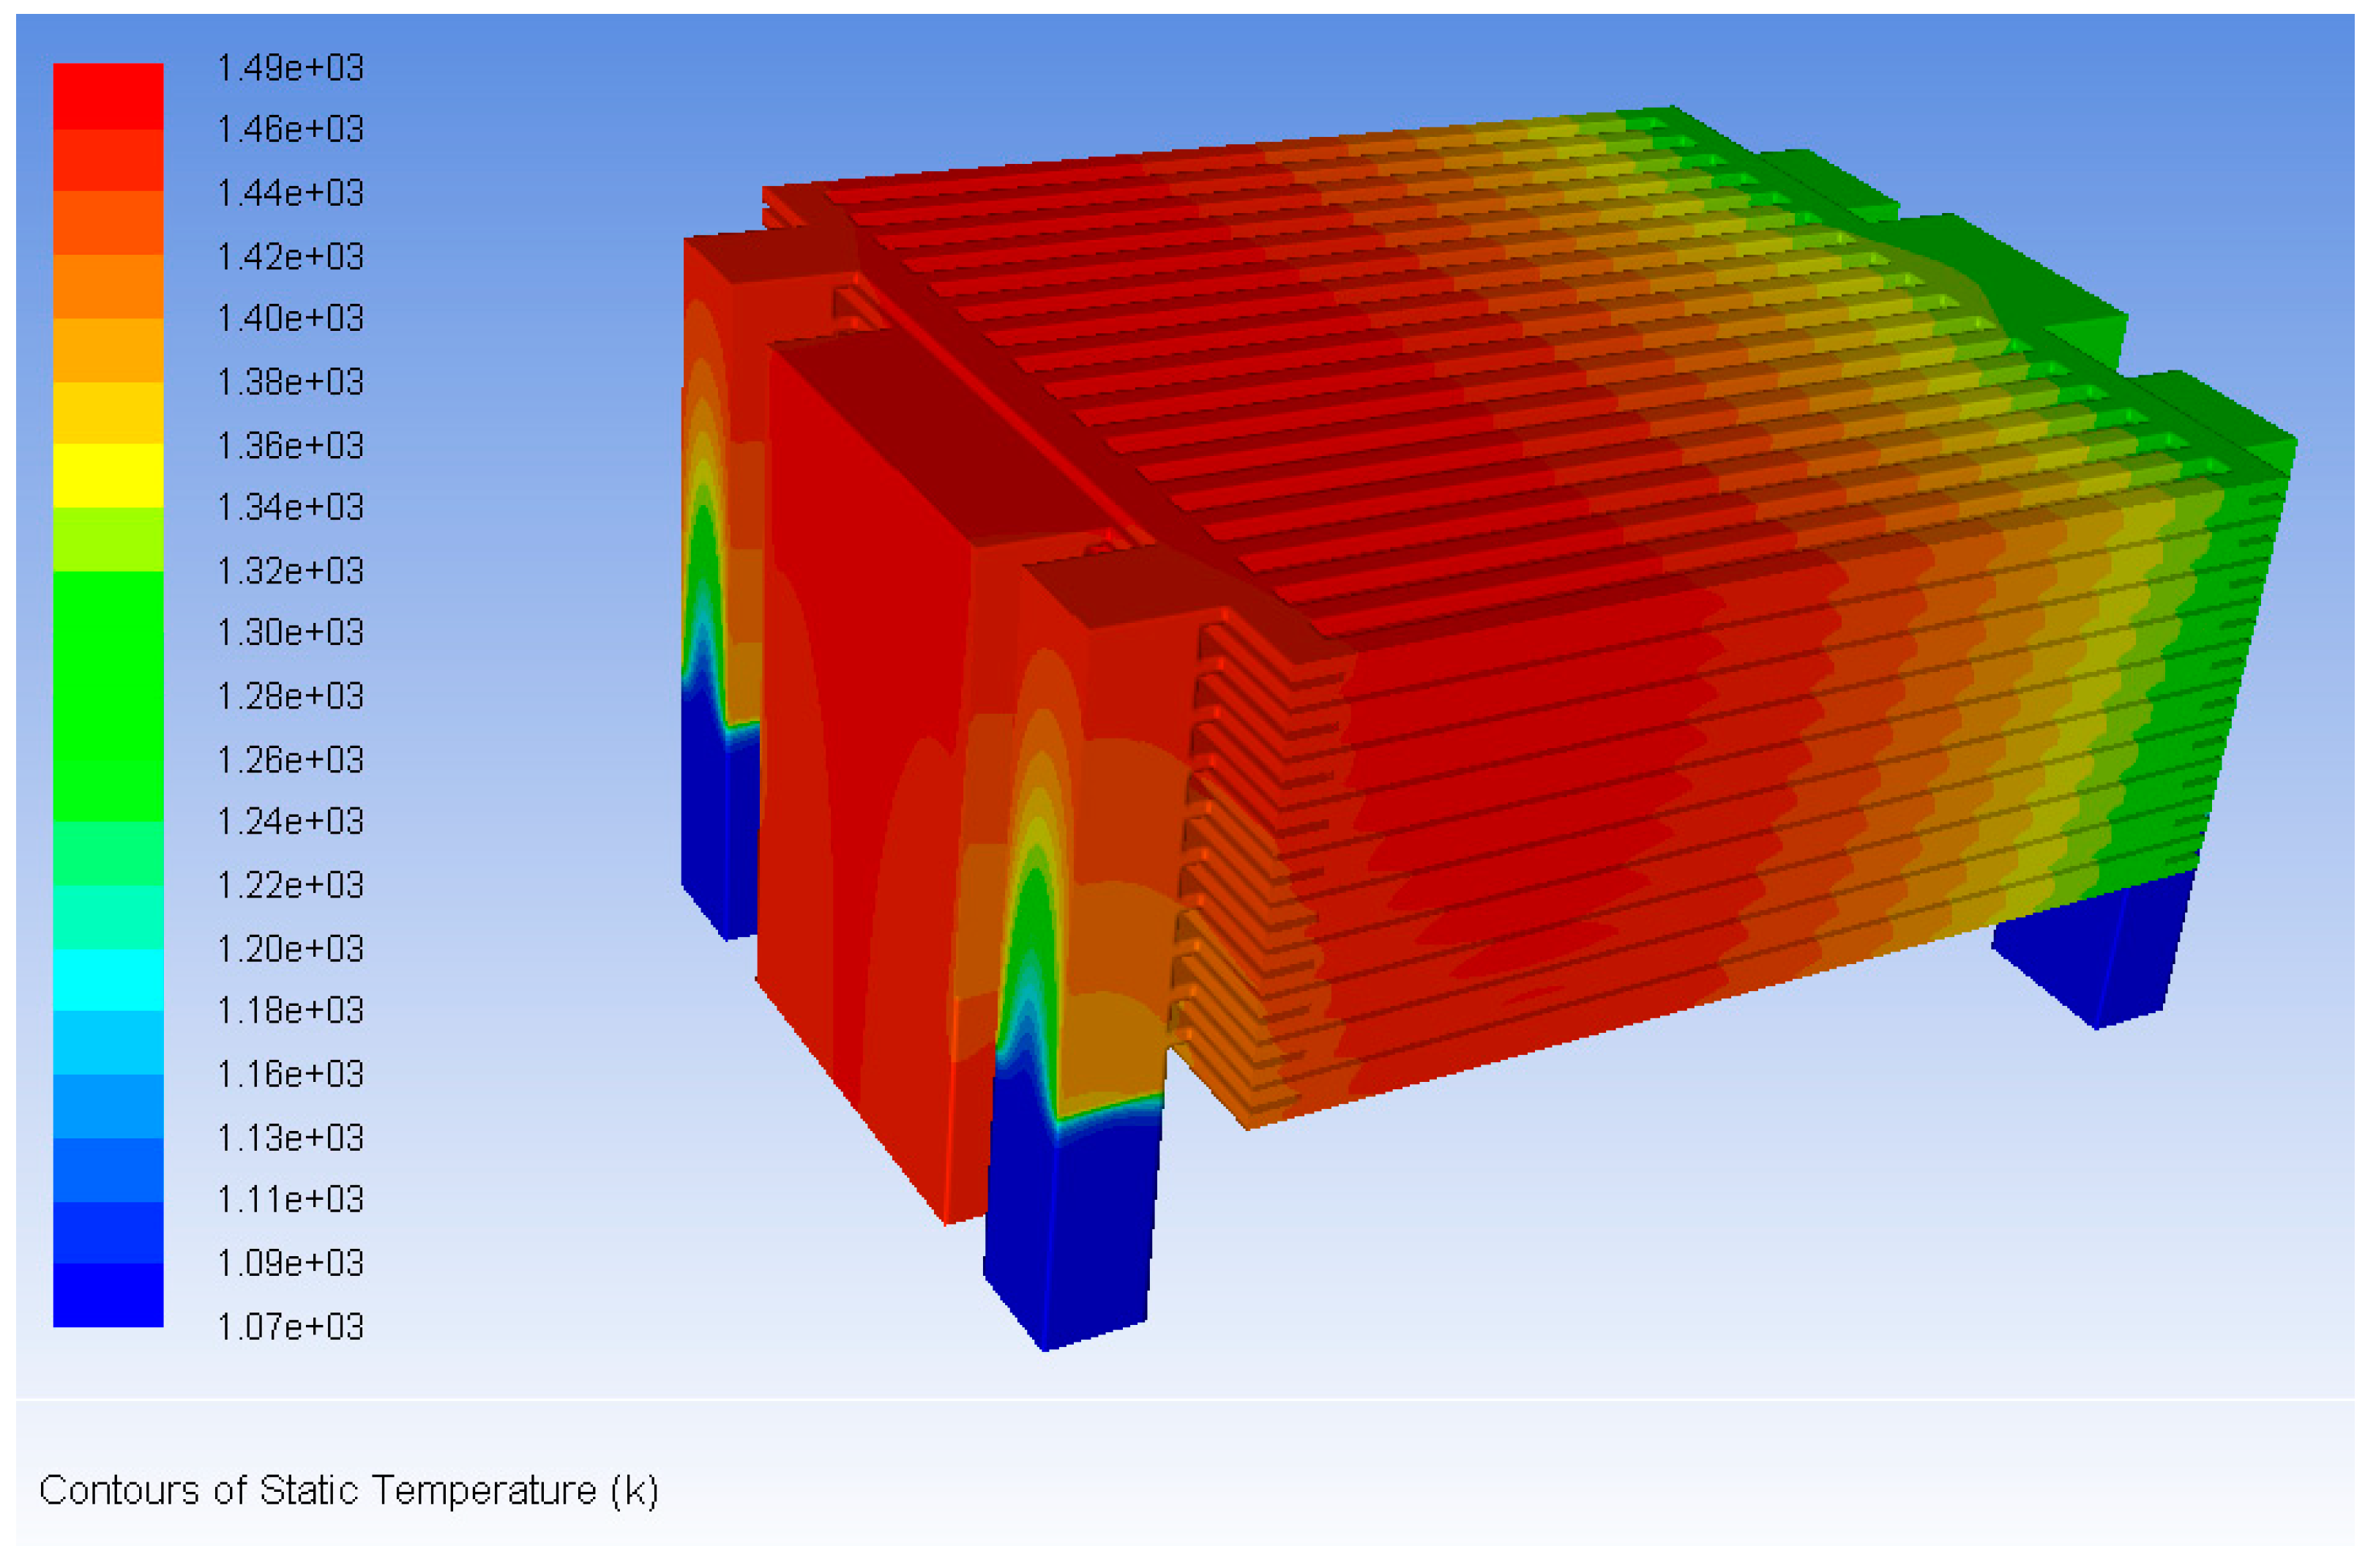
The uniformities of fuel and air flow distributions and hydrogen and oxygen concentration distributions might affect not only stack electrochemical performance, but also temperature distribution. Due to the electrochemical reaction and various polarization losses, there is a certain temperature gradient within the SOFC stack. The greater the temperature difference, the greater the thermal stress, and the fatigue damage of the stack components; these issues occur on prolonged use and cause weakening of the sealing performance, fuel leakage and other problems. Therefore, the life of the stack is seriously affected by the temperature difference inside it.
Figure 9 shows the overall temperature profile of a SOFC stack with two hydrogen inlet manifolds on the left side and two air inlet manifolds on the right side. Obviously, more uniform distribution result of temperature should be found in the current model, compared with those obtained by the half stack models [21], because the heat transfer process between the anode and cathode side components is considered. Generally, the relevant uniform temperature distribution within the current stack illustrate the geometric and operation parameters adopted in current design of stack structure is accepted. This is also a benefit of the short cell number scale (i.e., N = 10). The reason being that, as the temperature in the stack is propagated by fluid flow, the more uniform the fluid distribution, the smaller the temperature difference. Additionally, the temperature distribution exhibits a distribution tendency—the temperature on the air outlet side is significantly higher than the air inlet side. In fact, it is not difficult to understand that due to the high air flow rate and specific heat capacity, air flow within a typical SOFC stack is generally considered to be the main heat transfer carrier.
4. Conclusions
In this paper, a large-scale, whole-component and quasi multi-physics model for the whole structure of a typical SOFC stack is developed by coupling calculating the momentum, mass, heat and quasi electrochemical transporting equations. This model can be used to figure out the working details within the stack, more accurately compared with most of the half stack structure model. Although this 3D large scale model is developed on the basis on a specific 10-cell stack design, it can be applied to many other different planar SOFC cases. This model helps us understand the multi-physics working details within a large-scale stack, and obtain the distribution characterizes of important factors such as the air/fuel flow rates distribution qualities on both stack and cell unit levels, species distribution characteristics among rib channels and over electrode-electrolyte interfaces, temperature distribution characteristics, etc. It can also be used to further address optimization of structure and operation parameters in the near future. The results show that proper flow, species and temperature distribution qualities can be achieved for a 10-cell short planar SOFC stack (Figure 1). The temperature increases along the air flow directions, and shows an opposite trend with the distribution of air flow rates. Air flow in the SOFC stack is the main heat transfer carrier due to its high flow rate and specific heat capacity.
Author Contributions
Methodology, J.M.; Software, J.M. and X.Z.; Validation, S.M. and D.C.; Formal Analysis, J.H.; Investigation, S.M.; Data Curation, S.M.; Writing-Original Draft Preparation, J.M.; Writing-Review & Editing, D.C.; Supervision, D.C.
Funding
This research was funded by the National Science Foundation of China (51776092 and 21406095), the Natural Science Foundation of Jiangsu Province BK20151325 and the Jiangsu University of Science and Technology.
Acknowledgments
We would also like to acknowledge the technical support from the journal editor officers.
Conflicts of Interest
The authors declare no conflicts of interest.
References
- Wang, Q.; Wei, H.-H.; Xu, Q. A Solid Oxide Fuel Cell (SOFC)-Based Biogas-from-Waste Generation System for Residential Buildings in China: A Feasibility Study. Sustainability 2018, 10, 2395. [Google Scholar] [CrossRef]
- Wu, L.; Sun, L.; Shen, J.; Hua, Q. Multiple Model Predictive Hybrid Feedforward Control of Fuel Cell Power Generation System. Sustainability 2018, 10, 437. [Google Scholar] [CrossRef]
- Shao, Z.P.; Haile, S.M. A high-performance cathode for the next generation of solid-oxide fuel cells. Nature 2004, 431, 170–173. [Google Scholar] [CrossRef] [PubMed]
- Liu, H.; Akhtar, Z.; Li, P.; Wang, K. Mathematical Modeling Analysis and Optimization of Key Design Parameters of Proton-Conductive Solid Oxide Fuel Cells. Energies 2014, 7, 173–190. [Google Scholar] [CrossRef] [Green Version]
- Chen, D.; Zhang, Q.; Lu, L.; Periasamy, V.; Tade, M.O.; Shao, Z. Multi scale and physics models for intermediate and low temperatures H+-solid oxide fuel cells with H+/e(−)/O2− mixed conducting properties: Part A, generalized percolation theory for LSCF-SDC-BZCY 3-component cathodes. J. Power Sources 2016, 303, 305–316. [Google Scholar] [CrossRef]
- Kong, W.; Gao, X.; Liu, S.; Su, S.; Chen, D. Optimization of the Interconnect Ribs for a Cathode-Supported Solid Oxide Fuel Cell. Energies 2014, 7, 295–313. [Google Scholar] [CrossRef] [Green Version]
- Enrico, A.; Cannarozzo, M.; Costamagna, P. Modeling Analysis of Bi-Layer Ni-(ZrO2)x(Y2O3)1−x Anodes for Anode-Supported Intermediate Temperature-Solid Oxide Fuel Cells. Energies 2014, 7, 5647–5674. [Google Scholar] [CrossRef]
- Chen, D.; Wang, H.; Zhang, S.; Tade, M.O.; Shao, Z.; Chen, H. Multiscale model for solid oxide fuel cell with electrode containing mixed conducting material. AlChE J. 2015, 61, 3786–3803. [Google Scholar] [CrossRef]
- Chen, D.; Hu, B.; Ding, K.; Yan, C.; Lu, L. The Geometry Effect of Cathode/Anode Areas Ratio on Electrochemical Performance of Button Fuel Cell Using Mixed Conducting Materials. Energies 2018, 11, 1–16. [Google Scholar] [CrossRef]
- Ni, M.; Shao, Z.; Chan, K. Modeling of Proton-Conducting Solid Oxide Fuel Cells Fueled with Syngas. Energies 2014, 7, 4381–4396. [Google Scholar] [CrossRef] [Green Version]
- Sun, L.; Hua, Q.; Shen, J.; Xue, Y.; Li, D.; Lee, K. A Combined Voltage Control Strategy for Fuel Cell. Sustainability 2017, 9, 1517. [Google Scholar] [CrossRef]
- Hirata, H.; Nakagaki, T.; Hori, M. Effect of gas channel height on gas flow and gas diffusion in a molten carbonate fuel cell stack. J. Power Sources 1999, 83, 41–49. [Google Scholar] [CrossRef]
- Huang, C.M.; Shy, S.S.; Leeb, C.H. On flow uniformity in various interconnects and its influence to cell performance of planar SOFC. J. Power Sources 2008, 183, 205–213. [Google Scholar] [CrossRef]
- Koh, J.-H.; Seo, H.-K.; Lee, C.G.; Yoo, Y.-S.; Lim, H.C. Pressure and flow distribution in internal gas manifolds of a fuel-cell stack. J. Power Sources 2003, 115, 54–65. [Google Scholar] [CrossRef]
- Cruz Rojas, A.; Lopez Lopez, G.; Gomez-Aguilar, J.; Alvarado, V.; Sandoval Torres, C. Control of the Air Supply Subsystem in a PEMFC with Balance of Plant Simulation. Sustainability 2017, 9, 73. [Google Scholar] [CrossRef]
- Qin, Y.; Sun, L.; Hua, Q.; Liu, P. A Fuzzy Adaptive PID Controller Design for Fuel Cell Power Plant. Sustainability 2018, 10, 2438. [Google Scholar] [CrossRef]
- Chen, D.; Zeng, Q.; Su, S.; Bi, W.; Ren, Z. Geometric optimization of a 10-cell modular planar solid oxide fuel cell stack manifold. Appl. Energy 2013, 112, 1100–1107. [Google Scholar] [CrossRef]
- Peksen, M. 3D transient multiphysics modelling of a complete high temperature fuel cell system using coupled CFD and FEM. Int. J. Hydrog. Energy 2014, 39, 5137–5147. [Google Scholar] [CrossRef]
- Chen, D.; Xu, Y.; Tade, M.O.; Shao, Z. General Regulation of Air Flow Distribution Characteristics within Planar Solid Oxide Fuel Cell Stacks. ACS Energy Lett. 2017, 2, 319–326. [Google Scholar] [CrossRef]
- Su, S.; He, H.; Chen, D.; Zhu, W.; Wu, Y.; Kong, W.; Wang, B.; Lu, L. Flow distribution analyzing for the solid oxide fuel cell short stacks with rectangular and discrete cylindrical rib configurations. Int. J. Hydrog. Energy 2015, 40, 577–592. [Google Scholar] [CrossRef]
- Chen, D.; Xu, Y.; Hu, B.; Yan, C.; Lu, L. Investigation of proper external air flow path for tubular fuel cell stacks with an anode support feature. Energy Convers. Manag. 2018, 171, 807–814. [Google Scholar] [CrossRef]
- Blum, L.; Groß, S.M.; Malzbender, J.; Pabst, U.; Peksen, M.; Peters, R.; Vinke, I.C. Investigation of solid oxide fuel cell sealing behavior under stack relevant conditions at Forschungszentrum Jülich. J. Power Sources 2011, 196, 7175–7181. [Google Scholar] [CrossRef]
- Yan, D.; Liang, L.J.; Yang, J.J.; Zhang, T.; Pu, J.; Chi, B.; Li, J. Performance degradation and analysis of 10-cell anode-supported SOFC stack with external manifold structure. Energy 2017, 125, 663–670. [Google Scholar] [CrossRef]
Figure 1.
The schematic diagram of a conventional planar SOFC stack structure, as reported by Blum et al. [22].
Figure 1.
The schematic diagram of a conventional planar SOFC stack structure, as reported by Blum et al. [22].
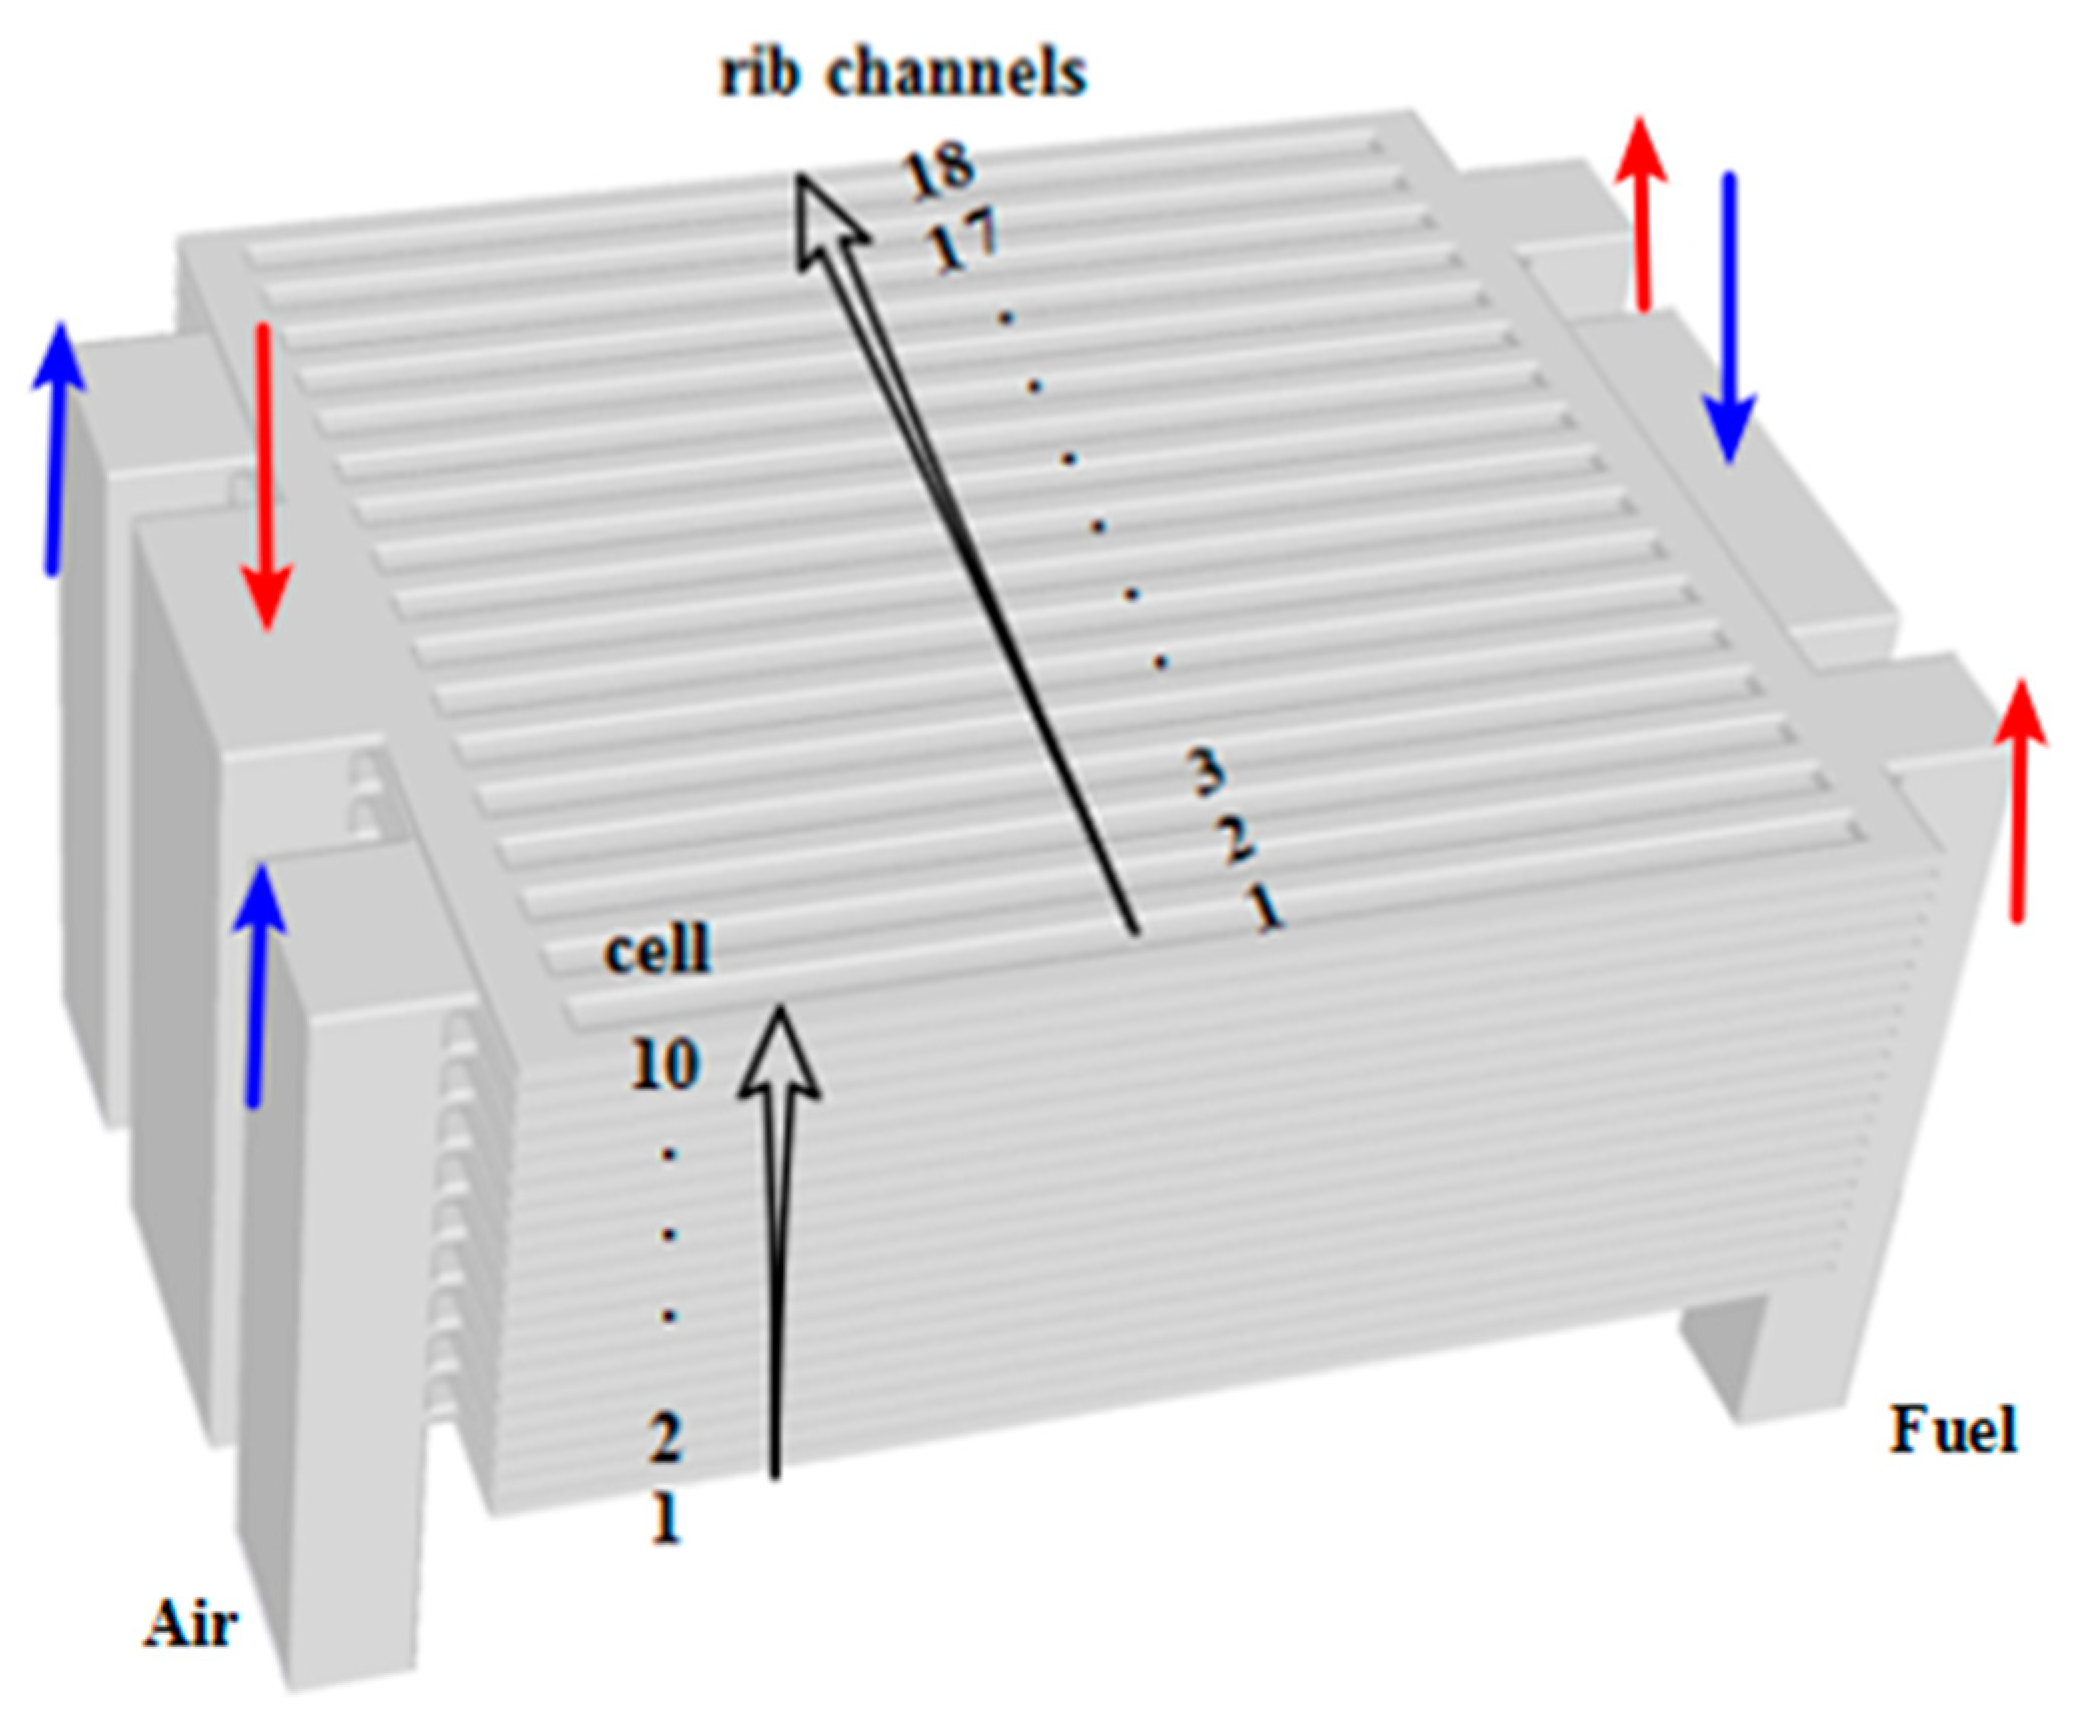
Figure 2.
3D structure of the 10-cell SOFC stack model, corresponding to the stack design in Figure 1. Red and blue lines indicate the fuel and air flow directions within the stack, respectively.
Figure 2.
3D structure of the 10-cell SOFC stack model, corresponding to the stack design in Figure 1. Red and blue lines indicate the fuel and air flow directions within the stack, respectively.

Figure 3.
The mesh quality in the 3D 10-cells SOFC stack model.
Figure 4.
3D static pressure distributions within the fuel and airflow paths of the 10-cell planar stack. In here, 1e-3 means 1 × 10⁻³.
Figure 4.
3D static pressure distributions within the fuel and airflow paths of the 10-cell planar stack. In here, 1e-3 means 1 × 10⁻³.
Figure 5.
Distributions of both normalized fuel and air mass flow rates obtained by each SOFC unit on a stack level, (a) fuel flow rates; (b) air flow rates.
Figure 5.
Distributions of both normalized fuel and air mass flow rates obtained by each SOFC unit on a stack level, (a) fuel flow rates; (b) air flow rates.

Figure 6.
Distribution of the normalized fuel and air mass flow rates among the rib channels on a cell unit level. (a) Fuel flow rates; (b) air flow rates.
Figure 6.
Distribution of the normalized fuel and air mass flow rates among the rib channels on a cell unit level. (a) Fuel flow rates; (b) air flow rates.
Figure 7.
Distribution of hydrogen molar fraction: (a) within the whole 10-layer SOFC stack; (b) among the rib channels of the 5-th cell unit; (c) over the anode-electrolyte interface of the 5-th cell unit. In here, 1e-3 means 1 × 10⁻³.
Figure 7.
Distribution of hydrogen molar fraction: (a) within the whole 10-layer SOFC stack; (b) among the rib channels of the 5-th cell unit; (c) over the anode-electrolyte interface of the 5-th cell unit. In here, 1e-3 means 1 × 10⁻³.
Figure 8.
Distribution of oxygen molar fraction: (a) within the whole 10-layer SOFC stack; (b) among the rib channels of the 5-th cell unit; (c) over the anode-electrolyte interface of the 5-th cell unit. In here, 1e-3 means 1 × 10⁻³.
Figure 8.
Distribution of oxygen molar fraction: (a) within the whole 10-layer SOFC stack; (b) among the rib channels of the 5-th cell unit; (c) over the anode-electrolyte interface of the 5-th cell unit. In here, 1e-3 means 1 × 10⁻³.
Figure 9.
Distribution of temperature in 10-layer SOFC stack. In here, 1e-3 means 1 × 10⁻³.


Table 1.
Geometrical and operational parameters corresponding to Figure 2.
Table 1.
Geometrical and operational parameters corresponding to Figure 2.
| Component and Operation Parameters | Fuel | Air |
|---|---|---|
| SOFC unit active area (mm × mm) | 100 × 105 | 100 × 105 |
| Inlet manifold (mm × mm) | 10 × 12 | 10 × 18 |
| Outlet manifold (mm × mm) | 10 × 30 | 10 × 44 |
| Height of each SOFC unit (mm) | 4.5 | 4.5 |
| Feeding header (mm × mm) | 5 × 10⁵ | 5 × 10⁵ |
| Exhaust header (mm × mm) | 5 × 10⁵ | 5 × 10⁵ |
| Solid rib (mm × mm) | 3 × 1.5 | 3 × 1.5 |
| Rib channel (mm × mm) | 3 × 1.5 | 3 × 1.5 |
| Operation temperature, T (K) | 1073.15 | |
| Operational current density, iop (A m−2) | 7000 | |
| Utilization, | 0.7 | 0.3 |
Table 2.
The corresponding thermal physical properties of each component.
| Material Characteristics | Porous Anode | Electrolyte | Porous Cathode | Bipolar Plates |
|---|---|---|---|---|
| Density [kg·m−3] | 6870 | 5900 | 6570 | 8900 |
| Specific heat [J·kg−1·K−1] | 595 | 606 | 573 | 518 |
| Thermal conductivity [W·m−1·K−1] | 6 | 2.7 | 11 | 45 |
Table 3.
The corresponding boundary conditions for 3D largescale and multi-physics simulating.
| Inlet Manifolds Entrances | Rib Channel-Anode | Anode-Electrolyte | Electrolyte-Cathode | Cathode-Rib Channel | Outlet Manifolds Exits | |
|---|---|---|---|---|---|---|
| Momentum conservation | Continuity | Insulation | Insulation | Continuity | 0 | |
| Fuel mass conservation | Continuity | Insulation | / | / | ||
| Air mass conservation | / | / | Insulation | Continuity | ||
| Energy conservation | T0 = 973 K | Continuity | Continuity | Continuity | Continuity |
© 2018 by the authors. Licensee MDPI, Basel, Switzerland. This article is an open access article distributed under the terms and conditions of the Creative Commons Attribution (CC BY) license (http://creativecommons.org/licenses/by/4.0/).
Share and Cite
MDPI and ACS Style
Ma, J.; Ma, S.; Zhang, X.; Chen, D.; He, J. Development of Large-Scale and Quasi Multi-Physics Model for Whole Structure of the Typical Solid Oxide Fuel Cell Stacks. Sustainability 2018, 10, 3094. https://doi.org/10.3390/su10093094
AMA Style
Ma J, Ma S, Zhang X, Chen D, He J. Development of Large-Scale and Quasi Multi-Physics Model for Whole Structure of the Typical Solid Oxide Fuel Cell Stacks. Sustainability. 2018; 10(9):3094. https://doi.org/10.3390/su10093094
Chicago/Turabian StyleMa, Jie, Suning Ma, Xinyi Zhang, Daifen Chen, and Juan He. 2018. "Development of Large-Scale and Quasi Multi-Physics Model for Whole Structure of the Typical Solid Oxide Fuel Cell Stacks" Sustainability 10, no. 9: 3094. https://doi.org/10.3390/su10093094
Note that from the first issue of 2016, this journal uses article numbers instead of page numbers. See further details here.