Article

Temporal Evolution and Influencing Factors of Energy Consumption and Related Carbon Emissions from the Perspective of Industrialization and Urbanization in Shanghai, China

1
Nanjing Institute of Geography and Limnology, Chinese Academy of Sciences, Nanjing 210008, China
2
Key Laboratory of Watershed Geographic Sciences, Chinese Academy of Sciences, Nanjing 210008, China
3
School of Geographical Sciences and Urban Planning, Arizona State University, Tempe, AZ 85281, USA
4
Institute of Geographic Sciences and Natural Resources Research, Chinese Academy of Sciences, Beijing 100101, China
*
Author to whom correspondence should be addressed.
Sustainability 2018, 10(9), 3054; https://doi.org/10.3390/su10093054
Submission received: 18 July 2018 / Revised: 20 August 2018 / Accepted: 21 August 2018 / Published: 28 August 2018

Abstract

:
Improvements of manufacturability and living standard driven by industrialization and urbanization typically cause a spike in total energy consumption (TEC) and related carbon emissions (TCEM). However, there have been few comparative studies to include industrial and residential energy consumption (IEC and REC, respectively) and related carbon emissions (ICEM and RCEM, respectively). Since China is a major emerging industrial country wherein urbanization is still ongoing, the present study was conducted in an attempt to analyze the temporal evolution of China’s continued energy consumption and related carbon emissions regarding both industrialization and urbanization. The influencing factors of TCEM, RCEM and ICEM are determined via the log-mean divisia index (LMDI) model. The results showed that both TEC and TCEM gradually increased (apart from a slight decrease in 2014); REC and RCEM increased steadily with no sharp peak; while IEC and ICEM declined sharply. TCEM was positively affected by economic output, consumption level, and population size; the influence of consumption level became more and more significant. Per capita GDP and per capita expenditure were the most significant driving factors for RCEM, while industrial added value (IAV) was the main driving factor for ICEM. The temporal evolution and influencing factors of energy consumption and carbon emissions had stage-related characteristics in accordance with Shanghai’s three stages of development. The Shanghai case study provided a comprehensive understanding of energy consumption and related carbon emissions from the dual perspective of industrialization and urbanization.

1. Introduction

The rapidly growing impact of human activities on the Earth’s many ecosystems is an undeniable force; major natural processes from the local to the global level are increasingly influenced by human forces [1,2]. Energy consumption and carbon emissions caused by rapid economic development are important consequences of human activities, which drive global climate change [3,4]. A recent Intergovernmental Panel on Climate Change (IPCC) report stated that about three-quarters of the world’s anthropogenic carbon emissions over the past 20 years originated from fossil fuel combustion [5]. As one of the most rapid developing countries in the world, China is also the world’s largest primary energy consumer and carbon emitter. The country faces increasing international pressure in response to climate changes issues [6,7]. In order to provide targeted measures to reduce total energy consumption (TEC) and carbon emissions (TCEM) without strangling economic development, it is necessary to empirically determine the composition and corresponding influencing factors of energy consumption and energy-related carbon emissions.
As the most important indicators of economic development, urbanization and industrialization have significant but differentiated effects on energy consumption and carbon emissions [8,9]. Industrial energy consumption (IEC) and carbon emissions (ICEM) generally receive more research attention than the residential counterparts due to their relatively greater intensity and larger proportion accounting for TEC and TCEM. Industrialization causes increases in IEC and ICEM and is also one of the most significant drivers of TEC and TCEM, especially at the stage of heavy industry expansion [10,11,12,13]. Globally, the industrial sector accounts for 40% of energy use [14]. In developing countries, CO2 emissions have increased dramatically in recent years due to the rapidly growing consumption of coal, oil, and other fossil fuels during industrialization [15]. In China, industrial sectors account for about 60% of the country’s total energy use and are mainly responsible for the majority of its CO2 emissions [16]. However, the intensity of energy consumption and carbon emissions is expected to decrease with nationwide technological improvements, industrial structure adjustments, and the gradual shift to a service economy [17,18].
Urbanization serves to satisfy humankind’s needs for subsistence on a daily basis as well as future development. Studies have repeatedly shown that it also inevitably causes an increase in per capita residential energy consumption (REC) and carbon emissions (RCEM) as well as a growing proportion of REC to TECM and RCE to TCEM [19,20,21]. Fan and Li found that urban per capita REC was about twice the rural per capita REC [22]. Carlsson-Kanyama et al. found that the per capita expenditure and energy consumption of urban high-income residents were about 5.5 times and 4.3 times that of young and low-income residents [23]. Considering the proportion of REC and RCE, Nejat et al. pointed out that the residential sector represented 27% and 17% of global energy consumption and CO2 emissions, respectively [24]. In China, the proportion of REC to TEC is about 11% [25]; this is considerably lower than that of the United Kingdom (29% [26]) or United States (22% [27]).
The quantity and proportion of industrial and residential energy consumption and carbon emissions vary at different stages of industrial and urban development. The stage-related variations are affected by various factors attributed to industrialization and/or urbanization [16,28,29]. In China, although IEC and ICEM still dominate TEC and TCEM, REC and RECM are expected to increase rapidly as higher-quality urbanization is further integrated into the country’s development [22,30]. A comprehensive understanding of China’s energy consumption and carbon emissions will help to elucidate the temporal evolution of these factors as they relate specifically to industrialization and urbanization [22]. Most previous researchers have focused on TEC/TCEM or IEC/ICEM to determine the spatial-temporal pattern and driving factors. Although some have explored the energy consumption and related carbon emissions from the single aspect of industrial or residential sectors, few researchers have conducted comparative analyses of both aspects [13,17,30,31]. This research gap may lead to inappropriately optimistic judgments about China’s future energy consumption and carbon emissions considering its industrial transformation and significant decline in energy intensity in the industrial sector [32,33,34].
All in all, it is crucial to determine the temporal evolution and influence factors of energy consumption and carbon emissions from the dual perspective of industrialization and urbanization. Considering the spatial differentiation among different stages of economic development, an empirical case study on a developed city may provide useful information regarding China’s future energy consumption and carbon emissions and also reveal potential targeted regulatory policies. Shanghai is the core of the Yangtze River Delta Urban Agglomeration and one of China’s world-class cities, and the industrial added value (IAV) accounted for only 31.2% of its GDP with an urbanization rate of 90.3% and a per capita GDP of 15,851 USD in 2014. As a high-income city with a low proportion of IAV, its TEC, consumption structure, and utilization level have changed significantly in recent decades, which make it quite a relevant case study. Therefore, we analyzed the amount and composition of energy consumption and related carbon emissions from the perspective of industrialization and urbanization in Shanghai from 1995 to 2014, during which period the proportion of IAV to GDP decreased by 22 percentage points and per capita GDP increased by 854%. We aimed to answer the following questions: (1) How did energy consumption and carbon emissions change in terms of TEC/TCEM, REC/RCEM, and IEC/ICEM? To be specific, did REC and RCEM increase rapidly in the past 20 years? (2) What were the primary factors influencing the changes in energy-related carbon emissions? Was there any difference among them in regard to the total, industrial, and residential carbon emissions? (3) Did energy consumption and carbon emissions show any stage-related characteristics? If so, what were they exactly?

2. Methodology and Data Processing

2.1. Calculation of Energy Consumption and Carbon Emissions

To determine the energy consumption and carbon emissions from the perspective of industrialization and urbanization based on panel data, researchers typically adopt final energy consumption as the input data [16,31]. According to a definition from the China Energy Statistics Yearbook, “final energy consumption” is the total energy consumption by industrial and residential activities in China (or in one region) in a given period, which reflects the actual type and amount of energy consumption related to industrialization and urbanization. Based on the type and amount of total, industrial, and residential energy consumption listed in the China Energy Statistics Yearbook, we transformed different types of energy into standard coal consumption using Formula (1). We calculated carbon emissions data according to the IPCC technique in Formula (2) [32]. These methods have been widely adopted to calculate energy consumption and carbon emissions based on panel data [30,34]. Taking TEC and TCEM as examples, the formula are expressed as follows:
TEC = i = 1 n E i c i
TCEM = i = 1 n E i k i
where TEC and TCEM represent total energy consumption and carbon emissions expressed by coal equivalents; Ei represents the total consumption of energy type i; and ci and ki represent the coal equivalent conversion coefficient and carbon emissions coefficient of energy type i, respectively. When IEC/ICEM and REC/RCEM are calculated, Ei is the industrial and residential consumption of energy type i, respectively.
“Energy” in this paper includes not only primary energies such as coal, oil, and natural gas but also secondary energies such as electricity, heat, gas, and liquefied petroleum gas. The energy consumption and conversion coefficients to coal equivalent are from the China Energy Statistical Yearbook. Most of the carbon emissions coefficients come from Song’s research in Shandong, China as they were determined based on comprehensive analysis of many previous studies including the IPCC’s Guidelines for National Greenhouse Gas Inventories (2006) [32]. Carbon emission coefficients of heat and electricity were not indicated in Song’s paper, so we converted heat and electricity to coal equivalents using the conversion factors in the China Energy Statistical Yearbook, then determined their carbon emissions coefficients. The energy types and conversion factors/carbon emissions coefficients are shown in Table 1.

2.2. Decomposition Analysis of Influencing Factors

There are two widely adopted methods for carbon emissions factor decomposition: structural decomposition analysis (SDA) and index decomposition analysis (IDA) [35,36]. SDA is based on input–output data and not suitable for panel data analysis in this study. IDA uses only departmental aggregate data, so it is applicable for time-series modeling. As the log-mean divisia index (LMDI) model can be used for decomposition of multiple factors with zero residual errors and limited data requirement, it can be used to quantitatively decompose carbon emissions into several “effects” [37,38,39,40] and is therefore widely used in environmental economics [16,32,36]. For these reasons, we adopted the LMDI method to explore quantitatively factors of energy-related carbon emissions in Shanghai.
The main influencing factors of TCEM include various aspects related to industrialization and urbanization such as economic output and structure, population and living standards, and the structure, intensity, and efficiency of energy consumption [28,36,41,42]. We evaluated quantitatively the effects of the following factors on Shanghai’s TCEM:
Δ C = C t C 0 = Δ C p - e f f e c t + Δ C g - e f f e c t + Δ C t - e f f e c t + Δ C l - e f f e c t + Δ C f - e f f e c t + Δ C i - e f f e c t + Δ C s - e f f e c t
The total effect ΔC is the difference in carbon emissions from year 0 to year t. ΔC consists of seven parts: the effect of the population (amount of permanent population, ΔCp), of total regional economic output (GDP, ΔCg), of economic structure (proportion of IAV to GDP, ΔCt), of residents’ consumption level (average consumption expenditure of urban and rural residents, ΔCl), of energy efficiency (efficiency of thermal power generation, ΔCf), of energy intensity (energy consumption per 10,000 RMB of GDP, ΔCi), and the of energy consumption structure (proportion of coal consumption to total, ΔCs). The effect of population, for example, was calculated by the following formula:
Δ C p - effect = C t C 0 ln C t ln C 0 ln ( p t p 0 )
where C0 and Ct represent the carbon emissions in year 0 and t, and p0 and pt represent the population in year 0 and t, respectively. The effects of the other factors can be calculated similarly.
The main influencing factors of RCEM and ICEM are different from that of TCEM. For RCEM, factors related to population and urbanization, economic development level, and living standards are of significant influence. We chose population, urbanization, per capita GDP and expenditure (the weighted average of urban and rural expenditures based on urbanization rate), and per capita housing area (considering high urbanization rate and fluctuations of per capita housing area in rural Shanghai, per capita housing area in urban Shanghai was adopted) as the main factors for quantitative analysis [31,43]. ICEM is more significantly affected by factors related to industrial development and energy consumption, so we chose IAV, industrial structure (the proportion of heavy industry output to total industrial output), energy efficiency (same definition as above), and IEC structure (the proportion of coal to IEC) as the main factors for quantitative analysis. Similar to the quantitative analysis of TCEM influencing factors, we used the LMDI model to determine the effects of different factors on RCEM and ICEM.

2.3. Data Source

The data we used to calculate energy consumption and carbon emissions are mainly from the China Energy Statistical Yearbook (1995 to 2014). The thermal power generation efficiency and coal consumption information are also from the China Energy Statistical Yearbook. Economic and social development data including population, GDP, IAV, and consumption expenditure information are from the China Statistical Yearbook and Shanghai Statistical Yearbook (1995 to 2014).

3. Results Analysis

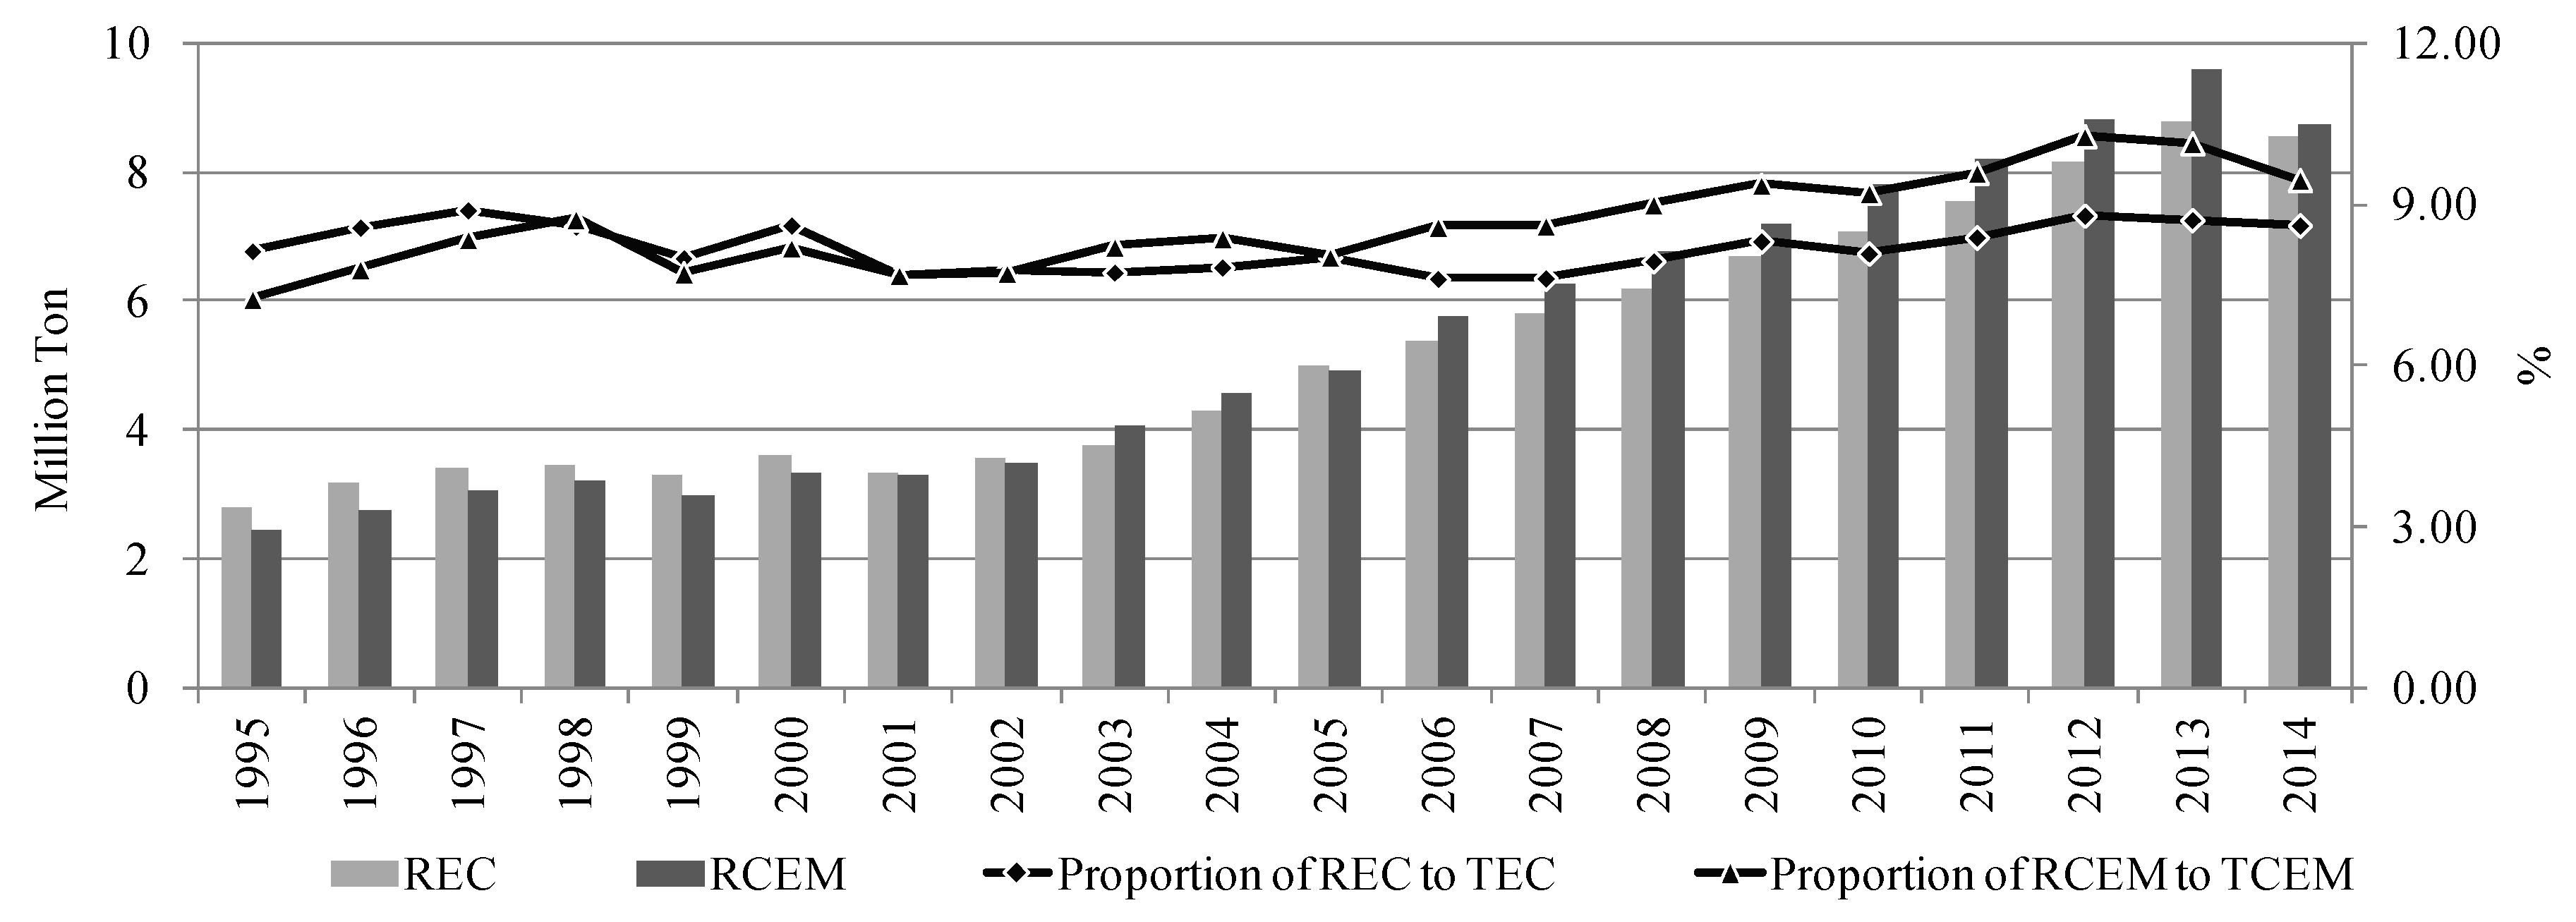
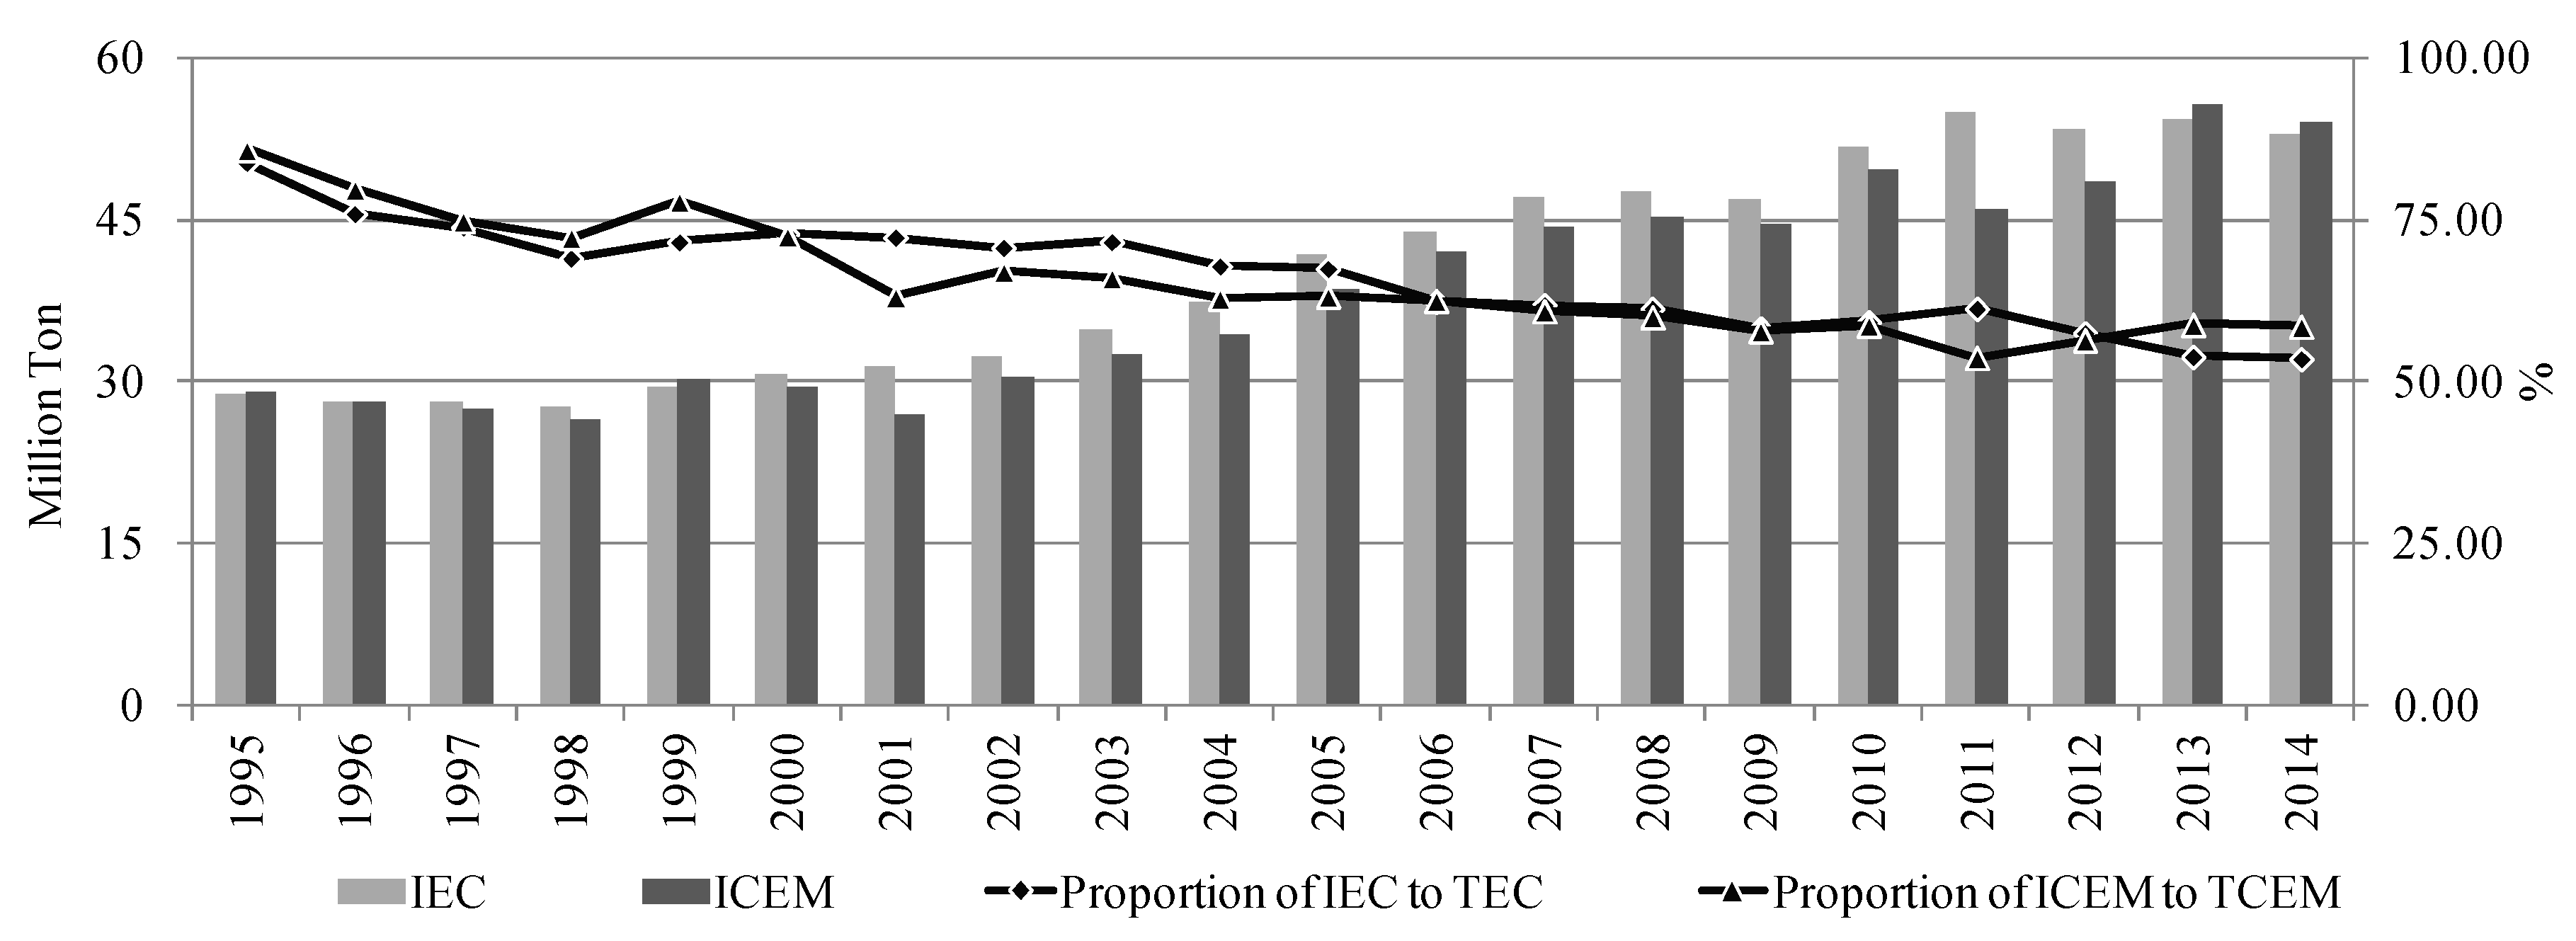
3.1. Energy Consumption and Carbon Emission Changes in Shanghai

From the perspective of total energy and carbon emissions, both TEC and TCEM showed gradual upward trends from 1995 to 2014 with an average annual increase of 3.40 million tonnes of coal equivalents and 3.07 million tonnes of carbon, respectively (Figure 1). Their annual increases were initially rather significant, especially in the years 2005, 2006, and 2007. After 2007, the annual increase fluctuated at a similar scale between TEC and TCEM. The first negative growth in either occurred in 2014.
The industrial sector comprised a significantly higher proportion of TEC and TCEM than the residential sector. Both REC and RCEM showed upward trends overall apart from the year 2014. Their proportions increased by 0.58% and 2.89% from 1995 to 2013, respectively (Figure 2). IEC and ICEM decreased by 30.32% and 27.29% from 1995 to 2014, respectively (Figure 3). On the whole, REC and RCEM increased steadily without any strong peak while IEC and ICEM declined sharply, showing that the industrial sector played an increasingly less significant role in TEC and TCEM. Unlike the continuous decline in IEC, ICEM trended upward after 2011 indicating that a certain amount of energy consumption generated more carbon emissions.

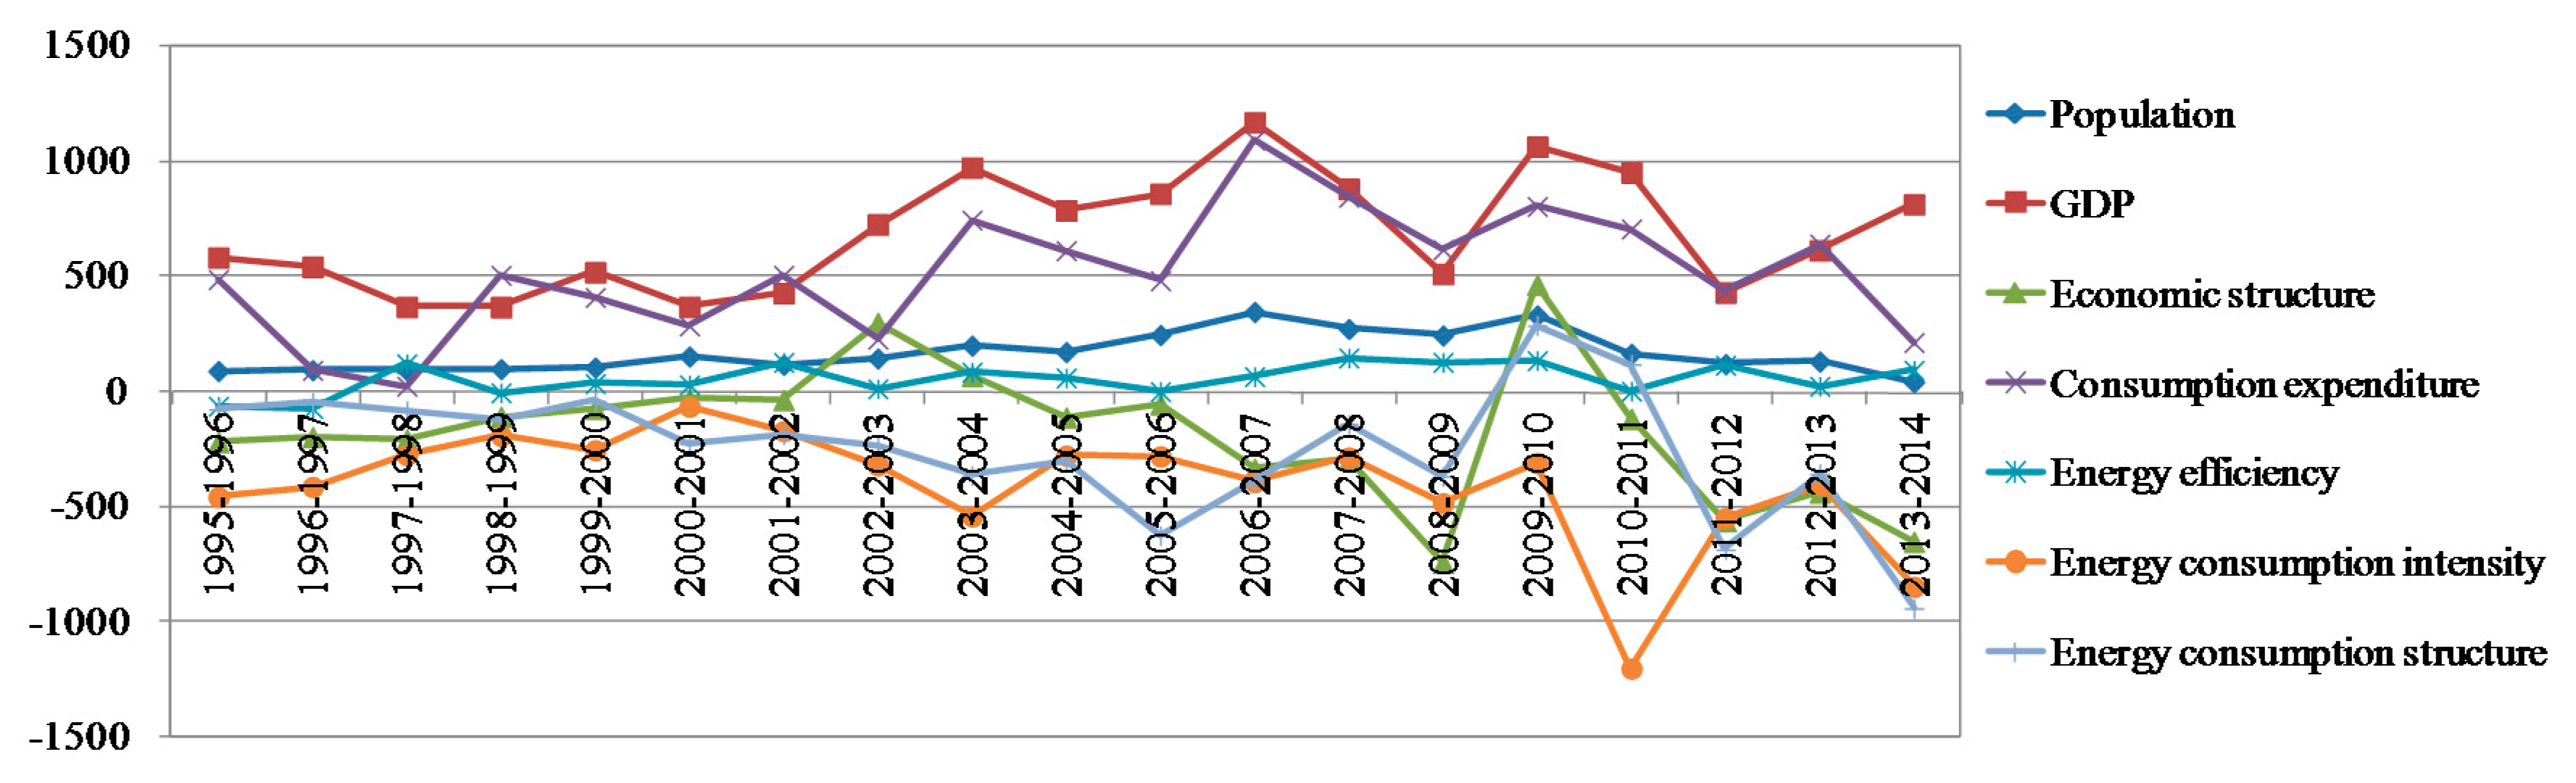
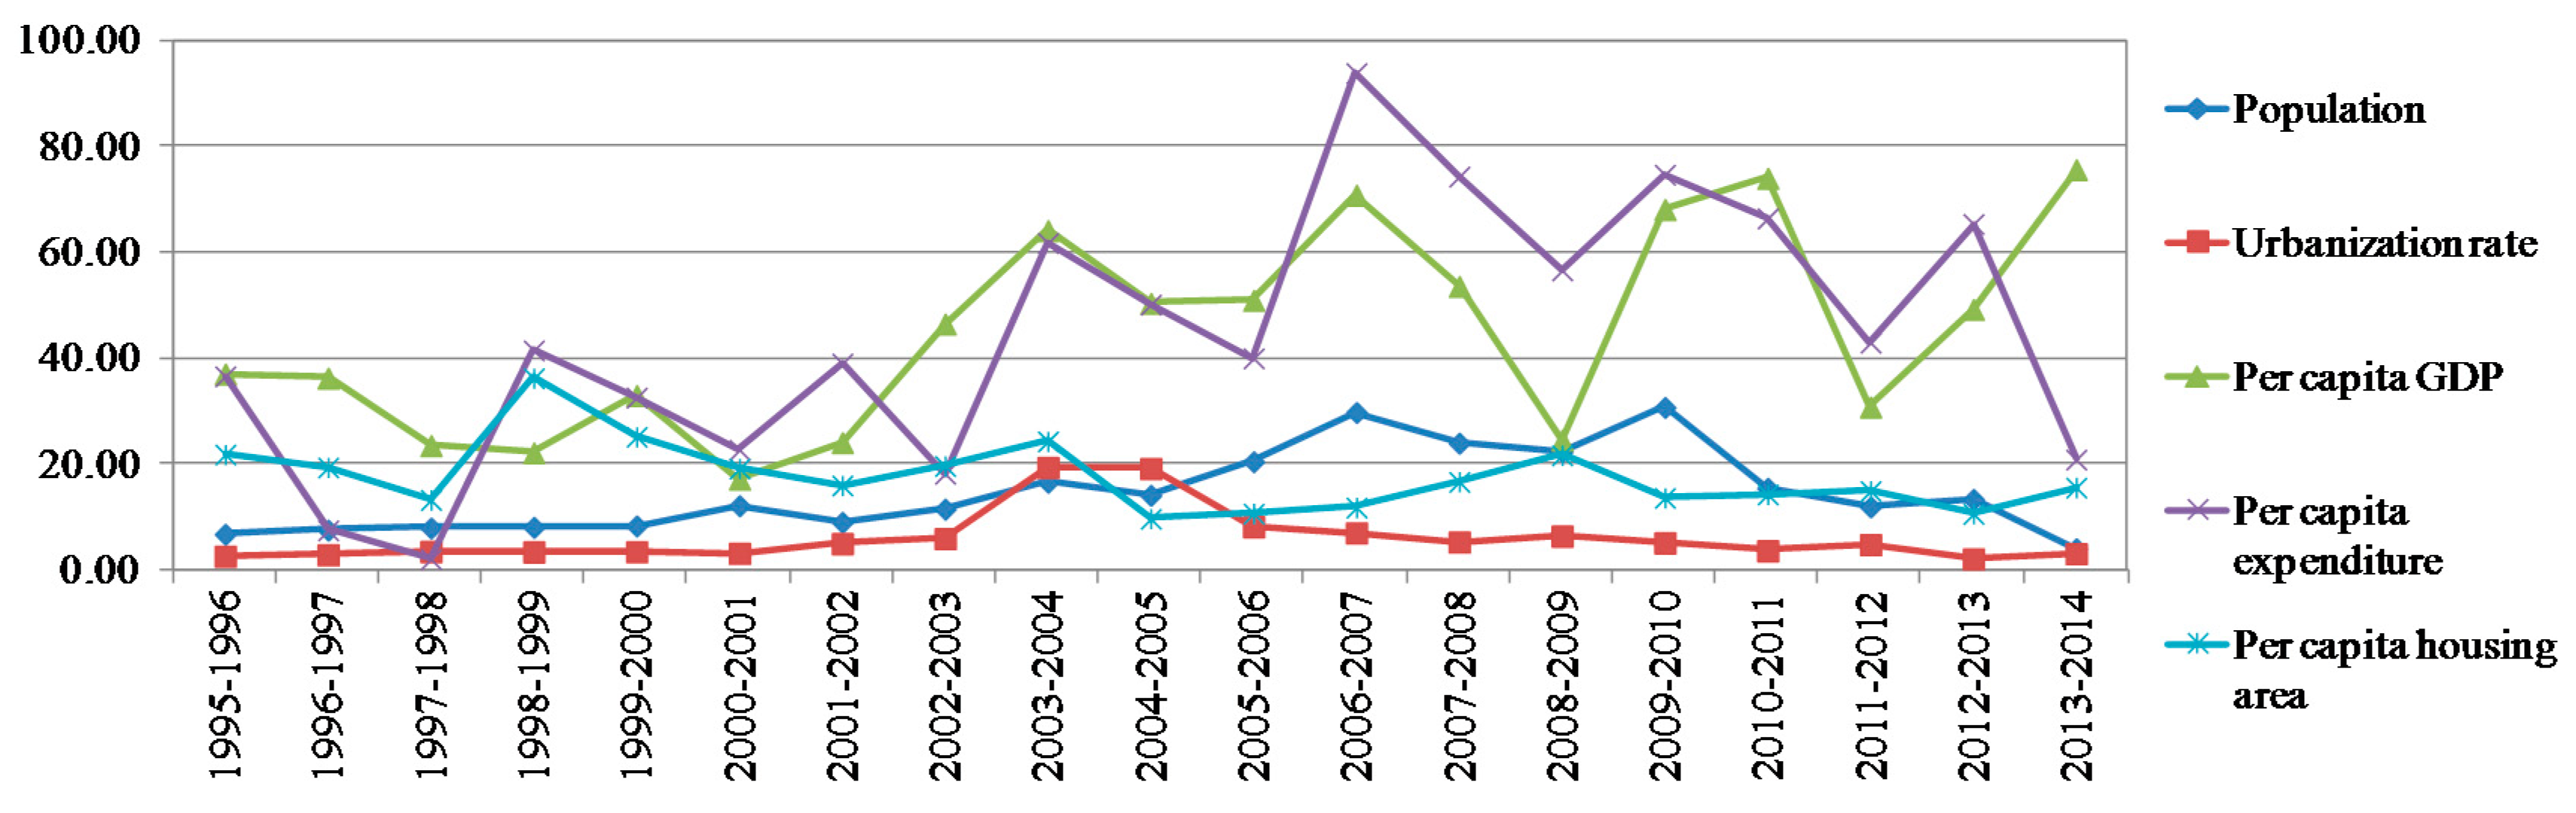
3.2. Influencing Factors of Carbon Emissions

The LMDI analysis indicated that total economic output, resident consumption level, and population size exerted positive impacts on TCEM, suggesting that economic development, population concentration, and enhancement of living standards were the main contributors to TCEM. Economic output and residents’ consumption level were of the greatest significance in this regard (Figure 4). Energy consumption intensity, energy consumption structure, and economic structure appeared to exert negative impacts on carbon emissions; energy consumption intensity was most significant among them. Energy structure was expressed by the proportion of coal to TEC, so it was suggested that it would be beneficial to reduce TCEM by using less coal (which had significantly higher carbon emissions intensity than other energies).
All the chosen factors indeed played roles in RCEM but showed varying levels of significance. Among them, per capita GDP and per capita expenditure were the most significant driving factors and their significance tended to increase over the study period; this indicated that economic development and enhancement of living standards had led to an increase in REC and a substantial increase in RCEM in Shanghai (Figure 5). Per capita housing area and population size also played significant roles, but the impact of urbanization was relatively small.
IAV emerged as the primary driving factor in ICEM (Figure 6). The contribution of industrial development to ICEM growth was especially significant around 2005. Energy consumption intensity and structure were the main limiting factors; a decline in energy intensity and the optimization of energy consumption structures were indicated to decrease ICEM. An increase in the proportion of heavy industry contributed to ICEM growth, but its contribution was smaller compared to IAV. Similar to TCEM, energy efficiency had a negative impact on ICEM.

3.3. Stage-Related Characteristics of Energy Consumption, Carbon Emissions and Influencing Factors

Studies have shown that the amount and proportion of industrial and residential energy consumption and carbon emissions are development stage-related, as are their influencing factors. Shanghai made an interesting empirical case study per such stage-related characteristics. Since 1995, Shanghai’s economy has grown exponentially alongside a dramatic transformation in city structure. According to the Shanghai Municipal Bureau of Statistics (Characteristics of Shanghai’s Economic Development Stages and Economic Growth Momentum of the 13th Five-Year Period), the economic development of Shanghai could be divided into three stages: 1995–2003, 2004–2008, and 2009–2014 which are consistent with lower middle-, higher middle- and high-income stages of the World Bank’s standard. The changes in Shanghai’s energy consumption, energy-related carbon emissions and the influencing factors which we observed were consistent with these economic development stages.
At the first stage from 1995 to 2003, Shanghai’s GDP and per capita GDP were less than 100 billion and 5000 USD, respectively. The proportion of IAV to GDP was higher than 40%, but decreased from 52.3 to 41.3%. Due to relatively slow economic development rates, limited population, and a decreasing proportion of IAV, Shanghai’s TCEM was relatively low and the annual increase was typically below 4 million tonnes (Figure 1). The proportion of IEC to TEC and ICEM to TCEM were higher than 70% and 65%, respectively (Figure 3). The influence of GDP on TCEM was high but not significant, and the effect of consumption expenditure was not yet clear (Figure 4).
The second stage was from 2004 to 2008, when Shanghai’s GDP grew rapidly at an average annual rate of 16.02%. In 2008, its GDP was close to 200 billion USD—about 2.5 times that in 2003. The population also grew quickly, from 17.65 million in 2003 to 21.41 million in 2008 at an average increase of more than 0.75 million. In 2008, per capita GDP was very close to 10,000 USD, indicating a higher development level and living standards. This stage witnessed the fastest growth in TCEM at 6.00 million tonnes annually, which was 1.53 times that of the previous stage (Figure 1). The proportion of REC remained stable, but that of IEC rapidly decreased (Figure 2 and Figure 3). The effect of GDP and consumption expenditure on TCEM grew increasingly significant (Figure 4); the latter became the most important driving factor in RCEM at this stage (Figure 5).
The year of 2008 marked a turning point which began the third stage, in which Shanghai’s service industry developed rapidly but industrial development lagged behind. IAV accounted for less than 40% of Shanghai’s GDP but its proportion still declined rapidly at an average of 1.4% yearly. Economic growth began to slow down to an average annual growth rate of about 8.98%. Population growth also slowed down to an average annual growth of 0.48 million. At this stage, Shanghai’s carbon emissions changed significantly inter-annually but still increased by 2.81 million tonnes per year. This period witnessed rapid growth in REC and RCEM overall apart from the year 2014 (Figure 2). The significance of GDP and consumption expenditure on TCEM slightly declined (Figure 4).

4. Discussion

International pressure in response to climate change issues and also national concerns regarding resource supply and environmental protection merit a comprehensive understanding of China’s energy consumption and carbon emissions [6,7]. A dual perspective on industrialization and urbanization, as both play significant roles in a country’s economic and social development, provides valuable insight into the trends and characteristics of energy consumption and carbon emissions at different stages of development [28,43,44]. Shanghai, a high-income city which is widely considered a role model for future development in eastern China, was used as a case study here to elucidate its temporal evolution and influencing factors of industrial and residential energy consumption and carbon emissions. The results represented a useful insight into the differentiated effects of industrialization and urbanization as well as potential future trends in energy consumption and carbon emissions from industrial and residential perspectives.
Under the World Bank’s standard, Shanghai has developed from a lower middle-income to a high-income city since 1995. The amount and structure of energy consumption changed significantly throughout this transition. TEC has trended upward and become stable, while TCEM continually increased from 1995 to 2014. The results from 1995 to 2000 were in accordance with a previous report by Qian and Yu [45], who analyzed carbon emissions in Shanghai, but the results based on actual data after 2000 exceeded their predictions suggesting that projections of energy consumption and carbon emissions are tenuous and require careful consideration.
Considering the structure of TCEM, the amount and proportion changes of IEC and ICEM were consistent with the development changes of Shanghai and were the results of industrial transformation, energy structure optimization, and citywide technical improvements. The amount and proportion of RCEM were still significantly smaller than those of ICEM across the study period but both increased steadily after 1995, especially at the third development stage. However, the proportion of Shanghai’s REC to TEC and RCEM to TCEM have a significant gap compared to developed countries or regions. Previous researchers have found that the residential sector represented about 17% of global CO2 emissions [24] and that the proportion in developed countries was even higher [46], but the proportions of REC and RCEM in Shanghai fell far below 17%. There are several reasons for this. The most important is that only direct residential energy consumption (i.e., in the home) is included in panel data from the China Energy Statistical Yearbook. It is suggested that indirect energy consumption related to daily life (e.g., hotel/restaurant, commuting, entertainment, travel), however, comprises a significant portion of actual residential energy consumption [46,47]. A preliminary survey in Ireland indicated that in-home energy consumption accounts for merely 42.2% of personal carbon emissions [48]. If indirect energy consumption is included, REC and RCEM are greater and account for a higher proportion of TEC and TCEM. Also, external thermal power plants supply a significant portion of Shanghai’s local residential electricity. Most external power plants use coal as the main input energy and have a a relatively low technical level, so the actual energy consumption and carbon emissions are underestimated with average power generation parameters in converting electricity to energy consumption and carbon emissions. Further research is yet needed to fully and accurately determine the actual REC and RCEM in Shanghai.
Carbon emissions are affected by many factors, and there were significant differences among the factors affecting TCEM, ICEM, and RCEM. Economic development and population concentration were the main driving forces of TECM, while the decline in energy intensity, optimization of energy structure, and economic structure adjustments had an inhibitory impact on carbon emissions. These results are in accordance with the findings of other scholars [10,42,49]. Although some existing research showed that technological improvements could reduce regional carbon emissions [29,36,44], this research indicated that the effect of technological improvements was not significant; this might be related to the insignificant changes in regional energy efficiency. There were significant differences between the influencing factors of ICEM and RCEM. Carbon emissions were a direct result of industrial development and IEC, and the results indicated that IAV was the most significant driving factor of ICEM. Energy structure optimization accompanied by a reduction in energy intensity also caused ICEM to decrease. Therefore, policies which bolster service industries, compel the usage of green energy, and push for the development of a low-carbon economy can help to reduce ICEM [42,50,51,52,53]. This research indicated per capita GDP and per capita expenditure were the core driving factors of RCEM, much like previous studies have shown [41,43,54]. Factors related to economic development and quality of life (i.e., improved living standards) altogether increased RCEM [55,56]. ICEM and RCEM were the major components of TCEM, so factors affecting ICEM and RCEM also affected TCEM, but at different strengths in different stages. In the early development stage, the factors influencing ICEM aligned with the main factors in TCEM. The decreasing proportion of industry and continued enhancement of living quality made the influencing factors of RCEM gradually more significant for TCEM [22].
Shanghai’s temporal evolution and influencing factors of energy consumption and carbon emissions had stage-related characteristics [28,57,58]. Although the low-income stage was not included in the study period from 1995 to 2014, there were still differences between lower middle-income to high-income stages. The proportions of IEC and ICEM continuously declined throughout the study period, but their quantities only began to decrease in the third stage when the proportion of IAV to GDP fell below 40%, which indicated that energy consumption and carbon emissions would continually increase until a region enters a high-income stage. The decline in ICEM occurred later than the decline in energy consumption [28]. Both the amount and proportion of REC and RCEM began to increase significantly at the high-income stage, indicating that urbanization did not begin until a higher stage of development was achieved [30]. REC and RCEM accounted for only a limited proportion of TEC and TCEM, so increases in REC and RCEM did not necessarily cause TEC and TCEM to increase. Even at high-income stages, the dominance of IEC and ICEM ensured similar trends between total and industrial energy consumption and carbon emissions. In short: economic structure and industrial development are always significant influencing factors in TCEM [36]. Increasing living standards can bring about a rapid increase in REC and RCEM. It is more difficult to lower TEC and TCEM if IEC and ICEM are not undergoing a sufficiently rapid decline. IEC and ICEM can be reduced by promoting industrial transformation, optimizing energy structures, and improving energy efficiency [16]. Strict restrictions on household energy consumption as it affects TEC may degrade living standards, so it may be more effective to promote clean and renewable energy and the usage of energy-saving appliances while ensuring an ample residential energy supply [22].

5. Conclusions

Although the temporal evolution and influencing factors discussed here relate to a highly representative city in China, this study contributes to a universal framework of energy consumption and carbon emissions from the dual perspective of industrialization and urbanization. It determined different change trends of industrial and residential energy and carbon emissions to obtain a comprehensive pattern of TEC and TCEM. The effects of IEC/ICEM and REC/RCEM on TEC/TCEM are related to development stages; at stages with higher development level, REC/RCEM play a more significant role in TEC/TCEM than IEC/ICEM. In Shanghai, REC/RCEM began to markedly increase and consumption expenditure became a significant driving force in TCEM upon entering the high-income stage. This implies that other cities—or China as a whole—may experience similar changes in energy consumption and carbon emissions as it continues to develop economically. It is not rational or realistic to solely use IEC and ICEM to predict the TEC and TCEM of a certain region or China.
Analysis of REC and RCEM should be carried out with diverse and targeted methods. The results show a significantly lower proportion of REC to TEC and RCEM to TCEM than Shanghai’s panel data, which suggests that indirect household energy consumption cannot be neglected. If indirect energy consumption is included, the amount and proportion of REC/RCEM might be significantly higher than the current results. Household surveys and carbon footprint analysis may be useful in carrying out comprehensive REC and RCEM calculations.
The influencing factors of TCEM are stage-related and differ from those of ICEM and RCEM. Targeted policies may help to control or even reduce energy consumption and carbon emissions. More emphasis should be placed on REC as China’s economy continues to develop and higher-quality urbanization is emphasized in future. Shanghai has not yet reached the most sophisticated stage of urbanization, as IEC and ICEM continue to dominate its energy consumption and carbon emissions. ICEM reduction policies should center around optimizing industrial structures, reducing industrial energy intensity, and optimizing energy structures. It is crucial to ensure a sufficient residential energy supply alongside the promotion of renewable energy and energy-saving appliances to control RCEM.

Author Contributions

P.L. designed and wrote the paper. W.S. collected the data and contributed to the modification. All authors have read and approved the final manuscript.

Funding

This research was funded by the National Natural Science Foundation of China of grant No. 41871209 and 41401187.

Acknowledgments

We are grateful to the editors and the anonymous reviewers for their exceptionally helpful comments and suggestions. We thanks Wangshu Mu in Arizona State University for his contribution on language editing.

Conflicts of Interest

The authors declare no conflict of interest.

References

  1. Messerli, B.; Grosjean, M.; Hofer, T.; Núñez, L.; Pfister, C. From nature-dominated to human-dominated environmental changes. Quat. Sci. Rev. 2000, 19, 459–479. [Google Scholar] [CrossRef]
  2. Fan, J. Chinese human geography and its contributions. J. Geogr. Sci. 2016, 26, 987–1000. [Google Scholar] [CrossRef] [Green Version]
  3. Burleson, E. Paris Agreement and Consensus to Address Climate Challenge. 2016. Available online: https://ssrn.com/abstract=2710076 (accessed on 22 February 2018).
  4. Shen, L.; Sun, Y. Review on carbon emissions, energy consumption and low-carbon economy in China from a perspective of global climate change. J. Geogr. Sci. 2016, 26, 855–870. [Google Scholar] [CrossRef] [Green Version]
  5. Intergovernmental Panel on Climate Change (IPCC). Summary for Policymakers. In Climate Change 2007: The Physical Science Basis. Contribution of Working Group I to the Fourth Assessment Report of the Intergovernmental Panel on Climate Change; Solomon, S., Qin, D., Manning, M., Averyt, K., Marquis, M., Eds.; Cambridge University Press: Cambridge, UK; New York, NY, USA, 2007. [Google Scholar]
  6. Liu, Z. China’s Carbon Emissions Report 2016: Regional Carbon Emissions and the Implications for China’s Low Carbon Development; Belfer Center for Science and International Affairs, Harvard University: Cambridge, MA, USA, 2016. [Google Scholar]
  7. Li, W.; Shen, Y.; Zhang, H. A factor decomposition on China’s carbon emission from 1997 to 2012 based on IPAT-LMDI model. Math. Prob. Eng. 2015, 2015, 943758. [Google Scholar] [CrossRef]
  8. Madlener, R.; Sunak, Y. Impacts of urbanization on urban structures and energy demand: What can we learn for urban energy planning and urbanization management? Sustain. Cities Soc. 2011, 1, 45–53. [Google Scholar] [CrossRef]
  9. Zhou, W.; Zhu, B.; Chen, D.; Griffy-Brown, C.; Ma, Y.; Fei, W. Energy consumption patterns in the process of China’s urbanization. Popul. Environ. 2011, 33, 202–220. [Google Scholar] [CrossRef]
  10. Xiao, B.; Niu, D.; Yu, H. Exploring the impact of determining factors behind CO2 emissions in China: A CGE appraisal. Sci. Total Environ. 2017, 581–582, 559–572. [Google Scholar] [CrossRef] [PubMed]
  11. Wang, J.; Zhao, T.; Zhang, X. Environmental assessment and investment strategies of provincial industrial sector in China—Analysis based on DEA model. Environ. Impact Assess. Rev. 2016, 60, 156–168. [Google Scholar] [CrossRef]
  12. Panayotou, T. Empirical Tests and Policy Analysis of Environmental Degradation at Different Stages of Economic Development; ILO Working Papers 992927783402676; International Labour Organization: Geneva, Switzerland, 1993; Available online: https://ideas.repec.org/p/ilo/ilowps/992927783402676.html (accessed on 1 August 2018).
  13. Wang, Z.; Shi, C.; Li, Q.; Wang, G. Impact of heavy industrialization on the carbon emissions: An empirical study of China. Energy Procedia 2011, 5, 2610–2616. [Google Scholar] [CrossRef]
  14. Price, L.; Worrell, E.; Martin, N.; Lehman, B.; Sinton, J. China’s Industrial Sector in an International Context; Energy Analysis Department Environmental Energy Technologies Division; Lawrence Berkeley National Laboratory: Berkeley, CA, USA, 2000. Available online: https://eetd.lbl.gov/sites/all/files/publications/lbl-46273-china-industrial-sectormay-2000.pdf (accessed on 2 August 2018).
  15. Pata, U.K. The effect of urbanization and industrialization on carbon emissions in Turkey: Evidence from ARDL bounds testing procedure. Environ. Sci. Pollut. Res. 2018, 25, 7740–7747. [Google Scholar] [CrossRef] [PubMed]
  16. Liu, L.; Fan, Y.; Wu, G.; Wei, Y. Using LMDI method to analyze the change of China’s industrial CO2 emissions from final fuel use: An empirical analysis. Energy Policy 2007, 35, 5892–5900. [Google Scholar] [CrossRef]
  17. Tian, Y.; Xiong, S.; Ma, X. Analysis of the potential impacts on China’s industrial structure in energy consumption. Sustainability 2017, 9, 2284. [Google Scholar] [CrossRef]
  18. Wang, Y.; Ge, X.; Liu, J.; Ding, Z. Study and analysis of energy consumption and energy-related carbon emission of industrial in Tianjin, China. Energy Strategy Rev. 2016, 10, 18–28. [Google Scholar] [CrossRef]
  19. Carbon Dioxide Information Analysis Center (CDIAC). Global, Regional, and National Fossil Fuel CO2 Emissions. 2007. Available online: http://cdiac.ess-dive.lbl.gov/trends/emis/em_cont.html (accessed on 8 October 2017).
  20. Lu, D.; Fan, J. 2050: Regional Development in China; Science Press: Beijing, China, 2009. [Google Scholar]
  21. Suh, S. Are services better for climate change? Environ. Sci. Technol. 2006, 40, 6555–6560. [Google Scholar] [CrossRef] [PubMed]
  22. Fan, J.; Li, P. Analysis on the future energy consumption and preliminary discussion on carbon emission of China from the perspective urbanization. Adv. Earth Sci. 2011, 26, 57–65. (In Chinese) [Google Scholar]
  23. Carlsson-Kanyama, A.; Engström, R.; Kok, R. Indirect and direct energy requirements of city households in Sweden: Options for reduction, lessons from modeling. J. Ind. Ecol. 2005, 9, 221–235. [Google Scholar] [CrossRef]
  24. Nejat, P.; Jomehzadeh, F.; Taheri, M.M.; Gohari, M.; Majid, M.Z.A. A global review of energy consumption, CO2 emissions and policy in the residential sector (with an overview of the top ten CO2 emitting countries). Renew. Sustain. Energy Rev. 2015, 43, 843–862. [Google Scholar] [CrossRef]
  25. Lin, W.; Chen, B.; Luo, S.; Liang, L. Factor analysis of residential energy consumption at the provincial level in China. Sustainability 2014, 6, 7710–7724. [Google Scholar] [CrossRef]
  26. Department of Energy & Climate Change (DECC). Energy Consumption in the UK (2015), Chapter 3: Domestic Energy Consumption in the UK between 1970 and 2014; DECC: London, UK, 2015. Available online: https://www.connaissancedesenergies.org/sites/default/files/pdf-actualites/ecuk_chapter_3_-_domestic_factsheet.pdf (accessed on 10 October 2017).
  27. U.S. Energy Information Administration (EIA). State Energy Data System (SEDS), 1960–2016 (Complete); EIA: Washington, DC, USA, 2018. Available online: http://www.eia.gov/state/seds/seds-data-complete.cfm?sid=US (accessed on 28 July 2018).
  28. Li, K.; Lin, B. Impacts of urbanization and industrialization on energy consumption/CO2 emissions: Does the level of development matter? Renew. Sustain. Energy Rev. 2015, 52, 1107–1122. [Google Scholar] [CrossRef]
  29. Zhang, N.; Yu, K.; Chen, Z. How does urbanization affect carbon dioxide emissions? A cross-country panel data analysis. Energy Policy 2017, 107, 678–687. [Google Scholar] [CrossRef]
  30. Miao, L. Examining the impact factors of urban residential energy consumption and CO2 emissions in China—Evidence from city-level data. Ecol. Indic. 2017, 73, 29–37. [Google Scholar] [CrossRef]
  31. Fan, J.L.; Zhang, Y.J.; Wang, B. The impact of urbanization on residential energy consumption in China: An aggregated and disaggregated analysis. Renew. Sustain. Energy Rev. 2017, 75, 220–233. [Google Scholar] [CrossRef]
  32. Song, J. Factor decomposition of carbon emissions from energy consumption of Shandong Province based on LMDI. Resour. Sci. 2012, 34, 35–41. (In Chinese) [Google Scholar]
  33. Lin, B.; Ouyang, X. Energy demand in China: Comparison of characteristics between the US and China in rapid urbanization stage. Energy Convers. Manag. 2014, 79, 128–139. [Google Scholar] [CrossRef]
  34. Wang, X.; Wang, Y.; Duan, H. Forecasting area’s carbon emissions of energy consumption and controllability study. China Popul. Resour. Environ. 2014, 24, 9–16. (In Chinese) [Google Scholar] [CrossRef] [PubMed]
  35. Sun, J.W.; Ang, B.W. Some properties of an exact energy decomposition model. Energy 2000, 25, 1177–1188. [Google Scholar] [CrossRef]
  36. Xu, S.C.; He, Z.X.; Long, R.Y. Factors that influence carbon emissions due to energy consumption in China: Decomposition analysis using LMDI. Appl. Energy 2014, 127, 182–193. [Google Scholar] [CrossRef]
  37. Ang, B.W.; Liu, F.L.; Chew, E.P. Perfect decomposition techniques in energy and environmental analysis. Energy Policy 2003, 31, 1561–1566. [Google Scholar] [CrossRef]
  38. Ang, B.W. LMDI decomposition approach: A guide for implementation. Energy Policy 2015, 86, 233–238. [Google Scholar] [CrossRef]
  39. Ang, B.W. The LMDI approach to decomposition analysis: A practical guide. Energy Policy 2005, 33, 867–871. [Google Scholar] [CrossRef]
  40. Hoekstra, R.; van den Bergh, J.C.J.M. Comparing structural decomposition analysis and index. Energy Econ. 2003, 25, 39–64. [Google Scholar] [CrossRef]
  41. Wang, Q. Effects of urbanisation on energy consumption in China. Energy Policy 2014, 65, 332–339. [Google Scholar] [CrossRef]
  42. Wang, G.; Chen, X.; Zhang, Z.; Niu, C. Influencing factors of energy-related CO2 emissions in China: A decomposition analysis. Sustainability 2015, 7, 14408–14426. [Google Scholar] [CrossRef]
  43. Zhao, X.; Li, N.; Ma, C. Residential energy consumption in urban China: A decomposition analysis. Energy Policy 2011, 41, 644–653. [Google Scholar] [CrossRef]
  44. Liu, X.; Bae, J. Urbanization and industrialization impact of CO2 emissions in China. J. Clean. Prod. 2018, 172, 178–186. [Google Scholar] [CrossRef]
  45. Qian, J.; Yu, L. Study on Contribution of CO2 Emissions from Fossil Fuel in Shanghai. Shanghai Environ. Sci. 2003, 22, 836–839. (In Chinese) [Google Scholar]
  46. Estiri, H. The indirect role of households in shaping US residential energy demand patterns. Energy Policy 2015, 86, 585–594. [Google Scholar] [CrossRef]
  47. Weber, C.L.; Matthews, H.S. Quantifying the global and distributional aspects of American house hold carbon footprint. Ecol. Econ. 2008, 66, 379–391. [Google Scholar] [CrossRef]
  48. Kenny, T.; Gray, N.F. A preliminary survey of house hold and personal carbon dioxide emissions in Ireland. Environ. Int. 2009, 35, 259–272. [Google Scholar] [CrossRef] [PubMed]
  49. Zhang, J.; Zhang, Y.; Yang, Z.; Fath, B.D.; Li, S. Estimation of energy-related carbon emissions in Beijing and factor decomposition analysis. Ecol. Model. 2013, 252, 258–265. [Google Scholar] [CrossRef]
  50. Feng, T.; Sun, L.; Zhang, Y. The relationship between energy consumption structure, economic structure and energy intensity in China. Energy Policy 2009, 37, 5475–5483. [Google Scholar] [CrossRef]
  51. Shao, C.; Guan, Y.; Wan, Z.; Guo, C.; Chu, C.; Ju, M. Performance and decomposition analyses of carbon emissions from industrial energy consumption in Tianjin, China. J. Clean. Prod. 2014, 64, 590–601. [Google Scholar] [CrossRef]
  52. Shao, S.; Yang, L.; Cao, J. Study on influencing factors of CO2 emissions from industrial energy consumption: An empirical analysis based on STIRPAT model and industrial sectors’ dynamics panel data in Shanghai. J. Financ. Econ. 2010, 36, 16–27. (In Chinese) [Google Scholar]
  53. Wang, Q.; Li, R.; Jiang, R. Decoupling and decomposition analysis of carbon emissions from industry: A case study from China. Sustainability 2016, 8, 1059. [Google Scholar] [CrossRef]
  54. Liu, Y. Exploring the relationship between urbanization and energy consumption in China using ARDL (autoregressive distributed lag) and FDM (factor decomposition model). Energy 2009, 34, 1846–1854. [Google Scholar] [CrossRef]
  55. Fan, J.; Liang, Y.; Tao, A.; Sheng, K.; Ma, H.; Xu, Y.; Wang, C.; Sun, W. Energy policies for sustainable livelihoods and sustainable development of poor areas in China. Energy Policy 2011, 39, 1200–1212. [Google Scholar] [CrossRef]
  56. Jones, D. How urbanization affects energy-use in developing countries. Energy Policy 1991, 19, 621–630. [Google Scholar] [CrossRef]
  57. Poumanyvong, P.; Kaneko, S. Does urbanization lead to less energy use and lower CO2 emissions? A cross-country analysis. Ecol. Econ. 2010, 70, 434–444. [Google Scholar] [CrossRef]
  58. Sharma, S.S. Determinants of carbon dioxide emissions: Empirical evidence from 69 countries. Appl. Energy 2011, 88, 376–382. [Google Scholar] [CrossRef]
Figure 1. Total energy consumption (TEC) and total carbon emissions (TCEM), Shanghai 1995–2014.
Sustainability 10 03054 g001
Figure 2. Residential energy consumption (REC) and residential carbon emissions (RCEM), Shanghai 1995–2014.
Sustainability 10 03054 g002
Figure 3. Industrial energy consumption (IEC) and industrial carbon emissions (ICEM), Shanghai 1995–2014.
Sustainability 10 03054 g003
Figure 4. Index decomposition analysis (IDA) of TCEM influencing factors, Shanghai.
Sustainability 10 03054 g004
Figure 5. IDA of RCEM influencing factors, Shanghai.
Sustainability 10 03054 g005
Figure 6. IDA of ICEM influencing factors, Shanghai.
Sustainability 10 03054 g006
Table 1. Conversion factors and carbon emission coefficients of different types of energy.
TypeUnitConversion Factors from Physical Unit to Coal Equivalent (CE, kg)Carbon Emissions Coefficient (C, kg)
Raw coalkg0.71430.5478
Cleaned coalkg0.90000.6885
Other washed coal kg0.28570.3636
Cokekg0.97140.8303
Coke oven gasm30.59290.2024
Other coal gasm30.62430.2444
Crude oilkg1.42860.8363
Gasolinekg1.47140.8197
Kerosenekg1.47140.8421
Diesel oilkg1.45710.8616
Fuel oilkg1.42860.8823
Liquefied petroleum gaskg1.71430.8632
Refinery gaskg1.57140.7222
Natural gasm31.21500.5956
Other petroleum productskg1.42860.7025
Other coking productskg1.14290.8372
Heatmillion J0.0341 0.0755
ElectricitykWh0.12290.3023

