A Spatial Zoning Model of Municipal Administrative Areas Based on Major Function-Oriented Zones


1
School of Architecture, Harbin Institute of Technology, 66 West Dazhi Street, Nangang District, Harbin 150001, China
2
Hei Longjiang Cold Region Urban-Rural Human Settlements Science Key Laboratory, 66 West Dazhi Street, Nangang District, Harbin 150001, China
*
Authors to whom correspondence should be addressed.
Sustainability 2018, 10(9), 2976; https://doi.org/10.3390/su10092976
Submission received: 30 July 2018
/
Revised: 16 August 2018
/
Accepted: 17 August 2018
/
Published: 21 August 2018
Abstract
:The multi planning contradictions and maladjustment of spatial management that evolved from an unbalanced development are becoming increasingly serious in China; therefore, it is imperative to know how to coordinate spatial planning. The scientific division of spatial unit attributes and the identification of ecological–agricultural production–living spaces (EPLs) have become the key scientific problems of this period. The existing urban structure zoning model, the urban growth boundary model, and the function-oriented zoning model show three main shortcomings: the difficult data acquisition and the large limitation of the application because of their high requirements of the related parameters, strong subjective weight setting, and lack of comprehensive zoning in the EPLs practice. This paper builds a quantitative and easily operated model for the spatial zoning of municipal administrative areas (MAA) based on the existing spatial equilibrium model for regional development. Three representative cities in China were modeled empirically with this model and the results were compared with those obtained by the existing models. We investigated the image consistency of this model to the three existing models where the Kappa values were 85.9%, 88.2%, and 85.2%, respectively, with an average of 86.4%. This showed that the model could reduce the data limitation and expand the scope of the application while ensuring the accuracy of the model’s analysis results. Meanwhile, the EPLs zoning was clearer, which made the spatial plan coordination more efficient and scientific. Overall, this model could not only solve the problem of the EPLs zoning and spatial plan coordination in MAA, but also guide urban land use planning from two dimensions of space and time and effectively promote the coordination and sustainable development of spatial planning.
1. Introduction
Spatial zoning is a public policy to achieve strategic guidance, rigid management, and control. The question of how to coordinate spatial zoning has become a global topic [1]. Meanwhile, the content and scale of spatial zoning are distinctly different from the national conditions and development. Overall, the spatial zoning of developed countries such as in Europe, the United States and Japan, is relatively mature and complete [2,3,4], while that of developing countries such as China is relatively backward and unsystematic. In terms of the content of spatial zoning, developed countries have turned from material construction planning to social development planning, and the social and environmental factors involved have been given much more attention [5]. From the scope of spatial zoning, more attention has been paid to wide range spatial zoning. For example, the regional development planning of Holland, Britain, Germany, and Hungary take the whole country as the planning object [2,6,7,8]. While undertaking a comprehensive survey of the spatial zoning of developed countries, we found that they had three important characteristics: (1) This spatial zoning was relatively complete [2,3,4] and the level was clear [1]. Taking Japan as an example, the national comprehensive development plan has been compiled since the 1960s and a round of planning is compiled every ten years. At present, it has established a perfect planning and management system and formed spatial zoning for the full coverage of the country to wide areas, and then to city–town–village, which was adapted to the Japanese administrative system [9]. (2) Spatial zoning has changed from a traditional concept with economic growth as the primary goal to the comprehensive and sustainable development of the economic, social, and ecological environments [10,11,12,13,14,15,16,17]. (3) Much attention has been paid to the major existing problems of these countries such as the industrial structure adjustment after economic growth, resource and environment pressures, the imbalance of regional and intra-regional development, energy shortages, global climate change, and so on [18,19,20,21,22,23,24]. In all, the spatial zoning of developed countries has made positive contributions to the local development in several ways such as a balance of regional development, control of land use, environmental protection, and so on [4]. In comparison, China is a developing country with a high population density and the land ownership of China is land nationalization. Meanwhile, Chinese urbanization is developing at a high speed [25,26]. All of these natures make Chinese spatial zoning unique and very different from that of developed countries. The study of Chinese spatial zoning can not only be used to supplement and refine the existing spatial zoning of western developed countries, but can also provide strong support and a basis for the local spatial planning (zoning) of all levels of governments in China.
Municipal administrative areas (MAAs) are a key component of administrative zoning systems and an important field of zoning adjustment in China. Spatial zoning based on MAAs plays an important role in administrative systems and promotes the implementation of space control policies. However, in actual urban spatial zoning, plans are often contradictory and the effect of management overlap is particularly serious. Meanwhile, the planning system is hierarchical, and strategies where the government value the city but neglect the rural areas, and extensive land use have caused great difficulties for governments at all levels [27]. To overcome these problems, the construction of a unified spatial system to identify ecological–agricultural production–living spaces (EPLs) [28,29] is crucial for spatial plan coordination [30]. Here, the EPLs include the ecological space mainly used for ecological services and ecosystem maintenance (such as woodlands, grasslands, and so on), the agricultural production space that is mainly for agricultural production (such as basic farmlands, general farmlands for agricultural production, etc.), and the living space, which mainly undertakes the construction and economic development of the urban and rural areas (such as the urban built-up area, urban planning area and development zones, and rural living land).
As for the empirical research into spatial zoning reported previously, most do not use a pattern of equilibrium development [31], which gives priority to the development of MAAs. Objectively speaking, this pattern helps society achieve a higher economic growth [32,33]. However, there are growing gaps of economic, societal, and environmental factors between urban and rural MAAs, resulting in problems such as the deterioration of urban environmental quality, house and traffic crowding, and an increase in urban crime rates. Meanwhile, the amount of agricultural and ecological land has decreased, and the ecological environment has been damaged [34,35,36,37]. Recently, with the proposal of a more scientific outlook on development, decreasing the gaps between urban and rural areas and ensuring the equilibrium development of the economy, society, and the environment in MAAs under limited resources have become the main principles of urban spatial zoning [38]. Similarly, developed countries such as Germany, France, the United States, and the United Kingdom have encountered the same difficulties in the process of industrial development. They have also adopted strategies of equilibrium development to balance the development of land space and environmental protection [39,40,41,42].
There has been a great deal of research on MAA spatial zoning models, and three main models have been established: the urban structure zoning model, the urban growth boundary model, and the function-oriented zoning model. Of them, the urban structure zoning model has been widely used for early MAA spatial zoning. Using this model, the mono-centric model and multi-centric model have been used to study the influence of city sprawl in Seoul and the Mediterranean during different periods [43,44,45,46,47,48]. For the urban structure zoning model, its mathematical expression has advantages in exploring the influence of spatial dynamic change factors and their relationships. With the intensification of urban expansion to agriculture and ecology, empirical research on urban growth boundaries have been studied using many methods such as GIS and cellular automaton, and the urban growth boundary model became the mainstream model for the zoning of regional living space [49,50,51,52,53,54,55]. Generally, the urban growth boundary model realizes the boundary simulation of urban living space in different periods using different zoning methods and establishes an evaluation system of subjective weight settings. Therefore, it is useful in guiding urban expansion and land use. With the increasing chaos of urban spatial functions, the function-oriented zoning model has become increasingly useful. This model is divided into two categories. The first is the Major Function-Oriented zoning model such as the spatial equilibrium model for regional development, which is the most representative model [56]. This model is based on the main influencing factors in the economy, society, environment, and politics, and the model uses the method of setting a subjective weight to zone the major function of the region, providing the basis for regional function orientation and a future development direction. It has been widely used in land development [57,58,59,60,61] in many of the municipal–county administrative areas of China, and the correctness of the model has been verified empirically. The second is the EPLs zoning model. In recent years, with the proposal of multi-plan coordination, growing attention has been paid to a number of EPLs zoning models using subjective weight settings based on function zones. For example, Liu and colleagues explored an evaluation method to classify and evaluate EPLs based on the classifications of land use [62]. This evaluation system is a reference for the classification planning and optimization of EPLs. The function-oriented zoning model has aided in the construction of a set of subjective evaluation systems, and due to its practicality, it has been widely applied in the field of spatial zoning.
Generally, the urban structure zoning model studies the factors that affect the urban form and the relationship between them based on strong economic logic derivation. It has been widely used in urban spatial zoning and urban sprawl. However, the factors it studies belong to the economic field and its combination with urban planning is not strong, and many factors cannot be quantified, so it cannot effectively solve the practical problems of spatial plan coordination. The key purpose of the urban growth boundary model is to construct an evaluation system of subjective weight settings and to simulate the urban development boundary during different periods using different models. Given the existence of subjective weight settings, the zoning of the spatial boundary obtained with this model is relatively subjective. As a result, it cannot be used effectively to guide the spatial plan coordination. The function-oriented zoning model can be used to effectively classify optimal development zones, key development zones, prohibited zones, limited development zones, and EPLs in a city, and gives a qualitative evaluation of urban functional attributes from the view of development. Nevertheless, in this model, there is a strong subjective influence of subjective weight settings on zoning [62].
In all, the existing MAA spatial zoning cannot effectively guide the implementation of MAA planning, which leads to various intensifying contradictions between the planning content and spatial governance. Meanwhile, the land-use planning indicator of MAA cannot be used directly, construction projects are difficult to perform, and the management of ecological space is disordered. These problems have led to the resistance of social and economic development in MAAs. In order to solve these problems, it is of utmost importance to establish a scientific and effective MAA spatial zoning model (M-MSZ) for the zoning of MAAs. In this study, based on the spatial equilibrium model for regional development, we constructed an M-MSZ under the framework of spatial equilibrium theory [63,64,65]. The obtained model was optimized by a statistical analysis and compared with the existing spatial zoning model (including the urban structure zoning model, urban growth boundary model, and major function-oriented zoning model) under the same factors. It was found that the model showed advantages related to its quantitative, objective, scientific mechanism, and easily accessible data sources. Moreover, it provided an efficient and unified EPLs zoning map for MAA spatial plan coordination, and it showed a higher cost-effectiveness, and was more efficient and precise in the simulation of urban land use planning.
It is necessary to explain that in this paper, the major function-oriented zones’ delimitation of MAA was used to coordinate with the M-MSZ to formulate a zoning standard of MAA. EPLs zoning was carried out based on this zoning standard, as shown in Figure 1. Meanwhile, the M-MSZ realized the EPLs spatial zoning of MAAs by constructing an evaluation system of spatial development suitability. Therefore, the M-MSZ can not only carry out the delimitation of EPLs, but can also realize the zoning of spatial development suitability. In the following part of this paper, the applications in both EPLs’ delimitation and spatial development suitability of MAA were conducted.
2. Construction, Analysis, and Optimization of M-MSZ
For the zoning of MAAs, we first need to consider the spatial development suitability. Starting with the selection of factors that affect the development of the MAA space, we constructed the initial model through the mathematical modeling of economics, then used a correlation analysis and regression analysis to determine the effective variables. After this, regression analysis was used to illustrate the explaining the degree of variables to dependent variables.
2.1. Selection of Factors Influencing the Suitability for Spatial Development
How to select important representative factors from a large number of factors that influence the spatial function of MAA was the focus of building the M-MSZ. In light of the existing problems of MAA spatial zoning in China such as intensified planning contradictions, the difficult implementation of construction projects, disordered ecological space management and control, etc., we selected the influencing factors of the M-MSZ through statistics found in the literature, expert advice, and a questionnaire survey of MAA participants regarding the leading factors that affect Chinese MAA spatial zoning. The questionnaire surveys are shown in Section 1 of the Supporting Information.
The literature selection was carried out by combining forward retrieval with reverse retrieval. For forward retrieval, we studied the literature published in the Web of Science, KCI-Korean Journal Database, Russian Science Citation Index, MEDLINE, Derwent Innovations Index, SciELO Citation Index, and CNKI from 1950–2018. (1) The topics or keywords included spatial equilibrium, spatial zoning, urban spatial growth boundary zoning, urban structure model, major function-oriented zones delimitation, planning coordination, multi-plan coordination, three-plan coordination, spatial planning, sustainable development model, land use, and land expansion. (2) These studies were published in journals on sociology, architectural science and engineering, environmental science and resource utilization, macroeconomic management, and sustainable development. (3) The types of literature included articles, meetings, reviews, patents, books, and letters. (4) The research domains included the social sciences and science technology. (5) The research directions included geography, urban studies, sociology, operational research, and management science. (6) The literature selection was chosen first in the order of greatest relevance, then the frequency of citation, and the publication date third. For the reverse retrieval, we investigated the cited references of each study that was found by the forward retrieval and found the relevant literature. Finally, a combination of the forward retrieval and reverse retrieval were used to eliminate any duplicated studies. A literature statistical survey was done from the statistics of relevant articles including 334 Chinese articles that were published during 1981–2018 (journals, conferences, and theses) and 424 SCI and SSCI papers that were published from 1961–2018 (journals and conferences). The operation of the literature surveys and a list of part of the literature are shown in Section 2 of the Supporting Information. We filtered the factors according to the occurrence frequency, so only the factors with a frequency of more than 60% were chosen for the M-MSZ, as shown in Table 1. Land renovation, administrative rank, and interregional interaction are not universal (factor occurrence frequency of less than 60%) and were not used as factors in the initial model.
For expert advice, each group of subjects contained five experts, and the total number of experts was 50. The average score of each class of five experts was scored according to the 50 valid questionnaires. The opinion of each of them was equally important. The results are shown in Table 2 and include experts working in Chinese universities and experts in engineering planning and design in China. The experts working in universities majored in five fields including land planning, urban and regional planning, urban planning, urban design, and environmental protection and planning. The experts in engineering planning and design also majored in these five fields. It was found that land renovation, administrative rank, and interregional interaction received the lowest scores in the expert survey, which meant that they were less important than the other factors. Herein, only factors with a score of more than 60% were chosen for the model.
Meanwhile, from the perspective of human-land relations, the scale of MAA living space also depends on the choice of MAA participants for the living space. A total of 25,341 valid questionnaires investigating the living space choices were made from 25 MAAs with different scales, as shown in Table 3. The 25 MAAs included Beijing, Shanghai, Harbin, Changchun, Taiyuan, Shijiazhuang, Jinan, Kunming, Lanzhou, Urumqi, Langfang, Qigihar, Jilin, Yichang, Lijiang, Baotou, Yinchuan, Sansha, Siping, Jingdezhen, Zunyi, Songyuan, Guangan, Huanan, and Gongzhuling. The questionnaire used the influencing factors of the related research as the main reference, and it was designed in the form of open answers with a structure of a single-factor scoring protocol. These factors with a score of more than 60 were considered to be the most important by the surveyed MAA participants when choosing a living space.
As a result, 11 factors were chosen as the initial influencing factors of the MAA spatial development model, these being: economic situation, location advantage, transport superiority degree, population quantity, topography and terrain, land quantity, environmental capacity, ecosystem vulnerability, utilization of water resources, natural disasters, and urban structure.
2.2. Construction of M-MSZ
Through the selection of the above factors, we attempt to build an M-MSZ based on the spatial equilibrium model for regional development. Generally, it is believed that the realization of regional spatial equilibrium requires a reasonable flow of all kinds of resources (economic, social, and ecological) among the regions [56]. Therefore, it is necessary to derive the inevitable relationship between the indexes of the MAA comprehensive development state to create a reasonable flow. The index reflects the utility of MAA spatial development. Here, we used D to represent the spatial development suitability of the MAA. Due to the existence of spatial equilibrium, the difference in D values for different regions can be generated. If we set the population quantity of region Ri and region Rj as Ni and Nj, respectively, then the spatial equilibrium model for regional development is given by Equation (1) [56]:
We assume that the response of MAA participants to land development is the same and the capital elements have complete liquidity. The transportation costs for each commodity from different enterprises to each MAA participant should be paid. The spatial distribution of the main bodies in the MAA can be used to decide the MAA spatial function [66]. The construction process of the M-MSZ can be formed as follows:
First, we simply considered the economic factors and divided the MAA commodities into two groups: land commodities and all other commodities. Then, the maximum utility of the MAA development was given as the price function of three variables including the economic situation of the MAA, and the price of land and other commodities [67] as shown in Equation (2), where D is the utility of spatial development suitability in MAA, Y is the economic situation, G is the price of other commodities, R is the price of land commodities, and μ is a constant indicating the share of the expenditure of other commodities on the total consumption of MAA commodities.
Given the existence of iceberg transport costs and the Marshallian demand for other commodities during transactions [67,68,69], the price of other commodities is a function of three variables. These three variables encompass the preference of MAA participants for other commodities [70,71], their own location, and the number of other commodities available [72], as shown in Equation (3), where t is the transaction cost of other commodities per unit distance; m is the type of the other commodity; σ represents the substitution elasticity between two kinds of MAA commodities; P1 is the preference of MAA participants to other commodities; y + r0 is the location advantage of MAA participants; y represents the external location advantage (i.e., the distance between the research area and the urban center of the surrounding cities); and r0 is the internal location advantage (i.e., the distance between the research area and the MAA center).
In this paper, we assumed that the size of the urban space was determined by the number of urban production enterprises [73], which is related to the urban structure. Given the existence of iceberg transport costs, we can obtain Equation (4). M(r) is an urban structure with a radius of r (the distance from the MAA center to the research boundary). Then, Equations (3) and (4) can be entered into Equation (2) to obtain Equation (5).
As there is a Marshallian demand during the transaction of land commodities [68], we used λ = (1–μ)/μ and obtained Equation (6), where L is the total land commodities. As is already known, there is an inverse relationship between L and population agglomeration [74]. When the function of population agglomeration is integrated, we can obtain the population quantity of the area, N, as shown in Equation (7). Then, the population quantity is a function of N1 (population agglomeration) and L, as shown in Equation (8).
Generally, it is believed that there are two factors affecting the price of land commodities in MAAs: the location advantage (y + r0) and transport superiority degree (J) [75,76]. However, from the aspect of spatial equilibrium, MAA participants also consider the factors of resource difference, environment, and externality when choosing a living space. Therefore, the preference variable of MAA participants to land commodities can be introduced as P. According to questionnaires regarding the main consideration of MAA participants from 25 MAAs with different scales when choosing the living space, P is predominantly attributed to five aspects: topographic and terrain, natural disaster, utilization of water resources, environmental capacity, and ecosystem vulnerability. In this study, the development utility function focused on the comparison of MAA land development suitability instead of the utility calculation of other commodities, so the preference of MAA participants to other commodities was not considered. If we assumed that MAA participants had the same preference for other commodities, then p1 = (σ−1)/σ and Equation (9) can be obtained, where X1 is the share of preference of MAA participants to the price of land commodities, X2 is the share of location advantage in the price of land commodities, and X3 is the share of transport superiority degree in the price of land commodities. When Equations (8) and (9) are entered into Equation (5), we can obtain Equation (10), which is the initial form of the M-MSZ built in this paper.
2.3. Statistical Analysis and Optimization of M-MSZ
The model was analyzed and optimized by using a statistical method, and the final model was determined on the basis of optimization. In this paper, 420,436 random valid samples from the three MAAs above-mentioned in Heilongjiang Province were selected. The land sample was taken from the part of the three MAAs and was merged and decomposed according to the above 13 factors, and then 420,436 vector landscapes with different sizes and factors were obtained. Correlation and regression analyses were carried out. The correlation analysis was based on the nonlinear correlation, and the results of curve correlation coefficients and significance are shown in Table 4. This showed that the Sig value of all of the coefficients was compared with 0.05 and 0.01, and it can be seen that only the difference between the coefficients of x6 and x13 were not significant. The regression analysis was done according to the multivariable nonlinear regression, and the regression analysis parameters and the significance are shown in Table 4. By comparing F with Fa (k–1, n–k) of various parameters, it was found that only x6 and x13 showed no significant influence on the interpretation of the dependent variable, y. All of the other parameters had a significant influence on y, which was similar to the results of correlation analyses. Based on the above analysis, this paper eliminated x6 and x13 because of their poor relevance and explanation to y. After the elimination, the correlation between the other factors was not strong, as shown in Table 5, which proved that each of the selected factors could be regarded as an independent factor.
Therefore, we removed x6 and x13. Then, the value of L was mainly determined by the available land volume, L1, and the value of M was mainly determined by M1, or the pending development zones. Through the above analysis, the model was adjusted to give Equation (11).
2.4. Numerical Simulation Analysis of M-MSZ
Based on the above models and Equation (10), the numerical simulation was carried out under the support of MATLAB to obtain the contribution rate of various parameters in the model. As we know, the values of the coefficients such as μ, t, x1, x2, x3, and σ will not affect the evaluation of spatial development suitability in the same MAA. Therefore, this paper used the coefficient values reported by Fujita et al., which were taken as 0.5, 0.005, 0.45, 0.2, 0.35, and 2, respectively [77,78,79]. These coefficient values have also been cited by many other works [80,81,82]. Meanwhile, it was assumed that MAA participants had the same aspirations in the choice of living space. The simulation results are shown in Figure 2.
It can be seen that the attributes of land quantity, population quantity, and economic situation in the model are higher than any other aspects. Therefore, this suggests that developers will not pay much attention to the constraints of other factors and develop the region as much as possible when the land quantity is sufficient, the population size is big, and the economic situation is favorable. When the regional land quantity, population quantity, and economic situation are unfavorable, developers will consider all of the factors that influence MAA development and make a comprehensive judgment of whether the researched zone is suitable for development. Compared with land quantity, population quantity, and economic situation, the contribution rates of location advantage, transport superiority degree, and urban structure to the model were low. Meanwhile, the five parameters of P including topographic and terrain, natural disaster, utilization of water resources, environmental capacity, and ecosystem vulnerability showed the lowest attribution to the model. Through the numerical simulation analysis, it was found that the contribution rate of all kinds of influence factors to the M-MSZ conformed to the basic situation of current MAAs zoning in China [57,58,59,60,61,62].
3. Validation and Application of the M-MSZ
This model cannot only zone EPLs in MAA, but can also make the MAA spatial zoning more reasonable due to the introduction of an evaluation system of spatial development suitability. In addition to the simulation of the application in EPLs zoning, the comparison of M-MSZ and three other existing models in the application of spatial development suitability were also made to verify the rationality and superiority of the M-MSZ.
3.1. Introduction to the Research Area
The Heilongjiang Province is located in the northeast of China, and its development has been relatively slow when compared with the developed provinces. The spatial zoning method of the Heilongjiang Province is relatively subjective and traditional, but the new urbanization of China requires the rapid, steady, and sustainable development of MAA. The mismatch between the spatial zoning method and the urban development goal is a common problem in most developing countries. To reduce the negative influence of the subjective factors and the constraint of urban zoning on urban development, it is necessary to decrease the contribution rate of the subjective factors in the evaluation method of spatial zoning. This paper selected three representatives of MAAs in the Heilongjiang Province according to the type of major function, these were MAAs with the major function of development, agricultural production, and ecological protection, respectively, as shown in Figure 3.
The MAAs with the major function of development (MAA-D) were located in the southwest of the Heilongjiang Province. In 2015, the urban population accounted for half and the urban area accounted for about 1.2% of the total area of the MAA, and the GDP of the second and third industries accounted for 85% of the total GDP. The MAA with the major function of agricultural production (MAA-AP) was located in the northeast of the Heilongjiang Province. In 2017, the agricultural population accounted for half of the total area of the MAA, and the GDP of the first industry accounted for about half of the total GDP. Cultivated land accounted for more than 60% of the total MAA and the forest coverage rate was about 20%. The MAA with the major function of ecological protection (MAA-EP) was located in the southeast of the Heilongjiang Province. In 2015, the agricultural population accounted for about half of the total area of the MAA, the GDP of the first industry accounted for a quarter of the total GDP, and the area of cultivated land accounted for about 13% of the total MAA area and the forest coverage rate reached 70%. The basic information of the research areas is shown in Table 6.
3.2. Validation of the M-MSZ on Spatial Development Suitability
The representative spatial zoning model can be divided into three categories: the urban structure zoning model, urban growth boundary model, and function-oriented zoning model, respectively [43,49,61]. Here, we took a city in northeastern Heilongjiang as an example and compared the M-MSZ and these three existing models in space development suitability to verify the rationality and superiority of the M-MSZ.
First, the evaluation of space development suitability was done by using the M-MSZ and the urban structure zoning model, respectively. Different from the urban growth boundary model and the function-oriented zoning model, both the M-MSZ and the urban structure zoning model can be used to grade the spatial development suitability of living space. In order to verify the grading function of the M-MSZ for spatial development suitability, this paper compared the application results of the M-MSZ with the urban structure zoning model in the grading of spatial development suitability. Here, the divided living spaces included two levels: the first level is the most suitable living space, and the second level is less suitable living space. The results are shown in Figure 4. It can be seen when the living space is concerned, that the consistency of the Kappa value of the M-MSZ to the urban structure zoning model is great. The Kappa value of the first level and the second level of living space were 86.4% and 85.3%, respectively, and the average Kappa value was 85.9%. We believe that the discrepancy was mainly caused by the difficult factors assigned in the urban structure zoning model. Furthermore, we note that the application of the urban structure zoning model was not as wide as the M-MSZ because it can only be used to zone the living space when the latter can be used to zone the EPLs of MAA.
Second, the M-MSZ was compared with the urban growth boundary model by calculating and analyzing the hard boundary of urban expansion under the assumption of an average annual population growth rate of 5‰ and a per capita construction land of 120 m2. These results are shown in Figure 5. It can be seen that the Kappa value of M-MSZ to the urban growth boundary model was 88.2%. We believe that the discrepancy was mainly caused by the strong subjective weight setting in the urban growth boundary model. Similar to the urban structure zoning model, the urban growth boundary model can only be used for the zoning of living space and its application in EPLs zoning is also limited.
Finally, we compared the M-MSZ and the function-oriented zoning model. The calculation results are as shown in Figure 6. The spatial development suitability in the M-MSZ was divided into five levels and the development suitability decreased with an increased level. Moreover, the space units with a development suitability of level one or level two were considered as the zones suitable for the development, the space unit with development suitability of level three or level four was considered to be limited development zones, and the space unit with development suitability of level five was considered as a prohibited development zone. As shown in Figure 6, the Kappa values of M-MSZ to the function-oriented zoning model were 89.3%, 79.7%, and 86.5% for the suitable development zones, limited development zones, and prohibited development zones, respectively, and the average Kappa value was 85.2%. We believe that the discrepancy could be caused by the strong subjective weight assignment of the function-oriented zoning model. In addition, there exist limited development zones in the function-oriented zoning model, which make the boundary line unclear in the EPLs’ zoning of MAA and weaken the application of this model in the spatial planning and coordination.
3.3. Model Application on EPLs Zoning
The development mode and cultural style are diversified in cities, which leads to differences in their comprehensive development level per capita (Di) in different regions. As noted earlier, the status of economic development (Di1), social development (Di2), and ecological environment (Di3) are closely related to the functional positioning of MAAs. That is, the MAA for economic development usually reaches a high value for the index of economic development, while the MAA for ecological protection usually reaches a high value for the index of the ecological environment [56]. In the study of MAA zoning, we need to determine the best functional positioning of the MAA to give the most favorable functional advantages of the MAA as well as to narrow the gap between the Di.
Therefore, this paper introduced the major function of MAA into the M-MSZ. The index system of major function orientation proposed by Hasbagen [83] was selected to determine the F value (comprehensive classification index), then the major function of the MAA was limited. This evaluation system has been widely applied in previous MAA studies [84,85,86,87], and it has been shown to effectively guide the major function orientation of MAAs. The MAA was divided into three groups according to the major functions: the MAA space mainly for development, the MAA space mainly for agricultural production, and the MAA space mainly for ecological protection. Then, the table of MAAs zoning standards and the classification table of urban built-up areas, transitional zones, and limited development zones are determined according to the actual situation of the research zone and how the MAAs space is zoned.
From the perspective of spatial equilibrium, we should follow the principle of giving priority to the major function of the MAA and take into account the principles of protection and utilization. We divided the MAAs space according to the 2017 edition of the “Classification of City Land Use and Standard of Land Use Planning and Construction Land” [88], the 2014 edition of “A Guide to the Classification of Village Planning Land, Housing Construction Department” [89], the “Present Land Use Classification” (GBT 21010–2017) [90], the 2017 edition of “Technical Guide of Red Line for National Ecological Protection and Ecological Function Delineating” [91], and the relevant standards of forestry, agriculture, transportation and other departments. The standards are shown in Table 7 and Table 8.
Using the M-MSZ, the development suitability of the urban built-up area, the control zone (the basic farmland, protected zones, and prohibited and limited development zones), and the transitional zone (except for the urban built-up area and the control zone) of the MAAs located in Heilongjiang Province were calculated. Then, the MAA was divided into levels one to five according to the calculation results. The first level was mostly for development; whereas, basic farmland, protected, and prohibited development zones were level five.
If F > 0, it is suitable for development. If F < 0, it is not suitable for development. There are areas where F < 0 can be divided into two parts: agricultural zones and ecological zones. When the proportion of farmland is greater than that of ecological land, it is defined as an agricultural area. Otherwise, it is an ecological region [83]. When F = 0, this is the threshold for developing protective function zones. According to the actual situation in the Heilongjiang Province, this paper defined it as a zone suitable for development.
According to the actual situation of various MAAs in Heilongjiang, 11,546 valid questionnaires were obtained from experts and MAA participants. For the expert advice, each group of subjects contained three experts, and the total number of experts was 30. The average score of each class of five experts was scored according to the 30 valid questionnaires. The opinion of each expert was equally important and included experts working in Chinese universities and experts in engineering planning and design in China. The experts working in universities majored in five fields including land planning, urban and regional planning, urban planning, urban design, and environmental protection and planning. The experts in engineering planning and design also majored in these five fields. MAA participants included residents, the government, developers, and farmers. Experts and MAA participants were investigated with different consulting methods. The opinions of each type of research subject are equally important and the weight ratio of the opinions of experts to MAA participants was 7:3. Next, all of the opinions were combined and the assignment of a neural network was carried out. Then, the weights of the various factors in the P value were set by using the analysis method of the neural network from the decisions of the expert and MAA participants [93] as follows: natural disasters, 0.15, topography and terrain, 0.15, utilization of water resources, 0.3, environmental capacity, 0.2, and ecosystem vulnerability, 0.2.
By using the proposed M-MSZ, the development suitability of these three MAAs was leveled, and the major function of the MAA was determined using the index system of major function orientation. Then, a MAA spatial zoning map showing different major functions was generated using the development suitability level, the major function of the MAA, the zoning standard table of the MAA, and the classification table of urban built-up areas, transitional zones, and limited development zones as shown in Figure 7, Figure 8 and Figure 9. In the MAA-D, the living space, agricultural production, and ecological protection accounted for 8.2%, 41.37%, and 50.43% of the total area of the MAA, respectively. Compared with the actual value, living space increased by 5.7%, while agricultural space and ecological space decreased by 4.8% and 0.9%, respectively. The estimated rate of the population growth was 5‰ per year and the construction land per capita was 120 m2 (the following two research areas are based on this standard), and the growth rate of living space was estimated to reach the spatial zoning boundary in 2070. As for the MAA-AP, the living space, agricultural production, and ecological protection accounted for 0.73%, 51.2%, and 48.07% of the total area of MAA, respectively. Compared to the actual value, living space and agricultural space increased by 4.8% and 0.9%, respectively. Furthermore, ecological space decreased by 13.07%. The growth rate of living space was estimated to reach the spatial zoning boundary in 2069. When living space reaches this boundary, agricultural production remains in surplus, except in the case of self-sufficiency. Where the MAA-EP is concerned, living space, agricultural production, and ecological protection accounted for 0.89%, 16.38%, and 82.73% of the total area of the MAA, respectively. Compared to the actual value, the living space and ecological space increased by 0.22% and 11.9%, respectively, and agricultural space decreased by 12.12%. As a result, the growth rate of living space was estimated to reach the spatial zoning boundary in 2072, as summarized in Table 9.
3.4. Summary
In summary, the M-MSZ could not only simulate the EPLs zoning, but also classify the EPLs from the space development suitability. Meanwhile, this model was highly consistent with the three existing spatial zoning models. The main reason for the discrepancy lay in the strong subjective weight setting and the difficult factor assignment. There, we can conclude that the M-MSZ was more efficient and cheaper than the existing spatial zoning models in EPLs zoning and spatial planning coordination.
4. Discussion and Conclusions
As we know, unbalanced development is the root of the increasing gap between urban and rural areas, which resists the urban and rural symbiosis in most cities and regions of the world [94,95]. Scientific and rational MAA spatial zoning will help to solve many imbalance problems of MAA development such as urban and rural development and protection, land use, etc. Recently, the question of how to build a scientific and reasonable MAA spatial zoning model and coordinate spatial planning has received much attention. Currently, several spatial zoning models have been reported such as the urban structure zoning model, urban growth boundary model, and major function-oriented zoning model, and so on, and they have been successfully used to zone different functional zones and to guide the planning of MAA. Particularly for western developed countries, these models have been applied widely. The experience of them has provided strong support and reference for Chinese spatial zoning. However, it cannot be used directly for the spatial zoning of China for several reasons. First, each country chooses the model suitable for their development and makes the model work in their national conditions. Hence, different national conditions will inevitably create differences in the content and structure of spatial zoning, as shown in Figure 10. Here, we selected several representative developed countries that have shown advanced research in spatial planning to compare with China [2,3,4,6,7]. As for China, this is a country with a unique national condition (public ownership of land, vast expanses of land, and a huge population) that has been undergoing the high-speed development of urbanization [96]. Therefore, we cannot mechanically apply the spatial zoning models of western developed countries to China. Second, the assignment of factors of the existing models is often difficult and their subjective weight settings are strong, which makes them ineffective to guide the EPLs zoning and spatial plan coordination of China. In this paper, we launched theoretical and empirical research on the spatial zoning model based on Chinese national conditions and development stages.
Existing spatial zoning models often show shortcomings such as difficult data acquisition and limited application due to their high requirements of the related parameters, insufficient objectivity because of their strong subjective weight settings, and lack of comprehensive zoning on EPLs. In this study, we attempted to construct a quantitative and easily operated MAA spatial zoning model (M-MSZ) by using the organic integration of economic logic deduction and urban planning practice under the framework of a spatial equilibrium theory, based on the planning experience on the balanced development of ecology, humanity, protection, and development. The M-MSZ and its construction method provide a new perspective and technological support to alleviate and even solve the extensive economic behaviors such as the inefficient operation of land resources (the speed of land urbanization is faster than the speed of population urbanization) and the deterioration of the ecological environment in China and other developing countries with rapid economic growth. It also demonstrates a new feasible demonstration for China to promote the implementation of new urbanization strategies in the new period and new normal situation [99]. First, the selection of influence factors for the model was carried out from the literature statistics, the questionnaire survey of MAA participants (residents, government, developers, and farmers) about the leading factors of choosing a living space, and expert advice, which made the model factors more accurate. Second, during the construction of the model, the iceberg transport costs and Marshallian demand theory were introduced, and the development suitability and major functions of MAA were taken into synthetic consideration, which ensured the rationality and feasibility of the zoning model. Then, the model was optimized by statistical analysis and the rationality of the model was verified by the numerical simulation analysis, which guaranteed the scientific application of the model construction. Finally, typical MAAs were used as samples to complete the comparison and induction with the existing spatial zoning models, and the scientificity and ease of operation of the M-MSZ were verified again. The results of optimization, verification, and application are shown as follows.
During the construction of the model, the M-MSZ combined the advantages of the three existing spatial zoning models to reduce their disadvantages. For example, four factors that represent a high contribution rate and easy collection in the urban structure zoning model were retained, these being: economic situation, population agglomeration, location advantage, and transport superiority, respectively. At the same time, the total land commodities, urban structure, and the preference variable of MAA participants to land commodities were optimized, which made these three factors easier to acquire. As a result, the M-MSZ improved the practical application of the urban structure zoning model and its application was much easier to extend. On the other hand, the M-MSZ reduced the subjectivity of the urban growth boundary model and the major function-oriented zoning model (including the spatial equilibrium model for regional development and the existing EPLs zoning model) while maintaining their high practicality. The ratio of quantitative parameters was enhanced significantly by using the method of economic derivation. Many quantitative parameters such as the economic situation, population agglomeration, location advantage, transport superiority, available land volume, the pending development zones, and the preference variable of MAA participants to land commodities were combined in the model to make it more accurate and more objective in the mechanism expression. After comparison, it can be seen that the M-MSZ showed that it was more efficient, comprehensive, cost-effective, and widely used in the coordination of spatial planning and the EPLs zoning than the three existing spatial zoning models. Moreover, this model could also effectively guide the hierarchical scale zoning of the urban spatial system as well as the zoning of land use functions.
The correlation analysis showed that the relevance of unavailable land and the pending development zones to the suitability of urban spatial development was very small. From the comparison of the F values and the Fa (k–1, n–k) of each factor after regression analysis, all factors were F > Fa (k–1, n–k) except for the unavailable land and pending development zones, which was consistent with the results of the correlation analysis. After eliminating the unavailable land and pending development zones, the rest of the 11 factors including the economic situation, location advantage, transport superiority degree, population quantity, topographic and terrain, land quantity, environmental capacity, ecosystem vulnerability, utilization of water resources, natural disaster, and urban structure could be used to effectively explain the spatial development suitability.
The results of the numerical simulation showed that the economic development level, population quantity, and land resource were the main factors that affected the suitability of urban spatial development, while location advantage, transport superiority degree, and urban structure had a smaller influence on the suitability of urban spatial development. The five factors in the preference of MAA participants to land commodity including topographic and terrain, natural disaster, utilization of water resources, environmental capacity, and ecosystem vulnerability had the smallest influence on the suitability of the urban spatial development. Importantly, the accuracy of the M-MSZ was confirmed by the numerical simulation results.
The comparison of the M-MSZ and the three existing models (urban structure zoning model, urban growth boundary model, and major function-oriented zoning model) [43,49,61] showed that the Kappa values of the consistency test were 85.9%, 88.2%, and 85.2%, respectively, with an average of 86.4%. We believe that the M-MSZ efficiently inherited and extended the advantages and interpretations of the existing zoning modes. Moreover, they avoided the limitations of the application range of the existing models and looked like an organic integration of the three existing spatial zoning models. In addition, the EPLs zoning of the M-MSZ was clearer than the three existing models. Therefore, the M-MSZ could be used as a supplement and extension to the research of current existing spatial zoning. From the perspective of the application, this model can not only solve the problem of the EPLs zoning and spatial plan coordination in MAA, but can also effectively guide urban land use planning from two dimensions of space and time and effectively promote the coordination and sustainable development of spatial planning. When the application scope is concerned, the method and construction concept of M-MSZ are more practical to the spatial planning of regions including developing countries or underdeveloped areas (which occupy more than 70% of the world′s land area and the total population), and regions that are in rapid urbanization [100,101].
In conclusion, the M-MSZ can be used to solve the problems of urban and rural co-ordination and regional coordination such as delimiting EPLs of urban and rural areas in MAAs, determining land use functions of MAAs, evaluating the suitability of land exploitation in MAAs, and formulating the timetable of land development in MAAs. However, the M-MSZ is limited in its contribution to various transmission flows such as in the planning of city traffic, population, economy, and tourism [102]. Although the M-MSZ is based on the mathematical derivation and comprehensive determination, there are still some subjective judgments such as the expert survey, the questionnaire survey of the factors affecting the choice of living space and its examination, and requires further verification of many more samples and regions. This is a potential area for our future research.
Supplementary Materials
Supplementary File 1Author Contributions
Y.Z. constructed the methodology, designed the experiments, made the data analysis and prepared the original draft; H.L. and Q.Y. directed experimental design and worked on the review and editing of the paper. P.S. worked on the structure design and editing of the paper, as well the language correction.
Funding
This research is supported by National Natural Science Foundation of China (51578176, 41501173) and Art Science Planning Project of Heilongjiang Province (2014B025).
Acknowledgments
Thanks to all the experts for their constructive comments and helpful suggestions that led to significant improvements to this paper.
Conflicts of Interest
The authors declare no conflict of interest.
References
- Zhang, J.X.; Lin, H.C.; Chen, H. 40-Year Changes and Reforms of China’s Spatial Planning System. Econ. Geogr. 2018, 38, 1–6. [Google Scholar]
- Lloyd, M.G. British planning: 50 Years of urban and regional policy. Land Use Policy 2000, 17, 359–360. [Google Scholar] [CrossRef]
- Liu, H.; Fan, J.; Li, Y. “America 2050” strategic spatial planning and its inspiration to China. Geogr. Res. 2013, 32, 90–98. [Google Scholar]
- Xu, J.Q.; Shen, C.; Hu, T.X.; Du, S.; Zhang, X.M. General Concept and Main Tasks of Building Spatial Planning System In China. Planners 2017, 33, 5–11. [Google Scholar]
- Fang, C.L. The fire-new survey to the overseas regional development planning and reference to China. Geogr. Res. 1999, 18, 7–16. [Google Scholar]
- Wu, Z.Q. Analysis of the German spatial planning system and its development. Urban Plan. Int. 1999, 4, 2–5. [Google Scholar]
- Liu, J. Policy Framework and Planning System of Territorial Development in France: Characteristics and Inspirations. City Plan. Rev. 2011, 35, 61–65. [Google Scholar]
- Yan, Z.X.; Wang, J.Y. Regional Planning of Hungarian. Urban Plan. Int. 1987, 42–54. [Google Scholar]
- Cai, Y.M.; Chen, M.; Song, H.R. Overseas Spatial Planning Operation System Research Review. Planners 2014, 30, 83–87. [Google Scholar]
- Gallent, N.; Shaw, D. Spatial planning, area action plans and the rural-urban fringe. J. Environ. Plan. Manag. 2007, 50, 617–638. [Google Scholar] [CrossRef]
- Shwartz, A.; Davies, Z.G.; Macgregor, N.A. Scaling up from protected areas in England: The value of establishing large conservation areas. Biol. Conserv. 2017, 212, 279–287. [Google Scholar] [CrossRef]
- Saizen, I.; Mizuno, K.; Kobayashi, S. Effects of land-use master plans in the metropolitan fringe of Japan. Landsc. Urban Plan. 2006, 78, 411–421. [Google Scholar] [CrossRef]
- Nakamura, T.; Short, K. Land-use planning and distribution of threatened wildlife in a city of Japan. Landsc. Urban Plan. 2001, 53, 1–15. [Google Scholar] [CrossRef]
- Wang, Q.N.; M’Ikiugu, M.M.; Kinoshita, I. A GIS-Based Approach in Support of Spatial Planning for Renewable Energy: A Case Study of Fukushima. Sustainability 2014, 6, 2087–2117. [Google Scholar] [CrossRef]
- Baker, M.; Hincks, S.; Sherriff, G. Getting involved in plan making: Participation and stakeholder involvement in local and regionalspatial strategies in England. Environ. Plan. C-Gov. Policy 2010, 28, 574–594. [Google Scholar] [CrossRef]
- Scott, A.J.; Carter, C.; Reed, M.R. Disintegrated development at the rural-urban fringe: Re-connecting spatial planning theory and practice. Prog. Plan. 2013, 83, 1–52. [Google Scholar] [CrossRef]
- Luck, G.W.; Ricketts, T.H.; Daily, G.C. Alleviating spatial conflict between people and biodiversity. Proc. Natl. Acad. Sci. USA 2004, 101, 182–186. [Google Scholar] [CrossRef] [PubMed]
- Carter, S.K.; Keuler, N.S.; Pidgeon, A.M. Evaluating the influence of conservation plans on land protection actions in Wisconsin, USA. Biol. Conserv. 2014, 178, 37–49. [Google Scholar] [CrossRef]
- Falcucci, A.; Maiorano, L.; Boitani, L. Changes in land-use/land-cover patterns in Italy and their implications for biodiversity conservation. Landsc. Ecol. 2007, 22, 617–631. [Google Scholar] [CrossRef]
- Christodoulou, M.; Nakos, G. An Approach to Comprehensive Land-use Planning. J. Environ. Manag. 1990, 31, 39–46. [Google Scholar] [CrossRef]
- Recatala, L.; Ive, J.R.; Baird, I.A. Land-use planning in the Valencian Mediterranean region: Using LUPIS to generate issue relevant plans. J. Environ. Manag. 2000, 59, 169–184. [Google Scholar] [CrossRef]
- Feltynowski, M. Land-use plans and a change of use of forest land in the urban communes in Poland. Sylwan 2015, 159, 252–258. [Google Scholar]
- Trkulja, S.; Tosic, B.; Zivanovic, Z. Serbian Spatial Planning among Styles of Spatial Planning in Europe. Eur. Plan. Stud. 2012, 20, 1729–1746. [Google Scholar] [CrossRef]
- Kerselaers, E.; Rogge, E.; Vanempten, E. Changing land use in the countryside: Stakeholders’ perception of the ongoing rural planningprocesses in Flanders. Land Use Policy 2013, 32, 197–206. [Google Scholar] [CrossRef]
- Zhang, C.G.; Lin, Y. Panel estimation for urbanization, energy consumption and CO2 emissions: A regional analysis in China. Energy Policy 2012, 49, 488–498. [Google Scholar] [CrossRef]
- Sun, P.; Wei, S.; Xiu, C.; Liang, Z. Non-coordination in Chinas urbanization: Assessment and affecting factors. Chin. Geogr. Sci. 2013, 23, 729–739. [Google Scholar] [CrossRef]
- Wang, L.; Shen, J.F. The Challenge of Spatial Plan Coordination in Urban China: The Case of Suzhou City. Urban Policy Res. 2017, 35, 180–198. [Google Scholar] [CrossRef]
- Liu, Y.L.; Luo, T.; Liu, Z.Q. A comparative analysis of urban and rural construction land use change and driving forces: Implications for urban-rural coordination development in Wuhan, Central China. Habitat Int. 2015, 47, 113–125. [Google Scholar] [CrossRef]
- Long, H.L. Land consolidation: An indispensable way of spatial restructuring in rural China. J. Geogr. Sci. 2014, 24, 211–225. [Google Scholar] [CrossRef]
- Zhou, X.P.; Lu, X.; Lian, H.P. Construction of a Spatial Planning system at city-level: Case study of “integration of multi-planning” in Yulin City, China. Habitat Int. 2017, 65, 32–48. [Google Scholar] [CrossRef]
- Li, J.K.; Li, D.H. Looking Back and Ahead at China’s Urbanization. Landsc. Archit. Front. 2015, 3, 26–31. [Google Scholar]
- Shandra, J.M.; London, B.; Williamson, J.B. Environmental degradation, environmental sustainability, and overurbanization in the developing world: A quantitative, cross-national analysis. Sociol. Perspect. 2003, 46, 309–329. [Google Scholar] [CrossRef]
- Bradshaw, Y.W.; Schafer, M.J. Urbanization and development: The emergence of international nongovernmental organizations amid declining states. Sociol. Perspect. 2000, 43, 97–116. [Google Scholar] [CrossRef]
- Liu, Y.; Cai, E.; Jing, Y.; Gong, J.; Wang, Z. Analyzing the Decoupling between Rural-to-Urban Migrants and Urban Land Expansion in Hubei Province, China. Sustainability 2018, 10, 345. [Google Scholar] [CrossRef]
- Tacoli, C. Rural-urban interactions: A guide to the literature. Environ. Urban. 1998, 10, 147–166. [Google Scholar] [CrossRef]
- Friedmann, J. Four theses in the study of Chinas urbanization. Int. J. Urban Reg. Res. 2006, 30, 440–451. [Google Scholar] [CrossRef]
- Bai, X.M.; Shi, P.J.; Liu, Y.S. Realizing China’s urban dream. Nature 2014, 509, 158–160. [Google Scholar] [CrossRef] [PubMed]
- Shi, Y.S. Rrom the Strategy of Metropolitan Coordination Region to the Strategy of Spatial Equilibrium Development. Urban Plan. Forum 2008, 1, 44–50. [Google Scholar]
- Laborie, J.P.; Langumier, J.F. La Politique Française Daménagement du Territoire de 1950 à 1985; La Documentation Française: Paris, France, 1985. [Google Scholar]
- Merlin, P.; Choay, F. Dictionnaire de Lurbanisme et de Laménagement, 4th ed.; Presses Universitaires de France: Paris, France, 2010; Volume 2, pp. 59–61. ISBN 978-2-13-063068-5. [Google Scholar]
- Batten, D.F. Network cities: Creative urban agglomerations for the 21st century. In Proceedings of the Conference on Cities, Enterprises and Society at the Eve of the 21st Century, Lille, France, 16–18 March 1994. [Google Scholar]
- Burke, G.L. Greenheart Metropolis: Planning the Western Netherlands, 1st ed.; Macmillan: London, UK, 1966; Volume 4, pp. 171–172. ISBN 978-1-349-81771-9. [Google Scholar]
- Nam, K.; Kim, B.H.S. The Effect of Spatial Structure and Dynamic Externalities on Local Growth in Seoul Metropolitan Area. Urban Policy Res. 2017, 35, 165–179. [Google Scholar] [CrossRef]
- Li, L.H. The dynamics of the Shanghai land market—An intra city analysis. Cities 2011, 28, 372–380. [Google Scholar] [CrossRef] [Green Version]
- Salvati, L.; Carlucci, M. Distance matters: Land consumption and the mono-centric model in two southern European cities. Landsc. Urban Plan. 2014, 127, 41–51. [Google Scholar] [CrossRef]
- Salvati, L.; Munafo, M.; Morelli, V.G.; Sabbi, A. Low-density Settlements and Land Use Changes in a Mediterranean Urban Region. Landsc. Urban Plan. 2012, 105, 43–52. [Google Scholar] [CrossRef]
- Salvati, L.; Zitti, M.; Saterlano, A. Changes in City Vertical Profile as an Indicator of Sprawl: Evidence from a Mediterranean urban region. Habitat Int. 2013, 38, 119–125. [Google Scholar] [CrossRef]
- Salvati, L.; Sabbi, A. Identifying urban diffusion in compact cities through a comparative multivariate procedure. Ann. Reg. Sci. 2014, 53, 557–575. [Google Scholar] [CrossRef]
- Liu, J.; Zhang, G.; Zhuang, Z.; Cheng, Q.; Gao, Y.; Chen, T.; Huang, Q.; Xu, L.; Chen, D. A new perspective for urban development boundary delineation based on SLEUTH-InVEST model. Habitat Int. 2017, 70, 13–23. [Google Scholar] [CrossRef]
- Feng, Y.; Liu, Y.; Batty, M. Modeling urban growth with GIS based cellular automata and least squares SVM rules: A case study in Qingpu–Songjiang area of Shanghai, China. Stoch. Environ. Res. Risk Assess. 2016, 30, 1387–1400. [Google Scholar] [CrossRef]
- Buxton, M.; Taylor, E. Urban Land Supply, Governance and the Pricing of Land. Urban Policy Res. 2011, 29, 5–22. [Google Scholar] [CrossRef]
- Barredo, J.I.; Demicheli, L. Urban sustainability in developing countries megacities: Modelling and predicting future urban growth in Lagos. Cities 2003, 20, 297–310. [Google Scholar] [CrossRef]
- Tayyebi, A.; Pijanowski, B.C.; Tayyebi, A.H. An urban growth boundary model using neural networks, GIS and radial parameterization: An application to Tehran, Iran. Landsc. Urban Plan. 2011, 100, 35–44. [Google Scholar] [CrossRef]
- Lin, J.; Huang, B.; Chen, M.; Huang, Z. Modeling urban vertical growth using cellular automata-Guangzhou as a case study. Appl. Geogr. 2014, 53, 172–186. [Google Scholar] [CrossRef]
- Rafiee, R.; Mahiny, A.S.; Khorasani, N.; Darvishsefat, A.A.; Danekar, A. Simulating urban growth in Mashad City, Iran through the SLEUTH model (UGM). Cities 2009, 26, 19–26. [Google Scholar] [CrossRef]
- Fan, J.; Li, P.X. The scientific foundation of Major Function Oriented Zoning in China. J. Geogr. Sci. 2009, 19, 515–531. [Google Scholar] [CrossRef]
- Ma, L.B.; Niu, S.W.; Shi, P.J.; Guo, X.D. The Functional Zoning of Territorial Space and the Developmental Pattern of Future Space-Based on the Framework of the Major Function Oriented Zoning. Econ. Geogr. 2015, 35, 68–77. [Google Scholar] [CrossRef]
- Fan, J.; Sun, W.; Yang, Z.S. Focusing on the major function-oriented zone: A new spatial planning approach and practice in China and its 12th Five-Year Plan. Asia Pac. Viewpoint 2012, 53, 86–96. [Google Scholar] [CrossRef]
- Liu, Y.S.; Chen, C.; Li, Y.R. Differentiation regularity of urban-rural equalized development at prefecture-level city in China. J. Geogr. Sci. 2015, 25, 1075–1088. [Google Scholar] [CrossRef] [Green Version]
- Wang, W.; Zhang, X.L.; Wu, Y.Z. Development priority zoning in China and its impact on urban growth management strategy. Cities 2017, 62, 1–9. [Google Scholar] [CrossRef]
- Liu, M.H.; Luo, X.B.; Li, Q.Y. An Integrated Method Used to Value Recreation Land-a Case Study of Sweden. In Proceedings of the International Conference on Future Energy, Environment, and Materials (FEEM), Hong Kong, China, 12–13 April 2012. [Google Scholar]
- Liu, J.L.; Liu, Y.S.; Li, Y.R. Classification evaluation and spatial-temporal analysis of “production-living-ecological” spaces in China. Acta Geogr. Sin. 2017, 72, 1290–1304. [Google Scholar]
- Yoon, C. Estimating a Dynamic Spatial Equilibrium Model to Evaluate the Welfare Implications of Regional Adjustment ProcesseS: The Decline of the Rust Belt. Int. Econ. Rev. 2017, 58, 473–497. [Google Scholar] [CrossRef]
- Chen, H.; Tang, L.; Qiu, Q.; Wu, T.; Wang, Z.; Xu, S.; Xiao, L. Coupling between Rural Development and Ecosystem Services, the Case of Fujian Province, China. Sustainability 2018, 10, 524. [Google Scholar] [CrossRef]
- Ma, Y.H.; Leng, H. Study on Decision-making of Ecological Planning in Regional Landscape Planning for Sustainability. Chin. Landsc. Archit. 2016, 1, 47–51. [Google Scholar]
- Coffey, W.J.; Shearmur, R.G. Agglomeration and Dispersion of High-order Service Employment in the Montreal Metropolitan Region, 1981-96. Urban Stud. 2002, 39, 359–378. [Google Scholar] [CrossRef]
- Robert-Nicoud, F.R. The structure of simple ‘new economic geography’ models. J. Econ. Geogr. 2005, 5, 201–234. [Google Scholar] [CrossRef]
- Nelson, R.R. Demand, supply, and their interaction on markets, as seen from the perspective of evolutionary economic theory. J. Evol. Econ. 2013, 23, 17–38. [Google Scholar] [CrossRef]
- Samuelson, P.A. The Transfer Problem and Transport Costs: The Terms of Trade when Impediments are Absent. Econ. J. 1952, 62, 278–304. [Google Scholar] [CrossRef]
- Dixit, A.K.; Stiglitz, J.E. Monopolistic competition and optimum produt diversity. Am. Econ. Rev. 1977, 67, 297–308. [Google Scholar] [CrossRef]
- Lucas, R.E.; Rossi-Hansberg, E. On the internal structure of cities. Econometrica 2002, 70, 1445–1476. [Google Scholar] [CrossRef]
- Quigley, J.M. Urban diversity and economic growth. J. Econ. Perspect. 1998, 12, 127–138. [Google Scholar] [CrossRef]
- Helsley, R.W.; Strange, W.C. Coagglomeration, Clusters, and the Scale and Composition of Cities. J. Polit. Econ. 2014, 122, 1064–1093. [Google Scholar] [CrossRef]
- Chen, H.X. Research on the Mechanism of New Town Development Based on Spatial Equilibrium. Ph.D. Thesis, Harbin Institute of Technology, Harbin, China, 2008. [Google Scholar]
- Higgins, C.D.; Kanaroglou, P.S. Forty years of modelling rapid transits land value uplift in North America: Moving beyond the tip of the iceberg. Transp. Rev. 2016, 36, 610–634. [Google Scholar] [CrossRef]
- Kok, N.; Monkkonen, P.; Quigley, J.M. Land use regulations and the value of land and housing: An intra-metropolitan analysis. J. Urban Econ. 2014, 81, 136–148. [Google Scholar] [CrossRef] [Green Version]
- Fujita, M.; Krugman, P.; Mori, T. On the evolution of hierarchical urban systems. Eur. Econ. Rev. 1999, 43, 209–251. [Google Scholar] [CrossRef]
- Fujita, M.; Mori, T. Frontiers of the New Economic Geography. Pap. Reg. Sci. 2005, 84, 377–405. [Google Scholar] [CrossRef]
- Wang, Z.; Guo, H.C.; He, C.J.; Li, N.; Yu, Y.J.; Liu, H.; Feng, C.C. Driving Force Analysis of Residential Land Price in Beijing Based on Statistical Methods. Acta Geogr. Sin. 2009, 64, 1214–1220. [Google Scholar] [CrossRef]
- Xu, Z.W.; Harriss, R. A Spatial and Temporal Autocorrelated Growth Model for City Rank-Size Distribution. Urban Stud. 2010, 47, 321–335. [Google Scholar] [CrossRef]
- Behrens, K.; Robert-Nicoud, F. Tempora mutantur: In search of a new testament for NEG. J. Econ. Geogr. 2011, 11, 215–230. [Google Scholar] [CrossRef]
- Ikeda, K.; Murota, K.; Akamatsu, T. Agglomeration patterns in a long narrow economy of a new economic geography model: Analogy to a racetrack economy. Int. J. Econ. Theory 2017, 13, 113–145. [Google Scholar] [CrossRef] [Green Version]
- Hasbagen. Research on the Evolution and Optimization of the Vulnerability of Different Main Functional Areas Based on Spatial Equilibrium. Ph.D. Thesis, Northwest University, Xi’an, China, 2013. [Google Scholar]
- Zhou, D.H.; Li, T.S.; Hasbagen. A Study of spatial disparities of counties comprehensive development levels and spatial strategy in shaanxi province. Hum. Geogr. 2011, 1, 71–75. [Google Scholar]
- Hasbagen; Li, T.S.; Zhou, C.; Zhou, D.H. SPACE-Based overall development assessment of regional-as a case of Guangzhong-Tianshui economic zone. Econ. Geogr. 2011, 31, 360–365. [Google Scholar]
- Mi, N.; Yang, M.L.; Fan, X.G.; Mi, W.B.; Li, T.S.; Wang, T.Y. Theory and application of the main functional subdivision of limited development ecological zones. Acta Ecol. Sin. 2016, 36, 5058–5066. [Google Scholar] [CrossRef]
- Luo, Y.L.; Li, T.S.; Zhang, C.X.; Zhai, Z.Y. Town territorialmulti-functionality evaluation and the dominant function orientation: A case of Jinhu county. Hum. Geogr. 2016, 31, 94–101. [Google Scholar]
- Classification of City Land Use and Standard of Land Use Planning and Construction Land. Available online: https://wenku.baidu.com /view/ d21a91f9294ac850ad02de80d4d8d15abf230064.html (accessed on 13 September 2017).
- A Guide to the Classification of Village Planning Land, Housing Construction Department. Available online: https://wenku.baidu.com /view/69bfce69da38376bae1fae81.html (accessed on 27 November 2015).
- Present Land Use Classification (GBT 21010-2017). Available online: http://www.tdzyw.com/2017/1113/45597.html (accessed on 13 November 2017).
- Technical Guide of Red Line for National Ecological Protection and Ecological Function Delineating. Available online: http://mp.ofweek.com/emc/a545663828646 (accessed on 1 August 2017).
- Wang, G.W.; Jia, L.Q.; Gao, H.G. Urban-rural Land Classification and Application in Multi-plans Integration. Planners 2017, 4, 41–45. [Google Scholar]
- Mazzocchi, C.; Corsi, S.; Sali, G. Agricultural Land Consumption in Periurban Areas: A Methodological Approach for Risk Assessment Using Artificial Neural Networks and Spatial Correlation in Northern Italy. Appl. Spat. Anal. Policy 2017, 10, 3–20. [Google Scholar] [CrossRef]
- Report of the 19th National Congress of CPC. Available online: http://cpc.people.com.cn/19th/n1/2017/1018/c414305-29595155.html (accessed on 18 October 2017).
- Rodriguez-Pose, A.; Hardy, D.L. Addressing poverty and inequality in the rural economy from a global perspective. Appl. Geogr. 2015, 61, 11–23. [Google Scholar] [CrossRef] [Green Version]
- Wang, Y.T.; Sun, M.X.; Wang, R.Q. Promoting regional sustainability by eco-province construction in China: A critical assessment. Ecol. Indic. 2015, 51, 127–138. [Google Scholar] [CrossRef]
- Yang, Y.H. Introduction to the experience of land consolidation abroad: How did the Tennessee River turn into a profit? Prog. Geogr. 1983, 3, 1–5. [Google Scholar]
- Martinez-Fernandez, C.; Audirac, I.; Fol, S. Shrinking Cities: Urban Challenges of Globalization. Int. J. Urban Reg. Res. 2012, 36, 213–225. [Google Scholar] [CrossRef] [PubMed]
- Sun, P.J.; Ding, S.B.; Xiu, C.L.; Wei, Y. Population-Economy-Space Urbanization of Northeast China. Sci. Geogr. Sin. 2012, 32, 450–457. [Google Scholar]
- Developing Country. Available online: https://baike.baidu.com/item/%E5%8F%91%E5%B1%95%E4%B8%AD%E5%9B%BD%E5%AE%B6/652451?fr=aladdin (accessed on 10 November 2017).
- Tang, F. Study of the New Urbanization Strategy Based on the Economics of Urban Planning. Ph.D. Thesis, Tianjin University, Tianjin, China, 2014. [Google Scholar]
- Gim, T.-H.T. An Analysis of the Relationship between Land Use and Weekend Travel: Focusing on the Internal Capture of Trips. Sustainability 2018, 10, 425. [Google Scholar] [CrossRef]
Figure 1.
The scheme of research outline for Spatial Zoning of MAA basing on the M-MSZ and index system of major function orientation.
Figure 1.
The scheme of research outline for Spatial Zoning of MAA basing on the M-MSZ and index system of major function orientation.

Figure 2.
The curves of D versus r for different factors. (a) L1, the land quantity; (b) N1, the population agglomeration; (c) Y, economic situation; (d) y, the external location advantage; (e) r0, the internal location advantage; (f) J, transport superiority degree; (g) P, the preference variable of MAA participants to land commodities; (h) M1, urban structure.

Figure 3.
The location of the research area.

Figure 4.
The evaluation of spatial development suitability with (a) the M-MSZ and (b) the urban structure zoning model.
Figure 4.
The evaluation of spatial development suitability with (a) the M-MSZ and (b) the urban structure zoning model.

Figure 5.
The evaluation of spatial development suitability with (a) the M-MSZ and (b) the urban growth boundary model.
Figure 5.
The evaluation of spatial development suitability with (a) the M-MSZ and (b) the urban growth boundary model.

Figure 6.
The evaluation of spatial development suitability with (a) the M-MSZ and (b) the function-oriented zoning model.
Figure 6.
The evaluation of spatial development suitability with (a) the M-MSZ and (b) the function-oriented zoning model.
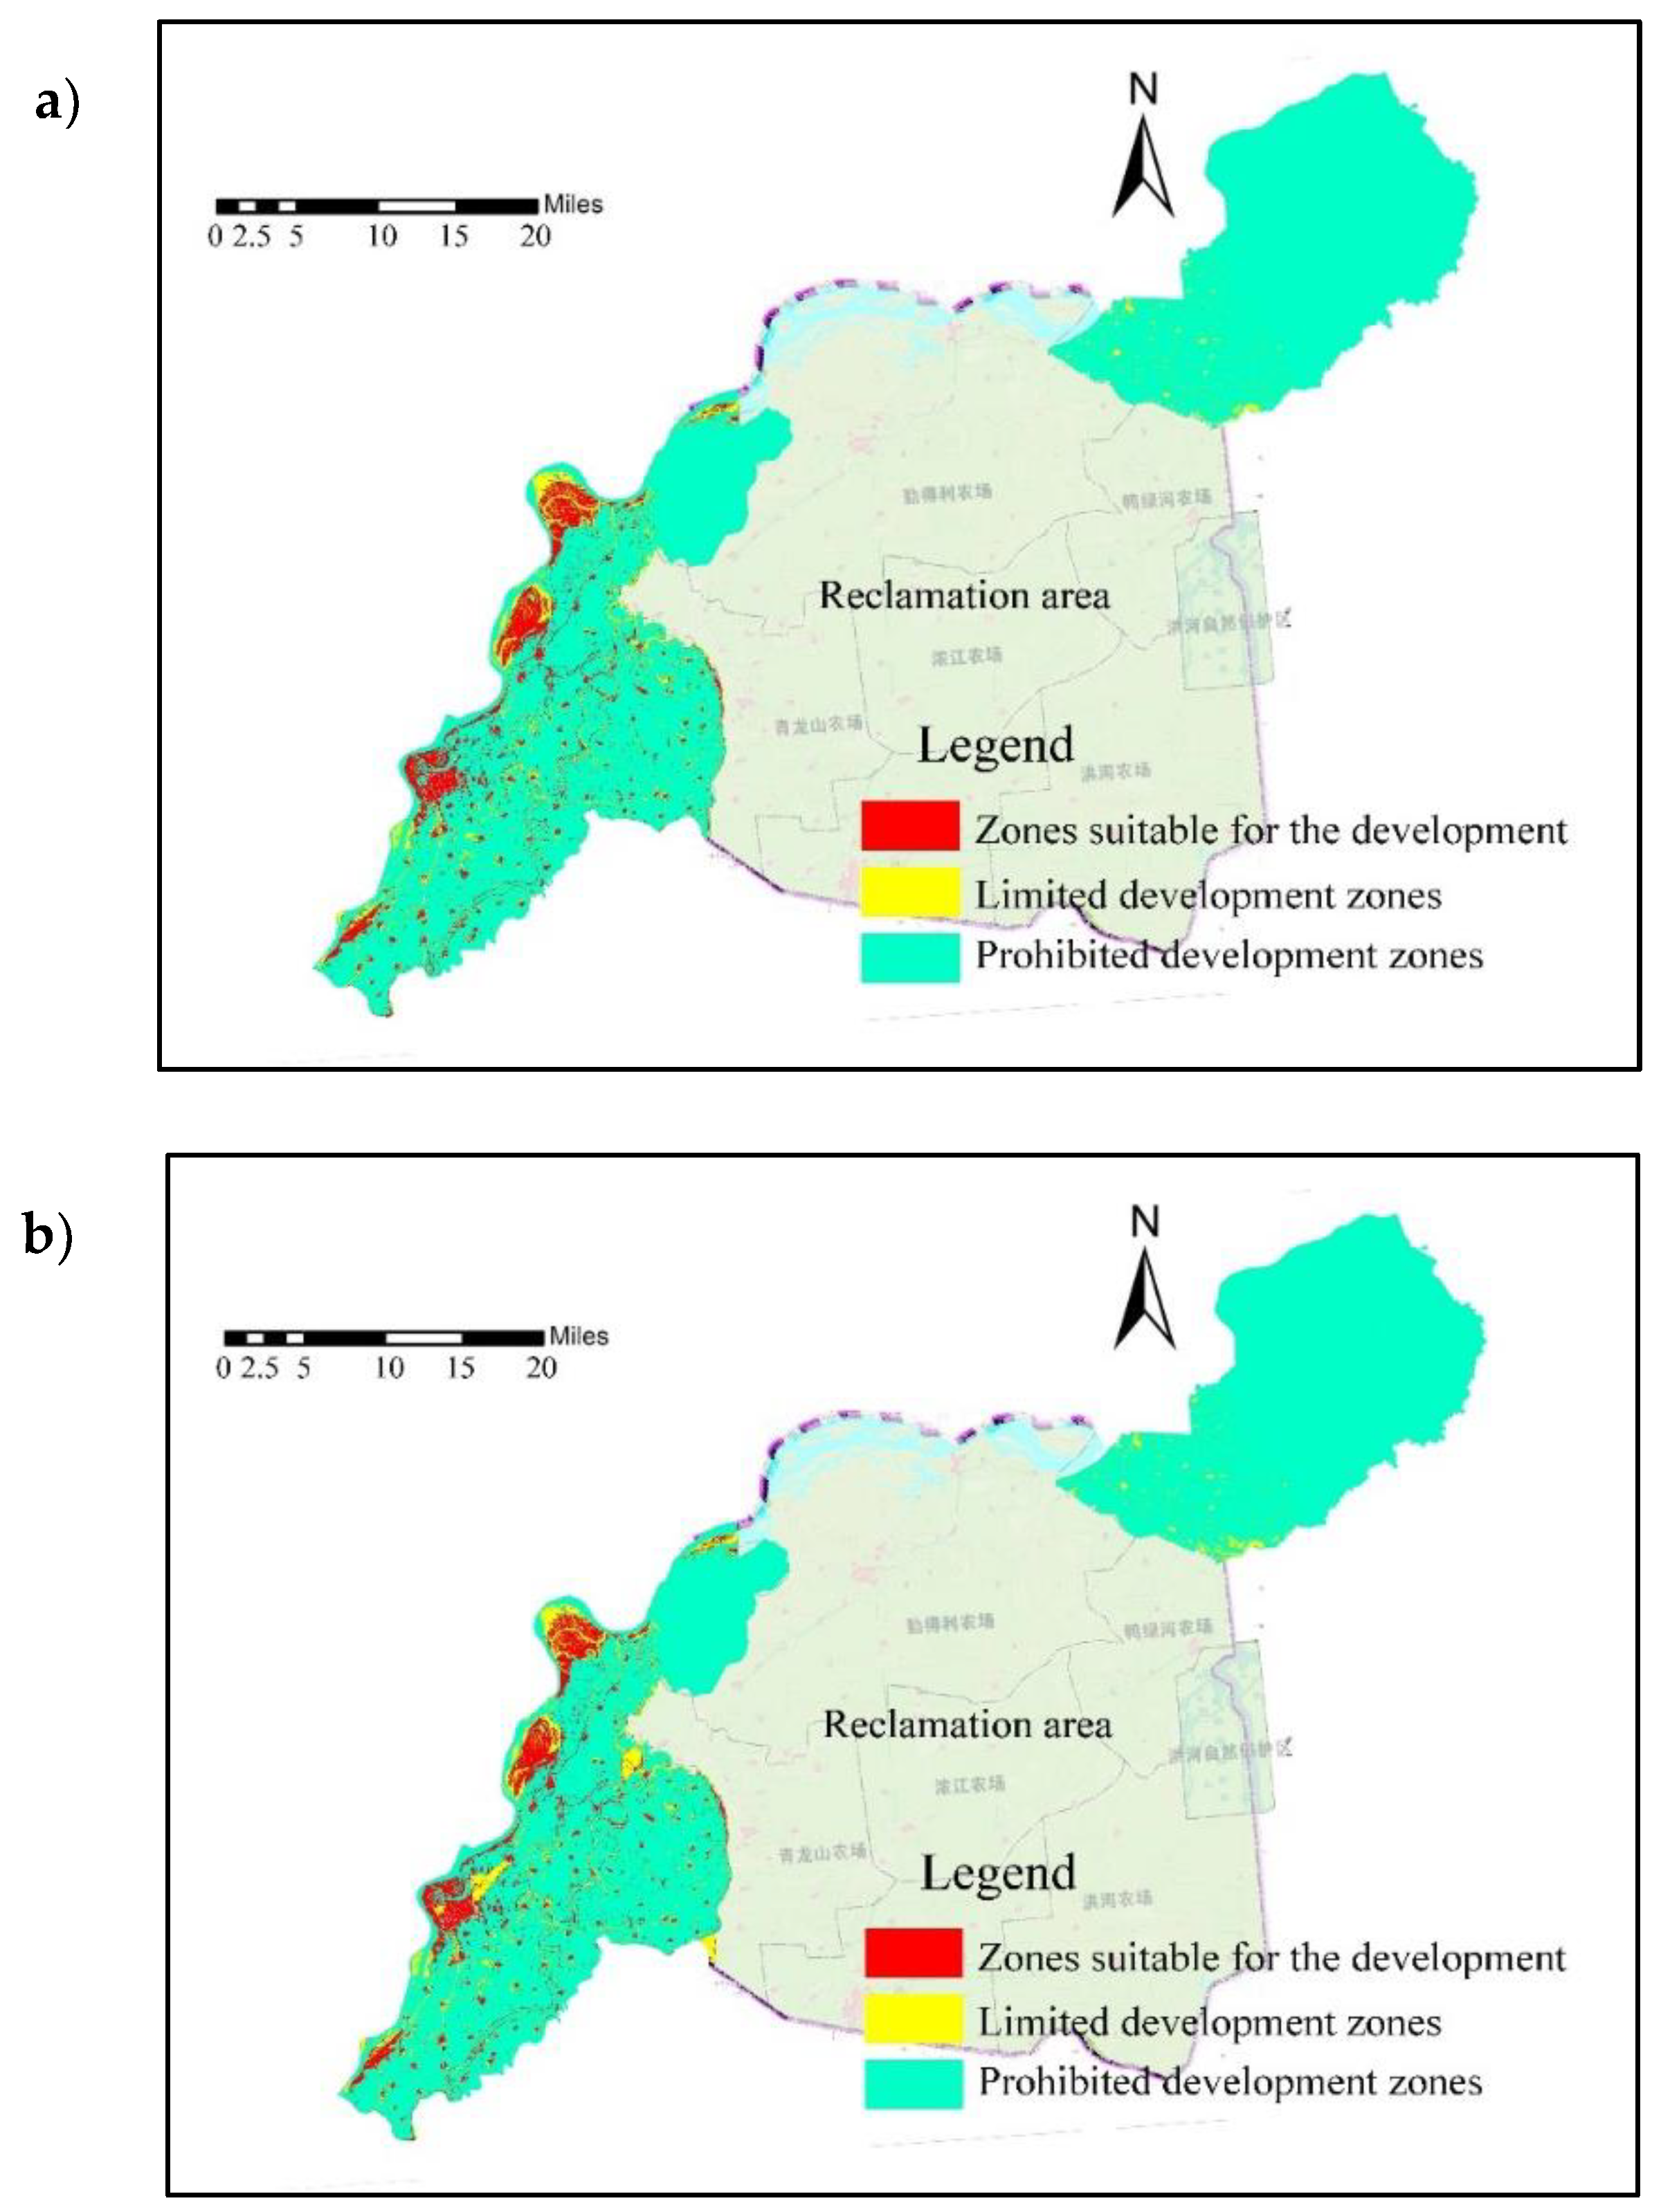
Figure 7.
The spatial zoning of the MAA-D using M-MSZ.

Figure 8.
The spatial zoning of the MAA-EP using M-MSZ.
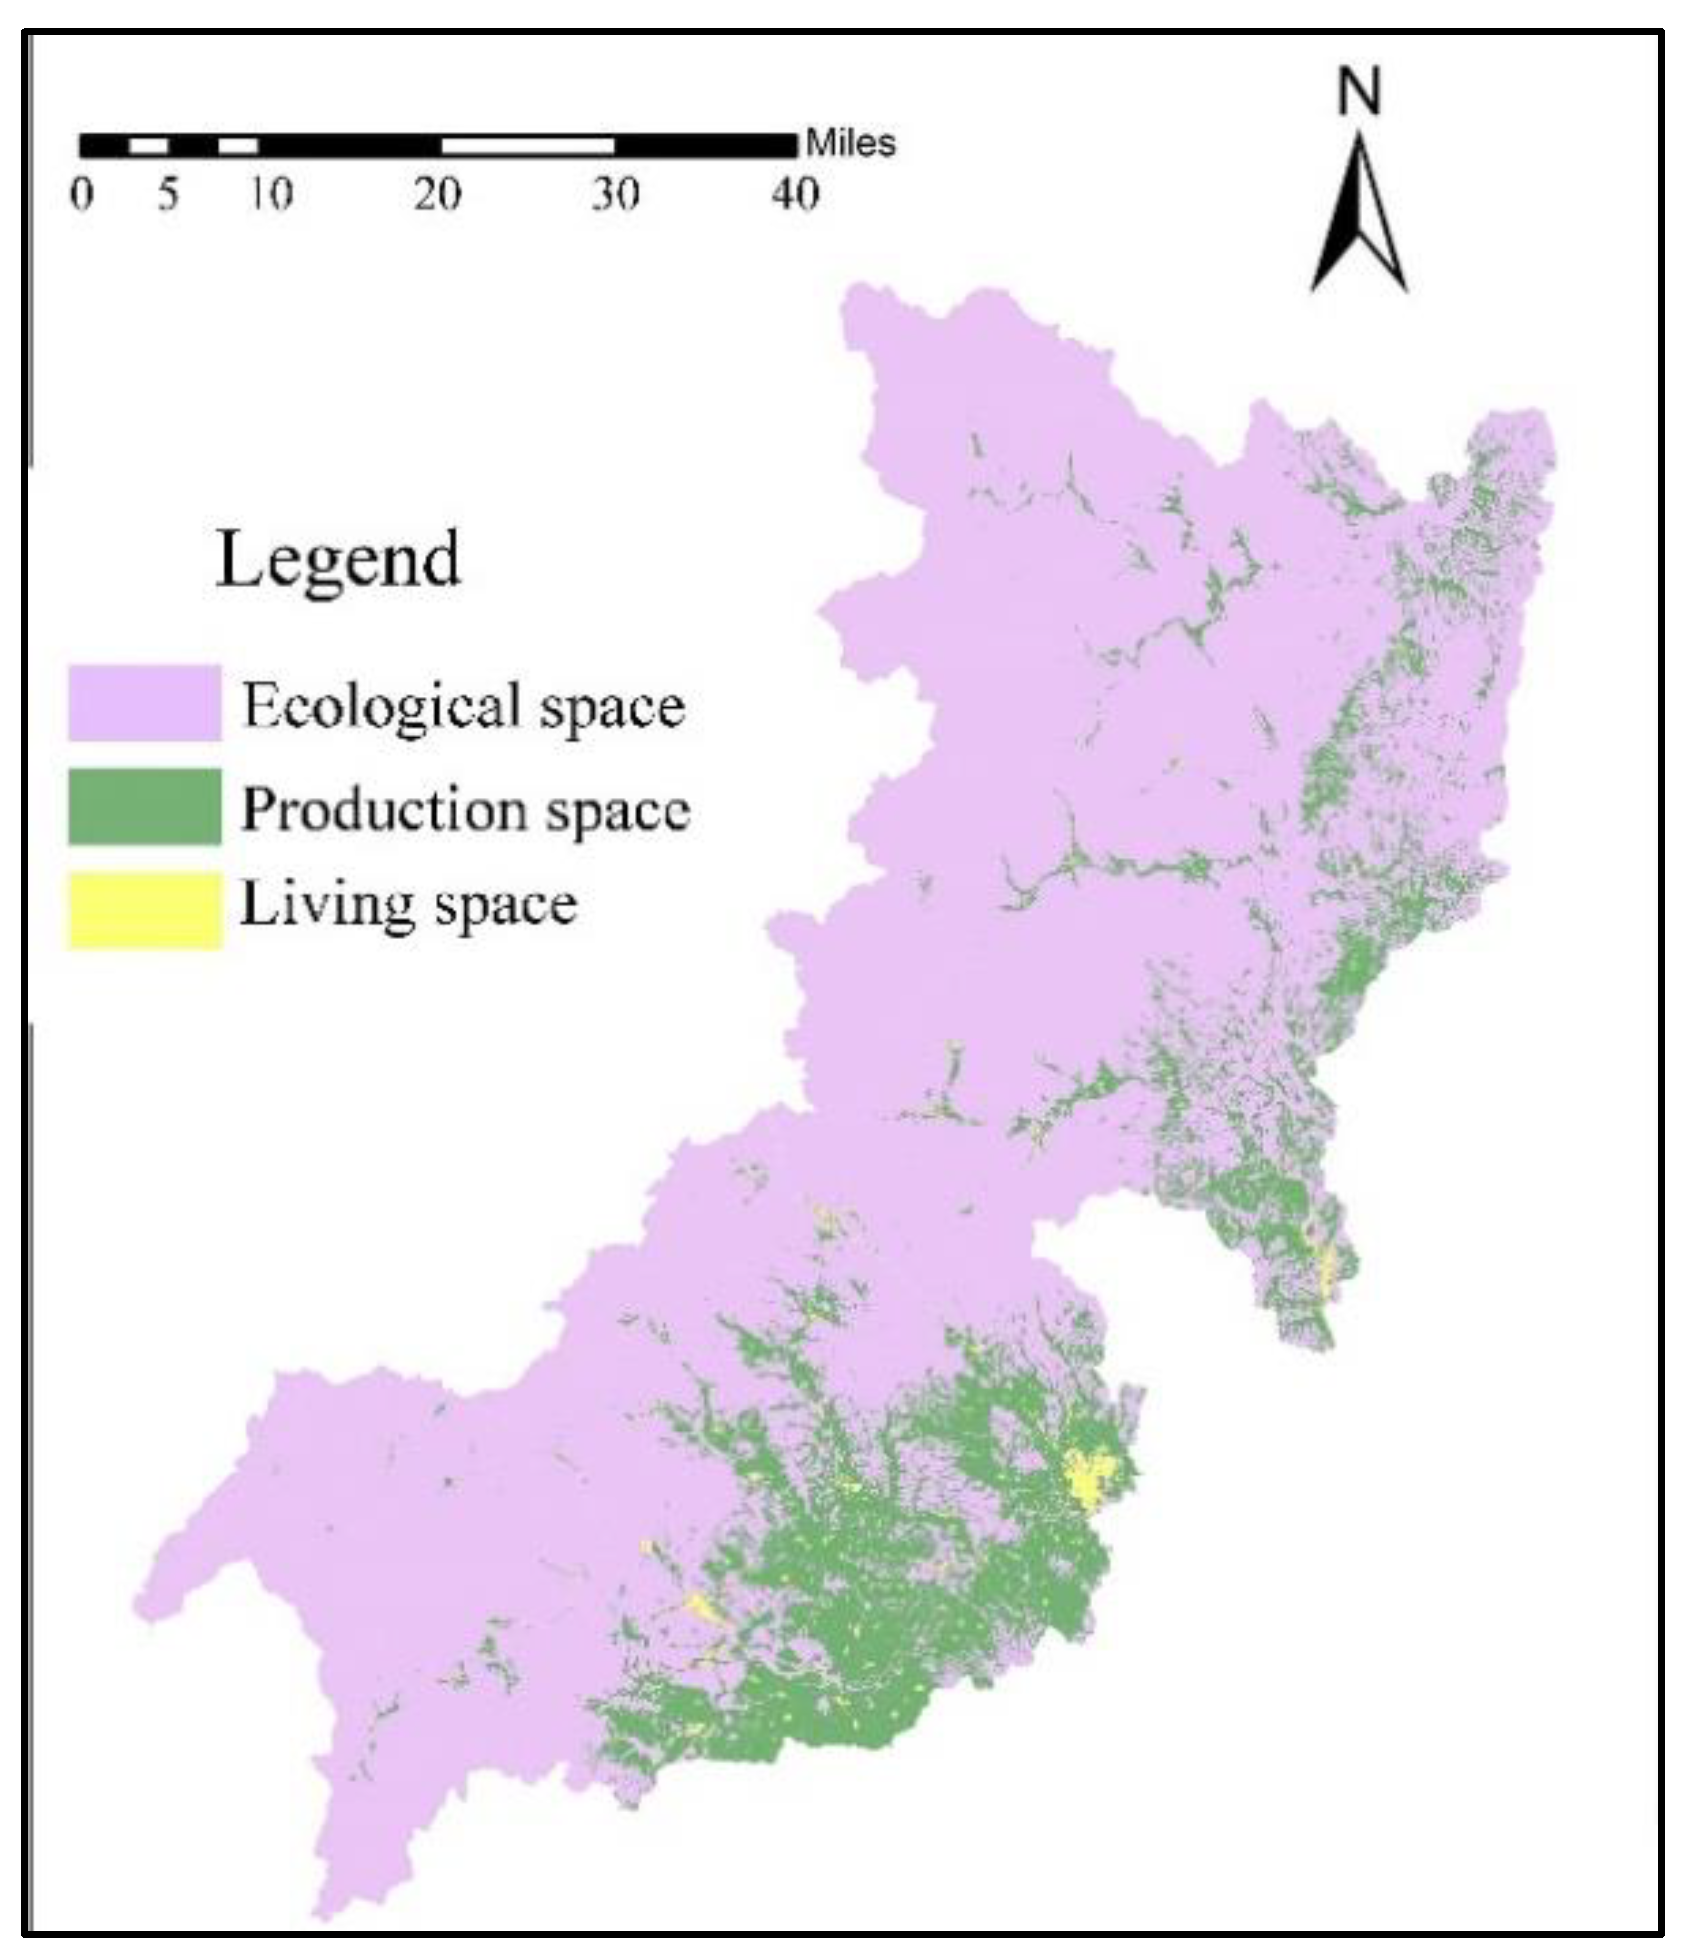
Figure 9.
The spatial zoning of the MAA-AP using M-MSZ.

Figure 10.
The comparison of spatial zoning among German, France, the United Kingdom, the United States, Japan, and China [2,3,4,6,7,10,11,12,97,98].


Table 1.
The occurrence frequency of each factor in the literature statistics.
| Factor | a | b | c | d | e | f | g | h | i | j | k | l | m |
|---|---|---|---|---|---|---|---|---|---|---|---|---|---|
| Occurrence Frequency (%) | 100 | 100 | 100 | 100 | 100 | 100 | 100 | 100 | 87.3 | 70.4 | 24.3 | 22.5 | 10.7 |
a: economic situation; b: population quantity; c: land quantity; d: transport superiority degree; e: environmental capacity; f: ecosystem vulnerability; g: utilization of water resources; h: natural disaster; i: location advantage; j: topographic and terrain; k: interregional interaction; l: administrative rank; m: land renovation.
Table 2.
The expert scoring table on the factor selection (full score is 100).
| Factor | a | b | c | d | e | f | g | h | i | j | k | l | m | n | o | |
|---|---|---|---|---|---|---|---|---|---|---|---|---|---|---|---|---|
| Experts from Universities | A | 97 | 100 | 100 | 89 | 86 | 77 | 79 | 76 | 71 | 70 | 42 | 34 | 25 | 76 | 40 |
| B | 98 | 97 | 100 | 91 | 93 | 78 | 81 | 78 | 73 | 72 | 78 | 23 | 20 | 75 | 32 | |
| C | 100 | 98 | 94 | 87 | 81 | 86 | 87 | 82 | 71 | 73 | 60 | 56 | 20 | 75 | 60 | |
| D | 89 | 93 | 86 | 79 | 76 | 85 | 87 | 70 | 84 | 72 | 32 | 60 | 22 | 78 | 53 | |
| E | 87 | 90 | 80 | 80 | 77 | 92 | 92 | 70 | 81 | 70 | 30 | 44 | 23 | 60 | 43 | |
| Experts Majored in Engineering Planning and Design | A | 92 | 100 | 100 | 100 | 81 | 74 | 82 | 84 | 76 | 71 | 60 | 45 | 20 | 73 | 47 |
| B | 99 | 95 | 95 | 96 | 90 | 72 | 83 | 89 | 77 | 70 | 75 | 37 | 20 | 82 | 36 | |
| C | 99 | 89 | 100 | 83 | 90 | 74 | 81 | 74 | 77 | 70 | 67 | 46 | 24 | 80 | 55 | |
| D | 92 | 84 | 81 | 87 | 73 | 81 | 77 | 76 | 79 | 73 | 32 | 45 | 22 | 70 | 68 | |
| E | 85 | 87 | 83 | 81 | 79 | 94 | 93 | 71 | 81 | 78 | 30 | 44 | 20 | 65 | 51 | |
| Average | 94 | 93 | 92 | 87 | 83 | 81 | 84 | 77 | 77 | 72 | 51 | 43 | 22 | 73 | 49 | |
a: economic situation; b: population quantity; c: land quantity; d: transport superiority degree; e: environmental capacity; f: ecosystem vulnerability; g: utilization of water resources; h: natural disaster; i: location advantage; j: topographic and terrain; k: interregional interaction; l: administrative rank; m: land renovation; n: urban structure; o: urban size.
Table 3.
The questionnaires about the main consideration of MAA participants from 25 MAAs with different scales when they are choosing the living space.
Table 3.
The questionnaires about the main consideration of MAA participants from 25 MAAs with different scales when they are choosing the living space.
| Factor | a | b | c | d | e | f | g | h | i | j | k | l |
|---|---|---|---|---|---|---|---|---|---|---|---|---|
| Proportion (%) | 82.2 | 92.4 | 83.6 | 84.5 | 69.3 | 72.6 | 69.8 | 87.4 | 75.3 | 71.2 | 68.9 | 33.4 |
a: economic situation; b: population quantity; c: land quantity; d: transport superiority degree; e: environmental capacity; f: ecosystem vulnerability; g: utilization of water resources; h: natural disaster; i: location advantage; j: topographic and terrain; k: urban structure; l: urban size.
Table 4.
The correlation analysis with the R2, SIG, F, and Fa parameters.
| Code | Factor | Degree of Freedom | Explained Sum of Squares | Residual Sum of Squares | Variance Sum of Squares | R Square | Sig | F | Fa (k–1,n–k) |
|---|---|---|---|---|---|---|---|---|---|
| x1 | Economic situation | 420422 | 9.4 | 4.032 | 6.3 | 0.64 | 0.004 # | 75354.6 | 64780.5 |
| x2 | Location advantage degree | 420422 | 8.2 | 3.256 | 4.3 | 0.75 | 0.004 # | 81446.3 | 69835.4 |
| x3 | Transport superiority degree | 420422 | 9.5 | 4.738 | 7.8 | 0.61 | 0.006 # | 64844.1 | 53298.1 |
| x4 | Population agglomeration | 420422 | 10.3 | 5.476 | 7.5 | 0.73 | 0.007 # | 60829.7 | 55483.2 |
| x5 | Topographic and terrain | 420422 | 7.2 | 3.854 | 6.2 | 0.62 | 0.005 # | 60417.5 | 50897.4 |
| x6 | Unavailable land | 420422 | 2.4 | 4.273 | 7.1 | 0.6 | 0.060 | 18164.3 | 30256.8 |
| x7 | Environmental capacity | 420422 | 8.2 | 6.725 | 8.7 | 0.77 | 0.010 * | 39433.3 | 29356.7 |
| x8 | ecosystem vulnerability | 420422 | 8.3 | 4.716 | 7.7 | 0.61 | 0.030 * | 56917.5 | 47863.5 |
| x9 | Land quantity | 420422 | 9.7 | 5.372 | 8.7 | 0.62 | 0.003 # | 58395.2 | 40235.1 |
| x10 | utilization of water resources | 420422 | 7.3 | 3.774 | 5.6 | 0.68 | 0.003 # | 62555.1 | 60483.2 |
| x11 | Natural disaster | 420422 | 4.5 | 9.854 | 13.7 | 0.72 | 0.040 * | 14768.6 | 8879.6 |
| x12 | the pending development zones | 420422 | 7.4 | 5.863 | 9.3 | 0.63 | 0.007 # | 40818.2 | 38792.3 |
| x13 | the number of developed areas | 420422 | 15.3 | 11.809 | 16.6 | 0.71 | 1.200 | 41900.6 | 59753.6 |
Note: * is significantly correlated at the 0.05 level; # is significantly correlated at the 0.01 level; R Square = Residual Sum of Squares/Variance Sum of Squares; F = (Explained Sum of Squares/number of independent variable)/(Variance Sum of Squares/degree of freedom); degree of freedom = n–k–1; n: number of samples; k: the number of independent variables.
Table 5.
The curve correlation coefficients and significance of the influence factors and variables.
Table 5.
The curve correlation coefficients and significance of the influence factors and variables.
| Factor | x1 | x2 | x3 | x4 | x5 | x7 | x8 | x9 | x10 | x11 | x12 |
|---|---|---|---|---|---|---|---|---|---|---|---|
| x1 | 1 | ||||||||||
| x2 | 0.25 | 1 | |||||||||
| x3 | 0.23 | 0.21 | 1 | ||||||||
| x4 | 0.26 | 0.27 | 0.27 | 1 | |||||||
| x5 | 0.05 | 0.06 | −0.06 | 0.09 | 1 | ||||||
| x7 | −0.07 | 0.17 | −0.11 | −0.19 | 0.22 | 1 | |||||
| x8 | −0.08 | 0.05 | −0.12 | −0.11 | 0.14 | 0.17 | 1 | ||||
| x9 | 0.08 | 0.09 | −0.06 | −0.21 | −0.12 | 0.1 | 0.11 | 1 | |||
| x10 | 0.11 | 0.12 | −0.19 | −0.13 | 0.13 | 0.18 | 0.12 | 0.05 | 1 | ||
| x11 | 0.09 | 0.07 | −0.25 | 0.2 | 0.25 | 0.18 | 0.13 | 0.06 | 0.16 | 1 | |
| x12 | 0.44 | 0.41 | 0.38 | 0.13 | 0.06 | 0.16 | 0.18 | 0.06 | 0.23 | 0.26 | 1 |
Note: x1 is the economic situation; x2 is the location advantage; x3 is the transport superiority degree; x4 is the population agglomeration; x5 is the topographic and terrain; x6 is the unavailable land; x7 is the environmental capacity; x8 is the ecosystem vulnerability; x9 is the available land; x10 is the utilization of water resources; x11 is natural disaster; x12 is the number of the pending development zones; and x13 is the number of developed areas.
Table 6.
The basic information of the research areas.
| Type of MAA | MAA-D | MAA-AP | MAA-EP | |
|---|---|---|---|---|
| Information | ||||
| Location (Heilongjiang Province) | Southwest | Northeast | Southeast | |
| The total population of MAAs, 2017 (thousand) | 606 | 212 | 420 | |
| The total area of MAAs (Km2) | 2500 | 6300 | 8700 | |
| Proportion of urban population to the total number of people | ~50% | ~50% | ~50% | |
| The proportion of urban area to the total area of the region | ~1.2% | ~0.36% | ~0.25% | |
| The GDP proportion of the second or third industry to total | ~85% | ~50% | ~75% | |
| The proportion of cultivated land in the total MAAs area | ~30% | ~60% | ~13% | |
| Forest coverage | ~50% | ~20% | ~70% | |
| MAA-D | Living Space | The urban built-up area; the type I transitional zone that is adjacent to the urban built-up area of level one, two or three; sand barrier, stacking material, other artificial dig land, saline-alkali land, clay land, gravel land, rock land in the type II transitional zone that is adjacent to the urban built-up area of level one or two; type III transitional zone of level one, two or three. Open pits with large destruction in type III transition areas of level one, two or three. Other zones in type III transition areas. |
| Agricultural Production Space | Protective zone of basic farmland; the type I transitional zone that is adjacent to the urban built-up area of level four or five; the type I transitional zone that is not adjacent to the urban built-up area. Other zones in type III transitional zones. | |
| Ecological Space | Limited development zones except for protection areas of basic farmland; the land in type II transition zones used for producing natural ecological forest and grass, as well the upland and paddy field with slope of bigger than 25° except the basic farmland; sand barrier, other artificial dig land, saline-alkali land, clay land, gravel land, rock land in type II transitional zones adjacent to urban built-up area of level three, four or five. Type II transitional zone that is not adjacent to the urban built-up area; Open pits with large destruction in type III transition areas of level four or five. | |
| MAA-AP | Living Space | The urban built-up area; the type I transitional zone that is adjacent to the urban built-up area of level one; sand barrier, stacking material, other artificial dig land, saline-alkali land, clay land, gravel land, rock land in the type II transitional zone that is adjacent to the urban built-up area of level one or two. Other zones in type III transitional zone. |
| Agricultural Production Space | Protective zone of basic farmland; the type I transitional zone that is adjacent to the urban built-up area of level two, three, four or five; Paddy fields and uplands of the type II transitional zone except basic farmland; the type I transitional zone that is not adjacent to the urban built-up area; the type III transitional zone with level one, two or three. Open pits with large destruction in type III transition areas | |
| Ecological Space | Limited development zones except for protection areas of basic farmland; the land used for producing natural ecological forest and grass in type II transition zone; sand barriers, other artificial dig land, saline-alkali land, clay land, gravel land, rock land in type II transitional zone adjacent to urban built-up area of level three, four or five. Type II transitional zone that is not adjacent to the urban built-up area; Open pits with large destruction in type III transition areas. | |
| MAA-EP | Living Space | The urban built-up area; the type I transitional zone that is adjacent to the urban built-up area of level one; sand barriers, stacking material, other artificial dig land, saline-alkali land, clay land, gravel land, rock land in the type II transitional zone that is adjacent to the urban built-up area of level one or two. |
| Agricultural Production Space | Protective zone of basic farmland; the type I transitional zone that is adjacent to the urban built-up area of level four or five; the type I transitional zone that is not adjacent to the urban built-up area. | |
| Ecological Space | Limited development zones except for protection areas of basic farmland; the type I transitional zone that is adjacent to the urban built-up area of level two or three; the land in type II transition zone used for producing natural ecological forest and grass, as well the upland and paddy field with slope of bigger than 25° except the basic farmland; sand barrier, other artificial dig land, saline-alkali land, clay land, gravel land, rock land in type II transitional zone adjacent to urban built-up area of level three, four or five. Type II transitional zone that is not adjacent to the urban built-up area; Type III transitional zone. |
Table 8.
The classification of urban built-up area, transitional zones, limited development zones [88,89,90,91].
| Zone | Large Class | Small Class |
|---|---|---|
| urban built-up area | Urban | Residential land |
| Land for public management and public service | ||
| Land for commercial service facilities | ||
| Industrial land | ||
| Logistics and warehousing land | ||
| Land for traffic facilities | ||
| Land for public facility | ||
| Green space | ||
| Town | Residential land | |
| Land for public management and public service | ||
| Land for commercial service facilities | ||
| Industrial land | ||
| Logistics and warehousing land | ||
| Land for traffic facilities | ||
| Land for public facility | ||
| Green space | ||
| Village | Village residential land | |
| Land for village public service | ||
| Land for village industrial | ||
| Village infrastructure | ||
| Other construction sites in the village | ||
| Land for village construction | ||
| transitional zone | Type I | The arable land, garden land, and other agricultural production lands that with a slope smaller than 25° except the protective zone of basic farmland. |
| Type II | A woodland and grassland dominated by producing natural ecological forest and grass. | |
| The upland and paddy fields with slope bigger than 25° except the basic farmland. | ||
| Sand barriers, other artificial dig lands, saline-alkali land, clay land, gravel land, rock land. | ||
| Type III | Open pits with large destruction and other areas. | |
| limited development zones | protective zones of basic farmland | Basic farmland |
| Other protective zones | Natural reverse | |
| Scenic area | ||
| Forest parks | ||
| Geo-parks | ||
| World cultural and natural heritage | ||
| Land for water and water conservancy facilities | ||
| Wetland | ||
| Protection zone for drinking water source | ||
| Zone that is not suitable for the development of large-scale industrialization and urbanization |
Table 9.
The index of various space in MAAs after application with the M-MSZ.
| Index | Type of MAAs | MAA-D | MAA-AP | MAA-EP |
|---|---|---|---|---|
| The area proportion of various space in MAAs | Living Space | 8.20% | 0.73% | 0.89% |
| Agricultural Production Space | 41.37% | 51.20% | 16.38% | |
| Ecological Space | 50.43% | 48.07% | 82.73% | |
| The increase in various space | Living Space | 5.70% | 0.27% | 0.22% |
| Agricultural Production Space | −4.80% | 12.80% | −12.12% | |
| Ecological Space | −0.90% | −13.07% | 11.90% | |
| The year estimated to reach the spatial zoning boundary | 2070 | 2069 | 2072 | |
© 2018 by the authors. Licensee MDPI, Basel, Switzerland. This article is an open access article distributed under the terms and conditions of the Creative Commons Attribution (CC BY) license (http://creativecommons.org/licenses/by/4.0/).
Share and Cite
MDPI and ACS Style
Zhao, Y.; Leng, H.; Sun, P.; Yuan, Q. A Spatial Zoning Model of Municipal Administrative Areas Based on Major Function-Oriented Zones. Sustainability 2018, 10, 2976. https://doi.org/10.3390/su10092976
AMA Style
Zhao Y, Leng H, Sun P, Yuan Q. A Spatial Zoning Model of Municipal Administrative Areas Based on Major Function-Oriented Zones. Sustainability. 2018; 10(9):2976. https://doi.org/10.3390/su10092976
Chicago/Turabian StyleZhao, Yujing, Hong Leng, Pingjun Sun, and Qing Yuan. 2018. "A Spatial Zoning Model of Municipal Administrative Areas Based on Major Function-Oriented Zones" Sustainability 10, no. 9: 2976. https://doi.org/10.3390/su10092976
Note that from the first issue of 2016, this journal uses article numbers instead of page numbers. See further details here.