Article

Developing and Validating an Individual Sustainability Instrument with Engineering Students to Motivate Intentional Change

1
Department of Engineering, Wake Forest University, Winston Salem, NC 27101, USA
2
College of Integrated Science and Engineering, James Madison University, Harrisonburg, VA 22807, USA
*
Author to whom correspondence should be addressed.
Sustainability 2018, 10(8), 2885; https://doi.org/10.3390/su10082885
Submission received: 15 May 2018 / Revised: 3 August 2018 / Accepted: 6 August 2018 / Published: 14 August 2018
(This article belongs to the Section Sustainable Education and Approaches)

Abstract

:
This paper describes three studies that were conducted sequentially for purposes of validating the Individual Sustainability survey for use with undergraduate engineering students. During the first study, researchers administered the original 50-item Individual Sustainability survey to an undergraduate engineering class at a mid-sized University, using real and ideal self. Following exploratory and confirmatory factor analysis, the survey instrument was reduced to 36 items, and reframed to compare real self to ideal professional engineer. The new version was administered to three cohorts of engineering students at the same institution, and factor structures were analyzed again. In order to provide more stable parameter estimates, a third study with 34 items was run with engineering students in similar courses at four different institutions. The methods and results of all three studies are described, to justify the survey’s evolution. This is followed by a discussion of the final survey instrument and approaches for administering the survey to undergraduate engineering students, or adapting survey administration for other student populations. The instrument, in its current form, is an effective way to identify dissonance between one’s real and ideal conceptualizations of self, and help individual students identify opportunities for personal change and professional growth toward sustainability values and behaviors.

1. Introduction

Typically, professional and educational frameworks purported to define and measure sustainable development concepts emphasize pursuit of three objectives: (1) Social equity and quality of life; (2) environmental protection and restoration; and (3) economic viability and development. Literature on sustainable development almost invariably includes mention of the Brundtland definition, which originated in the World Commission on Environment and Development (WCED)’s 1987 report, “Our Common Future”. The definition, which states that sustainable development is “development that meets the needs of the present without compromising the ability of future generations to meet their own needs”, is generally viewed as the starting point for sustainable development discussions [1,2]. In the three decades since the term “sustainable development” emerged, many variations (or expansions) of the Brundtland definition have appeared in the literature. Sustainable development is widely accepted as a theoretical concept or end goal [1], but without a universally agreed upon definition. That said, most definitions recognize at a minimum three dimensions—social, environmental, and economic (e.g., References [3,4])—that can be organized in different ways like the triple bottom line or Venn diagram model [5], triple top line [6], and nested dependencies model [7].
Many sustainability or sustainable development frameworks involve additional dimensions like the political system, culture, technical decisions (typically applied in engineering contexts), temporal or spatial variations, etc. Other frameworks sub-divide or explore dimensional overlaps in order to define more specific objectives like intergenerational and intragenerational equity or environmental justice. Regardless of the specific dimensions, the different frameworks tend to emphasize systems thinking (i.e., interactions of different actors and systems at different scales) and striving to maximize positive benefits across systems while justifying inevitable trade-offs [2,8]. When engineering educators shift from defining sustainability or sustainable design to identifying competences (or learning outcomes) that students should be able to demonstrate, the list of dimensions becomes much longer. For example, Lozano and colleagues identified twelve categories, each with several individual competences, for education for sustainable development [9].
Engineering educators and researchers have used a variety of assessment tools to capture students’ knowledge of and/or valuation of sustainability dimensions. According to a 2017 systematic review of conference proceedings from the American Society of Engineering Education (ASEE), knowledge of or attitudes toward sustainability are most commonly captured using student self-report surveys. In fact, over half of ASEE records that assessed students’ conceptual and/or applied sustainability knowledge used self-report surveys [10]. Many summaries of student assessments from a variety of institutional contexts suggest that students over-emphasize the environmental dimension while under-emphasizing the social dimension [11,12,13] and often recognize the economic dimension least of all [14,15].
We suggest an additional gap in most discussions of sustainability definition and measurement, particularly in education—the individual context. The general dispositions that support individual sustainability are awareness, motivation, and the ability to engage in intentional self-development. Additionally, individual sustainability includes possessing a well-developed and demonstrated value system that acknowledges the interconnectedness of all global biological systems and our appropriate place in the natural world. To summarize:
Individual Sustainability is characterized by harmony, awareness, and intentionality in thought and behavior, leading to increasingly responsible actions and continued growth in one’s physical, emotional, social, philosophical, and cognitive life [16].
A considerable number of psychologists, educators, philosophers, and engineers have noted the complex nature of what constitutes personality, and how it manifests itself. Furthermore, some have indicated that personality characteristics are dependent upon each other in order to produce a highly functioning individual. What these writers have in common is the understanding that personality is related to a variety of factors, that these factors comprise a complex system, and that a change in one factor may well produce unpredictable changes in the other factors [16].

1.1. Overview and Objectives of this Study

Three methodologies inform this work and were described by Pappas and Pappas [17]. Firstly, this research employs a systems theory methodology which stresses that the interrelationship of factors in a unified system depend upon the unpredictable nature of the relationship of these individual factors. Secondly, we consider values, whether they be corporate, government, community, or individual, as the principal guiding force for defining and solving sustainability problems [18]. Thirdly, following years of researching and teaching sustainability, we understand it is an individual’s demonstrated behaviors and skills, not simply his or her knowledge of, or attitudes toward, sustainability that support and promote sustainability. It appears that offering the opportunity to learn about sustainability does not necessarily lead to more sustainable behavior [19]. Developing an individual’s values may provide motivation to behave in a manner more congruent with sustainability principles [20]. Our work suggests that this transformative process employs instructional theory and methodologies that offer students greater insight into, and understanding of, sustainability problems than traditional instruction that focuses on increasing “student knowledge” or learning basic laboratory skills.
The objectives of this study were to test and validate the Individual Sustainability survey with undergraduate engineering students in multiple educational contexts. The survey instrument was administered to engineering students in two parts, Real (Current) Self and Ideal Professional Engineer, in order to stimulate personal reflection and help students identify dissonance between current behaviors and ideals/values. Iterative application and revision of the survey through three sub-studies (described in subsequent sections) led to a version of the instrument and assignments that confront students with opportunities for self-development and intentional change towards a more sustainable self and engineering professionalism. Currently in science, technology, engineering, and math (STEM) education, researchers and practitioners are interested in students’ development into technically and socially competent professionals, with recognition that students often experience dissonance between personal and professional values [21,22,23]. Thus, we are making a connection between students’ self and professional development to stimulate positive, intentional behavior change.
The remaining sections of this paper describe the theoretical underpinnings of Individual Sustainability, the overall methodology for administering the Individual Sustainability survey to undergraduate engineering students, and the three studies that were conducted sequentially for purposes of validating the Individual Sustainability survey. Ultimately, the goal of this paper is to support widespread testing of the survey instrument with diverse populations as a tool for stimulating intentional self-development. Following the results of the three studies, the discussion suggests opportunities for using and continuing to validate the current 34-item Individual Sustainability survey.

1.2. Background Literature and Theory of Individual Sustainability

This background section briefly reports foundational work and literature underpinning the Individual Sustainability survey; more extensive reviews of the relevant theory and historical perspectives can be found in prior publications (e.g., References [16,17,18]). As a construct, Individual Sustainability (also referred to as Sustainable Personality) serves to define and support a process model for intentional self-development based on self-directed behavior and systems thinking. As a process in an instructional setting, students are expected to develop, test, and revise methods in which they change behaviors in such a way to balance themselves across the Individual Sustainability contexts (emotional, intellectual, social, and economic).
While this “intentional change” is often addressed in the juried psychology and business literature, it is mostly in the form of recommendations for workplace-related change or professional skill development. Rarely are intentional strategies for individual behavioral change included; that is the intentional and directed human thinking and behaviors that foster personal change and balance. Much of the current published work and university instruction related to intentional thinking and cognitive behavioral change is vague on intentional behavioral change strategies. Most methods suggest a product (or goal) of behavioral change, leaving individuals to their own devices on how to do the thinking and integrate the subsequent behavioral changes required to reach a goal. These activities may stimulate thinking about the product of behavioral change in general, but they do not offer the means for coming up with the change suggested; that is, (1) examining, understanding, and changing thinking processes and practices; (2) developing the procedures and confidence associated with making personal changes; (3) practicing and revising thinking and behavioral change processes needed to foster change; and (4) “personalizing” thinking and behavioral skills (integrating these skills into everyday professional and personal lives in an intentional manner).
The most essential issue is this: Individuals often do not know what to change about themselves or how to implement change in their thinking and behavior. Learning how to change intentionally has proven to be a major barrier in many individuals’ lives (e.g., losing weight, working out, or improving relationships). This fact has dominated the literature on behavioral change, first noted by Bandura [24]. The difficulty related to intentional change (or self-efficacy), noted by Pajares is “regulation of one’s own motivation, thought processes, affective states and actions, or changing environmental conditions” [25] (p. 546). What is needed are semi-structured feedback and development procedures that allow individuals to successfully identify and enact adaptive personal changes.
While the bulk of published material on this topic is outside the juried engineering and STEM literature, Individual Sustainability is likely the most important factor influencing the success of activities in other general sustainability contexts (environmental, social, economic, technical, etc.). Understanding the complexities and interconnectedness of one’s own sustainability factors is pre-requisite for transferring this systems knowledge to understanding community and global sustainability; thus, learning about sustainability should start with Individual Sustainability.
Individual Sustainability is defined as “a person’s ability to live a healthy lifestyle that includes creating harmony, interconnections, community, ethically responsible systems, and relatively high levels of awareness in one’s values, thoughts, and behaviors as well as maintaining or increasing control over one’s physical, emotional, social, philosophical/spiritual, and intellectual life” [16]. In prior work, the following categories comprised Individual Sustainability, reflecting both general sustainability contexts and aspects of Sustainable Personality [16,18]:
  • Social Sustainability—the ongoing human and institutional balance and prosperity that characterize a healthy social unit, and includes justice, equity, fairness, the role of individuals, relationships among social groups, the family, collective behavior, social class, race and ethnicity, medicine, education, and the role of institutions in society.
  • Economic Sustainability—profit-making policies and strategies related to the ethical and responsible conduct of an economic enterprise (corporate, government, economy). Additionally, economic sustainability addresses factors that influence the economic health and profile of communities, including the standard of living, the business climate, employment, and the productive role of business in the life of a community.
  • Emotional Sustainability—the ability to self-regulate one’s emotions, that is, to know one’s self well emotionally and psychologically, which would result in intentional and tempered (predicting and regulating) emotional responses to events, people, and life situations on a day-to-day basis. This meta-emotional state includes the empathetic consideration of others in personal and professional relationships, tempering one’s ego and unenlightened self-interest, and understanding collective human action.
  • Intellectual Sustainability—the ability to educate one’s self across a wide variety of disciplines and recognize the influence, interconnectedness, and power of knowledge. This includes developing a creative approach to understanding how knowledge is developed, adapted, applied, manipulated, transferred, synthesized, analyzed, and evaluated.
The relevance of Individual Sustainability to students should be clear. Balancing one’s self as described above increases students’ self-awareness, organizational ability, motivation, perseverance and a variety of other skills valuable to school, career and citizenship, and creating a productive life. This approach also supports the development of empathy and humanistic values that support collective effort in the variety of communities in which students reside. While institutions of higher learning rarely go beyond instruction in professional skills and communications, instruction focused on Individual Sustainability offers greater possibilities for sustained personal growth and personality development.
There are countless historical roots supporting the concept of Individual Sustainability (Sustainable Personality) [16,17,18,26,27,28,29,30,31,32,33,34,35,36,37,38]. Bertrand Russell, in his lecture on the concept of “belief”, outlined the mutually dependent components of a holistic intellectual life which consists of “beliefs, reasoning, theories of knowledge, and metaphysics...out of which our philosophical outlook evolves” [27] (p. 139). Hegel viewed the “whole” of existence as a non-self-contradictory complex system [28]. His philosophy always considered “reality” as a whole. James delineated the constituents of the self as “the material self, the social self, the spiritual self, and the pure ego” [29] (p. 292). These factors, he said, provide the human foundation for self-seeking and self-preservation, an understanding of one’s self in the broadest sense.
John Dewey referred to consciousness as composed of “natural and social operations” [30] (p. 244) and is a “connected course of experience” [30] (p. 249). Further, he proposed the synthesis of human processes “in which elements combine into complex wholes and series” [30] (p. 245). He noted “knowing, willing, feeling [are the] name states of consciousness” [30] (p. 252), with acts and attitudes found in experience. He later refers to consciousness as a “system of truth” [30] (p. 257). A few years later, Dewey outlined a similar system guiding successful education: “Education, we received from three sources—Nature, men, and things”…that the “concurrence of three kinds of education is necessary to their completeness” [30] (p. 108). Each kind of education, he stressed, determines the success of the other two.
Abraham Maslow described the 13 characteristics of a self-actualized individual as follows:
  • Superior perception of reality
  • Increased acceptance of self, others, and of nature
  • Increased spontaneity
  • Increase in problem-centering
  • Increased detachment and desire for privacy
  • Increased autonomy and resistance to enculturation
  • Greater freshness of appreciation, and richness of emotional reaction
  • Higher frequency of peak experiences
  • Increased identification with the human species
  • Changed (the clinician would say improved) interpersonal relations
  • More democratic character structure
  • Greatly improved creativeness
  • Certain changes in the value system [31] (p. 24)
He noted these characteristics as a path to “a fuller knowledge of, and acceptance of, the person’s own intrinsic nature, as an unceasing trend toward unity, integration, or synergy within the person” [31] (p. 25).
Carl Rogers, a decade or so later, developed the “Qualities of the Person of Tomorrow,” which consisted of twelve characteristics of a highly functioning and balanced individual—a list clearly reminiscent of Maslow’s and characterized by “a world in which the mind, in its larger sense, is both aware of, and creates, the new reality” [32] (p. 352). These are as follows:
  • Openness
  • Desire for authenticity
  • Skepticism regarding science and technology
  • Desire for wholeness
  • The wish for intimacy
  • Process persona
  • Caring
  • Attitude toward Nature
  • Anti-institutional
  • The authority within
  • The unimportance of material things
  • A yearning for the spiritual
Capra offered his systems view of personality as “based on awareness of the essential interrelatedness and interdependence of all phenomena—physical, biological, psychological, social, and cultural” [33] (p. 265). In addition, Capra noted that “systems thinking is process thinking, form becomes associated with interaction, interrelation with interaction…” [33] (p. 267). Csikszentmihalyi took a similar interactive approach and reflects on the complexity of consciousness, stating that knowledge or intelligence need be in harmony with feelings and actions—“to create harmony between goals and desires, sensations and experiences” [34] (p. 207).
Engineers Adams and Petroski, as well, employ a systems approach to their work on thinking, problem solving, and engineering design [35,36,37]. Adams employed a systems approach to the development and use of thinking skills throughout his philosophy and conceptual approach to problem and idea generation [35] and creativity [36]. Petroski revolutionized engineering design failure assessment through an approach that systematizes the process of inspection and evaluation of existing design as well as the development of new designs that include addressing and assessing human, social, and environmental factors [37].
Some writers, like Thoresen, delineate a sustainable personality, what she considers responsible citizenship, from the perspective of “empathy, relationships, critical skills, co-operation, self-awareness, equality, feeling concerned” [38] (p. 8)—individual attributes that would increase our chances of survival. She grouped over two dozen human behaviors and values into three general areas: “Biological Determinants, Social Expectations, and Moral Imperatives” [38].
Encouraging curriculum change in higher education to foster individual sustainability, Kagawa suggested problem solving skills, creative and critical thinking, and self-reflection as necessary components to encourage sustainable development and points out “And what kind of development do we want to sustain: social, cultural, political, spiritual and/or economic? (And are these separable?)” [12] (p. 325).
Education for sustainability should foster “learning new attitudes, perspectives, and values that guide and impel people to live their lives in a more sustainable way” [39] (p. 63). Factors such as feeling, simplicity, quietness, identity, justice, and a culture of peace characterize sustainable societies noted Gadotti, who further encouraged political and social revolution based on an “anthropocentric and individualistic view of humanity’s well-being” [39] (p. 96). Stone’s approach to curricular change includes instruction in “cognitive, emotional, active, and connectional” [40] (p. 44) topics, similar to integrating approaches to personality in Goleman, Barlow, & Bennett [41]. Employing a similar structural format, Lowenstein, Martusewicz, and Voelker (2010) focused on a social approach related to the discourses that shape our modern industrial cultures [42].
To be truly educated is to have the ability to educate one’s self as well as engage in intentional growth. Higher education has, for generations, largely ignored instruction in intentional self-development, despite its essential role in human prosperity and growth [43,44]. While we find some instruction related to individual behavior in social sciences and professional development instruction across the curriculum, few, if any, instruction focuses on self-directed growth. Our approach to Individual Sustainability recognizes that human growth is a result of change and balance across emotional, social, physical, intellectual, and philosophical contexts.

2. Materials and Methods

This project involved three studies deployed sequentially; Studies 2 and 3 used nearly identical methods, which were a slight variation of the first study. For each study, undergraduate engineering students responded to statements related to Individual Sustainability (or Sustainable Personality) using the Qualtrics survey system, and then reflected on their responses on the whole. The research was approved by the University’s Institutional Review Board, and only data of students who provided consent were included in these studies. The original Individual Sustainability survey (see the first column in Table 1) was designed for a general adult population [16] with the intent to bring intentional self-development and personality change into the university. Three early versions of the survey were first used on the personality multi-source feedback site Personality Pad (https://www.personalitypad.org/). The development of these original 50-item surveys was modeled after the styles of psychological surveys attempting to assess a broad array of factors that lead to the development of an individual’s personality, including the Big Five personality framework [26]. Most specifically, the work of Maslow, Dewey, Rogers, and Capra (among others) were employed in developing items, and the survey was further vetted by a variety of academicians, psychiatrists, and psychologists as well as through anecdotal studies in the classroom. Through this vetting process and exploratory studies, the Individual Sustainability contexts used for instrument development evolved from the theorized definitions presented earlier in this paper. The initial instrument used for formal studies consisted of 50 items across 5 contexts: Economic, social, intellectual, emotional, and health. The formal studies led to acceptable reliability indicators [17], with the caveat that this instrument was intended to initiate cognitive changes and motivate intentional development activities rather than to achieve reliable estimates of sustainability knowledge or attitudes. Since the first testing of the survey in early 2010, over 1500 individuals (mostly students) have taken the survey in research studies and online (PersonalityPad.org). Several versions of the survey are currently in use, including the versions that will be presented in Studies 2 and 3. The first study presented in this paper (Study 1) used the original 50-item survey with a population of solely engineering students. The survey instrument changed from study to study as items were removed, modified, or split based on the results of factor analysis (see Table 1).
For all studies in this paper, students responded to two versions of the survey—Real and Ideal. First, in the Real part, students were asked to respond to statements about themselves (e.g., “I am a person who is comfortable with close personal relationships”). In the Ideal portion of the survey, identical statements were used; however, each statement began with “Ideally” (e.g., “Ideally, I am a person who is comfortable with close personal relationships”). Students were given instructions for the Ideal part that pointed out the different expectation. For the first study, students were asked to consider their “ideal self” or how they would like to be ideally. For Studies 2 and 3, students were asked to think of the “ideal engineer” when responding to these statements. In all cases, students were shown a statement and asked to select the point on the scale that indicated the extent to which he/she agreed or disagreed with that statement. Responses were on a 7-point Likert scale ranging from Strongly Disagree to Strongly Agree.
Table 2 summarizes differences across the three studies and the participants for each study. The following sections describe each study and its results.
Following the Sustainable Personality Survey, students were directed to reflect upon their responses in a post-survey question or reflection assignment. Depending on the study, students responded to one of the following prompts:
  • Comparing your real and ideal survey results, identify one area you would like to improve and develop a plan for change.
  • Consider your responses for the characteristics that an ideal professional engineer should possess. Discuss one area you’d like to improve on as you work toward becoming a professional engineer.
This paper only reports on the quantitative aspects of the studies from students’ responses to the Likert-style survey questions for both Real and Ideal. The qualitative results are being analyzed in-depth and will be reported in future publications that compare responses to different types of reflection prompts and triangulate quantitative and qualitative results. Preliminary qualitative analysis of Study 1’s results revealed that most junior engineering students in the test sample identified one or more areas of dissonance from their responses to the Real Self and Ideal Engineer surveys, and developed an appropriate change plan for the remaining five to six weeks of the semester. Using the dissonance between real and ideal self to identify opportunities for change and motivate personal/professional development has been an effective practice with other student populations across multiple studies (e.g., Reference [45]).
Study students were awarded a small amount of course credit (equal to a homework assignment) for simply completing the study, regardless of their involvement in the study or quality of their participation. In general, students seemed interested in the study since the focus was on personal or professional development. For this reason, we consider students’ responses and narrative essays mostly authentic. The study was conducted with no class discussion about the survey, apart from clarifying instructions. All students opted into having their responses included in the research project by completing a consent form. Receiving completion credit was in no way contingent on opting into the research; and the processing of consent forms and data analysis was conducted by a researcher with no connection to any of the classes.
While the instrument and its application in this study is novel, our methodology is not new to engineering research, as a similar approach was used in Nagel et al. (2014) to assess engineering students’ group behaviors [46]. Others have researched what constitutes valuable skills in engineering, focusing on personality research [47] and the connection between personality and productivity, using a survey and interview methodology [48]. Stephens and colleagues suggested that engineering education be “based on the premise that sustainable behavior should start with oneself” [49] (p. 321).

3. Results

This section describes the specific method and results for each of the three validation studies.

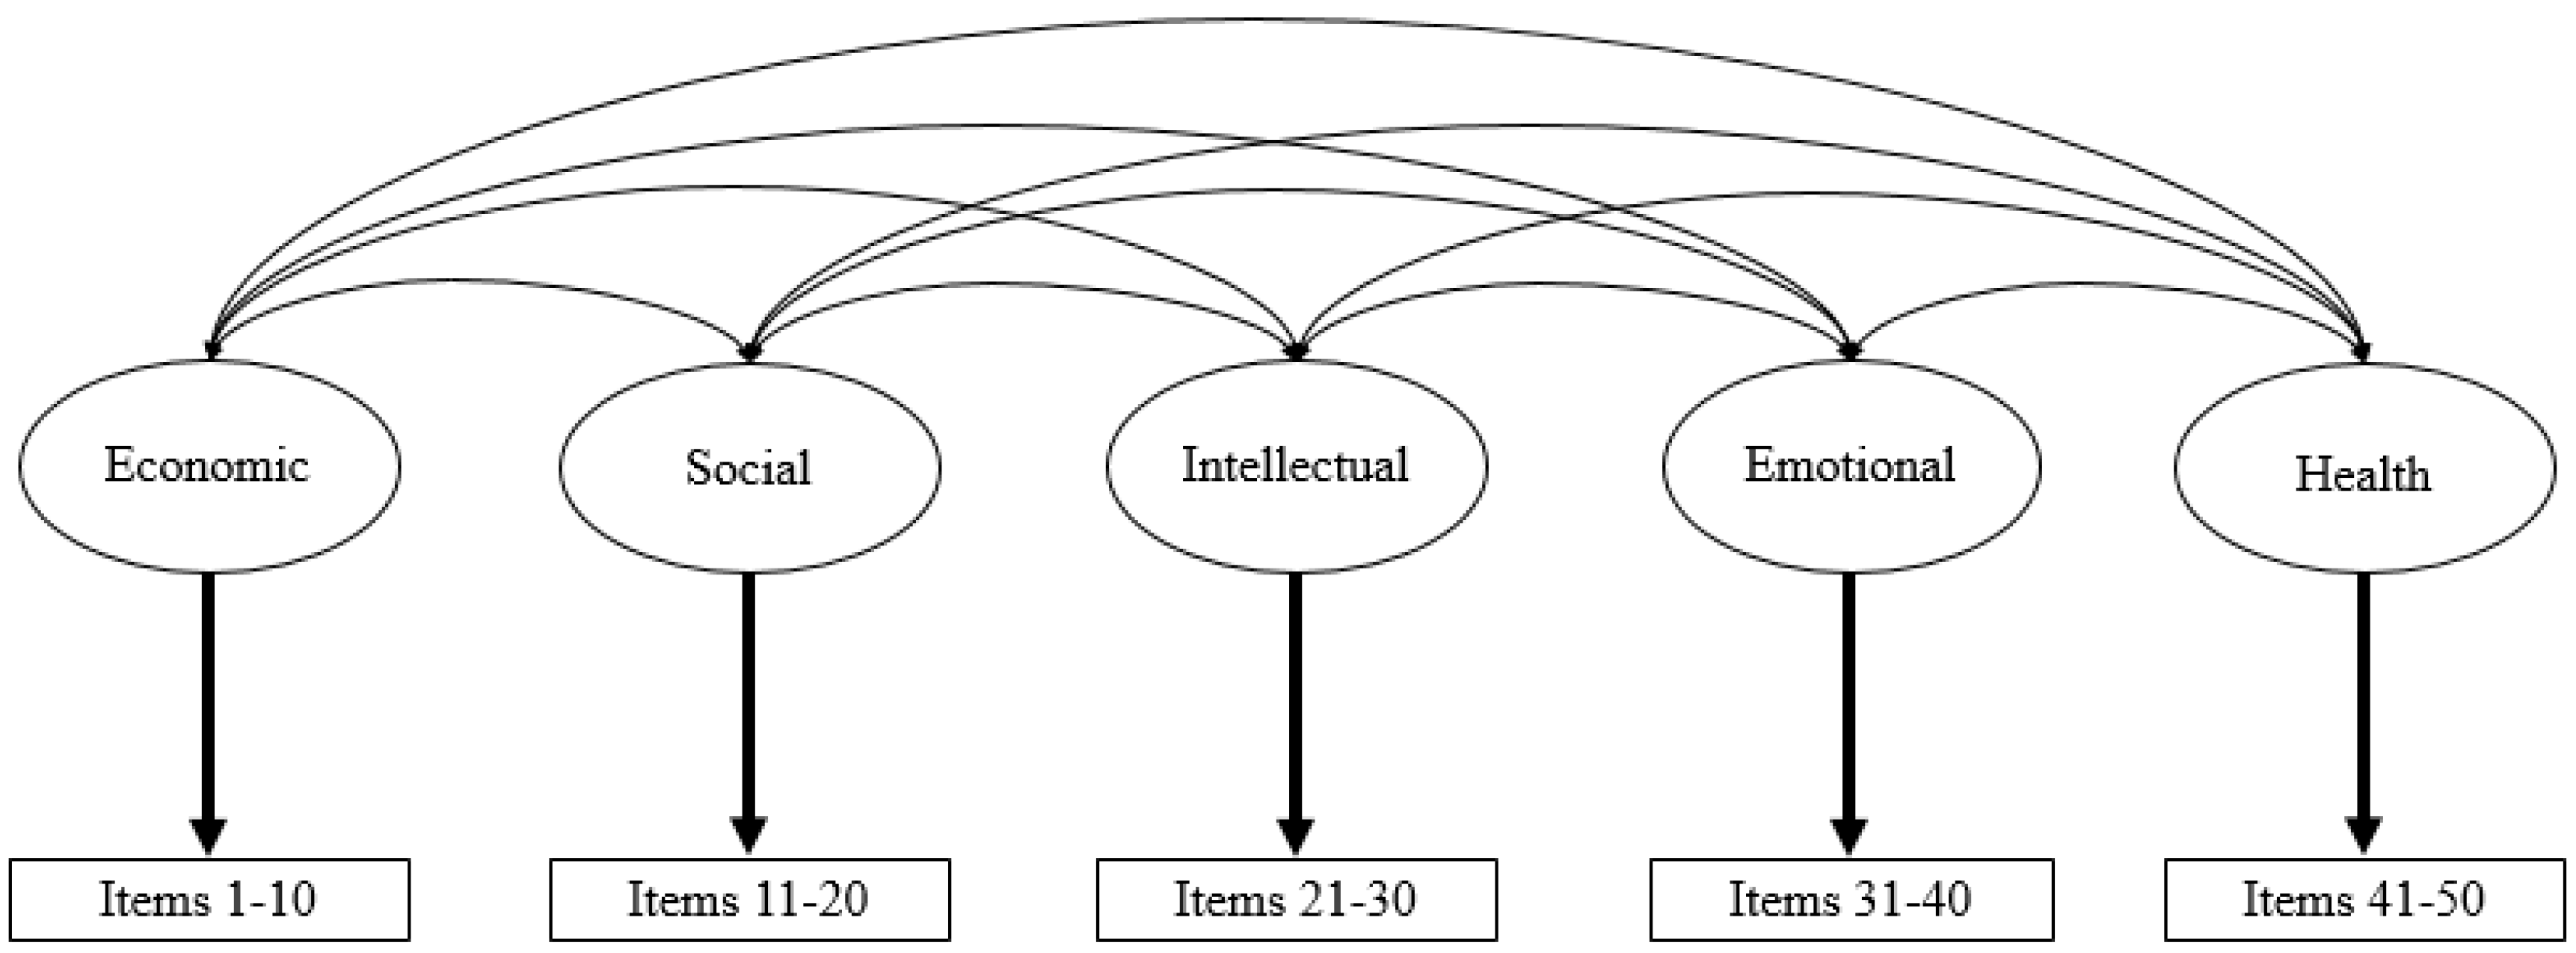
3.1. Study 1 Method and Results

Participants. We collected data on the Ideal and Real surveys from 96 junior-level engineering students at a mid-sized public university in the mid-Atlantic United States. The surveys were administered via an online survey delivery platform in the fall of 2014. The student population was approximately 18% female and 82% male. Students received completion credit in one of their engineering courses for completing the survey, but were given the option of choosing to not have their data included in the current study. Ultimately, 91 students completed both surveys and opted in to having their data included.
Analysis. Prior to conducting any analyses, we screened the data for outliers and assessed non-normality using Mardia’s test via the mardiaTest function in the MVN package [50] in R v3.2.2 [51]. The factor structure of the Individual Sustainability survey was evaluated in two stages. First, a confirmatory factor analysis (CFA) was performed to assess the fit of the hypothesized five-factor model (see Figure 1) to both the Ideal and Real survey data. A modified five-factor structure was also fit to the data that allowed two items (1 and 8) to cross-load on the intellectual factor. Although there were some missing data, the CFA model employed full-information maximum likelihood in the lavaan R package [52]. All missing data were assumed to be at least missing at random (MAR).
When evaluating model-data fit, better fit indicates that the model does well at explaining the relationships among the variables. More specifically, the model-implied variance-covariance structure is similar to the variance-covariance structure of the data. Several fit indices exist in CFA models, but four were used to inform this study: The chi-square test of model fit, the comparative fit index (CFI), the root mean square error of approximation (RMSEA), and the standardized root mean residual (SRMR). A large CFI and small RMSEA and SRMR values are indicative of good model-data fit. Although fit is continuous, cut-offs for these values have been suggested to be 0.95 or higher for CFI, 0.06 or smaller for RMSEA, and 0.08 or smaller for SRMR [53]. Relative fit was assessed via the chi-square difference test.
Due to the poor fit of these models (see Study 1 Results in Table 3), a second stage of the analysis was run. Exploratory factor analyses (EFA) were conducted to shed light on the unknown factor structure. A parallel analysis [54] was performed for each dataset separately. In a parallel analysis, the eigenvalues of the observed data are compared to several random matrices of the same size. In this comparison, eigenvalues that are greater than the mean of the simulated eigenvalues are indicative of potentially meaningful factors rather than random noise. The fa.parallel function in the psych package in R [55] was used to conduct the parallel analysis. The fa function in the psych package was then used to produce the suggested solution for each dataset. Maximum likelihood estimation was used to estimate the factor solution and an oblique rotation (promax) was specified to allow the factors to correlate.

3.1.1. Study 1 Results

See the supplementary material for means, standard deviations, skew, and kurtosis for each item. When screening the data for outliers, none were found.
Multivariate normality. According to the Mardia’s test of multivariate normality, neither the Ideal nor Real data were multivariate normal. As seen in the supplementary material, the skew of individual items on the Ideal survey ranged (in terms of absolute value) from 0.00 (item 1) to −2.61 (item 49); kurtosis ranged from −0.19 (item 34) to 7.49 (item 49). For the Real survey, skew ranged from 0.00 (item 1) to −1.37 (item 39), and kurtosis ranged from 0.00 (item 13) to 3.67 (item 4). As a result of the non-normality, the Satorra-Bentler correction was applied to adjust the model fit statistics [56]. These adjusted values are presented throughout.
Confirmatory factor analysis. CFA global model fit indices are presented in Table 3. Because RMSEA values may be inaccurate with sample sizes of less than 250 [57], we primarily focused on the SRMR and CFI. Both models resulted in poor fit to the data for both the Real and Ideal versions of the survey, suggesting that items within the same factor do not covary similarly within each survey. The modified five-factor model did fit better relative to the five-factor model for the Ideal and Real surveys, but this model still fit poorly in an absolute sense.
Exploratory factor analysis. Due to the poor fit of the five-factor model to the data, an exploratory factor analysis (EFA) was conducted to uncover the unknown factor structure. We also examined the scree plots to inform the decision about the number of factors to extract. The two separate parallel analyses and scree plots suggested four- and seven-factor solutions for the Ideal and Real data, respectively. The factor solutions based on the parallel analysis for each survey are found in the supplementary material. Loadings of 0.3 or above were considered meaningful and are bolded. Percent variance accounted for by the final model was 49.2% for the Ideal survey and 45.3% for the Real survey.
Economic factor. Items 1 and 5–10, designed to be part of the economic factor, hung together fairly cleanly for both the Ideal (Factor 3) and Real (Factor 1) surveys. Items 2–4, however, exhibited some cross-loading and, in the case of item 3, did not load at all for the Real survey, thus the decision was made to remove these items and retain the others.
Social factor. Items 11–20, designed as the social factor, hung together well on both the Ideal (Factor 1) and Real (Factor 5) surveys, with the exception of item 19—which cross-loaded on two other factors—and item 14, which cross-loaded on its intended factor and another factor in both surveys. Additionally, items 13 and 16 were removed because they overlapped conceptually with item 15. There was also some concern regarding “socially desirable” responding with these items; this means social norms dictate an expected “positive” behavior for those items and thus students would be unlikely to report a contrary behavior.
Intellectual factor. Items 21–30, designed to be the intellectual factor, hung together well for the Ideal survey (Factor 1), although there was some cross-loading for items 22, 27, 28 and 30. Additionally, although they loaded together on Factor 1, Factor 1 also consisted of the items designed to form the social factor. For the Real survey, items 21–26, 28 and 30 loaded primarily on Factor 6 (with item 25 cross-loading on Factor 7), but items 27 and 29 did not load on any factors for the Real survey. In contrast to the Ideal survey, the intellectual items did not load on the same factor as the social items for the Real survey. As a result, we decided to keep the two factors (social and intellectual) separate. We decided to remove items 27 and 29, given that they did not load on any factors for the Real survey. We also removed item 24 because of a concern for socially desirable responding, and 30 because it was similar to item 28. We split item 22 into two items because it was double-barreled (i.e., addressed two separate concepts).
Emotional factor. For the Ideal survey, items 31–40, designed as the emotional factor, primarily loaded on Factor 2, with the exception of items 37 and 38, which loaded on Factor 1. In the Real survey, these items loaded primarily on Factor 2 as well, with the exception of item 36 (Factor 7), 37 (Factor 3) and 39 (Factor 3). The decision was made to remove items 35, 36 and 38. Items 36 and 28 displayed some cross-loading. For item 35 (“I am a person who takes on the emotional state of others”), there was some concerns about item wording being confusing. We also edited item 39, which originally read “I am a person who frequently experiences significant stress in my life.” In order to make it more emotionally focused, we changed it slightly to read “I am a person who experiences emotional stress.”
Health factor. Items 41–43, 45–47 and 50, designed to be the health factor, loaded primarily on Factor 1 for the Ideal survey. This factor also contained many of the items designed as the social and intellectual factors. Items 44, 48 and 49—also designed as the health factor—loaded primarily on Factor 2. For the Real survey, none of the health items hung together in any meaningful way, but were rather distributed among Factors 2–5. Item 50 did not load at all for the Real survey, and was therefore removed. Items 46 and 49 were also removed because item 46 was triple-barreled, and neither item specifically focused on physical health. In an effort to clarify wording, items 41, 42, and 47 were edited slightly (see Table 1).

3.1.2. Study 1 Discussion

For the confirmatory factor analysis, our sample size of 91 was much smaller than the typically recommended 250 [57]. In fact, given the complexity of our model and the large number of items, a sample size even larger than 250 would be preferred. Such a small sample size can impact the stability of fit statistics as well as the accuracy of the Satorra-Bentler correction. As a result, the parameter estimates must be interpreted with extreme caution. Given that the CFA models exhibited poor fit, however, we deemed it appropriate to continue with exploratory factor analyses, to be followed up in a second study with a larger sample and additional CFAs.
The exploratory factor analysis did not result in particularly clean solutions for any of the factors. Additionally, for the Ideal survey, it appeared that the social and intellectual factors may work best if combined (though this was not the case for the Real survey). Based on the results of the EFA and an examination of item wording, the decision was made to retain the five-factor structure but remove 14 items for a revised 36-item scale (see Table 1). This 36-item scale was administered to a new, larger sample and the factor structure tested again in Study 2, as described next.

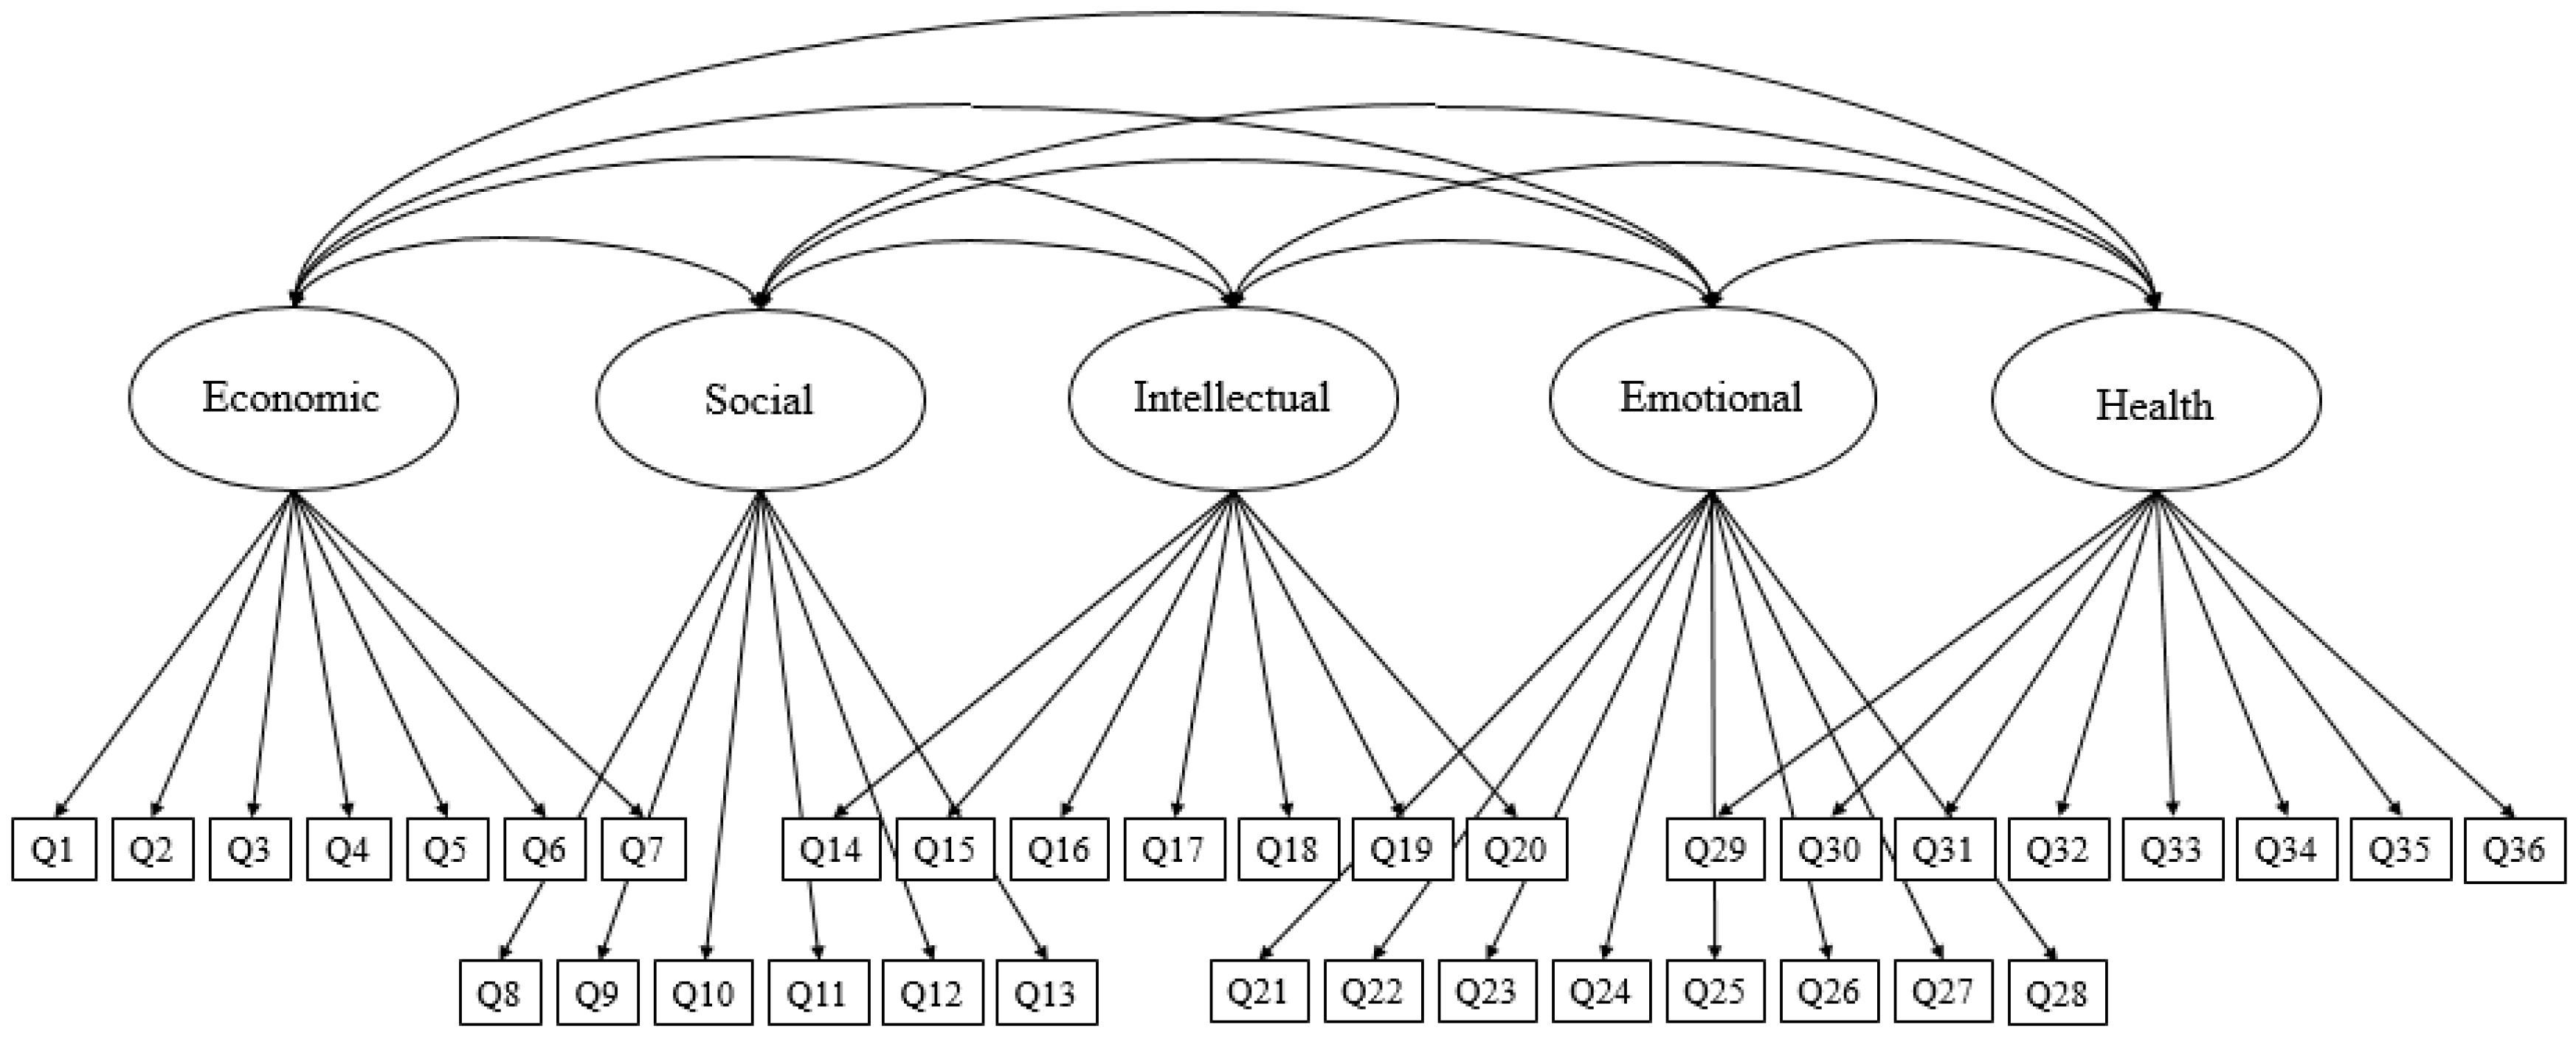
3.2. Study 2 Method and Results

Participants. For Study 2, both the Ideal and Real versions of the Individual Sustainability survey were administered to undergraduate engineering students in the fall of 2015. Participants were students from the same mid-sized public university in the mid-Atlantic United States as was used in Study 1. The Ideal and Real surveys were once again administered via an online survey delivery platform. Sophomore and junior students received completion credit in one of their engineering courses if they completed the survey; freshmen and senior students were sent the link and simply asked to participate. We received 246 complete responses for the Ideal survey, and 247 for the Real survey.
Analyses. To assess the factor structure of the scale, we ran a series of confirmatory and exploratory factor analyses. As before, we assessed multivariate non-normality using the mardia function [50] and examined the data for outliers, and all CFAs were conducted using the lavaan package [52] in R v3.2.2 [51]. We began by testing the theorized five-factor structure for the Ideal and Real surveys using a CFA model; in this model, all factors were allowed to correlate, and the item/factor relationships were specified as theorized (see Figure 2). Next, we tested a one-factor model in which all items loaded on a single factor to ensure that the construct we were measuring was not actually unidimensional. We assessed the fit of both models based on the RMSEA, CFI, and SRMR fit indices discussed for Study 1, as well as the chi-square difference test.
Due to a lack of fit for the tested CFA models (see Study 2 Results in Table 3), we subsequently ran a set of EFA to further examine the factor structure. As in Study 1, we conducted a parallel analysis [54] using the fa.parallel function in the R psych package [55] to determine the number of factors potentially existing in the Ideal and Real data. We also examined the scree plots to inform the decision about the number of factors to extract. We then used the fa function in the psych package to produce the suggested solution for each dataset. As before, maximum likelihood estimation was used to estimate the factor solution and an oblique rotation (promax) was specified to allow the factors to correlate.

3.2.1. Study 2 Results

See the supplementary material for means, standard deviations, skew, and kurtosis for each item. When screening the data for outliers, none were found.
Multivariate normality. Mardia’s test of multivariate normality indicated that data were not multivariate normal. As seen in the supplementary material, the skew of individual items on the Ideal survey ranged (in terms of absolute value) from 0.03 (item 6) to −2.01 (item 15); kurtosis ranged from −0.04 (item 20) to 6.98 (item 15). For the Real survey, skew ranged from 0.00 (item 32) to −1.49 (item 18), and kurtosis ranged from −0.05 (item 9) to 3.55 (item 18). Due to the lack of multivariate normality, the Satorra-Bentler correction was applied [56].
Confirmatory factor analysis. The original five-factor and one-factor models resulted in poor fit to the data (see Table 3). For each model, the Ideal version of the survey fit slightly better than the Real. In terms of relative model fit, the one-factor fit statistically significantly worse than the five-factor for both the Real and Ideal surveys.
Exploratory factor analysis. Due to the lack of ideal fit of these models, we also ran EFA to further examine the factor structure. The parallel analyses and scree plots suggested five-factor solutions for both the Ideal and Real data. The factor solutions based on the parallel analysis can be seen in the supplementary material.
As in Study 1, loadings of 0.3 or above were considered meaningful. Given this criteria, there were two distinct factors for the Ideal and Real surveys. By and large, items 1–7—designed as the economic subscale—hung together (Factor 2); this was particularly clear for the Real survey. Additionally, items 8–20—designed as the social (items 8–13) and intellectual (items 14–20) subscales —hung together fairly cleanly (Factor 1). Items 21–28—designed as the emotional subscale—were split between Factor 1 and Factor 3. In both the Ideal and Real surveys, items 21–24, 26 and 28 hung together on Factor 3, but items 25 and 27 loaded primarily on Factor 1. Finally, items 29–36—designed as the health subscale—did not hang together in any meaningful way.
Several individual items appeared to be behaving poorly. Items 5 and 33 loaded on their own two-item factor for the Ideal survey, although item 5 loaded acceptably on its intended factor for the Real survey. Item 33 loaded fairly low on all factors for the Real survey. In addition to items 5 and 33, item 11 did not load on any factor in the Ideal survey, and had a fairly low loading for the Real survey. As a result, the decision was made to remove items 5 and 33. However, item 11 (“I am a person who chooses to interact directly with other people rather than socialize via electronic devices.”) was retained because we were interested in examining demographic differences across age groups. This item was also retained because of the larger dissonance aim of the survey, as discussed briefly in the literature review.
After removing items 5 and 33, we ran an EFA on the data once more. Parallel analysis suggested extracting five factors for both the Ideal and Real surveys. As can be seen from the supplementary material, in the case of the Real survey, the fifth factor appeared to primarily be a result of cross-loading for items primarily loading on other factors; additionally, only 3 items loaded without strong cross-loading on this factor. Because of this, and because we wanted to prioritize the Real survey in the determination of a factor solution, a four-factor solution was also extracted. This solution resulted in much cleaner loadings for the Real survey, although the loadings for items 8 and 9 were lower in the four-factor solution than they were in the five-factor solution, and item 1 did not load strongly on any factors for the Real survey (see Table 4). The four-factor solution was fairly clean for the Ideal survey as well, and the pattern of loadings largely mirrored that of the Real survey. As a result, we decided to move forward with the four-factor solution (see the column labeled “Factor (Study 3)” in Table 1 for the final solution). For the Ideal survey, the four factors together accounted for 41.3% of the variance; for the Real survey, they accounted for 39%.

3.2.2. Study 2 Discussion

As mentioned in the discussion for Study 1, given the complexity of our model and the large number of items, our sample size of 246 and 247 for Study 2 is still likely not large enough to produce stable parameter estimates. Given the small sample size, the presented results should be interpreted with care. However, the small size of the engineering department at the university of study makes a larger n extremely difficult to achieve. Thus, we proceeded cautiously with an interpretation of the results.
Although the survey from Study 1 was edited based on the EFA results, the hypothesized five-factor model still did not fit well in Study 2. Based on the CFA results for Study 2, the hypothesized five-factor model still did not fit the data well in an absolute sense. The one-factor model also fit poorly, though, lending support to the idea that the construct of Individual Sustainability is in fact multidimensional. This idea was further borne out by the subsequent EFAs, which suggested multiple factors for both the Real and Ideal surveys.
The careful observer will note that for the four-factor solution we championed based on the EFA, Factors 1 and 3 are composed entirely of negatively worded items and Factors 2 and 4 are composed primarily of positively worded items. This begs the question of whether the factor solution represents wording effects rather than meaningful constructs. Note, however, in Table S4, that there is virtually no cross-loading of items across Factors 1 and 3 or 2 and 4, suggesting that what separates these factors is more than a simple wording effect. It was our hope that testing out this new four-factor structure using a CFA on a new sample would further bear this out. To that end, we conducted a third study, described next.

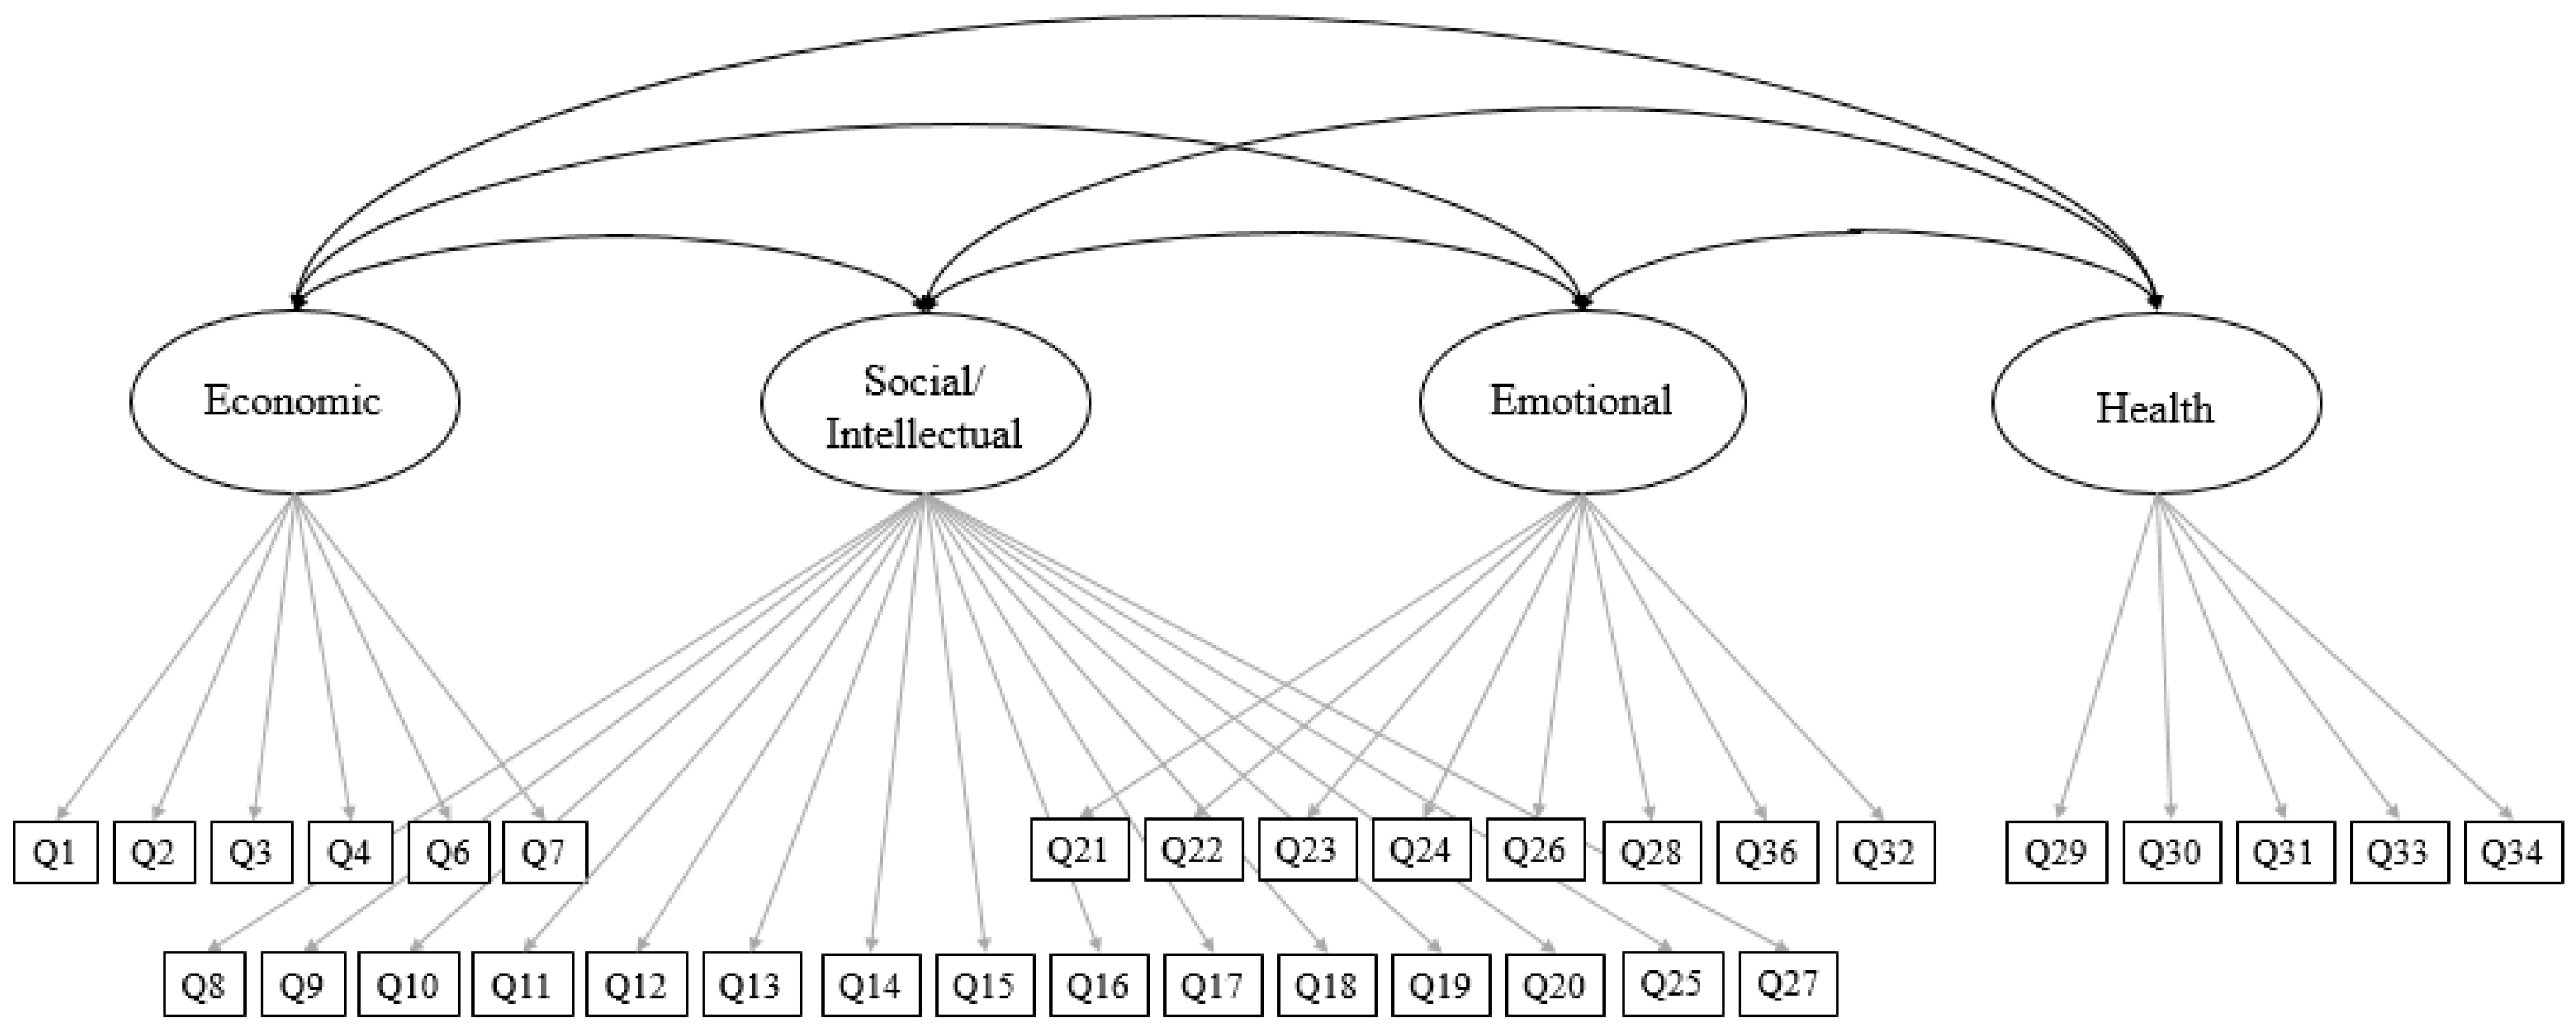
3.3. Study 3 Method and Results

Participants. For study 3, we administered the revised version of the survey (i.e., the version without items 5 and 33; see Table 1) to engineering students at four different universities on the East Coast of the United States in Fall Semester 2016. We also administered the survey at one of the same universities in Spring Semester 2016. In total, 267 students completed all items on the Ideal survey, and 275 students complete the Real version of the survey.
Analysis. For study 3, we ran several confirmatory factor analysis models. As before, we assessed multivariate non-normality using the mardia function [50] and examined the data for outliers, and all CFAs were conducted using the lavaan package [52] in R v3.2.2 [51]. We began by testing the same theorized five-factor structure for the Ideal and Real surveys using a CFA model (see Figure 2). Next, we tested a one-factor model in which all items loaded on a single factor. Finally, we tested the new four-factor model from study 2 (see Figure 3). In this model, all factors were allowed to correlate. We assessed the fit of the models based on the RMSEA, CFI, and SRMR fit indices discussed for Study 1, in addition to the chi-square difference test.

3.3.1. Results

Multivariate normality. Mardia’s test of multivariate normality indicated that data were not multivariate normal. As seen in Table 5, the skew of individual items on the Ideal survey ranged (in terms of absolute value) from 0.02 (item 31) to −1.61 (item 14); kurtosis ranged from −1.36 (item 29) to 6.00 (item 14). For the Ideal survey, skew ranged from −0.04 (item 5) to −2.24 (item 14), and kurtosis ranged from −0.05 (item 9) to 3.55 (item 18). Due to the lack of multivariate normality, the Satorra-Bentler correction was applied [56].
Confirmatory factor analysis. See Table 3 for fit information from the study 3 CFA. The new four-factor model fit the data best out of all the models. The RMSEA and SRMR values were acceptable for the four-factor model in both the Real and Ideal surveys, though the SRMR was slightly high for the Real survey. The CFI was low for both surveys; however, this is unsurprising given the low inter-item correlations. Specifically, the CFI compares the observed correlations to those from an independence, or null, model. If the observed correlations are low, they will not look much “better” in comparison to the independence model’s correlations. This likely explains the low CFI values seen here, as the typical correlation among any two items—even within a subscale—was only around 0.3. As a result, we chose to champion the new four-factor model.

3.3.2. Study 3 Discussion

Based on the confirmatory factor analysis described here, the new four-factor model fit acceptably, and certainly fit the best out of all the models tested throughout this study. The low inter-item correlations do, however, pose a concern from a statistical and theoretical viewpoint, as they indicate that even items written to be on the same subscale are not very highly related to one another. The reasons for this are unclear, but future research on the theoretical structure of the construct of Individual Sustainability may shed light on this issue.
The championed model was based on a sample of students from several different schools, versus students all from the same school as was the case in studies 1 and 2. This provides support for the generalizability of the factor structure, but as always more work is needed. The scale should be administered to additional samples of students from other schools and CFAs conducted on data from these samples as well. If this factor structure holds across different samples and time points, a stronger argument can be made for its validity.

4. Discussion

Based on the results of the three studies, Individual Sustainability (as applicable for undergraduate engineering students) can be described and measured using four constructs of values and behaviors: (1) Economic, (2) social/intellectual, (3) emotional, and (4) health. The model was originally theorized to contain 50 items across five constructs. However, iterations of instrument deployment to different engineering student populations, confirmatory and exploratory factor analysis, and deliberations over theoretical underpinnings for individual items resulted in the current form with 34 items and a four-factor model.

4.1. Evolution of the Subscales

The economic subscale was unique in that it held together throughout our studies, although individual items were removed at each phase, resulting in a cleaner model overall. The most obvious difference between the original theorized model and the current version of the instrument (see Table 1) is the combination of the social and intellectual subscales. We can argue that social and intellectual items capture two dimensions of the same construct; the former is outward looking (i.e., outside the self) and the latter is inward looking (i.e., self and introspection). When combined, the social/intellectual items reflect relationships with self and others.
A subtler difference between the original and revised instrument is refinement of the emotional and health subscales. Structurally, emotional and health appear in both the original and revised instruments; however, our conceptualizations of these subscales did shift as a result of EFA and CFA and ensuing deliberations over specific items. In summary, the distinction between the emotional and health subscales is that health refers specifically to physical attributes and behaviors whereas the emotional subscale captures feelings, emotions, and mental health. Further, items in the health subscale exhibit a more active, behavioral orientation whereas the emotional items are more passive. An interesting example of this shift is “stress” which appeared in both subscales originally. In the final version, the explicit stress items hung together in emotional because the source of “stress” is often emotional but can result in physical reactions or effects (like difficulty sleeping or adopting unhealthy eating and drinking behaviors) that belonged in the health subscale. Stress culture is a predominant concern in both engineering education and the engineering profession [58,59] and thus it is not surprising that multiple items related to stress were retained throughout the instrument’s evolution and received relatively high agreement scores across iterations of the survey (see tables of descriptive statistics).
From a statistical standpoint, the final factor structure from Study 3 is not clean. However, in repeated tests using different contexts, the four-factor structure performed somewhat consistently. The four-factor model is further supported by the theoretical and practical foundations of Individual Sustainability. Low correlations may suggest that there are really more than four or five subscales that make up Individual Sustainability (although early tests of a seven-factor model did not perform well) or that individual variability of participants may continue to affect model fit regardless of the number of new constructs added or number of factors being tested.

4.2. Importance of Research Results

Why is this instrument, in its current form, valuable to other faculty or researchers? The construct of Individual Sustainability [16], is a novel framework with both theoretical and practical significance for engineering educators and educators more broadly. Individual Sustainability is not a definitive end-point; rather, the process of seeking harmony and balance in oneself and in relationship with the world requires monitoring/reflection, intentional change and self-development. Throughout our studies, responses to the “Ideal” version of the survey resulted in better model fit than results from the “Real” version. This is a logical result, given that students working toward the same professional degree will more closely share a vision of an “ideal engineer” than demonstrate the same “real” values and behaviors. Some level of variability across participants is to be expected and should also be embraced in the interest of supporting a diverse engineering workforce and promoting professional development. A primary purpose of this project is to develop instruments that lead to reflection and self-directed change that can be sustained. Thus, internal inconsistencies and individual variability among engineering students are an important consideration when validating a generalized model of Individual Sustainability.

4.3. Limitations and Future Work

An important limitation of our validation efforts was the small sample sizes, particularly for Study 1. Future work should focus on exploring new factor structures and testing invariances using larger sample sizes. To assist with future validation efforts, the 34-item Individual Sustainability instrument has been deployed via the online platform Personality Pad, described earlier, which allows individuals to self-assess and solicit 360-degree feedback from friends, family, co-workers, etc. on how closely that individual’s Real and Ideal selves match. As individuals test the instrument using Personality Pad or other faculty deploy the instrument in their classes, we can complete additional statistical testing using larger and more diverse student samples, which may lead to better model fit. Another likely outcome is that samples of different majors or professions would result in slightly different subscales as conceptualizations of what an “ideal professional” embodies can differ across disciplines.

5. Conclusions

As our completed studies and on-going analysis demonstrate, engineering student responses to a 34-item survey measuring Individual Sustainability resulted in statistically different ratings in Real vs. Ideal for some items, with more variability across participants for the “Real” version. Statistically speaking, the Individual Sustainability instrument achieved stability across different engineering student populations with a four-factor structure, although additional validation is needed. Practically speaking, the instrument in its current form is an effective way to identify dissonance between one’s Real and Ideal conceptualizations of self and thus help individual engineering students identify opportunities for personal change and professional growth. We encourage other researchers to test the constructs of Individual Sustainability with different student or professional populations and share their findings with the community. We also encourage teachers and faculty to introduce the Individual Sustainability instrument to their students as a tool for self-reflection and intentional change.

Supplementary Materials

The following are available online at https://www.mdpi.com/2071-1050/10/8/2885/s1, Table S1: Item Descriptive Statistics: Study 1, Table S2: Individual Sustainability Survey EFA Solutions: Study 1, Table S3: Item Descriptive Statistics: Study 2, Table S4: Individual Sustainability Survey EFA Solutions: Study 2, and Table S5: Individual Sustainability Survey 5-Factor EFA Solutions without Items 5 and 33: Study 2.

Author Contributions

Conceptualization, E.B., E.P. and R.N.; Formal analysis, E.B. and E.P.S.; Funding acquisition, E.P.; Methodology, E.B. and E.P.S.; Writing—original draft, E.B., E.P.S. and E.P.; Writing—review & editing, E.B., E.P.S., E.P. and R.N.

Funding

This research was funded by the National Science Foundation under Grants IEECI #0933948 and EEC #1158728. Any opinions, findings, and conclusions or recommendations expressed in this material are those of the authors and do not necessarily reflect the views of the National Science Foundation.

Conflicts of Interest

The authors declare no conflict of interest. The funding sponsors had no role in the design of the study; in the collection, analyses, or interpretation of data; in the writing of the manuscript, and in the decision to publish the results.

References

  1. Counsell, D. Sustainable development and structure plans in England and Wales: Operationalizing the themes and principles. J. Environ. Plan. Manag. 1999, 42, 45–61. [Google Scholar] [CrossRef]
  2. Selman, P. Local Sustainability: Managing and Planning Ecologically Sound Places; Sage: London, UK, 1996. [Google Scholar]
  3. Giddings, B.; Hopwood, B.; O’Brien, G. Environment, economy and society: Fitting them together into sustainable development. Sustain. Dev. 2002, 10, 187–196. [Google Scholar] [CrossRef]
  4. Strezov, V.; Evans, A.; Evans, T.J. Assessment of the Economic, Social and Environmental Dimensions of the Indicators for Sustainable Development. Sustain. Dev. 2017, 25, 242–253. [Google Scholar] [CrossRef]
  5. Marshall, J.; Toffel, M. Framing the elusive concept of sustainability: A sustainability hierarchy. Environ. Sci. Technol. 2004, 39, 673–682. [Google Scholar] [CrossRef]
  6. McDonough, W.; Braungart, M. Design for the Triple Top Line. Corp. Environ. Strategy 2002, 9, 251–258. [Google Scholar] [CrossRef]
  7. Parkin, S.; Sommer, F.; Uren, S. Sustainable development: Understanding the concept and practical challenge. Proc. Inst. Civ. Eng. Eng. Sustain. 2003, 156, 19–26. [Google Scholar]
  8. Harris, J.M. Basic Principles of Sustainable Development; Tufts University: Global Development and Environment Institute: Medford, MA, USA, 2000. [Google Scholar]
  9. Lozano, R.; Merrill, M.Y.; Sammalisto, K.; Ceulemans, K.; Lozano, F.J. Connecting competences and pedagogical approaches for sustainable development in higher education: A literature review and framework proposal. Sustainability 2017, 9, 1889. [Google Scholar] [CrossRef]
  10. Watson, M.K.; Barrella, E. A systematic review of sustainability assessments in ASEE proceedings. In Proceedings of the 2017 ASEE Annual Conference and Exposition, Columbus, OI, USA, 25–28 June 2017. [Google Scholar]
  11. Barth, M.; Timm, J. Higher education for sustainable development: Students’ perspectives on an innovative approach to educational change. J. Soc. Sci. 2011, 7, 13–23. [Google Scholar] [CrossRef]
  12. Kagawa, F. Dissonance in students’ perceptions of sustainable development and sustainability: Implications for curriculum change. Int. J. Sustain. High. Educ. 2007, 8, 317–338. [Google Scholar] [CrossRef]
  13. Tuncer, G. University students’ perception on sustainable development: A case study from Turkey. Int. Res. Geogr. Environ. Educ. 2008, 17, 212–226. [Google Scholar] [CrossRef]
  14. Crespo, B.; Míguez-Álvarez, C.; Arce, M.E.; Cuevas, M.; Míguez, J.L. The sustainable development goals: An experience on higher education. Sustainability 2017, 9, 1353. [Google Scholar] [CrossRef]
  15. Watson, M.K.; Barrella, E. Using concept maps to explore the impacts of a learning-cycle-based sustainability module implemented in two institutional contexts. J. Prof. Issues Eng. Educ. Pract. 2016, 143, D4016001. [Google Scholar] [CrossRef]
  16. Pappas, E.; Pappas, J.; Sweeney, D. Walking the walk: Conceptual foundations of the sustainable personality. J. Clean. Prod. 2014, 86, 323–334. [Google Scholar] [CrossRef]
  17. Pappas, J.; Pappas, E. The sustainable personality: Values and behaviors in individual sustainability. Int. J. High. Educ. 2015, 4, 12–21. [Google Scholar] [CrossRef]
  18. Pappas, E. Radical premises in sustainability reform. J. Sustain. Educ. 2013, 4. Available online: http://www.susted.com/wordpress/content/radical-premises-in-sustainability-reform_2013_02/ (accessed on 13 August 2018).
  19. Leiserowitz, A.; Kates, R.; Parris, T. Sustainability values, attitudes, and behavior: A review of multinational and global trends. Annu. Rev. Environ. Resour. 2006, 31, 413–444. [Google Scholar] [CrossRef]
  20. Shields, D.; Solar, S.; Martin, W. The role of values and objectives in communicating indicators of sustainability. Ecol. Indic. 2010, 2, 149–160. [Google Scholar] [CrossRef]
  21. Haws, D. Ethics instruction in engineering education: A (Mini) meta-analysis. J. Eng. Educ. 2001, 90, 223–229. [Google Scholar] [CrossRef]
  22. Huff, J.; Jesiek, B.; Oakes, W.; Zoltowski, C.; Ramane, K.; Graziano, W. Tensions of integration in professional formation: Investigating development of engineering students’ social and technical perceptions. In Proceedings of the 2015 ASEE Annual Conference & Exposition, Seattle, WA, USA, 14–17 June 2015. [Google Scholar]
  23. Stoup, K.; Pierrakos, O. Engineering students’ self-concept differentiation: Investigation of identity, personality, and authenticity with implications for program retention. In Proceedings of the 2016 ASEE Annual Conference and Exposition, New Orleans, LA, USA, 26–29 June 2016. [Google Scholar]
  24. Bandura, A. Self-efficacy: Toward a unifying theory of behavioral change. Psychol. Rev. 1977, 84, 191–215. [Google Scholar] [CrossRef] [PubMed]
  25. Pajares, F. Self-efficacy beliefs in academic settings. Rev. Educ. Res. 1996, 66, 543–578. [Google Scholar] [CrossRef]
  26. Digman, J.M. Personality structure: Emergence of the five-factor model. Annu. Rev. Psychol. 1990, 41, 417–440. [Google Scholar] [CrossRef]
  27. Russell, B. The Analysis of Mind; Dover Publications: New York, NY, USA, 2005; p. 139. [Google Scholar]
  28. Hegel, G.W.F. Lectures on the History of Philosophy; Haldane, E.S., Transl.; Oxford University Press: Oxford, UK, 1892; Available online: http://www.marxists.org/reference/archive/hegel/works/hp/hpconten.htm (accessed on 11 January 2013).
  29. James, W. The Principles of Psychology; Dover Publications: New York, NY, USA, 1950; Volume 1, p. 292. [Google Scholar]
  30. Dewey, J. The Influence of Darwin on Philosophy; Prometheus Books: New York, NY, USA, 1997; pp. 244–257. [Google Scholar]
  31. Maslow, A. Toward a Psychology of Being; Van Nostrand Company: New York, NY, USA, 1968. [Google Scholar]
  32. Rogers, C.A. A Way of Being; Houghton-Mifflin Company: New York, NY, USA, 1980. [Google Scholar]
  33. Capra, F. The Turning Point; Bantam Books: New York, NY, USA, 1982; pp. 265–267. [Google Scholar]
  34. Csikszentmihalyi, M. The Evolving Self; Harper Collins: New York, NY, USA, 1993; p. 207. [Google Scholar]
  35. Adams, J.L. Conceptual Blockbusting: A Guide to Better Ideas; Basic Books: New York, NY, USA, 1974. [Google Scholar]
  36. Adams, J.L. The Care and Feeding of Ideas: A Guide to Encouraging Creativity; Addison Wesley: Boston, MA, USA, 1986. [Google Scholar]
  37. Petroski, H. To Engineer Is Human: The Role of Failure in Successful Design; Vintage Books: New York, NY, USA, 1992. [Google Scholar]
  38. Thoresen, V.W. Cultivating sustainable lifestyles. In Proceedings of the UNESCO, IEF Conference, Thessaloniki, Greece, 15–17 October 2004. [Google Scholar]
  39. Gadotti, G. Education for Sustainability: A Contribution to the Decade of Education for Sustainable Development; Instituto Paulo Freire: Sao Paulo, Brazil, 2009. [Google Scholar]
  40. Stone, M.A. Schooling for sustainability framework. Teach. Educ. Q. 2010, 37, 33–46. [Google Scholar]
  41. Goleman, D.; Barlow, Z.; Bennett, L. Forging new norms in New Orleans: From emotional to ecological intelligence. Teach. Educ. Q. 2010, 37, 87–98. [Google Scholar]
  42. Lowenstein, E.; Martusewicz, R.; Voelker, L. Developing teacher’s capacity for Eco-justice education and community-based learning. Teach. Educ. Q. 2010, 37, 99–118. [Google Scholar]
  43. Baumeister, R.; Heatherton, T.; Tice, D. Losing Control: How and Why People Fail at Self-Regulation; Academic Press: San Diego, CA, USA, 1994. [Google Scholar]
  44. Dembo, M.; Eaton, M. Self-regulation of academic learning in middle-level schools. Elem. Sch. J. 2000, 100, 473–490. [Google Scholar] [CrossRef]
  45. Pappas, E.; Lynch, R.; Pappas, J.; Chamberlin, M. Fast change: Immersive self-development strategies for everyday life. J. Adv. Educ. Res. 2018, in press. [Google Scholar] [CrossRef]
  46. Nagel, R.; Pappas, E.; Swain, M.; Hazard, G. Exploration of engineering students’ values with respect to behaviors in group work. Int. J. High. Educ. 2014, 4, 181–197. [Google Scholar] [CrossRef]
  47. Saravanan, V. Sustainable employability skills for engineering professionals. Indian Rev. World Lit. Eng. 2009, 5, 1–9. [Google Scholar]
  48. Carr, P.; de la Garza, J.; Vorster, M. Relationship between personality traits and performance for engineering and architectural professionals providing design services. J. Manag. Eng. 2002, 18, 158–166. [Google Scholar] [CrossRef]
  49. Stephens, J.; Heranandez, M.; Roman, M.; Graham, A.; Scholz, R. Higher education as a change agent for sustainability in different cultures and contexts. Int. J. Sustain. High. Educ. 2000, 9, 317–338. [Google Scholar] [CrossRef]
  50. Korkmaz, S.; Goksuluk, D.; Zararsiz, G. MVN: An R package for assessing multivariate normality. R J. 2014, 6, 151–162. [Google Scholar]
  51. R Core Team. R: A Language and Environment for Statistical Computing; R Foundation for Statistical Computing: Vienna, Austria, 2015. [Google Scholar]
  52. Rosseel, Y. Lavaan: An R package for structural equation modeling. J. Stat. Softw. 2012, 48, 1–36. [Google Scholar] [CrossRef]
  53. Hu, L.; Bentler, P.M. Cutoff criteria for fit indexes in covariance structure analysis: Conventional criteria versus new alternatives. Struct. Equ. Model. 1999, 6, 1–55. [Google Scholar] [CrossRef]
  54. Horn, J.L. A rationale and test for the number of factors in factor analysis. Psychometrika 1965, 30, 179–185. [Google Scholar] [CrossRef] [PubMed]
  55. Revelle, W. Psych: Procedures for Personality and Psychological Research; Northwestern University: Evanston, IL, USA, 2015; Available online: http://cran.r-project.org/web/packages/psych/index.html (accessed on 14 May 2018).
  56. Satorra, A.; Bentler, P.M. Corrections to test statistics and standard errors in covariance structure analysis. In Latent Variables Analysis: Applications for Development Research; von Eye, A., Clogg, C.C., Eds.; Sage Publications: Thousand Oaks, CA, USA, 1994; pp. 399–419. [Google Scholar]
  57. Hu, L.; Bentler, P.M. Fit indices in covariance structure modeling: Sensitivity to underparameterized model misspecification. Psychol. Methods 1998, 3, 424–453. [Google Scholar] [CrossRef]
  58. Marra, R.; Rodgers, K.; Shen, D.; Bogue, B. Leaving engineering: A multi-year single institution study. J. Eng. Educ. 2012, 101, 6–27. [Google Scholar] [CrossRef]
  59. Seymour, E.; Hewitt, N.; Friend, C. Talking about Leaving: Why Undergraduates Leave the Sciences; Westview Press: Boulder, CO, USA, 1997. [Google Scholar]
Figure 1. Originally hypothesized factor structure, which was tested in the first confirmatory factor analysis (CFA) in Study 1. For the second CFA in Study 1 (called “modified 5-factor”), items 1 and 8 were allowed to cross-load on the intellectual factor.
Sustainability 10 02885 g001
Figure 2. Hypothesized factor structure using the shortened 36-item survey in Study 2.
Sustainability 10 02885 g002
Figure 3. Hypothesized factor structure using the shortened 34-item survey in Study 3.
Sustainability 10 02885 g003
Table 1. Evolution of the Individual Sustainability survey over Studies 1, 2, and 3.
Item # (Study 1)Item # (Study 2)Item # (Study 3)StemFactor (Study 1)Factor (Study 3)
111I am a person who owns a lot of electronic devices.EconomicEconomic
2--I am a person who is careful when budgeting financial resources.Economic-
3--I am a person who finds it important to keep bills and payments current.Economic-
4--I am a person who tends to spend money impulsively.Economic-
522I am a person who admires wealth.EconomicEconomic
633I am a person who considers earning capacity the central factor in career choice.EconomicEconomic
744I am a person who feels the need to have a lot of material possessions.EconomicEconomic
85-I am a person who needs to have the “top of the line” when purchasing a product.Economic-
966I am a person who believes that having a lot of money will make me happy.EconomicEconomic
1077I am a person who makes many decisions based on money.EconomicEconomic
1188I am a person who talks to my friends and family about the characteristics and qualities of our relationship.SocialSocial/Intellectual
1299I am a person who expresses myself with appropriate warm physical contact with friends.SocialSocial/Intellectual
13--I am a person who is comfortable interacting in groups of people.Social-
14--I am a person who behaves in ways that reflect my values.Social-
151010I am a person who finds it important to balance my social time with my personal time.SocialSocial/Intellectual
16--I am a person who prefers to be with other people rather than spending time alone.Social-
171111I am a person who chooses to interact directly with other people rather than socialize via electronic devices.SocialSocial/Intellectual
181212I am a person who demonstrates openness, acceptance, and respect in my relationships.SocialSocial/Intellectual
19--I am a person who likes to be the center of attention when interacting with others.Social-
201313I am a person who is comfortable with close personal relationships.SocialSocial/Intellectual
211414I am a person who considers myself to be intellectually inclined.IntellectualSocial/Intellectual
22--I am a person who uses thinking and reasoning strategies to solve problems and generate ideas.Intellectual-
-1515(I am a person who uses critical thinking to solve problems.)Social/Intellectual
-1616(I am a person who uses creative thinking to generate ideas.)Social/Intellectual
231717I am a person who seeks out thoughtful conversations.IntellectualSocial/Intellectual
24--I am a person who likes to argue.Intellectual-
251818I am a person who likes to consider multiple sides of an issue.IntellectualSocial/Intellectual
261919I am a person who talks with others about issues that are important to our society.IntellectualSocial/Intellectual
27--I am a person who considers school a good source of intellectual stimulation.Intellectual-
282020I am a person who is inquisitive.IntellectualSocial/Intellectual
29--I am a person who tends to spend more time “doing” rather than “thinking.”Intellectual-
30--I am a person who actively seeks new knowledge.Intellectual-
312121I am a person who talks a lot about myself when I am with others.EmotionalEmotional
322222I am a person who has moods that vary widely.EmotionalEmotional
332323I am a person who often lets emotions dictate my thoughts and actions.EmotionalEmotional
342424I am a person who misdirects my anger on to others.EmotionalEmotional
35--I am a person who takes on the emotional state of others.Emotional-
36--I am a person who is sensitive to the emotions of others.Emotional-
372525I am a person who considers my emotional well-being important.EmotionalSocial/Intellectual
38--I am a person who has friends I can talk with about emotional issues.Emotional-
3926 (edited)26I am a person who frequently experiences significant stress in my life. (I am a person who experiences emotional stress.)EmotionalEmotional
-2727(I am a person who actively addresses emotional health concerns.)Social/Intellectual
402828I am a person who has strong reactions to both positive and negative events.EmotionalEmotional
4129 (edited)29I am a person who is careful to get the amount of sleep I need most nights. (“most nights” removed for Study 2)HealthHealth
4230 (edited)30I am a person who actively pursues good eating habits, including avoiding fast foods. (“including avoiding fast foods” removed for Study 2)HealthHealth
-3131(I am a person who eats a lot of processed foods, like fast food.)Health
433232I am a person who experiences physical discomfort sometimes caused by stress and anxiety.HealthEmotional
4433-I am a person who often uses over-the-counter or prescription drugs.Health-
453433I am a person who actively pursues good physical health habits and activities.HealthHealth
46--I am a person who paces my activity levels, concentrates, and focuses on a single task.Health-
4735 (edited)34I am a person who actively addresses health concerns when they occur. (I am a person who actively addresses physical health concerns.)HealthHealth
483636I am a person who is often sick.HealthEmotional
49--I am a person who has a tendency to multi-task and be scattered in accomplishing tasks.Health-
50--I am a person who is aware of the holistic nature of human health and well-being.Health-
Note. In the “Ideal” version of the survey, all items begin with “Ideally” followed by a comma. Items that are bold-faced are reverse scored prior to computing subscales. Items in ( ) were added or edited for Studies 2 and 3.
Table 2. Methods for the three studies.
ParticipantsSurvey QuestionsReal vs. Ideal
Study 1 (Fall 2014)Junior engineering students at mid-sized public university (n = 91)50 items, same order for allReal self, Ideal self
Study 2 (Fall 2015)Freshman through senior engineering students at mid-sized public university (n = 247)36 items, randomized orderReal self, Ideal engineer
Study 3 (Fall—Spring 2016)Undergraduate engineering students at four different institutions (n = 267)34 items, randomized orderReal self, Ideal engineer
Table 3. Global Model and Relative Fit Indices for CFA.
Study 1
IdealReal
Original 5-factorCFI0.6660.319
RMSEA0.0960.112
SRMR0.1100.137
Overall χ2χ2 (1165) = 1962.95 *χ2 (1165) = 2119.40 *
Modified 5-factorCFI0.6680.324
RMSEA0.0960.112
SRMR0.1070.136
Overall χ2χ2 (1163) = 1954.84 *χ2 (1163) = 2110.34 *
5-factor vs. Modified 5-factorχ2 (2) = 9.17, p = 0.01χ2 (2) = 6.80, p = 0.03
Study 2
IdealReal
Original 5-factorCFI0.7660.716
RMSEA0.0630.066
SRMR0.0900.109
Overall χ2χ2 (584) = 1090.59 *χ2 (584) = 1173.53 *
1-factorCFI0.5870.399
RMSEA0.0830.095
SRMR0.0970.120
Overall χ2χ2 (594) = 1489.27 *χ2 (594) = 1842.83 *
5-factor vs. 1-factorχ2 (10) = 211.86 *χ2 (10) = 1640.50 *
Study 3
IdealReal
New 4-factorCFI0.8380.692
RMSEA0.0520.065
SRMR0.0780.085
Overall χ2χ2 (521) = 894.82 *χ2 (521) = 1118.30 *
Original 5-factorCFI0.7620.619
RMSEA0.0630.072
SRMR0.1150.111
Overall χ2χ2 (517) = 1066.95 *χ2 (517) = 1255.47 *
1-factorCFI0.5630.214
RMSEA0.0850.103
SRMR0.1080.125
Overall χ2χ2 (527) = 1538.25 *χ2 (527) = 2052.28 *
4-factor vs. 1-factorχ2 (6) = 117.50 *χ2 (6) = 7126.80 *
5-factor vs. 1-factorχ2 (10) = 169.01 *χ2 (10) = 886.55 *
Note 1. All models were estimated using full-information maximum likelihood in lavaan. CFI = comparative fit index; RMSEA = root mean squared error of approximation; SRMR = standardized root mean residual. Typically accepted cutoff values for SRMR < 0.08 (0.07 when violating multivariate normality), CFI > 0.90 (0.95 when violating multivariate normality), and RMSEA < 0.08 (0.06 when violating multivariate normality). Note 2. The Satorra-Bentler correction was used to adjust the chi-square for all models [56]. Note 3. For Study 3, the chi-square difference test was not conducted for the 4- vs. 5-factor models as they are not nested. * p < 0.001.
Table 4. Individual Survey four factor exploratory factor analyses (EFA) solutions without items 5 and 33: Study 2.
IdealReal
Item12341234
1−0.220.38−0.110.34−0.170.29−0.050.29
20.130.730.060.060.000.80−0.050.06
30.060.620.03−0.050.080.68−0.12−0.06
40.150.590.07−0.030.150.610.14−0.09
60.210.73−0.01−0.060.060.770.020.01
70.000.73−0.030.00−0.040.590.040.06
80.590.10−0.200.040.55−0.01−0.090.12
90.500.05−0.140.020.49−0.10−0.040.06
100.41−0.010.10−0.100.510.00−0.01−0.05
110.25−0.090.020.130.35−0.030.260.17
120.610.050.03−0.030.64−0.010.17−0.16
130.60−0.04−0.04−0.090.50−0.080.13−0.03
140.50−0.080.090.080.47−0.030.02−0.03
150.58−0.030.04−0.120.64−0.01−0.05−0.14
160.710.030.11−0.160.640.050.13−0.12
170.540.01−0.070.020.680.02−0.07−0.01
180.590.030.20−0.110.49−0.010.23−0.14
190.610.130.02−0.030.560.18−0.150.05
200.530.030.06−0.020.52−0.05−0.11−0.07
210.07−0.030.430.280.020.130.34−0.02
22−0.13−0.110.770.090.03−0.070.70−0.04
230.020.120.540.050.020.100.64−0.06
240.290.010.54−0.020.16−0.080.61−0.07
250.600.07−0.120.010.560.07−0.120.06
26−0.110.040.750.06−0.27−0.010.690.16
270.540.15−0.250.210.500.16−0.070.05
28−0.280.120.44−0.04−0.240.040.43−0.04
290.30−0.040.100.420.08−0.070.100.50
300.27−0.10−0.080.690.23−0.05−0.040.68
31−0.010.060.160.66−0.060.110.080.70
320.080.060.62−0.06−0.100.000.730.07
340.31−0.160.070.470.31−0.14−0.020.57
350.420.00−0.070.290.320.030.020.37
360.220.000.48−0.020.120.060.390.02
Factor Correlations1.001.00
0.241.000.101.00
0.390.421.000.170.281.00
0.360.340.301.000.280.120.021.00
Note: Standardized factor pattern coefficient ≥0.30 or ≤−0.30 are bolded. Due to rounding, some values appear to be 0.00 when they are, in fact, smaller than the second decimal; Percent variance accounted for by model for Ideal survey: 41.3%. Percent variance accounted for by model for Real survey: 39%.
Table 5. Item descriptive statistics: Study 3.
IdealReal
MeanSDSkewKurtosisMeanSDSkewKurtosis
Q13.121.360.700.203.121.460.72−0.19
Q23.821.520.36−0.663.531.450.54−0.31
Q34.021.620.14−0.933.801.510.36−0.78
Q44.721.47−0.40−0.654.431.50−0.17−0.97
Q54.391.69−0.04−1.124.101.650.09−0.97
Q63.671.550.30−0.823.461.450.60−0.42
Q74.991.41−0.64−0.144.521.54−0.55−0.50
Q84.931.35−0.640.254.781.53−0.67−0.24
Q95.621.19−1.382.345.641.25−1.382.13
Q105.621.26−1.281.935.581.25−1.061.27
Q116.131.04−2.187.075.960.93−1.293.12
Q125.711.18−1.613.675.681.22−1.462.51
Q135.831.10−1.513.825.611.10−1.242.41
Q146.290.94−2.247.956.010.85−1.606.00
Q156.061.06−1.794.985.741.01−1.293.14
Q165.881.16−1.482.735.611.25−1.332.06
Q176.320.89−2.117.946.000.89−1.444.55
Q185.701.19−1.262.135.271.22−1.041.32
Q195.861.19−1.422.725.531.18−1.111.55
Q204.921.46−0.63−0.324.641.36−0.38−0.59
Q214.911.65−0.70−0.434.561.69−0.56−0.77
Q225.111.59−0.78−0.234.511.56−0.13−1.10
Q235.591.52−1.180.735.171.46−0.66−0.40
Q245.741.12−1.302.575.521.27−1.211.55
Q254.231.70−0.11−1.063.611.710.32−1.16
Q265.131.46−0.940.444.641.49−0.61−0.34
Q273.591.480.39−0.483.491.480.54−0.41
Q285.001.75−0.76−0.524.161.77−0.15−1.17
Q295.491.27−1.031.244.911.40−0.60−0.14
Q304.921.61−0.46−0.724.271.62−0.08−1.02
Q314.721.67−0.38−0.923.991.680.02−1.16
Q325.751.15−1.362.915.401.32−0.930.50
Q335.571.22−1.251.915.171.19−0.951.26
Q345.831.39−1.592.215.591.46−1.511.87
|Max|6.011.77−1.606.006.011.77−1.606.00
|Min|3.120.85−0.02−0.143.120.85−0.02−0.14

