A Model for the Optimal Recovery of Multiple Substances from Waste Water with a Focus on Phosphate


1
Faculty of Business Administration, University of Resources TU Bergakademie Freiberg, Schlossplatz 1, 09599 Freiberg, Germany
2
German Mongolian Institute for Resources and Technology GMIT, 14210 Ulaan Baatar, Mongolia
Sustainability 2018, 10(8), 2867; https://doi.org/10.3390/su10082867
Submission received: 17 April 2018
/
Revised: 26 July 2018
/
Accepted: 30 July 2018
/
Published: 13 August 2018
(This article belongs to the Special Issue Phosphorus Circular Economy: Closing Loops through Sustainable Innovation)
Abstract
:In recent times, the issue of a “Phosphate Peak” has entered the academic debate and it is widely present in social media. Arguments in favour and against are similar to those mentioned in the much earlier debate on the “Oil Peak”. However, whereas the “Oil Peak” is supply driven, the “Phosphate Peak”, if at all, is demand driven. In contrast with oil, most of which is chemically transformed in CO2, vapor and other constituting elements, phosphate is not “consumed” during its primary use as a fertilizer. Hence, whilst phosphate rock, from which phosphate is mined, is a depletable resource, phosphate itself is potentially recyclable and re-usable. Research on the technologies for such a recovery is manifold and, specifically, efforts are spent on waste water as a source of phosphate. This, if successful, could lead to a changing perception of waste water treatment plants as a set of backstop technologies to eliminate an environmental problem into a “secondary liquid mine” from which phosphate, but not only phosphate, could be extracted for re-use. Hence, for that purpose, an economic model of efficient extraction of phosphate and other elements from waste water in a waste water treatment plant could give guidance to operators. This paper presents such a model describing the optimal simultaneous extraction of several elements, including phosphate, from a “secondary liquid mine”. The elements are assumed to be present in given proportions (ratios) in this “mine” and the model shows that these ratios have an impact on the optimal extraction path and on resulting “implicit” shadow pricing rules to be adopted by the waste water treatment plant operator.
1. Introduction
The issue of “running out of phosphate” receives attention in academic and policy debates, even though phosphate rock, from which most of it is produced, is available up to some 69 billion tonnes [1]. Nevertheless, it is to be considered as a depletable resource. Given global population increase, the growing demand for food, the moral and political need to eradicate hunger, and the essentiality of phosphate in agriculture for which there is no substitute, a solution to “running out of phosphate” can be seen in its recovery for re-use. Most research on that potential is focused on technologies for the extraction of phosphate and elementary phosphor from waste waters in waste water treatment plants.
This implies a re-consideration of waste water treatment plant, currently considered as a system of environmental technologies for the purification of waste water up to natural standards comparable to the water bodies in which the cleaned water is released. If phosphate and probably also other elements are extracted from waste water, a waste water treatment plant can be considered as a “secondary liquid mine” with a potential to generate “valuable” resources.
In that case, waste water purification and “liquid mining” are operated synergetically and the question arises as to how these two activities can be combined in an optimal manner. This paper is dedicated to an investigation of that issue. An economic model of optimal waste water treatment in a wider sense, as just explained, is developed, presented and analyzed in terms of its optimality conditions. The remainder of this paper is organized as follows. Section 2 contains an overview of phosphate in a global context. Section 3 contains remarks about the need for phosphate and it discusses the issue of running out of phosphate rock. Section 4 introduces the concept of a waste water treatment plant as a “secondary liquid mine” from which phosphate may be extracted for re-use. Section 5 presents a mathematical model to illustrate optimal conditions for operating such a “secondary liquid mine. Section 6 contains a conclusion.
2. Phosphate in a Global Context
Phosphate rock is the (group of) minerals from which phosphate is extracted after mining. Its annual production—typically from surface mining—takes place in many countries around the globe, either from sedimentary or igneous deposits. More than 80% of all phosphate rock is coming from sedimentary deposits. China, Jordan, Northern Africa (Tunisia, Morocco and Western Sahara), and the United States of America have large sedimentary deposits. Igneous deposits are found in South Africa, Zimbabwe, Finland, Russia and Canada. With 50 billion tons of phosphate rock reserves, Morocco (including Western Sahara) has around 75% of the entire world’s reserves, estimated at 69 billion tonnes [1]. The remaining 25% are distributed among a wide variety of countries [1]. It should be noted that China, with only a small fraction of Morocco’s reserves, is the world’s largest producer. In addition, China’s production volumes have increased tremendously in the ten years up to 2016. Table A1 in the appendix shows production volumes for the 2008 up to 2016 and reserves for 2016 as compiled by the author on the basis of USGS publications.
According to U.S. Geological Survey [1]: “Worldwide, more than 85 percent of the phosphate rock mined is used to manufacture phosphate fertilizers. The remaining 15 percent is used to make elemental phosphorus and animal feed supplements, or is applied directly to soils. Elemental phosphorus is used to manufacture a wide range of chemical compounds”.
With respect to consumption, China is also the world’s largest consumer of phosphate rock. Table 1 shows world consumption of phosphate (P2O5) by continent for selected years.
Table 2 shows phosphate fertilizer consumption for selected countries. Whereas in the 1970, the USA were the largest consumer country, nowadays China is the first consumer country followed by India, both with rapidly growing quantities.
Since practically all (90% according to Harraz [2] and 86% according to European Commission [3]) phosphate from phosphate rock is used in agriculture, global demand for phosphate is determined by the development of global demand for food. Projections differ one from another, since the development of the demand for food depends on GDP growth, population growth and many more factors, such as changing diets. Since 2010, after the World Financial Crisis, consumption of phosphate rock increased by six percent annually [4,5]. Drivers of increasing demand are, in particular, China, India and Brazil, but, in some countries, also government agricultural policy programmes, in particular with respect to subsidies for fertilizers. In India, for example, for fiscal year 2017, the government has a subsidy budget for fertilizers worth 70,000 Crore rupees, equaling 9,244,389,976 Euros [6].
3. Why Phosphate Is Needed and Whether We Are Running Out of Phosphate Rock
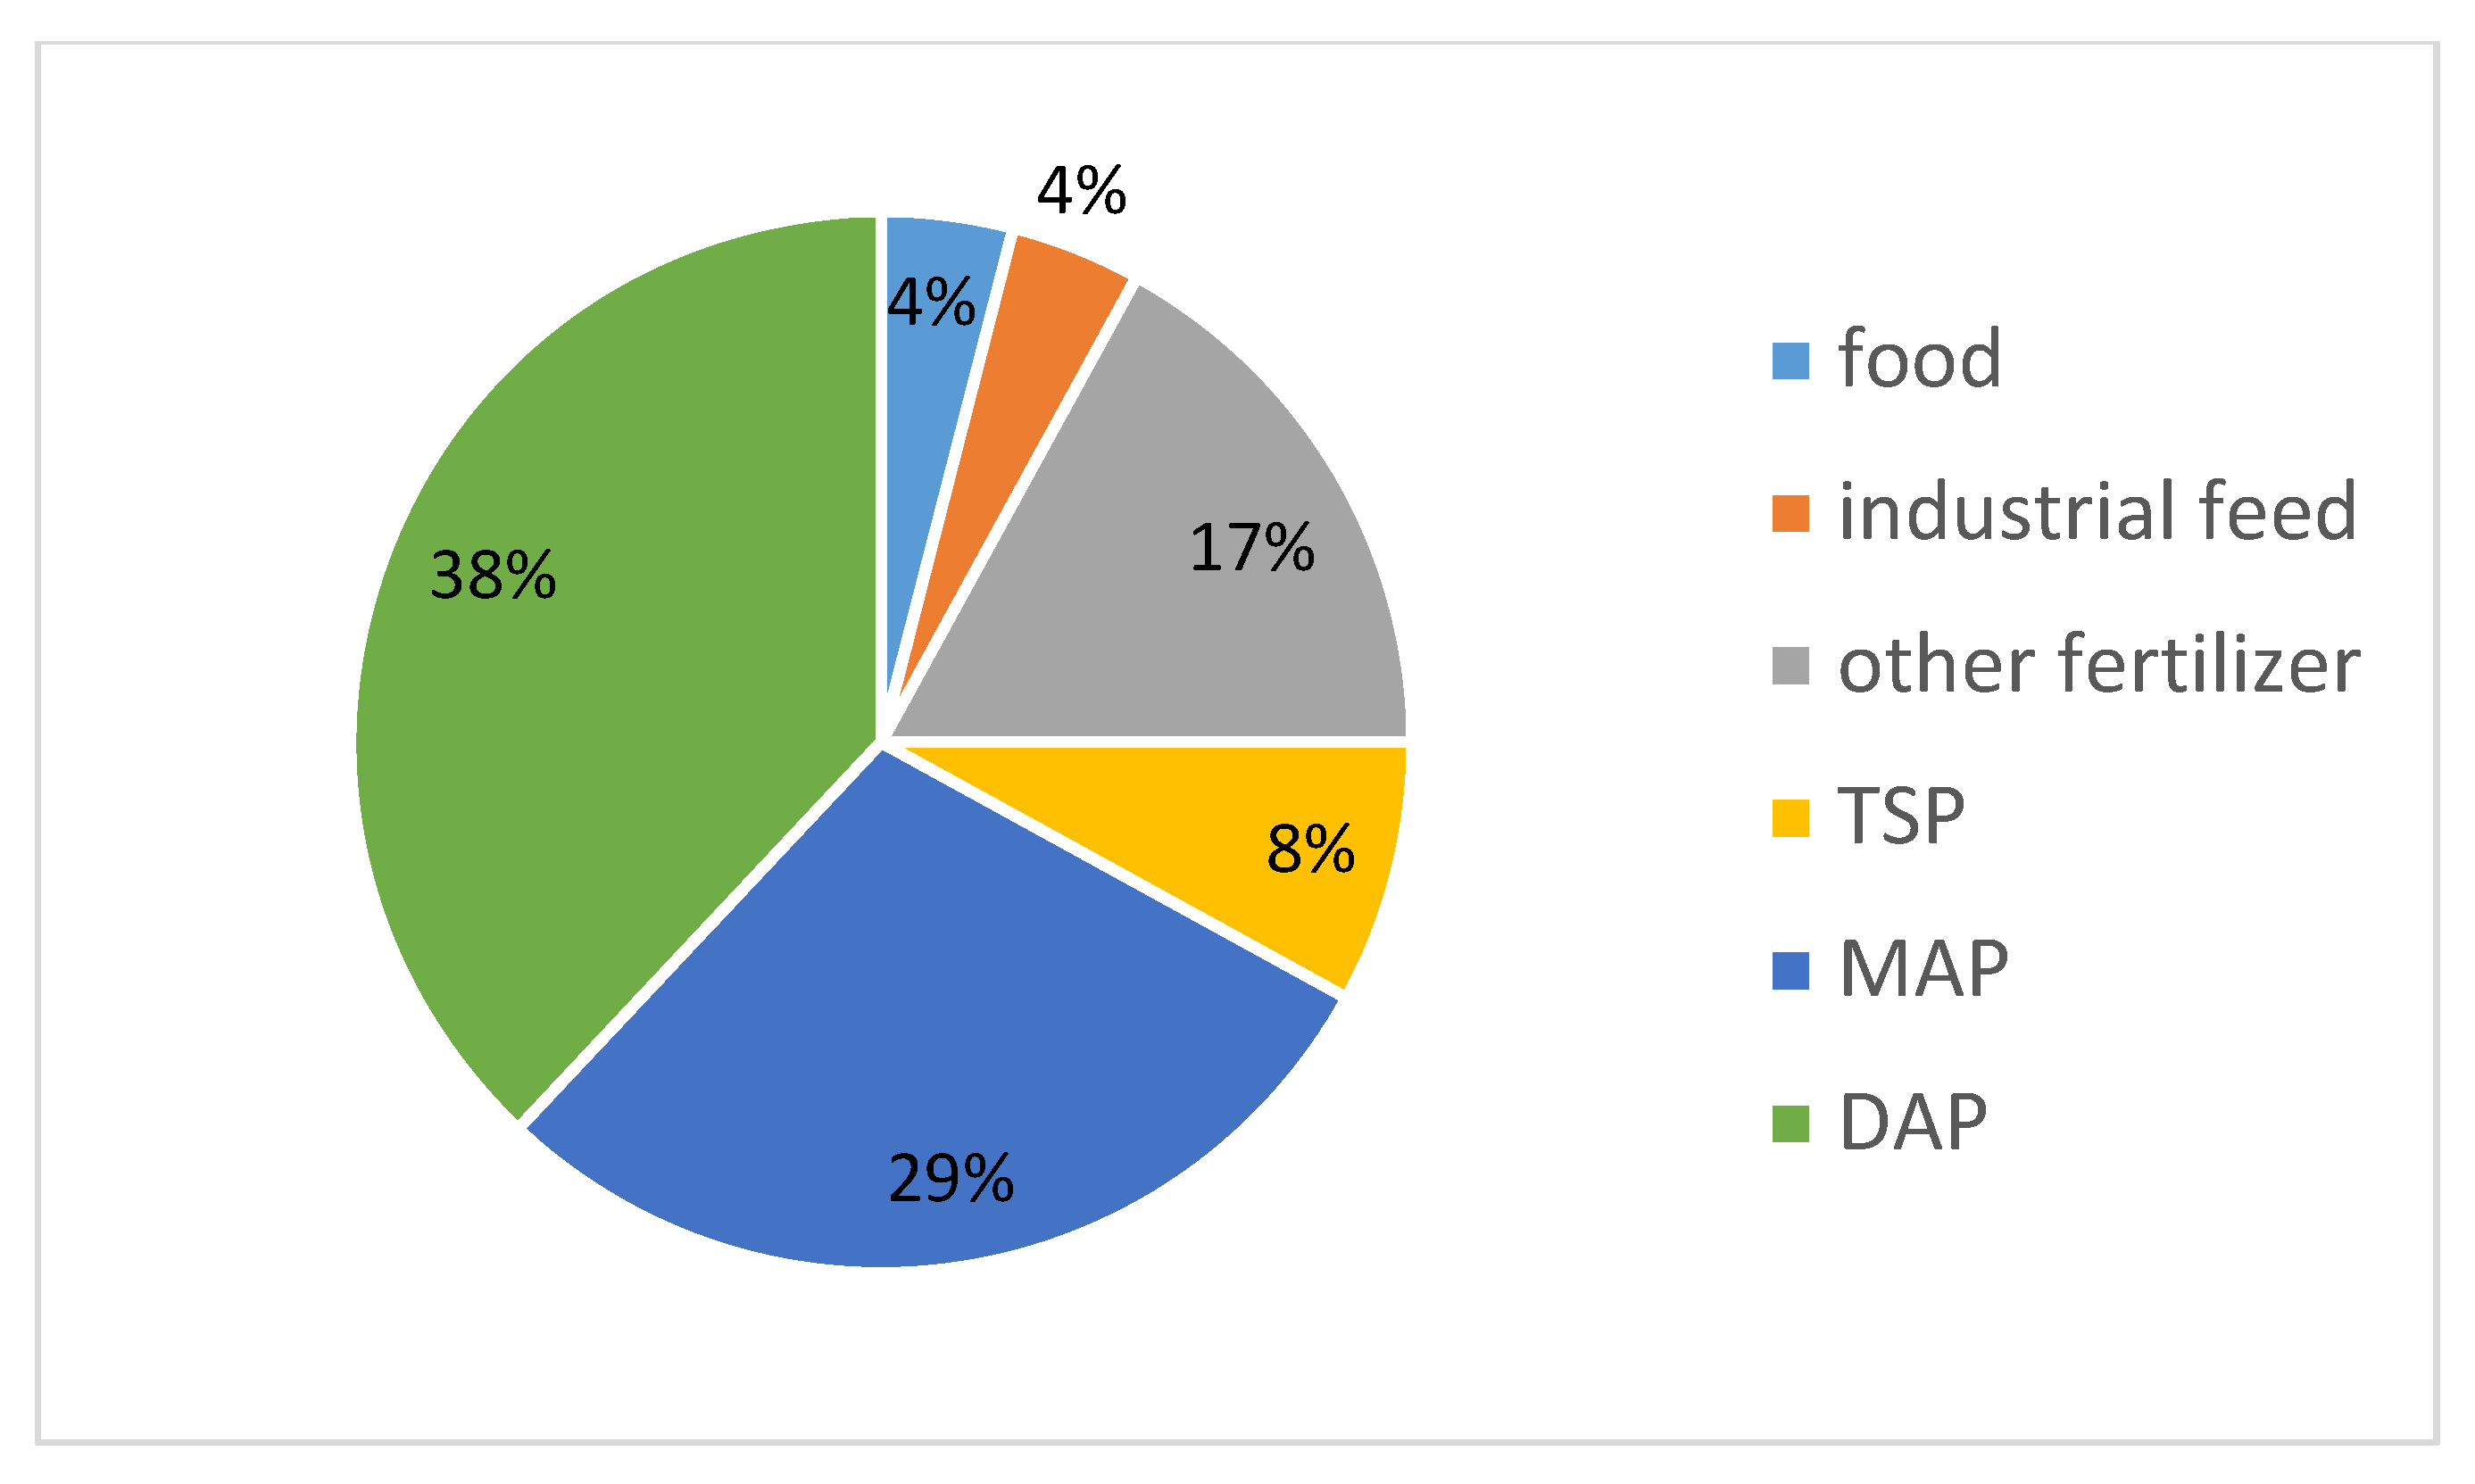
There is an overwhelming consensus that there is no substitute for phosphorus in agriculture. Already in 1974 Isaac Asimov [8]: “We may be able to substitute nuclear power for coal, and plastics for wood, and yeast for meat, and friendliness for isolation—but for phosphorus there is neither substitute nor replacement” and he referred to phosphate as “life’s bottleneck”[8]. Indeed, phosphate is essential for many plant functions, including root formation, seed formation, energy transport and photosynthesis. Since plants absorb phosphate from soils, it must be administered to soils as fertilizer. Figure 1 shows the functions of phosphate in agriculture.
Numerous studies deal with phosphate losses from fertilizer applications to various types of soils and water bodies and with the (closure of) the so-called phosphorous cycle. Obviously, losses in soils and water bodies aggravate the problem of (lack of) availability of phosphate as mainly being produced from phosphate rock. A coverage of these studies is beyond the scope of this paper. Readers are referred to publications, such as the Special Issue of Soil Use and Management on Phosphorus in Soil and Its Transfer to Waters with a broad coverage of the subject in many settings and in various countries [10].
It suffices to note that, in consequence, many European countries have adopted legislative regulations on the maximum applications of fertilizer per unit of surface (hectare) depending on agricultural and other land uses [11].
Because phosphate rock is a depletable resource and, given the forecasted growth of demand, a lively discussion has emerged about a so-called “Phosphate Peak”, much similar to the Oil Peak debate which was originated by M. King Hubbert in 1949. Observing the production of oil wells in the USA, he developed a model showing increasing production volumes over time until a peak production, later named “Hubbert Peak” would occur at a given moment in time to be followed by declining production volumes. Hubbert argued that this development would occur for every individual oil well and oil field and, in consequence, also for total (global) oil production [12].
Obviously, discoveries of new oil reserves (e.g., offshore oil production) and improvements in recovery technologies (e.g., enhanced oil recovery) would shift the peak into the future but not change the fundamental development. The main argument for this was seen in the (assumed) fact that such new oil discoveries would not compensate for call upon caution of market mechanisms in this debate which may set incentives to reductions of oil consumption through energy efficiency and through substitution of other energy sources for oil.
The debate on a “Phosphate Peak” runs similar, except that the world would fall short of phosphate due to its ever increasing demand not being matched by sufficient supply. In fact, some predictions of a resulting food shortages in a truly Malthusian vision are very drastic.
Once again, Isaac Asimov [8] can be cited: “[L]ife can multiply until all the phosphorus is gone, and then there is an inexorable halt which nothing can prevent”. In [12], wordings such as “Phosphorous Famine” and “Threat to Our Food Supply” appear.
One famous citation is from Jeremy Grantham of the global investment management firm GMO who wrote in his GMO Quarterly Letter in 2011: Now, despite a massive increase in fertilizer use, the growth in crop yields per acre has declined from 3.5% in the 1960s to 1.2% today. There is little productive new land to bring on and, as people get richer, they eat more grain-intensive meat. Because the population continues to grow at over 1%, there is little safety margin [13].
In 2016, Charly Faradji and Marissa de Boer went as far as to claim a drastic reduction of phosphate use together with an enhanced recycling [14].
It is beyond the scope of this paper to evaluate the facts and figures and the arguments pro and against a “Phosphate Peak” [15]. Several authors have reviewed their predictions of “Peak” years over time and others, evaluating and comparing such “Phosphate Peak” studies, but have concluded that they did not find any (statistical) relationship among the various “Peak” years. See, for example, [15,16] and the references cited by these authors.
Clearly, other authors present a different view on this issue, calling for a careful and detailed analysis of geological conditions, reserve/consumption ratios, supply and demand driven markets and reliability of predictions. See, especially, Scholz and Wellmer [17,18] with a clear warning against an uncritical acceptance of Phosphate Peak curves.
The main difference between oil and phosphorus consists in the fact that oil is typically consumed when used as a fuel, whereas phosphate is maintained. Hence, phosphate rock reserves are defined as a depletable resource, but phosphate itself and elementary phosphor are recoverable and recyclable, subject to the condition that appropriate technologies are available. Hence, a growing interest in the extraction of phosphorus from “secondary” resources, in which it ends up, can be noticed. Readers are referred to papers, such as [19,20,21] and the references cited by these authors. In terms of “secondary” resources and technologies, many papers focus on waste water and waste water treatment technologies for the extraction of phosphor from waste water. Readers are also referred to company websites such as [22].
4. Waste Water in a Waste Water Treatment Plant as a “Secondary Liquid Mine”
Traditionally, a waste water treatment plant is considered to be a system of backstop technologies with the objective of maintaining an environmentally clean aquatic system. Typically, unwanted elements and compounds (referred to as “pollutants”) in waste water are eliminated from this waste water up to (or even beyond) specific (legal) “removal” rates. The result is a “clean” water which meets environmental quality standards, for instance, expressed as maximal concentrations or as limit values for such elements and compounds. However, in view of the extraction of phosphates (and possibly other elements), a waste water can be re-considered as a “secondary liquid mine”, since it has the potential to generate resources.
With such a novel re-consideration, waste water treatment becomes a synergetic activity of the delivery of environmental services without any direct specific economic benefit and of the extraction of substances with an economic value, such as phosphate. Table 3 shows phosphate rock prices from 2000 until 2017. It is clear that, after the tremendous (800%) spike in 2008, phosphate rock prices thereafter did not come down to the level before 2008.
It should be noted, however, that elementary phosphor and phosphate-based fertilizers (typically Diammonium Phosphate (DAP), the most widely used fertilizer) command much higher prices than phosphate rock, typically in the area of magnitude of 350 US$ and even 400 US$ per tonne, as can be seen from numerous market reports, such as [24]. Hence, prices for phosphate rock can serve as a lowest benchmark for waste water treatment plant operators with intentions to extract phosphate as a novel and value-creating activity.
A more general aspect of the extraction of phosphate from waste water relates to the conservation of resources to the extent that recovered phosphate replaces the mining of phosphate rock. In consequence, extracted phosphate should receive a credit or bonus for this positive externality. In this way, phosphate becomes a resource built into the concept of a circular economy, in which materials are not lost through waste or dissipation but recovered and reused. In as much as phosphate is considered as a strategic mineral, its “linear use” from mining, processing, use as fertilizer, uptake in plants and animals and dissipation” can be transformed in a “circular use” in which potentials for recovery and re-introduction into the economic cycle are utilized. (See. e.g., the website and publications of [25]. Phosphate is mentioned in [3] and its recovery from waste water is identified as “functional”). However, fertilizer products in the sense of the EU legislation on their free movement in the single market require an official approval which, until this day, is lacking for recovered materials such as phosphate from waste water. In fact, such materials are not products in the sense of EU law and amendments seem to be necessary. Data also show that the potential to replace extracted phosphate rock by recovered phosphate is also still limited and the above mentioned credit may be considered as small. For that empirical reason, this positive externality is no further taken into account in this paper.
The next section is dedicated to the presentation of an economic model of optimal waste water treatment in a wider sense, including the extraction of phosphate and other possible resources next to the “traditional environmental” obligation of the removal of unwanted elements from the waste water.
5. Modelling Conditions of Optimality for the Extraction of Phosphate from Waste Water
5.1. Optimal Control Theory
For the modelling, use has been made of optimal control theory as a standard approach towards solving for optimality over time. (See, for example, Caputo [26].) The Optimality Problem is formulated as a decision making problem under constraints in which, for each time period, so-called control variables have to be given numerical values that have been picked from a set of numbers (for instance, certain quantities or of substances to be extracted from waste water). This decision results in an outcome of state variables (remaining concentrations in the waste water) which have to be evaluated in terms of their optimality or non-optimality. For this evaluation, so-called co-state variables enter the model, which indicate corrective actions towards optimality to be taken for the selection of the values for the control variables in the consecutive time period. Since this mechanism is used for each individual time period, the overall optimality model can be broken down into single time period model. The solution of this model delivers a decision rule which is applicable to each time period and, hence, interconnects all time periods from the initial to the final time period.
5.2. Assumptions
We consider a waste water as a “secondary liquid mine” from which specific elements must be “removed” beyond a minimum (legal) rate, and from which other elements can be extracted in quantities determined by the operator. In reality, the “secondary liquid mine” is to be defined as a stock–flow system, since waste water is flowing into the system and clean water is flowing out. For the purpose of this paper, we assume that inflow and outflow are constant and, hence, we can state that the “secondary liquid mine” is described as a stock with volume S. This stock contains a number of elements indicated xj, i = 1, …, n and ri with j = 1, …, m.
xi represents the quantity of an extractable element, for instance, phosphate, available in a waste water treatment plant. This quantity is not necessarily extracted by the waste water plant operator, but it represents the (quantitatively) extractable upper bound. We may refer to any xi, including phosphate, as a “valuable” element, since it has the potential to add revenue to the waste water plant operation. In case this element replaces a quantity which needs to be otherwise extracted (e.g., phosphate from phosphate rock), society also benefits in the sense of the conservation of resources. This latter aspect is not considered in this model. We assume that the operator has the choice to make his own decision about any quantity of xi to be extracted.
We note that rj stands for the upper bound in terms of the quantity of an element to be removed in order to generate an environmental service. In respect of this quantity of rj, we assume that the operator has a minimal environmental obligation required by law or stated in a specific plant regulation or in an operating permit. In this context, we need to make an appropriate assumption. We may assume that rj must in any case meet a (legally) set rate of as a binding quantitative restriction, or, alternatively, that the operator is given a penalty for removal rates below this (legally) set rate of and awarded a bonus whenever exceeding this rate. Since the main aim of the paper relates to the optimality conditions of the extraction of xi and for reasons of simplicity in the mathematical modelling, we opt for the second assumption.
In another context and, again, for simplicity reasons, we assume that the waste water has specific characteristics in terms of relative abundances of xi and rj in the sense that all elements are present in given concentrations relative one to another. This implies an assumed proportionality among them. The reality may be more complex, but, in order to allow for a manageable mathematical formulation, we represent this assumption as follows:
with αki standing for the relative proportionality of xk with respect to xi and:
with βlj standing for the relative proportionality of rl with respect to rj.
These assumptions can be rewritten in matrix form as follows
or, for short:
And:
We further assume that the quantities of xi and rj are limited because they are present in the waste water which is defined as a stock with a fixed volume S. However, given the stock–flow system, in terms of xi and rj, the “secondary liquid mine” is depletable and renewable in each follow-up time period. This means that:
with qi representing the extracted amount of xi for any time period t = 1, …, T, and:
with sj representing the removed amount of rj for any time period t = 1, …, T.
We further assume that the efforts or costs to remove rj are remunerated by a fee system fj with j = 1, …, m and, in addition, that this fee system fj is adjusted by a reward/penalty fee in case the waste water treatment plant operator exceeds or fails to achieve the (legally) set rate of removal level , respectively. With respect to the extractable elements xi, however, we assume that the operator must cover the efforts or costs of extraction from sales revenues at prices pi with i = 1, …, n.
We assume that the costs to operate the waste water treatment plant for the extraction of qi and the removal of sj can be represented by a common overhead cost, which depends on the size of the plant indicated by S as follows:
C = C (S)
In addition, we assume that the extraction of qi and the removal of sj require specific efforts or costs which depend the quantities removed and extracted. This is relevant, since we are interested in optimality conditions and, therefore, in specific marginal costs on which the common overhead part has no impact. For completeness sake, we include both parts in the analysis.
Hence:
- for every x, qi we assume a specific cost function Ci (xi, qi)
- for every ri, sj we assume a specific cost function Cj (rj, sj)
- with the usual properties of smooth and continuous derivatives and cross-derivatives.
Note, again, that qi and sj stand for the extracted amount of xi and the removed amount of rj, respectively.
5.3. The Model
With all above assumptions, we can write the following maximand:
with r representing the discount factor and t = 1, …, T denoting the time periods of operation and with the following restrictions:
with qi representing the extracted amount of xi for any time period t = 1, …, T
with sj representing the extracted amount of rj for any time period t = 1, …, T
and:
S, qi, xi, rj, sj≥ 0
The maximand contains:
- the sum of revenues from sales of extractable elements
- the sum of revenues from elements to be removed and corrected for the respective reward/penalty fee,
minus
- III.
- common overhead costs
- IV.
- the sum of costs of extraction of all respective elements
- V.
- the sum of costs of removal of all respective elements
The restrictions describe:
- changes in the stock to be equal to the quantities of extracted and removed elements, respectively
- the pairwise proportionalities of elements to be extracted and removed,
- the limitation that quantities of extracted and removed elements cannot be larger than corresponding quantities entering the waste water at any time.
The Lagrangian function can be written as follows:
with representing the Karush-Kuhn-Tucker multipliers for the respective restrictions.
Taking the Karush-Kuhn-Tucker conditions of optimality into account, we have to set the first derivatives with respect to xi, and rj and with respect to qi, and si, respectively, equal to zero. The results are shown in the following four equations:
where Ai and Bj stand for the i-column and the j-column of matrix A and matrix B, respectively.
Since, in essence, qi (and not xi) is extracted and, by analogy, sj (and not rj) is removed, we can neglect and . In consequence, we can rewrite the first two equations as follows:
Replacing and in the last two equations, we obtain:
5.4. Interpretations
Rearranging the last two equations in order to generate expressions for and , we establish the final results as follows:
The interpretation of these two equations can be given as follows: both λi and μj stand for sets of shadow prices for the extraction of xi and the removal of rj. In optimality conditions they should be equal to the difference between price and “adjusted” fee , respectively, and marginal extraction costs viz. marginal removal costs plus one additional corrective term. The corrective terms and relate to the relative proportionalities of the elements xi to be extracted and rj to be removed. The higher the relative abundance of any xi or any rj, the higher its respective shadow price should be. In respect of an extractable element, such as phosphate, this implies that, the higher its relative abundance, the higher is its potential to contribute to the value added of the waste water treatment operation, if extracted. This is a fundamental result.
By analogy, for any element to be removed, its relative abundance commands a higher shadow price under optimality conditions since we assume that, on the one hand, the fee fj is based on the units of rj removed and, on the other hand, on the reward/penalty fee . Hence, this result is also fundamental, but it depends on the specific assumptions of the fee system. It is also not within the scope of the paper with its focus on optimality conditions for the extraction of “valuable” elements from waste water, such as phosphate.
6. Conclusions and Suggestions for Further Research
This paper is dedicated to the presentation of an optimization model for the extraction of “valuable” elements, such as phosphate, from waste water in synergy with the traditional function of the removal of other elements for environmental water purification purposes. In view of the extraction of phosphate (and possibly other elements), a waste water can be re-considered as a “secondary liquid mine”, since it has the potential to generate resources.
Any “valuable” element in this sense, has the potential to add revenue to the waste water plant operation, and it can also replace a given quantity which needs to be otherwise extracted (e.g., phosphate from phosphate rock). This benefit to society is not considered in this model. We assume that the operator has the choice to make his own decision about any quantity of xi to be extracted but that he is (legally) obliged to achieve minimum (legally) removal rates for his “environmental” task.
Taking into account a set of simplifying assumptions, which allow for the design and the formulation of the optimization model, as a result, the optimality conditions place shadow prices on the extractable elements, as indicators of the potentials of their potentials to contribute value to the waste water treatment. In essence, the higher (lower) the relative abundance of any element in proportion to other elements, the higher (lower) its respective shadow price should be. With respect to an extractable element, such as phosphate, this implies that, the higher its relative abundance, the higher its potential to contribute to the value added of the waste water treatment operation, if extracted. This is a fundamental result.
By analogy, for any element to be removed, its relative abundance also commands a corresponding higher (or lower) shadow price under optimality conditions, but this result depends on the specific assumptions about the remuneration of the removal efforts of non-marketable unwanted elements. These assumptions include a penalty in the case of non-compliance with the legal “environmental” obligation and a bonus in case of “over-compliance”. Hence, this result is fundamental only in combination with the assumptions, but it is not within the scope of the paper.
Suggestions for further research can be formulated as follows:
- (i)
- Obviously, a computational case study, based on a scenario analysis, showing the relevance of the model would be useful.
- (ii)
- Focusing explicitly on other substances present in waste water, which merit an extraction, also adds to a better understanding of the applicability of the model.
- (iii)
- More complicated modelling of the presence of several substances without the assumption of fixed relative proportions, or—at least—changing relative proportions, may lead to a more general approach to the problem of simultaneous optimal extraction.
Funding
This research received no external funding.
Acknowledgments
This paper was written by the author as a personal contribution. Besides his personal income as a Professor Emeritus, no other funding has been used.
Conflicts of Interest
The author of this paper declares no conflict of interest.
Appendix A. Phosphate Production

| Country | 2008 | 2009 | 2010 | 2011 | 2012 |
|---|---|---|---|---|---|
| Algeria | 1800 | 1500 | 1500 | ||
| Australia | 2800 | 2500 | 1800 | 2650 | 2600 |
| Brazil | 6200 | 6000 | 5700 | 6200 | 6300 |
| Canada | 950 | 900 | 700 | 1000 | 900 |
| China | 50,700 | 55,000 | 68,000 | 81,000 | 89,000 |
| Egypt | 3000 | 3300 | 6000 | 6000 | 3000 |
| Israel | 3090 | 3000 | 3000 | ||
| India | 1240 | 1250 | 1260 | ||
| Iraq | 30 | 150 | |||
| Jordan | 6270 | 6000 | 6000 | 6000 | 6500 |
| Kazakhstan | |||||
| Mexico | 1510 | 1620 | 1700 | ||
| Morocco + W Sahara | 25,000 | 24,000 | 25,800 | 27,000 | 28,000 |
| Peru | 791 | 2540 | 2560 | ||
| Russia | 10,400 | 9000 | 11,000 | 11,200 | 11,300 |
| Saudi Arabia | 1000 | 1700 | |||
| Senegal | 700 | 700 | 950 | 980 | 980 |
| South Africa | 2290 | 2300 | 2500 | 2500 | 2500 |
| Syria | 2290 | 2300 | 3000 | 3100 | 2500 |
| Togo | 3220 | 3000 | 850 | 730 | 865 |
| Tunisia | 800 | 800 | 7600 | 5000 | 6000 |
| United States | 30,200 | 27,200 | 25,800 | 28,100 | 29,200 |
| Vietnam | |||||
| Other countries | 7440 | 7000 | 6400 | 6790 | 6000 |
| WORLD | 161,000 | 158,000 | 181,000 | 198,000 | 210,000 |
| Country | 2013 | 2014 | 2015 | 2016 | RESERVES 2016 |
| Algeria | 1500 | 1500 | 1400 | 1500 | 2200,000 |
| Australia | 2600 | 2600 | 2500 | 2500 | 1100.000 |
| Brazil | 6000 | 6750 | 6100 | 6500 | 320,000 |
| Canada | 400 | 76,000 | |||
| China | 108,000 | 100,000 | 120,000 | 138,000 | 3,100,000 |
| Egypt | 6500 | 6000 | 5500 | 5500 | 1,200,000 |
| Israel | 3500 | 3600 | 3540 | 3500 | 130,000 |
| India | 1270 | 2100 | 1500 | 1500 | 65,000 |
| Iraq | 250 | 250 | 430,000 | ||
| Jordan | 5400 | 6000 | 8340 | 8300 | 1,200,000 |
| Kazakhstan | 1600 | 1600 | 1840 | 1800 | 260,000 |
| Mexico | 1760 | 1700 | 1680 | 1700 | 30,000 |
| Morocco + W Sahara | 26,400 | 30,000 | 29,000 | 30,000 | 50,000,000 |
| Peru | 2580 | 2600 | 3880 | 4000 | 820,000 |
| Russia | 10,000 | 10,000 | 11,650 | 11,600 | 680,000 |
| Saudi Arabia | 3000 | 3000 | 4000 | 4000 | 680,000 |
| Senegal | 800 | 700 | 1240 | 1250 | 50,000 |
| South Africa | 2300 | 2200 | 1980 | 1700 | 1,500,000 |
| Syria | 500 | 1000 | 750 | 1,800,000 | |
| Togo | 1110 | 1200 | 1100 | 900 | 30,000 |
| Tunisia | 3500 | 5000 | 2800 | 3500 | 100,000 |
| United States | 31,200 | 27,100 | 27,400 | 27,800 | 1,100,000 |
| Vietnam | 2370 | 2400 | 2500 | 2800 | 30,000 |
| Other countries | 2580 | 2600 | 2470 | 2410 | 810,000 |
| WORLD | 225,000 | 220,000 | 241,000 | 261,000 | 68,000,000 |
References
- U.S. Geological Survey. Mineral Commodity Summaries 2018. Available online: https://minerals.usgs.gov/minerals/pubs/mcs/ (accessed on 25 February 2018).
- Harraz, H. Phosphate Deposits. 2015. Available online: https://www.slideshare.net/hzharraz/phosphite-ore-deposits (accessed on 15 January 2018).
- European Commission. Commission Staff Working Document—Report on Critical Raw Materials and the Circular Economy; European Commission: Brussels, Belgium, 2018. [Google Scholar]
- FAO. World Fertilizer Trends and Outlook to 2020. 2017. Available online: http://www.fao.org/3/a-i6895e.pdf (accessed on 7 August 2018).
- Grand View Research. Global Phosphate Fertilizers Market Outlook by Product (Monoammonium Phosphate, Diammonium Phosphate, Superphosphate), By Application (Cereals & Grains), Oilseeds, Fruits & Vegetables), and Segment Forecasts, 2018–2025, January 2018. Available online: https://www.grandviewresearch.com/press-release/global-phosphates-market (accessed on 15 March 2018).
- Centre set to roll out big fertilizer reform from June, 2017. India Times. 24 March 2017. Available online: http://timesofindia.indiatimes.com/india/centre-set-to-roll-out-big-fertilizer-reform-from-june/articleshow/57801760.cms (accessed on 22 December 2017).
- N-P-K World. Phosphate Snapshot—Fertilizers, Industrial Phosphates, Phosphate Fertilizers. 2013. Available online: https://npk101.wordpress.com/2013/05/27/phosphate-snapshot/ (accessed on 4 August 2018).
- Asimov, I. Asimov on Chemistry; Doubleday: New York, NY, USA, 1974. [Google Scholar]
- Phosphate in Agriculture. Available online: http://www.potashcorp.com/overview/nutrients/phosphate/overview/world-phosphate-acid-uses (accessed on 15 October 2017).
- Soil Use and Management, Special Issu on Phosphorous in Soils and Its Transfer to Waters. Available online: https://onlinelibrary.wiley.com/action/doSearch?field1=AllField&text1=phosphorous+in+soils&publication%5B%5D=14752743&Ppub=&AfterMonth=01&AfterYear=2013&BeforeMonth=12&BeforeYear=2013 (accessed on 2 August 2018).
- Amery, F.; Schoumans, O.F. Agricultural Phosphorus Legislation in Europe; ILVO: Merelbeke, Belgium, 2014. [Google Scholar]
- Phosphorus Famine: The Threat to Our Food Supply. Available online: https://www.scientificamerican.com/article/phosphorus-a-looming-crisis/ (accessed on 6 August 2018).
- Romm, J. Jeremy Grantham Must-Read, “Time to Wake Up: Days of Abundant Resources and Falling Prices Are Over Forever”. 2011. Available online: https://thinkprogress.org/jeremy-grantham-must-read-time-to-wake-up-days-of-abundant-resources-and-falling-prices-are-over-4332e8898c76/ (accessed on 15 March 2018).
- Faradji, C.; de Boer, M. How the Great Phosphorus Shortage Could Leave Us Short of Food. Available online: http://theconversation.com/how-the-great-phosphorus-shortage-could-leave-us-all-hungry-54432 (accessed on 15 March 2018).
- Cordell, D.; Drangert, J.-O.; White, S. The story of phosphorus: Global food security and food for thought. Glob. Environ. Chang. 2009, 19, 292–305. [Google Scholar] [CrossRef]
- Cordell, D.; White, S. Peak Phosphorus: Clarifying the Key Issues of a Vigorous Debate about Long-Term Phosphorus Security. Sustainability 2011, 3, 2027–2049. [Google Scholar] [CrossRef] [Green Version]
- Scholz, R.W.; Wellmer, F.W. Approaching a dynamic view on the availability of mineral resources: What we may learn from the case of phosphorous? Glob. Environ. Chang. 2013, 23, 11–27. [Google Scholar] [CrossRef]
- Scholz, R.W.; Wellmer, F.W. Comment on: “Recent revisions of phosphate rock reserves and resources: A critique” by Edixhoven et al. (2014)—Claridying comnents and thoughts on key conceptions, conclusions and interpretation to allow for sustainable action. Earth Syst. Dyn. 2016, 7, 1–15. [Google Scholar] [CrossRef]
- Liholt Sørensen, B.; Leinikka Dall, O.; Habib, K. Environmental and resource implications of phosphorus recovery from waste activated sludge. Waste Manag. 2015, 45, 391–399. [Google Scholar] [CrossRef] [PubMed]
- Xie, M.; Nghiem, L.D.; Price, W.E.; Elimelech, M. Toward Resource Recovery from Wastewater: Extraction of Phosphorus from Digested Sludge Using a Hybrid Forward Osmosis–Membrane Distillation Process. Environ. Sci. Technol. Lett. 2014, 1, 191–195. [Google Scholar] [CrossRef]
- Mayer, B.K.; Baker, L.A.; Boyer, T.H.; Drechsel, P.; Gifford, M.; Hanjra, M.A.; Parameswaran, P.; Stoltzfus, J.; Westerhoff, P.; Rittmann, B.E. Total Value of Phosphorus Recovery. Environ. Sci. Technol. 2016, 50, 6606–6620. [Google Scholar] [CrossRef] [PubMed]
- Phosphorous Removal from Wastewater. Available online: https://www.lenntech.com/phosphorous-removal.htm (accessed on 15 June 2018).
- Historical Phosphate Rock Prices and Price Chart. Available online: http://www.infomine.com/investment/metal-prices/phosphate-rock/all/ (accessed on 25 July 2018).
- Rock Phosphate monthly price. Available online: https://www.indexmundi.com/commodities/?commodity=rock-phosphate (accessed on 25 July 2018).
- Ellen Macarthur Foundation. Available online: www.ellenmacarthurfoundation.org (accessed on 15 July 2018).
- Caputo, M.R. Foundations of Dynamic Economic Analysis: Optimal Control Theory and Applications; Cambridge University Press: Cambridge, UK, 2005. [Google Scholar]
- USGS (Ed.) Mineral Resource of the Month: Phosphate Rock. December 2013. Available online: https://www.earthmagazine.org/article/mineral-resource-month-phosphate-rock (accessed on 30 October 2017).
- U.S. Geological Survey. Mineral Commodity Summaries 2015. Available online: https://minerals.usgs.gov/minerals/pubs/mcs/2015/mcs2015.pdf (accessed on 30 October 2017).
Figure 1.
Phosphate in agriculture; TSP = triple superphosphate, MAP = mono-ammonium phosphate, DAP = di-ammonium phosphate, 2013, Source: author’s design based on [9].
Figure 1.
Phosphate in agriculture; TSP = triple superphosphate, MAP = mono-ammonium phosphate, DAP = di-ammonium phosphate, 2013, Source: author’s design based on [9].

Table 1.
World consumption of phosphate (P2O5) by continent (million tonnes) (Source: [4]).
Table 1.
World consumption of phosphate (P2O5) by continent (million tonnes) (Source: [4]).
| 2015 | 2016 | 2017 | 2018 | 2019 | 2020 | CAGR | |
|---|---|---|---|---|---|---|---|
| WORLD | 41,151 | 41,945 | 43,195 | 44,120 | 45,013 | 45,858 | 2.19 |
| AFRICA | 1448 | 1489 | 1529 | 1571 | 1614 | 1659 | 2.8 |
| North Africa | 633 | 642 | 653 | 664 | 675 | 686 | 1.6 |
| Sub-Saharan Africa | 815 | 847 | 876 | 907 | 939 | 973 | 3.6 |
| AMERICAS | 11,454 | 44,690 | 12,060 | 12,380 | 12,700 | 13,009 | 2.6 |
| North America | 5035 | 5070 | 5085 | 5123 | 5160 | 5187 | 0.6 |
| Latin America & Caribbean | 3420 | 3320 | 3975 | 7257 | 7539 | 7822 | 0.0 |
| ASIA | 22,918 | 23,312 | 24,056 | 24,544 | 25,005 | 25,432 | 2.1 |
| West Asia | 351 | 367 | 383 | 400 | 417 | 436 | 4.4 |
| South Asia | 8165 | 8435 | 9025 | 9383 | 9760 | 10107 | 4.4 |
| East Asia | 14,401 | 14,510 | 14,648 | 14,761 | 14,827 | 14,889 | 0.7 |
| EUROPE | 4026 | 4135 | 4217 | 4269 | 4319 | 4368 | 1.6 |
| Central Europe | 756 | 780 | 807 | 835 | 864 | 889 | 3.3 |
| West Europe | 1855 | 1863 | 1878 | 1861 | 1839 | 1818 | 0.4 |
| East Europe & Central Asia | 1415 | 1492 | 1532 | 1573 | 1616 | 1661 | 3.3 |
| OCEANIA | 1305 | 1319 | 1332 | 1356 | 1376 | 1390 | 1.3 |
Table 2.
Phosphate fertilizer consumption for selected countries (Source: [7] (million tonnes).
Table 2.
Phosphate fertilizer consumption for selected countries (Source: [7] (million tonnes).
| 1970 | 1980 | 1990 | 2000 | 2010 | 2020 | |
|---|---|---|---|---|---|---|
| World | 21,117 | 31,700 | 35,901 | 31,472 | 45,442 | 57,000 |
| China | 949 | 2744 | 5853 | 8610 | 16,943 | 22,400 |
| India | 541 | 1231 | 3259 | 4215 | 8017 | 16,600 |
| USA | 4346 | 4930 | 3811 | 3862 | 3883 | 3000 |
| Brazil | 417 | 1988 | 1202 | 2338 | 3385 | 4300 |
| Australia | 757 | 797 | 579 | 946 | 946 | 600 |
| Pakistan | 30 | 226 | 389 | 757 | 757 | 650 |
| Canada | 326 | 635 | 578 | 571 | 620 | 500 |
| Turkey | 176 | 619 | 625 | 629 | 515 | 450 |
| Japan | 656 | 690 | 690 | 583 | 424 | 400 |
| France | 1809 | 1773 | 1349 | 795 | 295 | 300 |
| Others | 11,108 | 16,066 | 17,568 | 9088 | 9658 | 9800 |
© 2018 by the author. Licensee MDPI, Basel, Switzerland. This article is an open access article distributed under the terms and conditions of the Creative Commons Attribution (CC BY) license (http://creativecommons.org/licenses/by/4.0/).
Share and Cite
MDPI and ACS Style
Bongaerts, J.C. A Model for the Optimal Recovery of Multiple Substances from Waste Water with a Focus on Phosphate. Sustainability 2018, 10, 2867. https://doi.org/10.3390/su10082867
AMA Style
Bongaerts JC. A Model for the Optimal Recovery of Multiple Substances from Waste Water with a Focus on Phosphate. Sustainability. 2018; 10(8):2867. https://doi.org/10.3390/su10082867
Chicago/Turabian StyleBongaerts, Jan C. 2018. "A Model for the Optimal Recovery of Multiple Substances from Waste Water with a Focus on Phosphate" Sustainability 10, no. 8: 2867. https://doi.org/10.3390/su10082867
Note that from the first issue of 2016, this journal uses article numbers instead of page numbers. See further details here.