Using Two Government Food Waste Recognition Programs to Understand Current Reducing Food Loss and Waste Activities in the U.S.

1
Department of Food Science, University of Tennessee, Knoxville, TN 37996, USA
2
Center for Sustainable Business and Development, 246 Jessie Harris Bldg., University of Tennessee, Knoxville, TN 37996-1911, USA
*
Author to whom correspondence should be addressed.
Sustainability 2018, 10(8), 2760; https://doi.org/10.3390/su10082760
Submission received: 27 June 2018
/
Revised: 31 July 2018
/
Accepted: 1 August 2018
/
Published: 4 August 2018
Abstract
:Food waste mitigation is a critical means of addressing current and future economic, social and environmental concerns, to ensure enough food to feed the world’s growing population in a sustainable way. U.S. federal, state, and local governments have recognized the importance of food waste issues. A variety of policies associated with food waste management, food reduction, and food donation are set to allow and incentivize individuals, organizations and businesses to reduce their food waste. This study focuses on investigating current food waste prevention and diversion activities using data drawn from two U.S. waste reduction recognition programs, the U.S. Food Waste Challenge (FWC) and the EPA Food Recovery Challenge (FRC). Participants involved in these two programs follow the EPA Food Recovery Hierarchy to prevent and divert their food waste. Descriptive statistics, crosstabs, and content analysis were used to analyze the data. The results indicated that a majority of participants were in the food store category, and that Region 9 had the highest participation rate; the top three food waste prevention and diversion activities were food donation, source reduction, and collaboration/partnership. Different strategies used in different categories by FRC awardees were identified. The results of this study can be used to identify changes and strategies needed in practices, programs, and policies. The outcomes of the study provide a clear picture regarding what has been done and what needs to be done more in the future.
1. Introduction
Food waste indicates an unsustainable food system when linked to economic, social, and environmental development. Americans are wasting 40% of food produced for human consumption, equivalent to 429 pounds (194.59 kg) of food per year per person as of 2010 [1]. The wasteful lifestyle of Americans included disposing of garbage by throwing it into the streets, causing serious health problems [2,3]. For most of Americans, food was abundant and cheap, easy to acquire and easy to waste [4]. America is the largest producer of food waste [5], yet one in eight Americans is food insecure [6], creating a critical need to address the issue.
There is a great body of literature on food waste, but the definitions vary among studies. Some studies addressed the issue by differentiating food waste into two concepts: “Food loss” and “food waste.” Food loss refers to decrease in mass quantity or quality of edible food that is intended for human consumption, but is not consumed for whatever reason. Food waste is part of food loss, but refers specifically to removal of edible food that is still fit for human consumption along FSC [1]. Since this paper focuses on edible food waste prevention and diversion activities in the United States, the term “food waste” defined by the United States Department of Agriculture (USDA) (https://www.usda.gov/oce/foodwaste/faqs.htm) is used throughout the paper. Examples of food waste generated would be food not harvested due to size, not meeting cosmetic standards, and low market price at the farm level, improper storage and product recalls at the manufacturer level, damaged packaging and unpurchased products at the retail level, and over-preparation and food expiration at the food service level [7].
What baseline estimates of food loss and waste will be used to measure progress in reaching the 50 percent reduction goal?
“Neither USEPA nor USDA estimate provides a comprehensive evaluation of food loss and waste in the United States. However, reductions in both these estimates will provide evidence of progress in reducing food loss and waste and the serious environmental impacts associated with landfilling food. A variety of other data collection efforts across the country will help provide information on other segments of the supply chain.”
How is food waste defined in the context of the U.S. Food Waste Challenge?
“USDA’s Economic Research Service (ERS) defines food loss as the edible amount of food, postharvest, that is available for human consumption but is not consumed for any reason. It includes cooking loss and natural shrinkage (for example, moisture loss); loss from mold, pests, or inadequate climate control; and food waste. For the U.S. Food Waste Challenge, USDA is adopting the convention of using the general term “food loss and waste” to describe reductions in edible food mass anywhere along the food chain. In some of the statistics and activities surrounding recycling, the term “waste” is stretched to include non-edible (by humans) parts of food such as banana peels, bones, and egg shells.”
1.1. Brief History of Food Waste
Food waste can be dated back to the late 1800s and early 1900s, when industrialization of agriculture and manufacturing production of commodities changed American consumption. Food became commercialized, more accessible, and less expensive, which encouraged consumers’ wasteful lifestyle in all areas. During World War I and the Great Depression, the American economy plummeted. Many farmers suffered from falling prices and overproduction due to the Dust Bowl and customers’ inability to pay. Many crops were left in the field untouched because few programs could accept a large-scale surplus to distribute to people in need or deliver surplus crops to charitable organizations or local agencies. In 1933, the administration of President Roosevelt created the Federal Emergency Relief Administration to address hunger relief and the Federal Surplus Relief Corporation to help farmers increase revenue, continue farming, and distribute surplus farm foods to the needy [8].
In the twentieth century, World War II (WWII) pulled America out of the Great Depression and into a new age of prosperity. Industry revitalization, increased personal income and consumption, and planned obsolescence kept the American economy growing. Scientific and technological development also had an impact on consumers’ lifestyle such as canned goods and the invention of the refrigerator and radio. The government tried to call for voluntary action to reduce food production during wartime, encouraging Americans to fight food waste for the war [8]. For example, a poster developed by the Bureau of Home Economics to encourage housewives to fight food waste at home for war in 1942 and the American Fat Salvage Committee was formed to encourage American to donate excess fat rendered from cooking to the army to produce explosives [9]. After WWII, farms faced the challenge of overproduction because of the introduction of gasoline- and electric-powered machinery, and the application of chemical fertilizer and pesticides to farmland and crops. In 1954, the Food for Peace program was created to export U.S. surplus agricultural commodities to food-deficient countries, and in 1960 the government decided to use surplus food to assist the low-income population [4].
1.2. Food Waste in the United States Today
It is estimated Americans spend $218 billion a year to grow, process, and transport food that is never eaten [10], and by throwing this food away, Americans waste about 2% of total energy consumption that is equivalent to 350 million barrels of oil per year [11], more than 25% of total freshwater supply [12], and 31% of cropland [13]. Food waste is the single largest component (21%) of municipal solid waste to landfills, and the majority of food waste winds up in landfills [14]. While Americans throw away 63 million tons (57.15 tonnes) of edible food [15], one in eight Americans is food-insecure [6]. Reducing 15% of food waste annually can feed more than 25 million people in the U.S. [10]. This paper focuses on investigating current reducing food loss and waste activities in different sectors of FSC on the part of U.S. organizations. The aim of the research is to analyze those activities in different regions and sectors by drawing information from participants in two U.S. government food waste recognition programs including the U.S. Food Waste Challenge (FWC) and EPA Food Recovery Challenge (FRC). The results of this study can be used to identify changes and strategies needed in practices, programs, and policies. The outcomes of the study provide a clear picture regarding what has been done and what needs to be done more in the future.
2. Literature Reviews
2.1. Food Waste along the Food Supply Chain
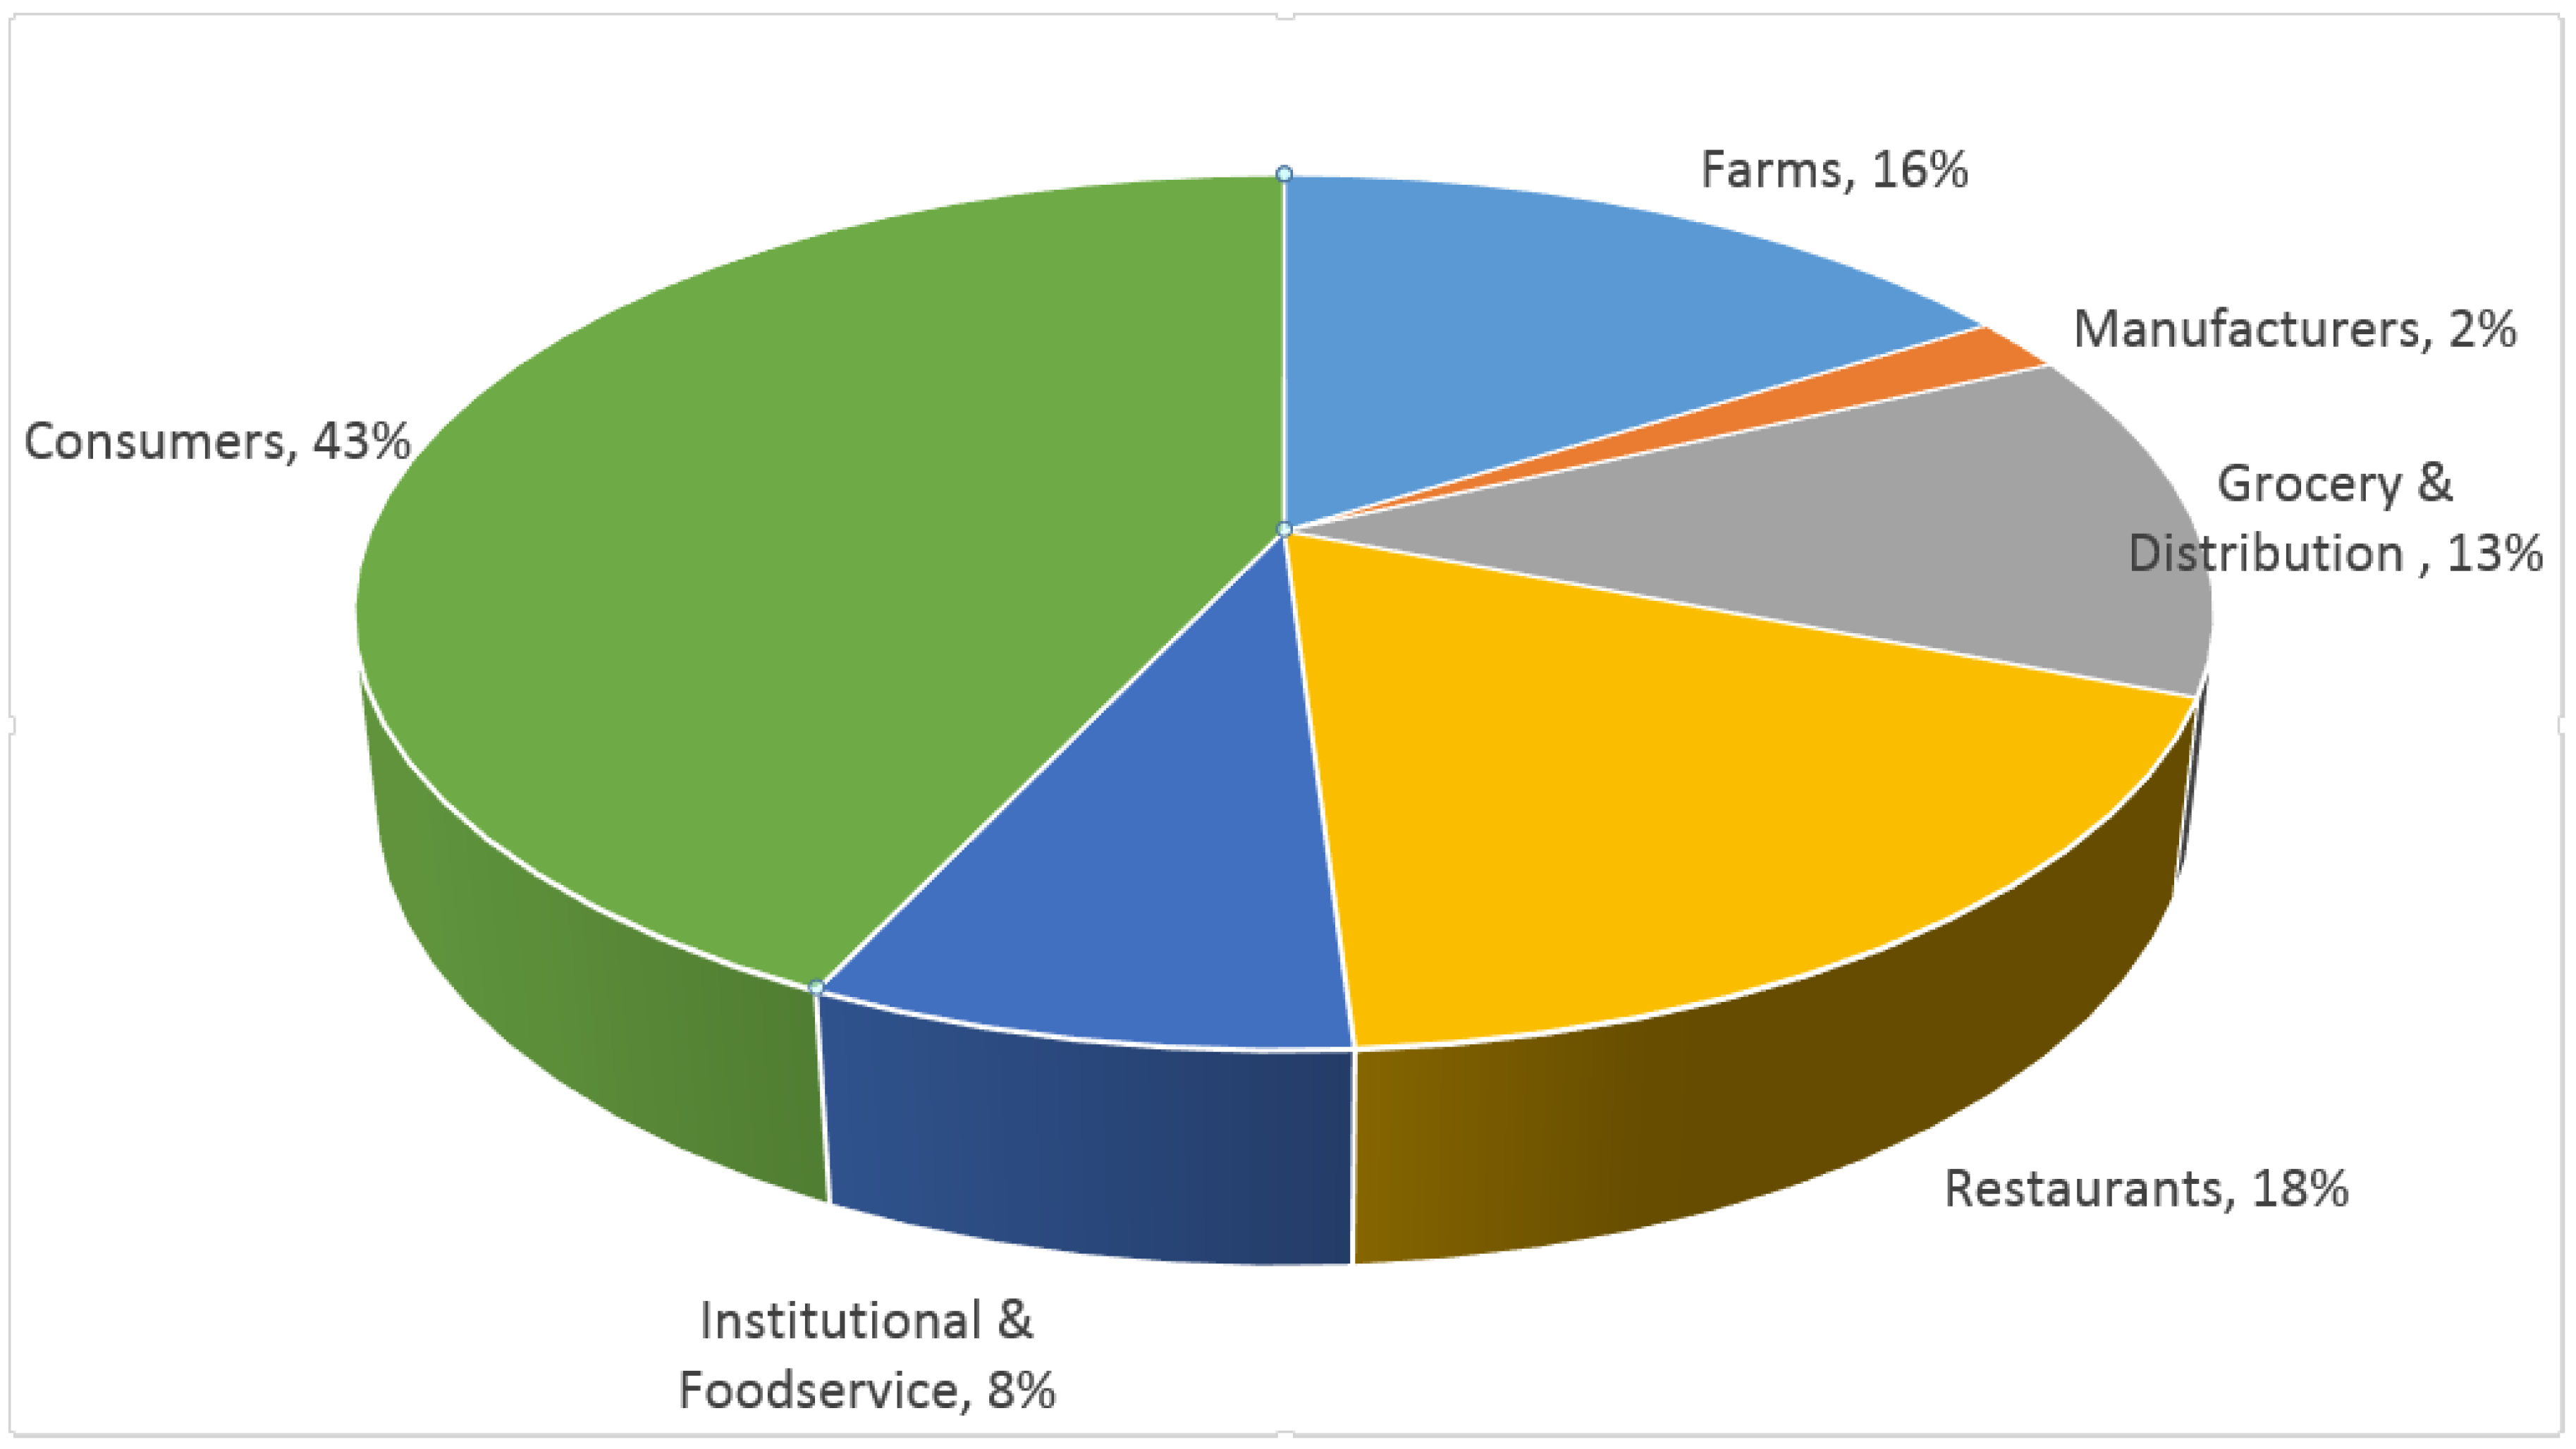
Food waste mitigation is a critical means of addressing current and future economic, social and environmental concerns, and to ensure enough food to feed the world’s growing population in a sustainable way [16]. Food waste occurs at all levels of the food supply chain (FSC). As shown in Figure 1, a total of 63 million tons (57.15 tonnes) of food waste occurred along the FSC in the U.S. Consumers generate the largest portion of food waste, while manufacturers generate the smallest portion of food waste [15]. Studies have identified possible causes and remedies of food waste at different stages of the FSC [1,10,15,16,17,18,19,20,21,22,23,24,25,26,27,28,29,30,31,32]. Food waste can be recycled as animal feed, fertilizer, energy or material recovery. Factors impacting effective and efficient food donation management are measuring food waste regularly, coordinating among different company functions, and understating causes of food waste generated and designing a process for each cause [23]. This paper focuses on the FSC before consumer level. Therefore, consumer-level food waste is not covered in the paper (Appendix A).
2.1.1. Production Level
FSC starts with production, and more than 10 million tons (9 million tonnes) of foods are lost at this level. Approximately 16 percent of food production is left on farms or farm packinghouses [15]; however, this number can vary widely from 6 percent to 50 percent, depending on different types of crops or operations [10]. Food left in the fields is either composted or tilled back to the soil [15]. The main reason behind a surplus food supply was not meeting the specification standards for the right appearance, weight, size, and shape set by the buyers, leading farmers to waste a certain portion of their crops instead of harvesting them for human consumption [27,33]. Product that does not meet specification standards goes to animal feed. Only a small portion of food waste is diverted for gleaning and donation to food banks [10,15]. Through gleaning, farm-level food waste awareness could be raised, and people could reconnect with farmers and understand how food is produced [33]. Göbel et al. [27] indicated that selling vegetables in direct markets such as farmers’ markets generated less food waste due to fewer middlemen between farmers and customers, fewer restrictions on quality, and less travel mileage. A study found that farmers who believe in and are aware of climate change due to human activities are more likely to support governmental mitigation actions [34].
2.1.2. Manufacturing Level
Considering industry-related food waste in the manufacturing sector, a 2016 survey conducted by the Food Waste Reduction Alliance (FWRA) [35], an organization formed by the Food Marketing Institute, the Grocery Manufacturers Association, and the National Restaurant Association (NRA), indicated that manufacturing generated higher volumes of food waste than other food-related businesses due to trimming, overproduction, product and packaging damage, and technical malfunctions. The amount of food waste generated is predictable, and food waste is handled efficiently by this sector. Specifically, nearly 97 percent of food waste was recycled, primarily to animal feed and land application, 1.5 percent of food waste was donated, and only 1.7 percent disposed to landfill at the manufacturing level. Manufacturers can reuse or redistribute surplus edible food by repacking, discounts and promotions, and remanufacturing [23]. One type of unavoidable food waste is disposed samples, which manufactures take and retain for quality and safety assurance [29]. Additionally, it is estimated 40 percent (19.95 million tonnes) of total food waste occurs at the consumer-business level (e.g., retail, restaurants, and food service) [15].
2.1.3. Consumer-Business Level
(i) Retail. According to Buzby et al. [1], retailers wasted about 43 billion pounds (19.5 billion kg) of available food supply in 2010. The causes of wasted food include consumer demand of cosmetically perfect food, stock management, packaging damaged goods, seasonal or unpopular items, out-of-date products, and inaccurate forecasting of food needs [1,10,25]. However, in order to stay in the market, it is a high priority for retailers to meet customer requirements such as full shelves, providing a broad variety of products, freshness, and availability [27]. The primary food groups wasted are baked goods, fresh vegetables and fruit, meat, seafood, and ready-made foods [10] and fresh produce has the most potential to become a food waste [36]. Strategies that retailers could adopt to reduce food waste are providing regional products to attract customers and shorten transportation distance, highlighting bargains, donating or giving away products that are close to their best buy-before date, accepting repackaging to meet customer needs, providing products that are close to their best buy-before date with significant discounts at a certain time [29].
Many grocery corporations recognize food waste issue and reflect this awareness in its corporate policies; however, store managers might not have the same food waste reduction vision as their parent companies. Two main drivers for store managers to adopt food waste mitigation practices were saving on costs and enhancing a company’s reputation [36]. Common food recovery practices in this sector are food donation, animal feed, and composting/anaerobic process. Transportation constraints were the most cited barrier to both food donation and recycling. Liability concerns of food donation had dramatically dropped from 69% in 2014 to 25% in 2016 [35]. Teller et al. [24] indicated the importance of increasing awareness of food waste by training employees, measuring generated food waste, and diversion of edible food waste.
(ii) Hospitality. Two types of food waste generated in this sector: Pre-consumer (preparation or kitchen waste) and post-consumer food waste (plate waste) [10,30]. About 4–10 percent of food restaurant purchased was wasted, including avoidable and unavoidable, before reaching to customer due to trimming, and staff behavior and kitchen culture [10]. Plate waste contributes a significant portion of food waste due to over preparation, consumers’ cultural beliefs and values, and type of service [30]. Engström and Carlsson-Kanyama [37] pointed out that restaurant operators pay attention to part of food waste generated, but not plate waste caused by consumers. Actions such as providing flexibility in menu selection and serving size can reduce plate waste. Moreover, quantification of food waste generated could reduce overall food waste [29]. More than half of food waste generated in this sector can be avoided [30,38]. Food donation and food recycling are two major food recovery practices. However, less than a quarter of restaurant operators donated food to charitable organizations and only 14 percent of food wasted was recycled. Moreover, majority of restaurant operators did not compost their food waste due to lack of composting facilities, insufficient space, and transportation constraints. Liability or food safety concerns, and overcomplicated and time-consuming procedures were two major barriers preventing restaurant operators from donating their surplus food [31]. Another study also indicated that donating restaurant surplus food could be complicated due to the process of cooling and reheating food [33].
(iii) Food Service Institution. In the U.S., large quantities of food waste are generated further down the FSC, especially at the consumer level. While household food waste represents a significant portion of total food waste, the institutional food service sector (e.g., schools and hospitals) is considered one of the major sources of food waste. Five million tons (4.54 tonnes) of food wastes in the U.S. are generated by this sector [15]. Engström and Carlsson-Kanyama [37] found that 20% of purchased food was lost before reaching consumers in Sweden. Kranert et al. [29] pointed out that up to 80 percent of prepared food is not reused or repurposed. A common cause of food waste is plate waste [39], which makes up 50% of food waste generated in food service institutions.
(a) K-12 Schools. The National School Lunch Program (NSLP) provides students in public and nonprofit private schools and residential child care institutions with low-cost or free lunches on school days. The program serves more than 30 million students per day in 2017 in the U.S. [40]. Food waste is the largest single material (23.9%) generated in the waste stream at schools [41]. Approximately four to ten percent of food purchased was wasted before reaching students due to overproduction, trim waste, expiration, and spoilage [42], and 12 percent of calories from food service to students goes uneaten. The annual cost for plate waste was estimated to be as high as $600 million [39]. To minimize school waste, it is important to analyze historical data to produce the amount of food need to serve students [43]. Measuring plate waste is a way to evaluate children’s nutrient intake, dietary quality, menu performance, cost, and effectiveness of nutrition education in NSLP [44]. Several studies that explore how interventions change plate waste generated in schools, such as at recess before and after lunch periods [45], new changes made in school lunch programs [46], and food choice [47].
(b) Colleges and University Dining Facilities. Colleges and universities can generate a high volume of food waste considering that more than 20 million students were enrolled in the fall of 2017 alone [48]. It is estimated an average residential student wasted about 142 pounds (64.41 kg) of food waste per year and approximately 38 pounds (17.24 kg) for a non-residential student [49]. Studies have been conducted to formulate strategies to reduce plate waste in this sector to advocate portion reduction [50], trayless dining [51], education campaigns [52], a combination of education and trayless dining [53], messaging campaigns [54], and food waste tracking [55].
2.2. The U.S. Federal Level Food Waste Recognition Programs
To align with the United Nations sustainable goal, the United States set the first official food reduction goal to reduce 50 percent of food waste by 2030 in 2015 [56,57]. In recent years, many initiatives have contributed to food waste reduction. At the federal level, there are three food waste recognition programs, in which the U.S. Environmental Protection Agency (EPA) and United States Department of Agriculture (USDA) have made efforts to encourage organizations and businesses to prevent and reduce food waste in their operations [57].
In 2016, over 950 participants joined the EPA’s Food Recovery Challenge (FRC). Organizations and businesses (e.g., grocers, educational institutions, restaurants, faith organizations, sports and entertainment venues, and hospitality businesses) have pledged to improve their sustainable food management practices [58]. The EPA provides tools, resources, and support to help participants set baselines and objectives and track progress. An organization can join the FRC as either a participant or endorser. Participants are organizations that produce food waste and want to reduce their food waste within their organizations. Endorsers are organizations that can provide resources to others to reduce their generation of food waste and promote FRC through outreach activities and connect organizations to FRC resources [59]. In 2016, the challenge participants diverted 740,000 tons (671,317 tonnes) of food from landfills and donated 222,000 tons (201,395 tonnes) to people in need [58]. Each year the program provides two awards—data-driven and narrative. Organizations and businesses do not need to apply data-driven awards, since the awards are given based on percentage changes comparing an organization’s previous annual data submitted via the sustainable material management program. Organizations need to apply for narrative awards in the following areas: Source Reduction, leadership, Innovation, Education and Outreach, and Endorsers [60].
The U.S. Food Waste Challenge (FWC) provides organizations and businesses, including producer groups, processors, manufactures, distributors, retailers, food service, industry groups, NGOs, state, county and city governments, and other federal agencies a platform to list activities to reduce, recover, and/or recycle food waste, which was launched in 2013 [54]. By joining the challenge, the participants demonstrate their commitment not only to reduce their food waste within their operations, but also to help feed people in need in their community. In this challenge, USDA makes commitments in six areas: Food waste reduction in school meal programs, consumer education in food waste recovery, food recovery or recycling from commerce, food loss estimation and modeling, research in innovative technologies for reducing food waste, and reducing and recycling food waste at USDA headquarters [61]. Over 4000 participants joined the FWC in 2014. Organizations and businesses can join FWC and/or FRC [57]. Furthermore, the USDA and EPA announced the formation of the “U.S. Food Loss and Waste 2030 Champion” in November 2016. The organizations and businesses who joint the Champion make a public commitment to reduce food loss and waste by 50 percent of food loss in their operations by the year 2030 and post their food reduction progress periodically on their websites. There were 21 corporations that made this public commitment [62].
Participants who join the federal level food waste recognition programs pledge to reduce, reuse, and recycle food waste by following the EPA Food Recovery Hierarchy. The hierarchy guides participants in setting priorities to prevent and divert food waste in the following order by source reduction for prevention measure; donation extra food to feed people in need; animal feed to divert food scraps; energy recovery; composting; and the least preferred landfill/incineration [63]. Based on the hierarchy and the government’s efforts to divert organic waste from landfills, the food waste prevention and diversion activities would be measures of prevention, food donation, industry use, and composting. Food waste sent to landfills would not be part of food waste prevention or diversion activities.
2.3. Policies Related to Food Donation
U.S. Federal, state, and local governments have recognized the importance of food waste issues. A variety of policies associated with food waste management, food reduction, and food donation are set to allow and incentivize individuals, organizations and businesses to reduce their food waste. For example, federal law provides tax incentives for food donation to encourage farmers, organizations, and individuals to donate their surplus food to feed people in need. Nine states (AZ, CA, CO, IA, KY, MO, OR, SC, VA), including DC, also provide state-level food donation tax incentives. Both federal law and all 50 states provide liability protections for businesses that donate surplus food to charitable organizations under certain criteria [39]. Currently five states (CA, CT, MA, RI, VT) and six cities (San Francisco, CA; Boulder, CO; New York City, NY; Portland, OR; Austin, TX; Seattle, WA) have organic waste bans or waste recycling laws to encourage businesses and individuals to reduce the amount of food waste sent to landfills. Each of these states and cities has different requirements for certain businesses that generate a specified amount of food waste per week/year to comply with laws. Only two states, VT and MA, and two cities, San Francisco and Seattle, require any individuals and businesses that generate a certain amount of food waste to send it to certified organic facilities [64].
According to two industrial reports conducted by FWRA (2016) [35] and NRA (2018) [31], many businesses do not donate food because they are unaware of the Bill Emerson Good Samaritan Food Donation Act, which provides federal liability protections for food donors. Increasing businesses’ awareness of liability protection might help increase the amount of food donated to charity [31]. This study focuses on investigating current reducing food loss and waste activities and strategies in different regions and sectors through drawing information from participants in two government food waste challenges, FWC and FRC. The results of this study can be used to identify changes and strategies needed in practices, programs, and policies.
3. Data and Methods
Although there are three government food waste recognition programs in the U.S., the Food Loss and Waste 2030 Champion listed only the number of participants, with no further information. Therefore, the program participants were not included in this study. The data for this study was drawn from FWC and FRC participants’ database in January 2018. The FRC database website was last updated on 5 January 2018 but there was no such indication on the FWC database website. However, the number of participants on the website was slightly different in July 2018 than the last data collection in January 2018. Additional information was also drawn from the USDA and EPA websites such as FWC activity forms and FRC 2015, 2016, and 2017 awardees, describing the strategies used to achieve their accomplishments. This study focused on food waste prevention and diversion practices; therefore, the FWC activity forms were an important part of the data for this study. Participants joining FRC only were not included in this study due to no activity forms being available on the EPA website. Those who joined both programs were included. The content analysis used in this study aimed at identifying the current food waste prevention and diversion practices and strategies FRC awardees used to reduce food waste. Descriptive statistics (frequencies) were calculated. Crosstabs analysis was used to examine the relationship between food waste prevention and diversion practices and participant categories.
4. Results and Discussion
4.1. Participant Profiles
A total of 4755 participants were identified from the U.S. Food Waste Challenge (FWC) and EPA Food Recovery Challenge (FRC) database. The majority of participants (72.7%) joined FWC, 20.7% in FRC, and 6.6% were in both programs. Participants were from the following major four categories: food stores (61.7%), K-12 schools (14.6%), restaurants/Cafés/cafeterias (7.2%), and universities/colleges (6.6%). More than half of the participants were located in regions one (10.6%), six (12.9%), nine (26%), or ten (10.2%). Region 7 (IA, KS, MO, & NE) and Region 4 (AL, FL, GA, KY, MS, NC, SC & TN) had the least number of participants across all regions (1.9% and 4.0%, respectively) (Table 1).
4.2. Food Waste Challenge Results
Among all 50 states, California and Texas had the highest number of participants (874 and 510, respectively) while Mississippi and North Dakota had the fewest number of participants (0 and 1, respectively) in FWC. Taking policies into consideration, currently six states provide state-level tax incentives, including Arizona, California, Colorado, Iowa, Kentucky, and Missouri [64]. It is not surprising to see higher numbers of participants in California (874), Colorado (331), and Arizona (184). There are five states (CA, CT, MA, RI, and VT) and six cities (San Francisco, CA; Boulder, CO; New York City, NY; Portland, OR; Austin, TX; and Seattle, WA) have a food scrap ban policy in place. The results indicated that states with food scrap bans had a higher number of participants in FWC than states without food scrap bans (CA, 874; CO, 331; MA, 217; NY, 350; OR, 138; TX, 510; VT, 80; WA, 283). Although the overall number of participants was low, Connecticut (45) and Rhode Island (24) have a food scrap ban policy for commercial food wholesalers and distributors, industrial food manufacturers or processors, supermarkets, and more. However, lack of infrastructure to support the policy is a challenge for both states [65]. Clearly, CT and RI had fewer facilities to support the food scrap ban compared to other states with food scrap bans [14,66] (Appendix B).
Participants were asked to identify reducing food loss and waste practices they were going to adopt on the activity form required to join FWC. It is interesting to learn that food donation (90.7%) was the top food waste diversion practice comparing to source reduction, collaboration/partnership, compost, animal feed, and biodiesel (76.7%, 66%, 31.3%, 26%, and 26.4%, respectively). Moreover, when separating those who joined FWC from those who were involved in both FWC and FRC, the results suggested that participants who joined both programs had higher participation rates in compost, animal feed, and biodiesel compared to those who only joined FWC.
Table 2 presents food waste practices by region. The results found that all regions had at least 70% of participants involved in food donation. Despite source reduction being the most preferable way to reduce food waste, as suggested by the EPA Food Recovery Hierarchy, it was not the most common practice for FWC participants. Six regions had more than 60% of participants involved in source reduction. Region 6 had the highest number of participants (91.9%), while Region 4 had the lowest number of participants (22.7%) in source reduction. A majority of the participants in Regions 3, 6, 9, and 10 collaborated or partnered with other organizations to help their food waste diversion practices (82.8%, 91.5%. 81%, and 90.5%, respectively). Not many regions turned recycled fat, oil, or grease to biodiesel, except Region 9 (66.8%).
The crosstabs analysis was used to see the relationship between reducing food loss and waste practices and categories (Table 3). The food stores category had the highest participation rate compared to other categories in food donation (99.6%), source reduction (96.2%), and collaboration/partnership (87.4%). The lowest participation rate in food donation was that of K-12 schools (54.6%), health care (40%) and government (28.6%). More than half of the participants in government and K-12 schools turned their food waste to compost. The rest of the categories had no more than a quarter to zero participants diverting their food waste to compost. Although food stores still had the highest participation rate in transferring food waste to feed animals compared to other categories, only 32.2% of participants in food stores were involved in this practice.
5. Results and Suggestions: Food Recovery Challenge Awardees
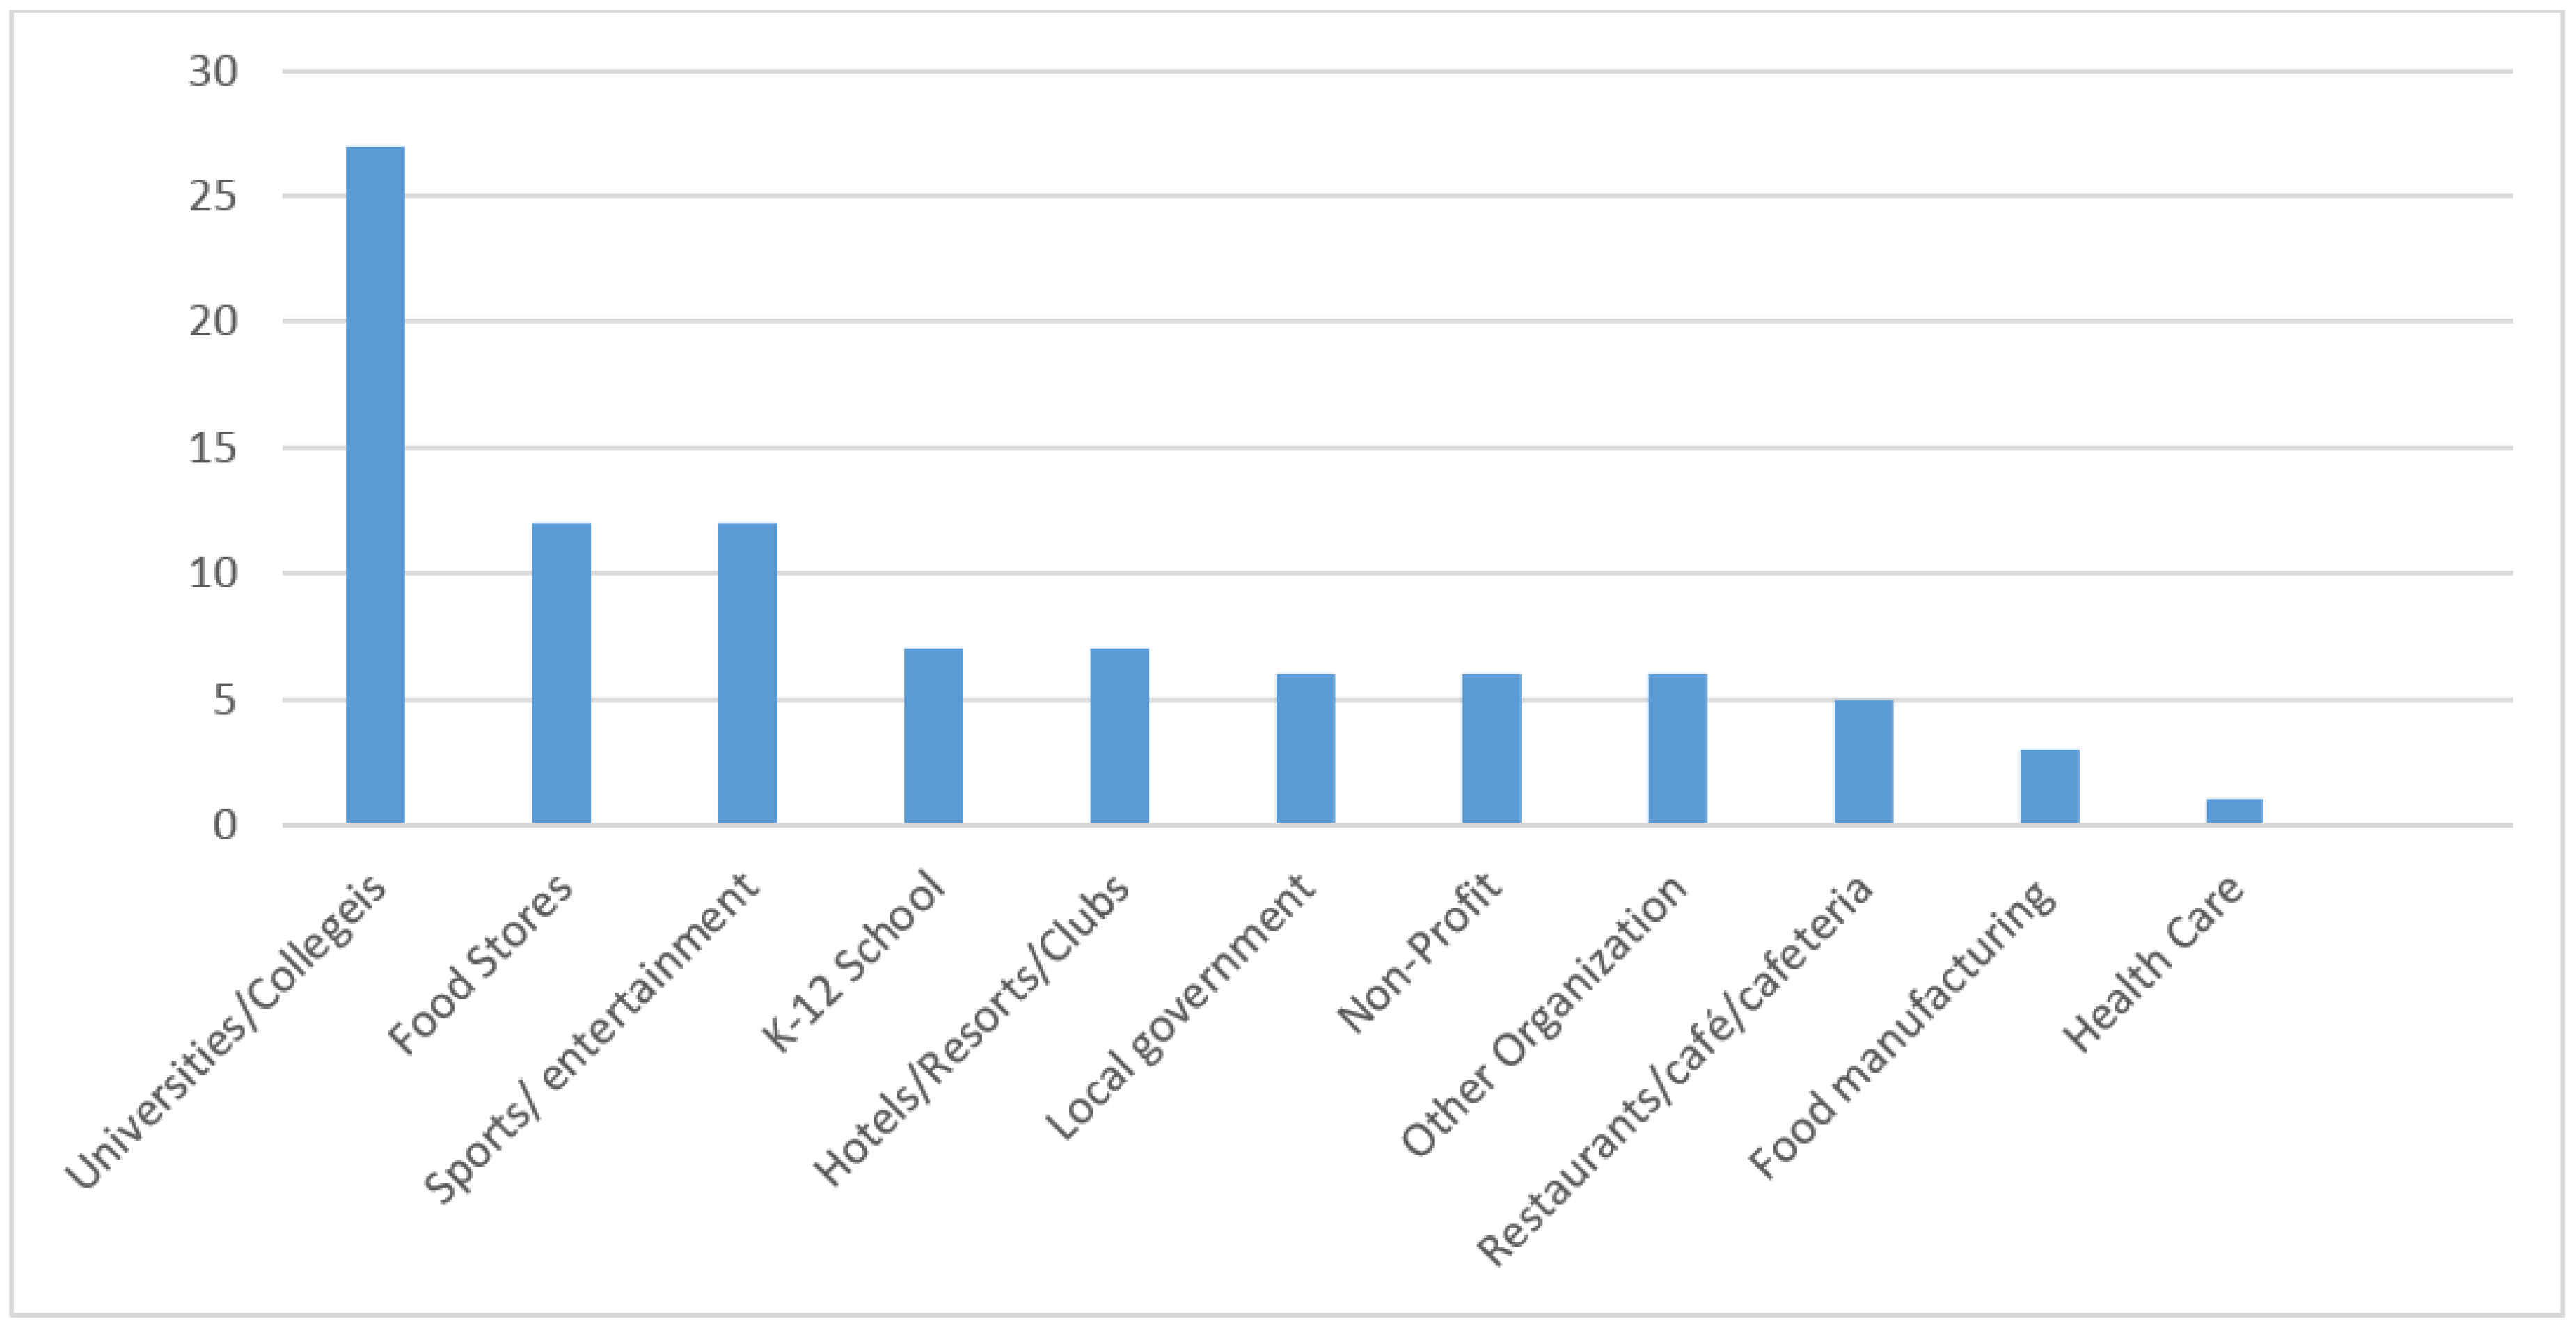
Since 2013, every year the EPA recognizes both FRC national and regional winners and shares some of winners’ accomplishments on its website. There were 110 national and regional winners sharing details about their achievements. However, a few of them mentioned the percentage of food waste reduction without describing the strategies they used. Therefore, those cases were dropped in this study. When winners received an award more than once, this would be counted as one case, for a total of 90 usable cases. Figure 2 presents the number of awardees in different categories across those 90 winners. The top three categories were universities/colleges, sports/entertainment, and food stores (27, 12, and 12, respectively). Content analysis was used to identify strategies used for food waste diversion by FRC awardees.
5.1. Universities and Colleges
The most common food recovery strategies in this category were compost (20), student/staff involvement (16), food donation (14), educational components/campaigns (12), collaboration/partnership (10) and monitoring and tracking and/or auditing (10). Several winners indicated the importance of student/staff involvement and collaboration/partnership. For example, all university dining services that practice food donation worked with student organizations such as the Food Recovery Network and Campus Kitchen. To have a successful compost program, winners have collaborated or partnered with campus gardens, student compost organizations, departments, or local governments.
Ten winners mentioned monitoring and tracking wasted food in kitchens from serving lines and plate waste helped them to win the award. The information from tracking could be used to adjust the amount and type of food they purchased and plan menus, create goals and measure results. Several winners pointed out challenges they faced, including no organic haulers available to transfer food waste to a compost facility or farm, no food banks accepting perishable food due to remote rural locations, and limited materials (no napkins or meats) as food waste to animal feed. Strategies to solve those challenges include increasing awareness of university/college food recovery efforts in community, establishing community partnerships, connecting with key volunteers and supporters, and searching and testing different options in the area.
Twelve institutions added educational components, provided training, or initiated campaigns to increase student’s awareness of food waste and food insecurity-related topics. Removing trays from dining service could be used to reduce food waste based on eight winners’ descriptions. Other innovation strategies used to combat food waste were identified as made-to-order meals, including allowing guests to remove unwanted ingredients, allowing sampling before taking a full portion, repurposing scraps from food preparation for other meals, and installing equipment such as pulpers and in-vessel composters.
5.2. Sports and Entertainment Venues
A total of 12 winners, including four convention centers, two festivals, one entertainment and dining complex, one stadium, one anti-poverty think tank, one museum, one football team, and one baseball team were in this category. Food donation, compost, and partnership with local food banks, commercial haulers, or local farms were most commonly mentioned practices in this category. One winning organization mentioned upgrading its infrastructure to help its increase food diversion rate. A Dallas convention center not only practiced food waste diversion, but also worked with clients and exhibitors to leave usable items such as pens and other consumer items, which were then matched and donated to appropriate non-profits. One important note was that seven winners had a designated sustainable team working on food donation, recycling, composting, and education.
Two festivals reported the following reducing food loss and waste strategies they used to increase waste diversion rates to 90 percent: Having a goal of educating festival-goers about the importance of food waste diversion; recruiting and training volunteers to educate and assist festival-goers with proper separation of food waste and recyclable items; having reclamation stations and sustainable volunteers dispersed throughout the festival site; having clear and colored signs above disposal containers; mandating food vendors to use compostable or recyclable service-ware. One festival set up a community outreach tent for organizations to share their food waste initiatives to inspire festival-goers and provided an opportunity for local festival-goers to sign up for residential compost services with local organic haulers.
5.3. Food Stores
A total of 12 winners shared their reducing food loss and waste details in this category. In addition to partnerships with local food pantries, farms, and commercial haulers for food donation, compost, anaerobic digestion, and animal feed, some key reducing food loss and waste strategies used in this category included making zero-waste commitments, reinforcing customer and employee engagement, developing standard operating procedures for donation, training employees in the importance and benefits of food donation to communities and companies, shrinking management and guidelines for donations, posting visual signs for donation guidelines in each department, having specific storage areas for those donation items, reducing the amount of waste generated by tracking food preparation and sales, and by doing shrink audits. Slightly blemished and less-than-perfect food could be used for culinary operations. One winner mentioned ordering misfit (misshapen) produce and selling it at a discount to customers. One winner focused on packaging and non-food product reduction. One of the most interesting strategies mentioned was making daily announcements to the public when food rescue partners visited stores.
5.4. K-12 Schools
There were seven winners, including three elementary schools, two high schools, and two school districts in this category. Source reduction, compost, food donation, animal feed and education were the strategies used. However, the procedures for food waste diversion were different than in other categories. For example, waste might be separated into food donation, animal feed, compost, liquid, and trash bins, depending on the practices the schools were using, and composting was either onsite or offsite. Winners used color-coded or marked bins to encourage food waste diversion and reduce contamination.
Different composting methods were used if composting onsite, including vermicomposting (composing with worms), hot compost, bokashi fermentation (an anaerobic composting process that can include meat and dairy in the process), and compost equipment (e.g., Earth Tub). Depending on type of compost method, the types of food waste given to compost bins would be different. Those composting onsite used compost generated by campus or community gardens. Two winners indicated the importance of separating liquid from solid food waste to reduce weight and save landfill fees. Student involvement also played an important role. For example, one elementary winner gave different students specific tasks ranging from sorting food waste, composting, shifting compost soil, gardening, and harvesting. A group of students at Romano High School collaborated with the County of San Diego and ran a district-wide food waste reduction and compost program from eight school sites. Moreover, the students gave numerous presentations and onsite demonstrations related to food waste prevention and diversion. The high school received an education and outreach award in 2016 and a data-driven award in 2017. Two elementary winners involved fifth-grade students in researching barriers and solutions for food waste diversion, designing the recycling areas and signage, and presenting information to students at other grade levels to encourage waste reduction.
5.5. Hotels, Resorts, and Lodging
Three park and lodge establishments and five resorts were in this category. One winner mentioned food donation, and two winners diverted food waste to animal feed and processing used cooking oil into energy. The majority of winners engaged in recycling and composting for their waste management. Some winners invested in equipment such as pulpers, dehydrators and liquefiers to help reduce and recycle waste. Strategies used for source reduction were employee and guest training in waste reduction, as well as tracking inventory, kitchen waste, and plate waste.
5.6. Local Governments
Six local governments, including those of two cities, two local departments of environmental protection, one town and one international airport won awards in this category. All local governments were located in food scrap ban states (California and Massachusetts), except Kansas. The roles local governments played in food waste diversion included setting goals, outreaching and educating businesses about food waste diversion, making infrastructures available and accessible to food waste diversion program participants, providing workshops, and making connections between organizations and food waste organization recipients. It was noted that two local governments approached organizations at the beginning of food scrap bans or when food waste diversion programs started by meeting with representatives from different sectors to raise their awareness of the need to manage food waste and seeking volunteers to participate in the program.
It was also worth mentioning other strategies that local governments used to increase commercial businesses participation: posting resource information about available food waste service and best management practices on local government websites and providing proof of participation for business participants to be displayed to their customers. Several winners encouraged using “imperfect produce” in the kitchen, partnering or collaborating with non-profit organizations to expand more food reduction initiatives, and involving volunteers in food recovery programs. Auditing before starting food recovery efforts and separating liquid from waste stream could be used to reduce sources and costs, and a key factor in food waste diversion was to collaborate with food service and custodial staff.
5.7. Non-Profits
All six winners in this category focused on waste reduction or environmental protection-related organizations through training, education, research funding, raising public and businesses’ awareness of food waste reduction, and promoting FRC. The majority of the winners helped the community partners by establishing food waste programs, supporting community partners, designing food waste diversion systems, providing technical support and resource information, training, and community outreach activities. Food Forward, a three-time FRC awardee, recovered food from 750 private backyards, 22 farmers’ markets, and the downtown Los Angeles Wholesale Produce Market through volunteer involvement. Fruits and vegetables recovered from those programs were donated to those in need.
5.8. Restaurants and Food Service Providers
Composting and food donation were two common reducing food loss and waste practices among the six winners. Training, education, and using tracking tools for analysis and problem-solving were mentioned for restaurants and food service providers in many different locations. All winners donated food to feed people except a café winner diverted their edible food waste to feed their employees and employees’ families. Strategies to encourage employees to practice reducing food loss and waste efforts were using color-coding systems, signage, and decals to illustrate where waste should belong, as well as tours of recycling or/and compost facilities to show employees where the waste goes and what happens to it. One awardee indicated that with the encouragement of its compost facility, the whole community participated in the programs and helped the restaurant to achieve their food diversion goals. Using compostable or recyclable products such as utensils, cups, and to-go boxes, sourcing imperfect produce, and grease recycling were other practices mentioned by winners.
5.9. Food Manufacturing, Health Care, and Other
There were three winners in food manufacturing, one in health care and two in other sectors. In the food manufacturing sector, energy production, compost, animal feed, and recycling were practices winners mentioned. One winner installed a waste compactor with an integrated scale, which could record data and help identify the needs of waste reduction areas. The winner also organized a team of volunteers to re-pack its products into family size packages, so food banks were able to accept the donations. Berkshire Health System was a two-time FRC awardee in the healthcare sector. In addition to being partnered with a local organic hauler, a farm for composting, and a local homeless shelter for food donation, the medical food service was able to save money and reduce food waste by utilizing cook-to-order room service menus. Spoiler Alert and Corporate Waste Consultants were two private companies that received EPA and FRC awards in other sectors. Spoiler Alert is a software company that helps food manufacturers, distributors, and grocery retailers manage surplus unsold products. Corporate Waste Consultants is a certified solid waste management consulting firm that specializes in food waste diversion. The company provides their clients services such as performing food waste audits, marketing research, ongoing education and training, and monitoring outcomes to reduce clients’ food waste and increase their bottom lines.
6. Conclusions
Food waste has been identified as an important economic, environmental and social issue. Studies related to food waste topics have examined the root causes of food waste, reducing food loss and waste practices in specific categories, and the value of food waste. This study examined the FWC and FRC participants’ current food waste prevention and diversion practices and 90 FRC awardees’ strategies used to accomplish their achievement. The study found that common food waste prevention and diversion practices were similar to those identified in other studies including food donation, composting, animal feed, and source reduction in general. Although participants are encouraged to follow the EPA Food Recovery Hierarchy, source reduction was not the most frequent strategy used. The two major food waste prevention practices mentioned were auditing and tracking. The NRA reported [31], nearly 50 percent of restaurant operators track food waste for their business daily by using pen and paper and computer spreadsheets. Only 26% of those restaurant operators who track food waste used specific software or smartphone apps as food-waste-tracking tools. As Tostivint et al. [67] pointed out, quantification of food waste is necessary to get a better understanding of the magnitude and location of food waste within businesses. Moreover, quantification can be used to design, implement, and monitor food prevention and diversion strategies.
The results from the NRA [31] and FWRA [35] indicated that in general fewer than one-third of members practiced animal feed (23–25%), compost (23–60%), and food donation (1.7–30%), depending on the sectors such as food manufacturing, retail, or restaurants. According to NRA [31], more than half of restaurant owners/managers still have concerns about food donation liability, which resulted in lower food donations. The difference may indicate that those participating in FWC were more aware of federal and state food donation liability protections compared to members of the NRA. Only about one-third of participants diverted their food waste to compost. According to Platt and Goldstein [68], there were 4914 composting operations identified in the U.S., and only 7% of these operations were permitted to accept food scraps. Creating more infrastructures for food scrap composting might increase practice participation. Several FRC awardees emphasized education as a strategy to reduce food waste. Studies also recommended education to minimize food waste to identify causes [27], change attitudes, raise awareness, and reduce wasteful consumption [69]. Apparently, the results of this study found that businesses in the states implementing food scrap ban policy are more aware of government food waste reduction recognition program and goal. Our study concluded that creating more infrastructure for composting, adopting food scrap ban policies at the state, city, or county level, building long-term partnerships or collaborations with donating organizations, and education and training were key factors of success in reducing food loss and waste.
Participants can decide to join the FWC or/and FRC programs. This study found that participants who joined both programs had both higher participation rates in compost, animal feed, and biodiesel, compared to those who only joined the FWC. Based on the FRC results, lack of infrastructure, lack of supporting organizations, and limited options for food waste diversion were challenges mentioned by the winners. Several reducing food loss and waste strategies were pointed out by awardees in different categories. Tracking where food waste occurs, running a pilot program before expanding to a large-scale level, providing training and education, and building long-term collaborations or partnerships with food waste recipient organizations were strategies awardees used in general to reduce food waste.
The U.S. government recognizes the importance of food waste issues by setting food waste reduction goals, implementing food waste recognition programs, and other food waste initiatives, especially the support that FRC provides to their participants. Those programs are voluntary, and the government does not verify or audit the participants’ reducing food loss and waste activities as participants claimed when joining those programs, or if participants met the reduction goals they set. Currently, FWC does not issue certifications for participants. Auditing or verification might shape those programs more efficiently to better serve their purpose and can be used to recognize participants who achieve their food waste reduction goals. Kranert et al. [29] suggested that food waste should be taken into account while bestowing various environmental certification or setting up environmental standards. Although we adopted the definition of food waste through USDA’s website as mentioned earlier, the definition of food waste is still inconsistent between USEPA and USDA. For example, during the process of reviewing FWC participants’ activity forms, authors noticed that some businesses listed recycling cardboard and plastic as a part of food reduction practices. It is important for the governments to provide a clear definition of food waste through providing detailed examples of material types in order to guide businesses more effectively. Finally, governments should do a better job of promoting those programs to consumers, so they value those participants’ reducing food loss and waste efforts.
Future research may focus on challenges and barriers to food waste prevention and diversion programs from the point of view of employees, store managers of national grocery chains, and directors of donating organizations. In this study, only one local government provided proof of participation of business participants to be displayed for their customers’ view. Evaluation is needed to determine if customers and business owners value proof of participation in a reducing food loss and waste program. Several participants mentioned the saved cost of practicing food waste prevention and diversion within a business. Further investigation is required to provide evidence based on businesses’ financial performance. There are some food waste tracking systems that are available for restaurant operators to use in the U.S. such as LeanPath, Winnow, and MintScraps [70,71], it would be interesting to compare the cost effectiveness, time saved, and food waste reduction for traditional tracking methods such as pen and paper, computer spreadsheet, and related apps.
Limitations
The present study has limitations. The sample population focused on participants who join FWC or/and FRC. Some organizations with many different locations such as food stores and school districts might register with the FWC or FRC as one organization, while other organizations might register each location separately. The FWC information was retrieved from the USDA website and was based on the activity forms that participants fill out when they join FWC. However, many activity forms were either not linked or posted instead a link to the donated organizations. Therefore, some reducing food loss and waste activities might not be recorded for those organizations.
Author Contributions
C.R.C. drafted the manuscript, provided literature reviews and qualitative analyses, and offered recommendations. R.J.C.C. guided the project with direction and ideas, added value to methods and recommendations, and edited the manuscript.
Funding
This research received no external funding.
Conflicts of Interest
The authors declare no conflicts of interest.
Appendix A

| Possible Drivers and Remedies for Food Waste at Different Stage of Food Supply Chain Stage | |
|---|---|
| Production Level | |
| Drivers | |
| Remedies | |
| Manufacturing Level | |
| Drivers | |
| Remedies | |
| Retail Level | |
| Drivers |
|
| Remedies |
|
| Foodservice Level | |
| Drivers | |
| Remedies |
|
| Consumer Level | |
| Drivers |
|
| Remedies | |
Appendix B
| U.S. States and Abbreviation | |||||
|---|---|---|---|---|---|
| U.S. State | Abbreviation | U.S. State | Abbreviation | ||
| Region 1 | Connecticut | CT | Region 5 | Ohio | OH |
| Massachusetts | MA | Wisconsin | WI | ||
| Maine | ME | Region 6 | Arkansas | AR | |
| New Hampshire | NH | Louisiana | LA | ||
| Rhode Island | RI | New Mexico | NM | ||
| Vermont | VT | Oklahoma | OK | ||
| Region 2 | New Jersey | NJ | Texas | TX | |
| New York | NY | Region 7 | Iowa | IA | |
| Region 3 | District of Columbia | DC | Kansas | KS | |
| Delaware | DE | Missouri | MO | ||
| Maryland | MD | Nebraska | NE | ||
| Pennsylvania | PA | Region 8 | Colorado | CO | |
| Virginia | VA | Montana | MT | ||
| West Virginia | WV | North Dakota | ND | ||
| Region 4 | Alabama | AL | South Dakota | SD | |
| Florida | FL | Utah | UT | ||
| Georgia | GA | Wyoming | WY | ||
| Kentucky | KY | Region 9 | Arizona | AZ | |
| Mississippi | MS | California | CA | ||
| North Carolina | NC | Hawaii | HI | ||
| South Carolina | SC | Nevada | NV | ||
| Tennessee | TN | Region 10 | Alaska | AK | |
| Region 5 | Illinois | IL | Idaho | ID | |
| Indiana | IN | Oregon | OR | ||
| Michigan | MI | Washington | WA | ||
| Minnesota | MN | ||||
References
- Buzby, J.C.; Wells, H.F.; Hyman, J. The Estimated Amount, Value, and Calories of Postharvest Food Losses at the Retail and Consumer Levels in the United States; EIB-121; USA Department of Agriculture, Economic Research Service: Washington, DC, USA, 2014.
- Nunley, M. From Farm to Fork to Landfill: Food Waste and Consumption in America. Bachelor’s Thesis, Pitzer College, Claremont, CA, USA, 2013. [Google Scholar]
- Gould, S.; Mosher, D. 5 Charts that Show just How Much Waste America Creates. 2017. Available online: https://www.weforum.org/agenda/2017/04/these-charts-demonstrate-how-wasteful-america-has-become (accessed on 11 July 2018).
- U.S. Department of State. Faming Post World-War II. Available online: https://www.thoughtco.com/farming-post-world-war-ii-1146852 (accessed on 12 March 2018).
- Barilla Center for Food & Nutrition. Food Waste: Causes, Impacts and Proposals. 2012. Available online: https://www.barillacfn.com/m/publications/food-waste-causes-impact-proposals.pdf (accessed on 26 March 2018).
- Coleman-Jensen, A.; Rabbitt, M.P.; Gregory, C.A.; Singh, A. Household Food Security in the United States in 2016; ERR-237; USA Department of Agriculture, Economic Research Service: Washington, DC, USA, 2017.
- Cicatiella, C.; Franco, S.; Pancino, B.; Blasi, E. The value of food waste: An exploratory study on retailing. J. Retail. Consum. Serv. 2016, 30, 96–104. [Google Scholar] [CrossRef]
- Historic Events for Students: The Great Depression. Food, 1929–1941. Available online: https://www.encyclopedia.com/education/news-and-education-magazines/food-1929-1941 (accessed on 2 April 2018).
- Braun, A. Turning Bacon into Bombs: The American Fat Salvage Committee. The Atlantic. 18 April 2014. Available online: https://www.theatlantic.com/health/archive/2014/04/reluctantly-turning-bacon-into-bombs-during-world-war-ii/360298/ (accessed on 26 March 2018).
- Gunders, D. Wasted: How America is Losing up to 40 Percent of Its Food from Farm to Fork to Landfill; Natural Resources Defense Council: New York, NY, USA, 2012. [Google Scholar]
- Cuéllar, A.D.; Webber, M.E. Wasted food, wasted energy: The embedded energy in food waste in the United States. Environ. Sci. Technol. 2010, 44, 6464–6469. [Google Scholar] [CrossRef] [PubMed]
- Hall, K.D.; Guo, J.; Dore, M.; Chow, C.C. The progressive increase of food waste in America and its environmental impact. PLoS ONE 2009, 4, e7940. [Google Scholar] [CrossRef] [PubMed]
- Reich, A.H.; Foley, J.A. Food Loss and Waste in the US: The Science behind the Supply Chain. Available online: https://www.foodpolicy.umn.edu/sites/foodpolicy.umn.edu/files/food-loss-waste.pdf (accessed on 26 March 2018).
- Food Waste Management in the United States, 2014. U.S. Environmental Protection Agency. Available online: https://www.epa.gov/sites/production/files/2016-12/documents/food_waste_management_2014_12082016_508.pdf (accessed on 6 April 2018).
- A roadmap to Reduce U.S. Food Waste by 20 Percent. Rethink Food Waste Through Economics and Data (REFED). Available online: https://www.refed.com/downloads/ReFED_Report_2016.pdf (accessed on 15 December 2017).
- Gustavsson, J.; Cederberg, C.; Sonesson, U.; van Otterdijk, R.; Meybeck, A. Global Food Losses and Food Waste: Extent, Causes and Prevention; Food and Agriculture Organization (FAO): Rome, Italy, 2011. [Google Scholar]
- Canali, M.; Amani, P.; Aramyan, L.; Gheoldus, M.; Moates, G.; Östergren, K.; Silvennoinen, K.; Waldron, K.; Vittuari, M. Food waste drivers in Europe, from identification to possible interventions. Sustainability 2017, 9, 37. [Google Scholar] [CrossRef]
- Buzby, J.; Hyman, J.; Stewart, H.; Wells, H.F. The value of retail and consumer level fruit and vegetable losses in the United States. J. Consum. Aff. 2011, 45, 492–515. [Google Scholar] [CrossRef]
- Kantor, L.S.; Lipton, K.; Manchester, A.; Oliveira, V. Estimating and addressing America’s food losses. Food Rev. 1997, 20, 2–12. [Google Scholar]
- Papargyropoulou, E.; Lozano, R.; Steinberger, J.; Wright, N.; Ujang, Z. The food waste hierarchy as a framework for the management of food surplus and food waste. J. Clean. Prod. 2014, 76, 106–115. [Google Scholar] [CrossRef] [Green Version]
- Parfitt, J.; Barthel, M.; Macnaughton, S. Food waste within food supply chains: Quantification and potential for change for 2050. Philos. Trans. R. Soc. B 2010, 365, 3065–3081. [Google Scholar] [CrossRef] [PubMed]
- Eriksson, M.; Osowski, C.P.; Björkman, J.; Hansson, E.; Malefors, C.; Eriksson, E.; Ghosh, R. The tree structure—A general framework for food waste quantification in food services. Resour. Conserv. Recycl. 2018, 130, 140–151. [Google Scholar] [CrossRef]
- Garrone, P.; Melacini, M.; Perego, A.; Sert, S. Reducing food waste in food manufacturing companies. J. Clean. Prod. 2016, 137, 1076–1085. [Google Scholar] [CrossRef]
- Teller, C.; Holweg, C.; Reiner, G.; Kotzab, H. Retail store operations and food waste. J. Clean. Prod. 2018, 185, 981–997. [Google Scholar] [CrossRef]
- Mena, C.; Adenson-Diaz, B.; Yurt, O. The causes of food waste in the supplier-retailer interface: Evidence from the UK and Spain. Resour. Conserv. Recycl. 2011, 55, 648–658. [Google Scholar] [CrossRef]
- Aschemann-Witzel, J.; de Hooge, I.; Amani, P.; Bech-Larsen, T.; Oostindjer, M. Consumer-related food waste: Causes and potential for Action. Sustainability 2015, 7, 6457–6477. [Google Scholar] [CrossRef] [Green Version]
- Göbel, C.; Langen, N.; Blumenthal, A.; Teitscheid, P.; Ritter, G. Cutting food waste through cooperation along the food supply chain. Sustainability 2015, 7, 1429–1445. [Google Scholar] [CrossRef]
- Thyberg, K.L.; Tonjes, D.J. Drivers of food waste and their implications for sustainable policy development. Resour. Conserv. Recycl. 2016, 106, 110–123. [Google Scholar] [CrossRef]
- Kranert, M.; Hafner, G.; Barabosz, J.; Schneider, F.; Lebersorger, S.; Scherhaufer, S.; Schuller, H.; Leverenz, D. Determination of Discarded Food and Proposals for a Minimization of Food Wastage in Germany: Abridged Version; University Stuttgart Institute for Sanitary Engineering: Stuttgart, Germany, 2012. [Google Scholar]
- Papargyropoulou, E.; Wright, N.; Lozano, R.; Steinberger, J.; Padfield, R.; Ujang, Z. Conceptual framework for the study of food waste generation and prevention in the hospitality sector. Waste Manag. 2016, 49, 326–336. [Google Scholar] [CrossRef] [PubMed] [Green Version]
- National Restaurant Association. The State of Restaurant Sustainability. Available online: https://www.restaurant.org/getattachment/News-Research/Research/State-of-Restaurant-Sustainability/Sustainability_FINAL_pdf.pdf (accessed on 3 April 2018).
- Koivupuro, H.K.; Hartikainen, H.; Silvennoinen, K.; Katajajuuri, J.M.; Heikintalo, N.; Reinikainen, A.; Jalkanen, L. Influence of socio-demographical, behavioural and attitudinal factors on the amount of avoidable food waste generated in Finnish households. Int. J. Consum. Stud. 2012, 36, 183–191. [Google Scholar] [CrossRef]
- Bromley, S.; Rogers, D.; Bajzeli, B. WP4 Evaluation Report; FUSIONS. 2016. Available online: http://www.eu-fusions.org/phocadownload/FUSIONS%20Feasibility%20studies%20evaluation%20report.pdf (accessed on 7 July 2018).
- Arbuckle, J.G.; Morton, L.W.; Hobbs, J. Farmer beliefs and concerns about climate change and attitude toward adaptation and mitigation: Evidence from Iowa. Clim. Chang. 2013, 118, 551–563. [Google Scholar] [CrossRef]
- Food Waste Reduction Alliance. Analysis of U.S. Food Waste among Food Manufacturers, Retailers and Restaurants. Available online: http://www.foodwastealliance.org/wp-content/uploads/2013/05/FWRA-Food-Waste-Survey-2016-Report_Final.pdf (accessed on 18 January 2018).
- Filimonau, V.; Gherbin, A. An exploratory study of food waste management practices in the UK grocery retail sector. J. Clean. Prod. 2017, 167, 1184–1194. [Google Scholar] [CrossRef]
- Engström, R.; Carlsson-Kanyama, A. Food losses in food service institutions examples from Sweden. Food Policy 2004, 29, 203–213. [Google Scholar] [CrossRef]
- Hollins, O. Overview of Waste in the UK Hospitality and Food Service Sector; Waste & Resources Action Programme: Banbury, UK, 2013. [Google Scholar]
- Buzby, J.C.; Guthrie, J.F. Plate Waste in School Nutrition Programs: Final Report to Congress; USA Department of Agriculture, Economic Research Service: Washington, DC, USA, 2012.
- USA Department of Agriculture, Food and Nutrition Service. National School Lunch Program—Participation and Meals Served. Available online: https://www.fns.usda.gov/pd/child-nutrition-tables (accessed on 3 April 2018).
- Digging Deep through School Trash. A Waste Composition Analysis of Trash, Recycling and Organic Material Discarded at Public Schools in Minnesota. Minnesota Pollution Control Agency. Available online: https://www.pca.state.mn.us/sites/default/files/p-p2s6-14.pdf (accessed on 17 April 2018).
- Northeast Recycling Council. Food Service/Cafeteria Waste Reduction Suggestions & Guidance. Available online: https://nerc.org/documents/schools/FoodServiceWasteReductionInSchools.pdf (accessed on 3 April 2018).
- Harvard Food Law and Policy Clinic. Keeping food out of landfill: Policy Ideas for States and Localities. Available online: https://www.chlpi.org/wp-content/uploads/2013/12/Food-Waste-Toolkit_Oct-2016_smaller.pdf (accessed on 23 December 2017).
- Shanks, C.B.; Banna, J.; Serrano, E.L. Food waste in the national school lunch program 1978–2015: A systematic review. J. Acad. Nutr. Diet. 2017, 117, 1792–1807. [Google Scholar] [CrossRef] [PubMed]
- Price, J.; Just, D.R. Lunch, recess and nutrition: Responding to time incentives in the cafeteria. Prev. Med. 2015, 71, 27–30. [Google Scholar] [CrossRef] [PubMed]
- Cohen, J.F.; Richardson, S.; Austin, B.; Economos, C.; Rimm, E.B. School lunch waste among middle school students: Nutrients consumed and costs. Am. J. Prev. Med. 2013, 44, 114–121. [Google Scholar] [CrossRef] [PubMed]
- Smith, S.L.; Cunningham-Sabo, L. Food choice, plate waste and nutrient intake of elementary and middle-school students participating in the U.S. national school lunch program. Public Health Nutr. 2013, 17, 1255–1263. [Google Scholar] [CrossRef] [PubMed]
- National Center for Educational Statistics. Back to School Statistics. Available online: https://nces.ed.gov/programs/digest/d16/tables/dt16_105.20.asp?current=yes (accessed on 6 April 2018).
- Recycling Works. Food Waste Estimation Guide. Available online: https://recyclingworksma.com/food-waste-estimation-guide/#Jump06 (accessed on 9 April 2018).
- Freedman, M.R.; Brochado, C. Reducing portion size reduces food intake and plate waste. Obesity 2010, 18, 1864–1866. [Google Scholar] [CrossRef] [PubMed]
- Kim, K.; Morawski, S. Quantifying the impact of going trayless in a university dining hall. J. Hunger Environ. Nutr. 2012, 7, 482–486. [Google Scholar] [CrossRef]
- Ellison, B.; Nehrling, E.W.; Nikolaus, C.J.; Duff, B.R.L. Evaluation of a food waste reduction campaign in a university dining hall. J. Nutr. Educ. Behav. 2017, 49, S9–S10. [Google Scholar] [CrossRef]
- Kim, T.; Freedman, M.R. Student reduce plate waste through education and trayless dining in an all you can eat college dining facility. J. Am. Diet. Assoc. 2010, 110, A68. [Google Scholar] [CrossRef]
- Whitehair, K.J.; Shanklin, C.W.; Brannon, L.A. Written messages improve edible food waste behaviors in a university dining facility. J. Acad. Nutr. Diet. 2013, 113, 63–69. [Google Scholar] [CrossRef] [PubMed]
- Burton, K.; Serrano, E.; Cox, H.; Budowle, R.; Dulys-Nusbaum, E. Benefits, barriers, and challenges to university-level food waste tracking. J. Hunger Environ. Nutr. 2016, 11, 428–438. [Google Scholar] [CrossRef]
- Food and Agriculture Organization of the United Nations. Sustainable Development Goals: Target 12.3. Available online: http://www.fao.org/sustainable-development-goals/indicators/1231/en/ (accessed on 5 March 2018).
- USA Department of Agriculture. Food Waste Challenge: Frequently Asked Questions. Available online: https://www.usda.gov/oce/foodwaste/faqs.htm (accessed on 7 January 2018).
- USA Environmental Protection Agency. Food Recovery Challenge Participants Demonstrate Action through Outstanding Achievements. Available online: https://www.epa.gov/newsreleases/food-recovery-challenge-participants-demonstrate-action-through-outstanding (accessed on 9 February 2018).
- USA Environmental Protection Agency. Food Recovery Challenge. Available online: https://www.epa.gov/sustainable-management-food/food-recovery-challenge-frc (accessed on 6 December 2017).
- USA Environmental Protection Agency. Food Recovery Challenge Award. Available online: https://www.epa.gov/sustainable-management-food/food-recovery-challenge-awards (accessed on 6 December 2017).
- Eckhouse, S. The U.S. Food Waste Challenge. Available online: http://www.ncsl.org/documents/statefed/SarahEckhouseUSDA.pdf (accessed on 10 December 2017).
- USA Department of Agriculture. The U.S. Food Loss and Waste 2030 Champions. Available online: https://www.usda.gov/oce/foodwaste/Champions/index.htm (accessed on 10 December 2017).
- USA Environmental Protection Agency. Food Recovery Hierarchy. 2017. Available online: https://www.epa.gov/sustainable-management-food/food-recovery-hierarchy (accessed on 7 July 2018).
- Rethink Food Waste Through Economics and Data. U.S. Food Waste policy FINDER. Available online: https://www.refed.com/tools/food-waste-policy-finder/ (accessed on 15 April 2018).
- Williams, T. New England Leads Nation in Food Waste Recovery, for States on Board. Soil & Mulch Producer News. Available online: http://www.soilandmulchproducernews.com/index.php/frontpage-articles-hidden/151-new-england-leads-nation-in-food-waste-recovery-four-states-on-board (accessed on 15 April 2018).
- Michaels, T. Energy Recovery Council: The 2016 Directory of Waste-to Energy Facilities. Available online: http://energyrecoverycouncil.org/wp-content/uploads/2016/01/ERC_2014_Directory.pdf (accessed on 20 March 2018).
- Tostivint, C.; Östergren, K.; Quested, T.; Soethoudt, H.; Stenmarck, Å.; Svanes, E. Food Waste Quantification Manual to Monitor Food Waste Amounts and Progression. FUSIONS. 2016. Available online: https://www.eu-fusions.org/phocadownload/Publications/FUSIONS%20Food%20Waste%20Quantification%20Manual.pdf (accessed on 7 July 2018).
- Platt, B.; Goldstein, N. State of composting in the U.S. BioCycle 2014, 55, 19. [Google Scholar]
- Lehmann, S. Optimizing urban material flows and waste streams in urban development through principles of zero waste and sustainable consumption. Sustainability 2011, 3, 155–183. [Google Scholar] [CrossRef]
- Boulden, J. Startup Helps Ikea Save 350,000 Meals from the Trash Can. Available online: https://money.cnn.com/2017/09/08/smallbusiness/ikea-food-waste-winnow/index.html (accessed on 7 July 2018).
- Wong, K. Tackling Food Waste around the World: Our Tope 10 Apps. Available online: https://www.theguardian.com/sustainable-business/2017/feb/06/food-waste-apps-global-technology-leftovers-landfill (accessed on 7 July 2018).
Figure 1.
Food waste generation in different FSC level in the U.S., As estimated by REFED 2016 [16].
Figure 1.
Food waste generation in different FSC level in the U.S., As estimated by REFED 2016 [16].

Figure 2.
Award winners in category from 2015 to 2017.

Table 1.
Characteristics of participants in the U.S. Food Waste Challenge (FWC) and Food Recovery Challenge (FRC).
Table 1.
Characteristics of participants in the U.S. Food Waste Challenge (FWC) and Food Recovery Challenge (FRC).
| Variables | Description | Frequency | Sample Percent |
|---|---|---|---|
| Program | U.S. Food Waste Challenge (FWC) | 3455 | 72.7 |
| EPA Food Recovery Challenge (FRC) | 986 | 20.7 | |
| Both | 314 | 6.6 | |
| Total | 4755 | 100% | |
| Category | Farmers/Producers | 7 | 0.1 |
| Food Stores | 2936 | 61.7 | |
| Government | 25 | 0.5 | |
| Health Care | 18 | 0.4 | |
| Hotel/Resorts/Clubs | 44 | 0.9 | |
| K-12 Schools | 695 | 14.6 | |
| Manufacturers/Processors/Distributors | 47 | 1 | |
| Restaurant/ Café/Cafeteria | 341 | 7.2 | |
| Sports/Entertainment | 133 | 2.8 | |
| Universities/Colleges | 312 | 6.6 | |
| Waste Management Services | 6 | 0.1 | |
| Other | 191 | 4 | |
| Total | 4755 | 100% | |
| EPA Regions | Region 1 (CT, MA, ME, NH, RI & VT) | 503 | 10.6 |
| Region 2 (NJ & NY) | 458 | 9.6 | |
| Region 3 (DC, DE, MD, PA, VA & WV) | 311 | 6.5 | |
| Region 4 (AL, FL, GA, KY, MS, NC, SC & TN) | 190 | 4.0 | |
| Region 5 (IL, IN, MI, MN, OH & WI) | 460 | 9.7 | |
| Region 6 (AR, LA, NM, OK & TX) | 612 | 12.9 | |
| Region 7 (IA, KS, MO &NE) | 89 | 1.9 | |
| Region 8 (CO, MT, ND, SD, UT & WY) | 410 | 8.6 | |
| Region 9 (AZ, CA, HI & NV) | 1236 | 26.0 | |
| Region 10 (AK, ID, OR & WA) | 486 | 10.2 | |
| Total | 4755 | 100% | |
| Practices ¹ | Food Donation | 3079 | 90.7 |
| FWC | 2785 | ||
| FWC & FRC | 305 | ||
| Source Reduction | 2603 | 76.7 | |
| FWC | 2377 | ||
| FWC & FRC | 226 | ||
| Collaboration/ Partnership | 2240 | 66.0 | |
| FWC | 2240 | ||
| FWC & FRC | 0 | ||
| Compost | 1062 | 31.3 | |
| FWC ² | 809 | ||
| FWC & FRC ³ | 253 | ||
| Animal Feed | 883 | 26.0 | |
| FWC | 658 | ||
| FWC & FRC | 225 | ||
| Biodiesel | 896 | 26.4 | |
| FWC | 672 | ||
| FWC & FRC | 224 |
¹ Total participants n = 3393, not including FRC participants and missing data. ² FWC participants n = 3079. ³ FWC & FRC participants n = 314.
Table 2.
Food Waste practices by regions.
| Region | Practice | Frequency | FWC Sample Percent |
|---|---|---|---|
| Region 1 (n = 391) | Compost | 173 | 44.2 |
| Food Donation | 376 | 96.2 | |
| Animal Feed | 171 | 43.7 | |
| Source Reduction | 342 | 87.5 | |
| Collaboration/Partnership | 157 | 40.2 | |
| Biodiesel | 171 | 43.7 | |
| Region 2 (n = 288) | Compost | 53 | 18.4 |
| Food Donation | 287 | 99.6 | |
| Animal Feed | 53 | 18.4 | |
| Source Reduction | 150 | 52.1 | |
| Collaboration/Partnership | 96 | 33.3 | |
| Biodiesel | 53 | 18.4 | |
| Region 3 (n = 239) | Compost | 4 | 1.6 |
| Food Donation | 234 | 97.9 | |
| Animal Feed | 0 | 0 | |
| Source Reduction | 200 | 83.7 | |
| Collaboration/Partnership | 198 | 82.8 | |
| Biodiesel | 0 | 0 | |
| Region 4 (n = 66) | Compost | 2 | 3.0 |
| Food Donation | 57 | 86.4 | |
| Animal Feed | 1 | 1.5 | |
| Source Reduction | 15 | 22.7 | |
| Collaboration/Partnership | 3 | 4.5 | |
| Biodiesel | 0 | 0 | |
| Region 5 (n = 397) | Compost | 96 | 24.2 |
| Food Donation | 287 | 72.3 | |
| Animal Feed | 22 | 0 | |
| Source Reduction | 247 | 62.2 | |
| Collaboration/Partnership | 184 | 46.3 | |
| Biodiesel | 0 | 0 | |
| Region 6 (n = 235) | Compost | 1 | 0.4 |
| Food Donation | 230 | 97.9 | |
| Animal Feed | 0 | 0 | |
| Source Reduction | 216 | 91.9 | |
| Collaboration/Partnership | 215 | 91.5 | |
| Biodiesel | 1 | 0.4 | |
| Region 7 (n = 23) | Compost | 0 | 0 |
| Food Donation | 18 | 78.3 | |
| Animal Feed | 0 | 0 | |
| Source Reduction | 10 | 43.5 | |
| Collaboration/Partnership | 6 | 26.1 | |
| Biodiesel | 0 | 0 | |
| Region 8 (n = 309) | Compost | 28 | 9.1 |
| Food Donation | 307 | 99.4 | |
| Animal Feed | 0 | 0 | |
| Source Reduction | 177 | 57.3 | |
| Collaboration/Partnership | 168 | 54.4 | |
| Biodiesel | 0 | 0 | |
| Region 9 (n = 993) | Compost | 662 | 66.7 |
| Food Donation | 879 | 88.5 | |
| Animal Feed | 628 | 62.2 | |
| Source Reduction | 837 | 84.3 | |
| Collaboration/Partnership | 804 | 81 | |
| Biodiesel | 663 | 66.8 | |
| Region 10 (n = 452) | Compost | 43 | 9.5 |
| Food Donation | 415 | 91.8 | |
| Animal Feed | 8 | 1.8 | |
| Source Reduction | 409 | 90.5 | |
| Collaboration/Partnership | 409 | 90.5 | |
| Biodiesel | 8 | 1.8 |
Table 3.
Food recovery practices by category.
| Practice | Category | Frequency (Sample Size) | Sample Percentage |
|---|---|---|---|
| Food Donation | Food Stores | 2545 (2554) | 99.6 |
| Government | 2 (7) | 28.6 | |
| Hotels/Resorts/Clubs | 5 (5) | 100 | |
| K-12 Schools | 155 (284) | 54.6 | |
| Manufactures/Processors | 32 (37) | 86.5 | |
| Restaurants/Cafés/Cafeterias | 145 (260) | 55.8 | |
| Sports/Entertainment venue | 23 (30) | 76.7 | |
| Universities/Colleges | 149 (172) | 86.6 | |
| Farmers/producers | 6 (7) | 87.2 | |
| Health Care | 2 (5) | 40.0 | |
| Other | 25(33) | 75.8 | |
| Source Reduction | Food Store | 2,458 (2554) | 96.2 |
| K-12 Schools | 136 (284) | 47.9 | |
| Manufactures/Processors | 1 (37) | 2.7 | |
| Universities/Colleges | 8 (172) | 4.7 | |
| Collaboration/Partnership | Food Store | 2,232 (2554) | 87.4 |
| Universities/Colleges | 7 (171) | 4.1 | |
| Farmers/producers | 1 (7) | 14.3 | |
| Compost | Food Store | 831 (2554) | 32.5 |
| Government | 4 (7) | 57 | |
| Hotels/Resorts/Clubs | 0 (5) | 0 | |
| K-12 Schools | 148 (284) | 52.1 | |
| Manufactures/Processors | 4 (37) | 10.8 | |
| Restaurant/Café/Cafeteria | 42 (260) | 16.2 | |
| Sports/Entertainment | 7 (30) | 23.3 | |
| Universities/Colleges | 17 (172) | 9.9 | |
| Farmers/producers | 1 (7) | 14.3 | |
| Health Care | 3 (5) | 60 | |
| Other | 5 (33) | 15.2 | |
| Animal Feed | Food Store | 823 (2554) | 32.2 |
| Government | 1 (7) | 14.2 | |
| K-12 Schools | 54 (284) | 19.0 | |
| Manufactures/Processors | 1 (37) | 2.7 | |
| Farmers/producers | 1 (7) | 14.3 | |
| Other | 2 (33) | 6.1 |
© 2018 by the authors. Licensee MDPI, Basel, Switzerland. This article is an open access article distributed under the terms and conditions of the Creative Commons Attribution (CC BY) license (http://creativecommons.org/licenses/by/4.0/).
Share and Cite
MDPI and ACS Style
Chen, C.R.; Chen, R.J.C. Using Two Government Food Waste Recognition Programs to Understand Current Reducing Food Loss and Waste Activities in the U.S. Sustainability 2018, 10, 2760. https://doi.org/10.3390/su10082760
AMA Style
Chen CR, Chen RJC. Using Two Government Food Waste Recognition Programs to Understand Current Reducing Food Loss and Waste Activities in the U.S. Sustainability. 2018; 10(8):2760. https://doi.org/10.3390/su10082760
Chicago/Turabian StyleChen, C. Rita, and Rachel J. C. Chen. 2018. "Using Two Government Food Waste Recognition Programs to Understand Current Reducing Food Loss and Waste Activities in the U.S." Sustainability 10, no. 8: 2760. https://doi.org/10.3390/su10082760
Note that from the first issue of 2016, this journal uses article numbers instead of page numbers. See further details here.