Article

Economic Transition and Changing Location of Manufacturing Industry in China: A Study of the Yangtze River Delta

1
Key Laboratory of Watershed Geographic Sciences, Nanjing Institute of Geography and Limnology, Chinese Academy of Sciences, Nanjing 210008, China
2
University of Chinese Academy of Sciences, Beijing 100049, China
3
Key Research Institute of Yellow River Civilization and Sustainable Development & Collaborative Innovation Center for Yellow River Civilization of Henan Province, Henan University, Kaifeng 475001, China
4
Department of Geography, University of Utah, Salt Lake City, UT 84112-9155, USA
5
LSC, NCMIS, Academy of Mathematics and Systems Science, Chinese Academy of Sciences, Beijing 100190, China
*
Author to whom correspondence should be addressed.
Sustainability 2018, 10(8), 2624; https://doi.org/10.3390/su10082624
Submission received: 17 June 2018 / Revised: 13 July 2018 / Accepted: 23 July 2018 / Published: 26 July 2018

Abstract

:
Industrial restructuring is widely considered an important force in regional economic growth and sustainable development. With increased globalization and economic transition, a dramatic industrial restructuring has been taking place in China. Applying geographically weighted shift-share model (GW-SSM) and geographically and temporally weighted regression model (GTWR), we analyze (re)location dynamics and determinants of the manufacturing industry in the Yangtze River Delta (YRD) from 1999 to 2013, with particular attention to the implications of economic transition and institutional restructuring. We find that high-tech and capital-intensive manufacturing industries agglomerated in coastal cities, while labor-intensive and resource-based sectors have become spatially more dispersed to peripheral areas. We also find that the development of service and high-tech industries, rising labor costs, and more strict environmental regulations have facilitated the geographic dispersion of labor- and pollution-intensive industries. Moreover, regions with advantages in intermediate goods, preferential policies, and urbanization economies are attractive to capital- and technology-intensive manufacturing industries. Our research suggests that development policies should be tailored to specific regions to promote local production and innovative networks and make manufacturing industries more competitive.

1. Introduction

Since the reforms and opening-up in the late 1970s, China has undergone drastic economic growth and spatial restructuring. In particular, the rapid growth of manufacturing output and productivity have ignited the imaginations of scholars on the “China miracle” phenomenon [1]. Yet, the “China miracle” has mostly taken place in coastal regions, resulting in large regional inequalities in economic development and social welfare [2,3,4,5]. In 2013, China accounted for more than 20% of the global manufacturing output, however, approximately 50% of manufacturing output and employment was concentrated in the southeast coastal regions, such as the Yangtze River Delta (YRD) and the Pearl River Delta (PRD). Moreover, the resource-intensive industrialization model that China pursued has resulted in increasingly severe environmental pollution and ecological deterioration, which have endangered regional sustainable development [6,7].
In recent years, the “China miracle” and its developmental trajectories have undergone remarkable transformation in the context of economic and institutional transition, namely globalization, marketization, decentralization [8,9], and urbanization [10]. This transitional phase has also been accompanied by the structural adjustment and spatial restructuring of manufacturing industries at multiple geographical scales in China [11,12]. In order to pursue industrial upgrading and sustainable economic growth, more-developed coastal regions and major metropolises have built new regional advantages for the development of strategic, innovative, and profitable industries [13,14]. Meanwhile, the rising production costs and relatively strict environmental regulations (ERs) have led to the relocation of low-end manufacturers from coastal metropolises (e.g., Shanghai) to their neighboring areas or inland China [15,16]. This restructuring process of China’s industry has contributed to the improvement of industrial competitiveness, which may play a critical role in the development of less developed regions in China [7,14]. However, existing studies have indicated the problem of the geographical dispersion of industrial pollution [17]. In this respect, the restructuring of China’s industrial landscape has profoundly affected regional eco-environment and sustainable development. Industrial pollution tends to increasingly concentrate in less-developed regions or “pollution havens” where ERs are relatively lax [17,18].
A rich body of literature has examined the changing spatial pattern of China’s manufacturing industries, and its determinants and locational implications [18,19,20]. In particular, the transition of industries in coastal China has also aroused increasing academic interests [15,21,22,23]. However, empirical studies of the restructuring of industrial landscape at interurban and intra-regional scales in China are quite limited, despite the increasing impacts of this issue on regional disparities in economic growth and environmental performance [6,16]. The impacts of the urbanization process on industrial upgrading and spatial restructuring have also partly escaped scholarly attention in China [24,25]. In addition, with the Chinese decentralization process, unique regional advantages, and mutual competition have profoundly affected industrial distribution, which calls for more scholarly investigation.
Given the importance of industrial (re)location dynamics in regional inequality and sustainable development, this study aims to examine the following research questions: (1) What are the regional and industrial characteristics of the changing distribution of manufacturing industries in the YRD? (2) How do factors related to the transitional contexts (i.e., globalization, marketization, decentralization, and urbanization) affect the distribution of the manufacturing industries? (3) How has the relative importance of influential factors varied across regions and industrial sectors? We use manufacturing and other socioeconomic data at a prefecture level. This study introduces a new method—the geographically weighted shift-share model (GW-SSM)—to depict spatial, temporal, and sectoral heterogeneities in manufacturing (re)distribution. The temporally weighted regression model (GTWR) is used to estimate driving mechanisms derived from economic transition, institutional transformation, and regional restructuring. This research will contribute to the literature through uncovering the new evidences about industrial (re)location dynamics at a finer geographical scale, and will advance our understanding of the restructuring trajectories in transitional economies. Our findings may also generate some policy implications about industrial development and sustainable development.

2. Research Background and Conceptual Framework

2.1. Literature Review

The spatial pattern, driving factors, and consequences of industrial location have generated much scholarly debate [26]. Conceptions and theories related to industrial location can be traced back to location theory, and the neoclassical perspective holds that industrial agglomeration is largely driven by the “First Nature” advantages, such as resource endowment, market conditions, labor, and transportation costs [27]. Responding to the criticism of neoclassical assumptions, new economic geography (NEG) and institutional economic geography (IEG) have emerged as powerful alternatives for scholarly investigation of industrial location [22].
The NEG literature is based on the notions of increasing returns to scale, imperfect competition, and circulative accumulation [28], and highlights the impacts of the “Second Nature” advantages, including home market effect, industrial linkages and agglomeration economies, on industrial location [29,30]. Specifically, scholars have interpreted the geographical concentration and dispersion of manufacturing industries as being the result of two forces: centripetal force (e.g., market-size effects, thick labor markets, pure external economies) and centrifugal force (e.g., immobile factors, land rents, pure external diseconomies) [28,31].
On the other hand, with the processes of institutional and relational ‘turns’ in the field of economic geography, the IEG, and new regionalism literature recognize the increasingly critical role that untraded independence, socioeconomic embeddedness, and local assets play in industrial location [22]. Theories of industrial districts and clusters highlight the impacts of localized economies, innovative milieu, and institutional context on industrial location and performance [32,33]. Intermediate input sharing, skilled labor pools, untraded interdependences, and knowledge spillovers are considered as the driving forces of industrial agglomeration [34]. Evolutionary economic geography highlights the influences of institutional context and external economics on industrial location [35], and functional, cognitive, and political lock-ins are more likely to trigger industrial relocation [36]. In addition, the theories of global production networks (GPNs) and global value chains (GVCs) emphasize the dynamic interactions among firm performance, industrial linkages, and local context by bringing in industrial upgrading and strategic coupling [37,38].
While seeking to investigate the geographical agglomeration of manufacturing industries, scholars increasingly focus on regional inequality and sectoral heterogeneities [39]. An extensive literature has indicated that manufacturers are unevenly distributed but are concentrated in certain places for agglomeration economies and regional competiveness [30,40]. Considering industrial heterogeneities, low-tech industries tend to pursue cost-saving effects and then concentrate in peripheral areas, whereas high-tech firms pay more attention to skilled labor and knowledge spillovers in metropolitan regions [12,41]. Furthermore, technology-intensive manufacturers are more likely to co-agglomerate with service industries for the intermediate demand and producer service [42]. Another issue that has attracted much attention in the literature is the influence of transitional institutions on industrial location. Scholars argued that industrial location is the outcome of firms’ negotiation with government, labor unions, and other institutional agents with regard to policies, wages, industrial infrastructures, and so on [43]. Notably, industrial geography has been largely shaped by various economic policies, including tax reform, financial incentives, and local protectionism [44]. Labor welfare, pro-business, and regulatory environment have also contributed to the locational choices of manufacturers [12].
As the “World Factory of Manufacturing”, the restructuring of the industrial landscape and related driving forces in China have attracted increasing scholarly interest [13]. There exists substantial geographical and sectoral heterogeneities with regards to the restructuring of China’s manufacturing distribution [14]. Globalized and high-tech industries in China are highly concentrated in coastal regions, while low-end industries tend to be in inland regions [45]. The (re)location of Chinese manufacturing at a finer geographical scale has also attracted extensive attention from scholars [11,24,46]. There is a consensus that agglomeration economies and other “First and Second Nature” advantages have contributed to the landscape of Chinese industries, but the institutional context has increasingly profound impacts on the reshaping of industrial distribution in transitional China [1,14].
Since the 1980s, China has undergone dramatic economic growth and institutional evolution—namely globalization, marketization, and decentralization—and the triple transitional process has deeply influenced factors allocation, firm strategies, regional advantages, and industrial geography [8,47]. Scholarly efforts have examined the impacts of globalization, foreign direct investment (FDI) and trade, and networks of foreign invested enterprises (FIEs) on Chinese industrial location [48,49]. Studies also paid particular attention to the significance of entrepreneurship, incentive policies, and regulations in firm organization and industrial location [50,51]. Existing studies indicated that industrial policies and local protectionism have promoted industrial specialization and regional concentration of China’s manufacturing [44]. Many studies have also investigated the relationship between China’s urbanization (e.g., urban expansion and land use change) and manufacturing spatial restructuring [24,52]. In addition, the locational choices of manufacturing with different industrial characteristics respond diversely to contextual changes [47]. However, with the continuing transition of the Chinese economy and institutions, the changing distribution and determinants of manufacturing industries will show some emerging changes, which deserve more scholarly investigation, as well as more innovations in conceptual framework and empirical methodologies.

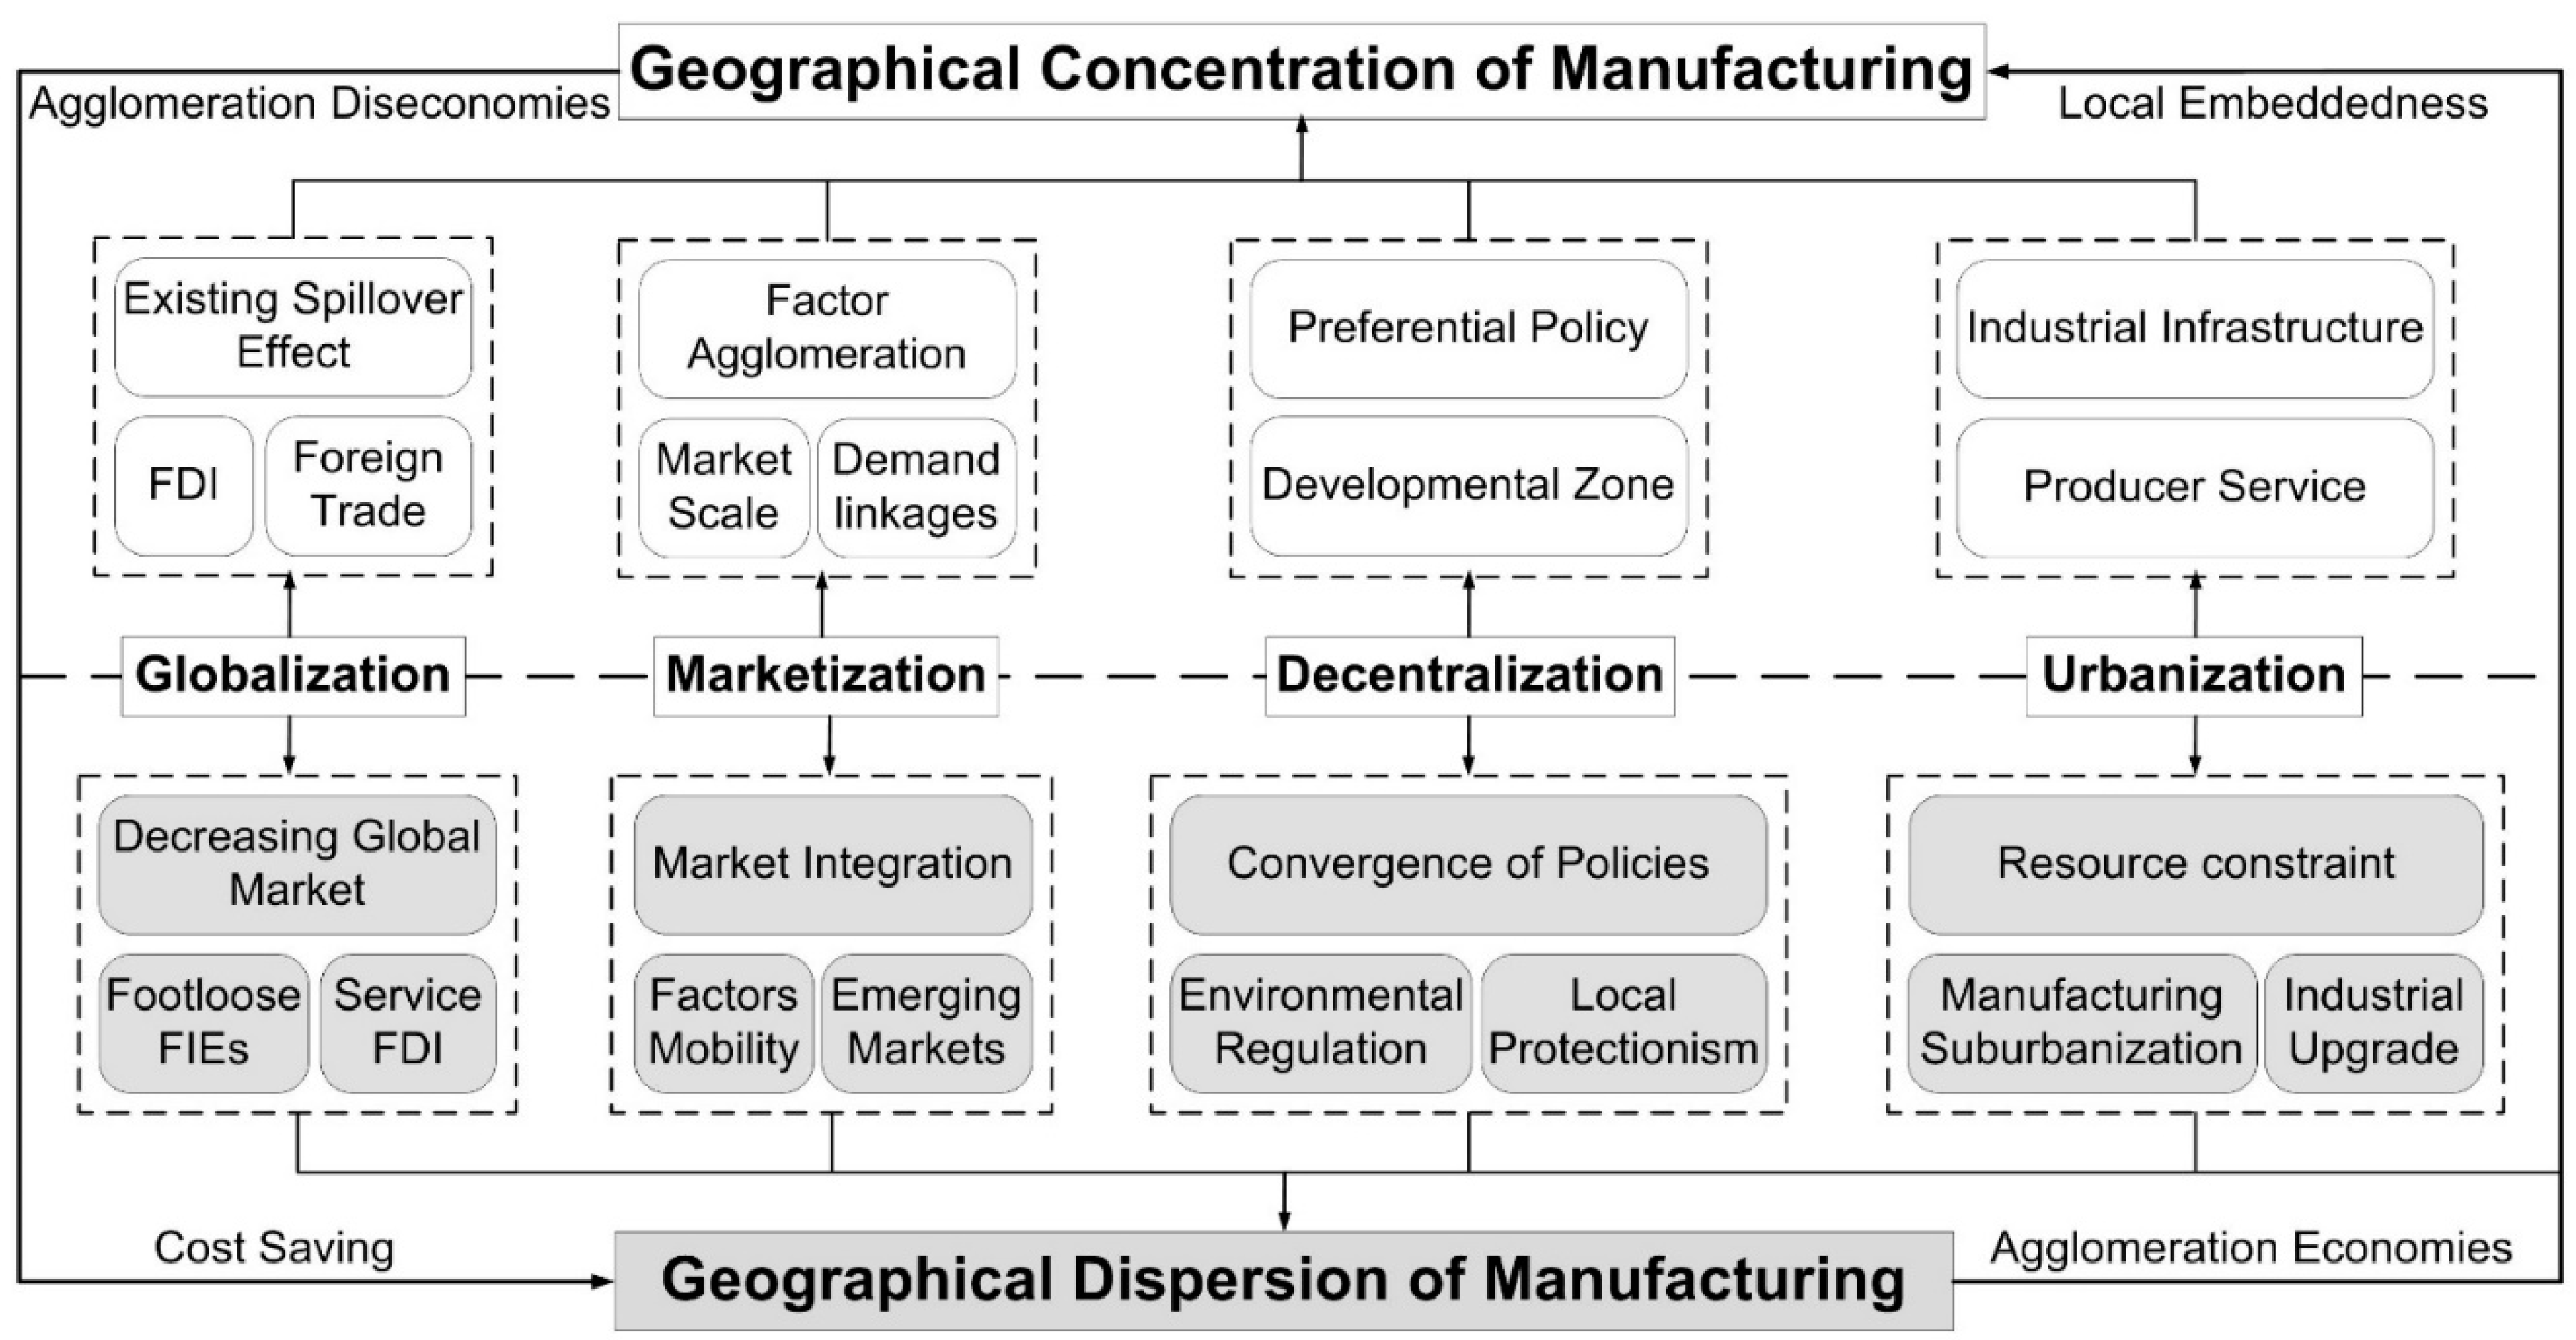
2.2. Conceptual Framework

China has been undergoing dramatic manufacturing upgrading and spatial restructuring, and the new geographical and industrial dynamics might be different from those in earlier periods or other transitional economies [1]. He, Wei, and Xie (2008), who developed the triple transitional framework through the analysis of industrial distribution, find that the framework of globalization, marketization and decentralization could be applied to examine geographical concentration and dispersion of manufacturing industries in China. However, given the significantly changing transitional context, this paper tries to develop the framework for analyzing the changing distribution of Chinese manufacturing industries by bringing in the urbanization process and future trends (Figure 1).
First, economic globalization and open door policies have enabled China to be increasingly integrated into the globalized economy, which has changed China’s industrial location and performance primarily through the effectiveness of foreign investment and trade [53,54]. FDI, FIEs, and export-oriented industries tend to locate in places with proximity to international markets, which has led to the increasing agglomeration of relevant manufacturers in China’s coastal regions since the early 1990s [2]. It is also found that locational preferences, industrial linkages, and knowledge spillover of existing FIEs might help coastal regions reinforce self-agglomeration, and contribute to the formation of new industrial clusters [55]. However, with the shrinking demands of global markets and rising production cost in coastal regions, footloose FIEs and export-oriented manufacturers have relocated their business operations from the coastal regions to inland China [21,23]. In addition, service FDI has been increasingly agglomerated in the metropolis, which is reinforcing the dispersion of labor-intensive and low-tech manufacturing FIEs [56].
Second, the marketization process has played an increasingly important role in resource allocation, firm dynamics, and industrial location in China. With the deepening of China’s economic reform, industrial agglomeration has been increasingly driven by market forces, such as cost minimization, scale economies, and industrial linkages [2], rather than socialist ideology, national defense, and economic pragmatism in Mao’s era [8]. So Chinese manufacturing industries were found increasingly concentrated in the coastal regions and metropolitan areas, which have initially promoted market-oriented economic reform [54]. On the other hand, more serious market competition is likely to kick many inefficient manufacturers out of the coastal regions where most industries congregate [20]. With the further integration of domestic markets, factor mobility and emerging markets will further encourage some manufacturers to relocate from China’s coastal regions to the inland areas where the cost-effective advantages are relatively stronger [14].
Third, the restructuring of manufacturing distribution has also been influenced by the decentralization of power and decision-making in China [2]. Local governments usually implement preferential policies and establish development zones (DZs) to create a friendly investment environment for the geographical concentration of manufacturers [21]. However, fiscal decentralization has also prompted local governments to protect profitable industries, as well as state-owned enterprises (SOEs), which might result in the geographical dispersion of related manufacturing industries [57]. In addition, regional restructuring and competition has facilitated the convergence of industrial incentive policies and regional advantages, which has largely contributed to the spatial dispersion of Chinese manufacturing industries [16]. More recently, with the continuing transition of China’s economy, the relocation of Chinese manufacturing industries is also a response to government’s initiatives to promote industrial upgrading and environmental protection in developed regions [17].
Fourth, the rapid urbanization process has been highlighted in exiting research as a key factor that has reshaped the industrial landscape in China [25,46,58]. Firms generally prefer locations with strong urbanization economies, which are generated by the sharing of sufficient industrial infrastructure, diversified market demands, and specialized producer services [59]. It is found that Chinese manufacturing industries are concentrated in highly urbanized areas, such as the YRD and the PRD [60]. On the other hand, the new type of urbanization has emphasized ecologic protection and efficient urban growth, which might reinforce the suburbanization of pollution-/labor-intensive and low-tech manufacturers in urbanized areas [24]. Meanwhile, urban governments have initiatives to develop service and strategic industries, which have also contributed to the geographical dispersion of low-end manufacturing industries [61].
Finally, the causal mechanisms of geographical concentration and dispersion of manufacturing industries are interactive. Agglomeration diseconomies, such as congestion costs and environmental pollution, are inevitable in the spatial concentration of manufacturing [16]. These negative externalities may compel firms to relocate their business to other locations that have emerging markets, skilled labor, and policy incentives [31]. In this respect, Chinese industries have become spatially more dispersed to the interior region. On the other hand, local assets also play an increasingly important role in promoting industrial embeddedness and competitive advantages [55]. Therefore, some manufacturing industries are still highly concentrated in the coastal region in order to acquire locational, institutional, and technological advantages. Overall, the multiple transitional contexts in China have profoundly changed the place-specific attributes, and their influences on the geographical concentration and dispersion of manufacturing industries. Yet, the impacts of these place-specific factors on industrial location may vary across regions and sectors, which calls for more empirical investigations.

3. Data and Methodology

3.1. Study Area

Since China’s reform, the YRD has been the epitome of Chinese industrialization, contributing to the “China miracle” and global development [60]. However, its export-oriented industrialization trajectory and industrial landscape have been reshaping in response to the transitional context, which has attracted extensive attention from scholars and policy-makers [22]. The investigation of industrial geography in China will also contribute to our understanding of the relationship between industrial restructuring and regional sustainable development in other newly industrializing economies (NIEs). Specifically, this paper conducts an empirical research in the YRD, which encompasses Shanghai (SH), Jiangsu (JS), Zhejiang (ZJ), and Anhui (AH), a total of 41 sampled cities. Covering 354,000 square kilometers, or 3.7% of China’s territory, the region accounted for one-sixth of China’s population and 25% of China’s GDP in 2013 (Figure 2).
To identify spatial patterns and the driving forces of changes in the location of manufacturing in the core and peripheral regions, sample cities are grouped into nine sub-regions according to administrative divisions and their industrial developmental levels. As developed regions, Shanghai, Southern Jiangsu, and Northern Zhejiang are classified into core regions. The core YRD has taken the lead in industrial expansion and upgrading, which has resulted in increasing decentralization of low-end industries [62]. On the other hand, this study classifies less-developed regions—namely Central Jiangsu, Northern Jiangsu, Southern Zhejiang, Northern Anhui, Central Anhui, and Southern Anhui—into peripheral regions, and these regions tend to build their own advantages to attract industries from the core YRD.

3.2. Data

To analyze the spatiotemporal pattern and driving mechanism of manufacturing in the YRD, we collect various socio-economic data of the sampled cities from 1999 to 2013, which are mainly obtained from the China City Statistical Yearbook (CCSY), and statistical yearbooks of the sampled cities. Based on China’s National Economic Sector Classification (GB/4754-2011), and considering data availability, we build a dataset including a total of 26 two-digit manufacturing sectors. Manufacturing industries include food processing (S13); food manufacturing (S14 + S16); beverage manufacturing (S15); textiles (S17); garment, shoe, and hat making (S18); leather, fur, and down products (S19); timber processing and wood, bamboo, and grass products (S20); furniture making (S21); papermaking and paper products (S22); printing and copying (S23); cultural, educational, and sports goods (S24); petroleum refining, coking, and nuclear processing (S25); chemical materials and chemical products (S26); medical and pharmaceutical products (S27); chemical fiber (S28); rubber and plastic products (S29+S30); nonmetal mineral products (S31); ferrous metal smelting and processing (S32); nonferrous metal smelting and processing (S33); fabricated metal products (S34); general machinery (S35); special equipment (S36); transportation equipment (S37); electrical machinery and equipment (S39); telecommunication, computer, and other electronic equipment (S40); and instruments, meters and office machinery (S41). In the existing studies, computer, semiconductor, machinery manufacturing are usually grouped in capital- and technology-intensive industries, while clothing, footwear, and toys are regarded as labor-intensive industries [63]. Therefore, we select S18, S26, S37, and S40 as labor-, pollution-, capital-, and technology-intensive sectors, respectively.

3.3. Methodology

3.3.1. Geographically Weighted Shift-Share Model (GW-SSM)

The shift-share model (SSM) is an important method for depicting economic structure and regional development. The classical SSM decomposes the increment of an industry into national/regional effect (NE), sector-mix effect (SE) and competitive or region-shift effect (CE). If x i j indicates the initial output amount of industry i in place j , and x i j represents the industrial output at time t, the increasing output of industry i in place j can be decomposed as Equation (1).
  x i j x i j = N E + S E + C E = x i j r + x i j ( r i r ) + x i j ( r i j r i )  
where i   = 1, 2, …, R and j   = 1, 2, …, S, r = i = 1 R j = 1 S ( x i j x i j ) i = 1 R j = 1 S x i j , r i = j = 1 S ( x i j x i j ) j = 1 S x i j , r i j = x i j x i j x i j . r stands for the all-sector growth rate in the whole nation/region, r i and r i j stand for the growth rate of industry i in the whole nation/region and place j , respectively.
Although classical shift-share analysis highlights the regional-national comparison, it deemphasizes interregional interaction and the heterogeneity of economic growth in different periods [64]. Based on the classical SSM and shift-share with a spatial structure [64], we highlight the process of industrial upgrading and regional restructuring and introduce the effects of regional interaction and industrial/sectoral interaction. We then propose a new extension of SSM, a geographically weighted shift-share analysis model. We recognize six combined effects in this decomposition.
a
National/regional effect (NE), i.e., x i j r . This effect indicates the growth of industry i in city j based on the national/regional all-sector growth rate.
b
Neighbor-regional-shift effect (NRSE), i.e., x i j ( r v j r ) . This effect represents the difference between all industries in the city j ’s neighbor and those in the entire region.
c
Neighbor industry-mix effect (NIME), i.e., x i j ( r i v j r v j ) , which manifests industry i ’s growth in the city j ’s neighbor compared to all industries in that area.
d
Urban-neighbor industrial shift effect (UNISE), i.e., x i j ( r i j r i v j ) , which indicates the difference in the growth shift of industry i between city j and its neighboring areas.
e
Urban-neighbor-shift effect (UNSE), i.e., x i j ( r j r v j ) , which indicates the growth of all industries in city j compared with their growth in j ’s neighbor.
f
Urban industry-mix effect (UIME), i.e., x i j ( r i j r j ) . This effect can be used to indicate industry i ’s growth compared with all industries inside city j .
In the expressions of these effects, x i j , x i j , r , and r i j are defined in the same ways as the Equation (1). In addition,   v j indicates neighbor cities of city j .   j and v j are all industries in city j and region v j , respectively. r v j and r j stand for all-sector growth rate in region v j and city j , r i v j represents the growth rate of industry i in region v j . Then, the increasing output of industry i in place j can be decomposed as Equations (2) and (3).
x i j x i j = x i j r + x i j ( r v j r ) + x i j ( r i v j r v j ) + x i j ( r i j r i v j )  
  x i j x i j = x i j r + x i j ( r v j r ) + x i j ( r j r v j ) + x i j ( r i j r j )  
where r j = i = 1 R ( x i j x i j ) i = 1 R x i j , r i v j = l v j w j l ( x i l x i l ) l v j w j l x i l , r v j = i = 1 R l v j w j l ( x i l x i l ) i = 1 R l v j w j l x i l , and w j l indicates the spatial weight matrix between city j and city l , l = 1, 2, …, S. For city j , W = [ 0   w 12 ·   ·   ·   w 1 S w 21   0   ·   ·   ·   w 2 S ·   ·   ·   ·   ·   ·   ·   ·   ·   ·   ·   ·   ·   ·   ·   ·   ·   ·   w S 1   w S 2 ·   ·   · 0 ] S × S and l = 1 S w j l = 1 . If the distance between the two cities is d j l , then w j l = ( 1 d j l k v j d j k ) / ( S 2 ) = k v j , k l d j k k v j d j k / ( S 2 ) , where k indicates the other city.
Combining Equations (2) and (3) with the same weight of 0.5, we obtain GM-SSM as
  x i j x i j = x i j r + x i j ( r v j r ) + 1 2 x i j ( r i v j r v j ) + 1 2 x i j ( r i j r i v j ) + 1 2 x i j ( r j r v j ) + 1 2 x i j ( r i j r j )  

3.3.2. Geographically and Temporally Weighted Regression (GTWR)

The GTWR can identify the unique coefficient for each spatial and time unit and avoid the heterogeneity of spatial and temporal effects [65]. Therefore, we introduce the GTWR model as a supplement to the panel data model in dynamic analysis of industrial (re)distribution. The model is calculated using the equation
Y i = β i (   u i ,     v i ,   t i ) + k β k (   u i ,     v i ,   t i ) X i k + ε i ,   i = 1 ,   2 ,   ,   n
where β i indicates the constant coefficient to each space-time city i with spatiotemporal coordinates of (   u i ,     v i ,   t i ) . β k represents the parameter of the independent variable X k at city i .

4. Spatiotemporal Pattern of Manufacturing Location in the YRD

4.1. Overall Spatiotemporal Pattern of Manufacturing Distribution

Figure 3 and Figure 4 and Table 1 depict the spatiotemporal restructuring of manufacturing landscape in the YRD. During 1999–2004, manufacturing gross output was centralized toward core regions, such as Southern Jiangsu and Northern Zhejiang, resulting in a stronger polarization effect. During 2004–2009, the share of gross outputs decreased in metropolitan areas (expect Suzhou), and that of some cities in Central Jiangsu and Anhui province have started to increase. During 2009–2013, the rise of peripheral regions—namely Central and Northern Jiangsu, Central Anhui—indicated the increasing geographical dispersion of manufacturers in the YRD. On the whole, manufacturing gross output was still highly concentrated in core regions, but the share of Shanghai and other metropolitan areas has decreased significantly, and share-increasing cities mostly located in Anhui province and Central and Northern Jiangsu. There existed an increasing trend that manufacturing industries have become spatially more dispersed to the peripheral YRD.

4.2. Sectoral Heterogeneities in Manufacturing Distribution

Table 2 shows the increasing and decreasing situation of different sectors’ output share from 1999 to 2013, implying significant regional and sectoral heterogeneities in the changing distribution of manufacturing industries. In Shanghai, the share of manufacturing gross output for most sectors has respectively decreased more than 5%. Meanwhile, the number of share-decreasing sectors in Southern Jiangsu and Northern Zhejiang has significantly increased, indicating the growing geographical dispersion of manufacturers. There also were few share-increasing sectors in the core YRD, which has been in line with the spatial agglomeration of some industries. On the other hand, the number of share-increasing sectors in Central Jiangsu, Northern Jiangsu, and Central Anhui presented drastic growth since the mid-2000s, which implies that some peripheral regions have built up new regional advantages in attracting industries and promoting industrial clusters. Meanwhile, most manufacturing sectors in Southern Zhejiang and Northern and Southern Anhui have undergone significant share-declines, which might be caused by the weakening comparative advantages in developing industries. This result indicates that the restructuring patterns and trajectories of manufacturing industries vary significantly across sub-regions and sectors in the YRD.
In addition, the GW-SSM is applied to further investigate the sectoral and regional heterogeneities with regard to the manufacturing distribution in the YRD. This section conducts a comprehensive analysis of the neighbor industry-mix effect (NIME), urban-neighbor industrial shift effect (UNISE), and urban industry-mix effect (UIME), which can indicate industrial comparative advantages among proximal regions and all sectors. We focus on the reshaped distribution of S18, S26, S37, and S40 (Figure 5, Figure 6, Figure 7 and Figure 8), which represent labor-, pollution-, capital-, and technology-intensive sectors, respectively.

4.2.1. Garment, Shoe, and Hat Making (S18)

During 1999–2004, S18 showed less competitiveness in comparison with other manufacturing sectors in the YRD, which might lead to industrial dispersion. During 2004–2009, competitive advantages of S18 in the core regions further declined, while that of most cities in the Central Jiangsu, Northern Jiangsu, and Anhui province showed the opposite trend. It is thus clear that garment industries have started to relocate to peripheral regions. Meanwhile, industrial expansion and upgrading might contribute to the growing comparative advantages and spatial concentration of S18 in a few core cities like Suzhou and Ningbo. During 2009–2013, the competitiveness of S18 declined drastically in the core YRD. Meanwhile, the development of S18 in Northern Jiangsu and Anhui province showed interregional and inter-sectoral competitiveness, indicating the increasing spatial agglomeration of the garment industry in some peripheral regions (Figure 5).

4.2.2. Chemical Materials and Chemical Products (S26)

During 1999–2004, the competitiveness of S26 in Shanghai declined dramatically, and cities with a competitive chemical industry were geographically dispersed in the YRD. During 2004–2009, the development of S26 in Shanghai and other metropolitan areas presented less competitiveness compared with other sectors and cities. However, with the enhancement of port and logistics infrastructures in coastal and riverside regions, chemical industries have increasingly concentrated in Central Jiangsu, Central Anhui, and other coastal cities for transportation and transaction cost-saving effects. During 2009–2013, the increasing interregional and inter-sectoral competitiveness of S26 in some coastal regions was in line with the spatial agglomeration of chemical industries. On the other hand, the comparative advantages of S26 decreased in most inland regions and cities alongside the Yangtze River, which was largely caused by increasing resource constraints, environmental regulations, and industrial relocation (Figure 6).

4.2.3. Transportation Equipment (S37)

During 1999–2004, the urban-neighbor industrial shift and urban industry-mix effect of S37 in Shanghai were negative, indicating the relocation of manufacturers. During 2004–2009, transportation equipment manufacturers tended to concentrate in Shanghai, Jiangsu, Zhejiang, and Central Anhui, except for some cities such as Nanjing, Wuxi, and Hefei. During 2009–2013, S37 started to relocate toward Shanghai and other metropolitan areas with better business environments. However, the competitiveness of S37 in other core regions, as well as Central Jiangsu and Central Anhui, have experienced a drastic decline, which further encouraged the geographical dispersion of related manufacturers. Meanwhile, regional hub cities in Northern Jiangsu and Northern Anhui have built their regional advantages, which have made them more attractive to transportation equipment industries (Figure 7).

4.2.4. Telecommunication, Computers, and Other Electronic Equipment (S40)

During 1999–2004, S40 was highly concentrated in Shanghai and other metropolises with increasingly positive competitive advantages. However, S40 grew slowly in other regions, which is implied by the negative urban-neighbor industrial shift and urban industry-mix effect. During 2004–2009, S40 was likely to decentralize from Shanghai on account of agglomeration diseconomies, but manufacturers tended to concentrate in Suzhou, Central Jiangsu, and Northern Jiangsu based on comparative advantages. During 2009–2013, the comparative advantages of S40 in Shanghai and Suzhou decreased drastically, indicating the spatial dispersion of relevant manufacturers. Furthermore, the growing competitiveness of S40 in the peripheral YRD has resulted in the geographical agglomeration of related manufacturers in the Central and Northern Jiangsu, as well as Southern Zhejiang and Anhui province (Figure 8).
In sum, garment, shoe, and hat making industries dispersed successively from the core to peripheral regions. Chemical industries increasingly agglomerated in coastal regions for cost-saving advantages and sufficient carrying capacity of eco-environment. Meanwhile, transportation and electronic equipment industries initially further concentrated toward metropolitan areas, but then decentralized from the core toward peripheral cities with well-established business environments.

5. Driving Factors and Mechanisms of Manufacturing Distribution

5.1. Variables and Models

Based on the conceptual framework, we model each city’s share of regional manufacturing output (SHARE) as a function of four sorts of variables, namely the effects of globalization, marketization, decentralization, and urbanization. First, as discussed above, economic globalization has reshaped China’s industrial distribution mainly through international FDI and trade [53]. We introduce two variables to measure such effects, which are the ratio of industrial gross output by foreign firms (FDI) and the economic dependence on international trade of each city (IXT). This paper also introduces a dummy variable (OPEN) to measure the extent to which a city (e.g., major metropolis or lower-tier city) is globally linked.
Second, places with optimal production cost and considerable market demands are increasingly attractive to Chinese manufacturing industries [9]. Decentralized industries are likely to pay more attention to proximal regions, which are located in integrated markets, for transaction cost saving [66]. This analysis introduces the relative wage level of skilled labor (WAGE), each city’s share of total retail sales in the YRD (RSCG), and a dummy variable for market integration (INTEG) to test the influences of market forces [19]. Additionally, industrial linkages play an important role in manufacturing agglomeration [31]. We identify the backward/forward sectors of S18, S26, S37, and S40 by applying the input–output analysis model (Table 3) and then use the share of gross industrial output of backward/forward sectors (INTER) to measure the intermediate demands.
Third, state-led decentralization, regional competition, and local protectionism have drastically reshaped China’s industrial landscape [14]. Local officials tend to value profit-, tax-, and technology-intensive industries more [11]. On the other hand, with the pressure of industrial upgrading and environmental protection, local governments might implement various regulations to facilitate the relocation of low-end industries [17]. This paper applies weighted sum strength of different policy levels (POL), the ratio of value-added tax to gross industrial output (TAX), and each city’s share of the total industrial wastewater (ENV) to define the aforementioned effects, respectively.
Last, manufacturers might locate in urbanized areas with high-efficiency industrial infrastructures and producer services for sharing agglomeration economies [59]. Generally, higher city investment in fixed assets would improve local infrastructures and the investment environment for manufacturers. Therefore, we introduce the share of total investment in fixed assets in the YRD (INVT) [58], and the ratio of service industry to GDP (SERV), to measure the impacts of the urbanization process on manufacturing distribution. Moreover, the ratio of urban population to the total resident population by city (URB) is used to measure the urbanization level. Categories and definitions of explanatory variables are presented in Table 4.
To examine the overall picture of driving factors and mechanisms of manufacturing (re)distribution, the explanatory variables are included in the following panel data model
  LnSHARE i t = α + k β k ln X k i t 1 + γ i + λ t + ε i t  
where i denotes cities, t denotes years (i = 1, 2, …, N, t = 1, 2, …, T). X represents the independent variables, and k is the number of variables. α is the constant term, εit stands for the stochastic disturbance term, and γi and λt represent city-fixed and time-fixed effects, respectively. To avoid the likely endogenous problems, we have lagged the independent variables by one year. Considering the stationarity of data, we transformed all explanatory variables into natural logarithms. In addition, considering the heterogeneity of spatial and temporal effects, we apply the GTWR model to investigate the spatiotemporally varying determinants of manufacturing distribution in the YRD.

5.2. Overall Picture of Driving Mechanisms

The Pearson’s correlations between independent variables are mostly moderate or weak, while few variables are highly correlated with each other (correlation coefficient of 0.7 or above). RSCG and INVT are significantly and strongly correlated with a coefficient of 0.88, and the coefficient between WAGE and POL is also greater than 0.7. Considering the possible multicollinearity problem, we conduct the collinearity diagnostics test of each explanatory variables in each regression. The VIF (variance inflation factor) values of RSCG, INVT, and INTER are mostly between 5 and 10, suggesting low or moderate multicollinearity. To mitigate multicollinearity problems, we separately test the importance of variables with high correlation coefficients and VIF values.
The regression results from the cross-section and period fixed-effects model are presented in Table 5. In model 0, most variables present excepted and significant coefficients, indicating that the context of economic and institutional transition could adequately explain the changing distribution of manufacturing industries. First, the access to international market and spillover effects of existing FDI promoted the spatial agglomeration of manufacturing in the YRD, as indicated by the positive and significant coefficients of FDI and IXT. Second, from the perspective of marketization, the marked positive coefficients of INTEG imply that the process of regional integration has made some cities more attractive than others in industrial agglomeration. In addition, significantly negative coefficients on TAX and SERV indicate that local protectionism and the rapid development of service industries in metropolitan areas have discouraged manufacturing concentration.
However, OPEN, POL, ENV, and URB have unexpected or insignificant coefficients in model 0. Considering the possible multicollinearity problems, we separately put the variables of WAGE, POL, RSCG, and INVT into Models 2–5 (Table 5). Except ENV and URB, the results of these five models are highly consistent with model 0 and our expectations. Increasing labor cost has resulted in manufacturing dispersion, as indicated by the significant and negative coefficients of WAGE. On the contrary, the significant and positive effects of RSCG signify that the emerging and increasing market demands have encouraged manufacturing concentration. Excluding variables with high VIF values, POL presents a significantly positive coefficient in model 1, implying that preferential policies have facilitated the geographical concentration of manufacturing. Moreover, urbanization economies (INVT) has a highly significantly positive coefficient, indicating that the improvement and sharing of industrial infrastructures have contributed to manufacturing agglomeration. On the other hand, the paradoxical coefficients of environmental regulations, urbanization level, and other proxies have indicated that the influences of economic transition on manufacturing distribution are increasingly complicated. Highlighting the spatiotemporal heterogeneities, we focus on the driving mechanisms of industrial (re)distribution across regions and sectors in the next two sections.

5.3. Regional Heterogeneities in Driving Mechanisms

By applying the GTWR model, this section analyzes how different dynamics of manufacturing (re)distribution are sensitive to geographical location and regional characteristics in transitional China. We make a distinction between the core and peripheral regions in the YRD. To mitigate possible multicollinearity problems, we separately test the effects of RSCG and INVT in models 1–2 (Table 6), and the statistical results, including a series of coefficients, is provided in Table 6.
First, most coefficients of variables about FDI and international trade present positive effects in the core and peripheral regions, implying that integration into the global economy has contributed to the geographical agglomeration of manufacturing in the YRD. The locational advantages are likely to result in many clusters of high-tech and high-value-added FIEs in coastal cities. However, most coefficients of OPEN present negative effects, indicating that footloose foreign investment and trade have contributed to industrial dispersion in metropolitan areas. After the 2008 financial crisis, inward FDI has been increasingly dominated by service industries in urban China. For instance, more than 65% of inward FDI has been invested in service industries in Shanghai. Therefore, FIEs and associated foreign trade in some manufacturing sectors suffered a drastic decline, resulting in the geographical dispersion of manufacturers to the peripheral regions.
Second, like the aforementioned overall mechanisms, most coefficients for labor cost in the core regions are negative, while that in the peripheral YRD present positive. The result signifies that rising labor cost has encouraged manufacturers, which are confronted with fierce market competition, to relocate to low-wage regions. The mean value of the coefficients on market scale and consumer potential is positive, which implies that emerging and increasing market demand are attractive to manufacturers. Meanwhile, most coefficients for the integration of domestic market are significantly positive, indicating that entry into an integrated market has more than profound impacts on industrial relocation and concentration in the YRD.
Third, results show that the process of decentralization has various influences on manufacturing distribution across regions. Half of the coefficients of preferential policies present negatively in the YRD, indicating that the convergence of industrial policies and incentives has facilitated manufacturing dispersion. However, POL has a negative effect in the peripheral YRD, which implies that most of incentive policies in Central Jiangsu, Northern Jiangsu, and Central Anhui have not strengthened their regional attractiveness to migrated manufacturers and new businesses. A certain proportion of coefficients for environmental regulation has a negative sign, signifying that environmental regulations have contributed to manufacturing dispersion, especially in the peripheral YRD. In contrast, the results indicate that environmental regulations show positive influences on manufacturing concentration in the core YRD. This is largely because metropolises and ecologically sensitive areas have protected the environment to attract more high-tech industries, and a few pollution-intensive industries have further agglomerated in the coastal cities. Furthermore, the parameters for local protectionism are negative in all regions and different models, which are consistent with the expected sign and panel data estimation.
Finally, almost all coefficients of urbanization economies and urbanization level are positive, demonstrating that industries have concentrated in urbanized areas for the well-established infrastructure, public service facilities, and high-quality residential environments. However, about 40% of the coefficients for urbanization economies are negative in the core YRD (model 0), and some coefficients for urbanization level also present negative sign. This result suggests that the process of urbanization, particularly urban renewal process and agglomeration diseconomies, have reinforced industrial suburbanization and relocation. On the other hand, coefficients for the development of service industries are expectedly negative (except the Model 2 in the peripheral YRD), signifying that the continuing industrial upgrading will kick many inefficient manufacturers out of urbanized areas.

5.4. Sectoral Heterogeneities in Driving Mechanisms

This section analyzes how different dynamics of manufacturing (re)distribution are sensitive to sectoral characteristics. S18, S26, S37, and S40 are selected as typical sectors, and the statistical results are provided in Table 7 by applying the GTWR model. Considering possible multicollinearity problems, we test the effect of RSCG, INVT, and INTER in Models 1–3 (Table 7), respectively.
The results imply that the selected variables have significantly different influences on manufacturing (re)distribution across typical sectors. First, the proportion of negative parameters for foreign investment and trade is relatively larger, indicating that integration into the global economy presented negative effects on industrial agglomeration with respect to garment, shoe, and hat making. Labor-intensive manufacturing FIEs are more likely to delocalize from the coastal and metropolitan areas in transitional China. For other sectors, more coefficients of variables for globalization are positive, especially for electronic equipment, indicating that the inward FDI and international trade have largely encouraged spatial agglomeration of capital- and technology-intensive sectors.
Second, as shown by having the most negative coefficients, labor cost has a critical impact on geographical dispersion of typical manufacturing sectors, with the exception of the garment industry. It does not mean that labor-intensive industries pay little attention to rising labor costs, but the rising cost of labor and land in the YRD has driven some manufacturers to relocate to Western China and even Southeast Asia, with its lower cost level. Results show that the geographical concentration of other typical sectors shows a positive relationship with the increased market scale and regional integration. Meanwhile, some coefficients for the variables about domestic market are negative, which signifies that some manufacturers might be inhibited by saturated demand and homogenized competition in the YRD. Additionally, as the theory predicts, the coefficients of industrial linkages have a positive influence on the spatial concentration of typical manufacturing sectors. In other words, manufacturers prefer to co-agglomerate with backward and forward industries.
Third, there are more positive coefficients for preferential policies with regard to transportation industries, indicating that local governments have incentives to promote the development of capital-intensive industries. This is because local governments still value economic investment and fiscal revenue more. The larger proportion of positive coefficients for POL with regard to electronic equipment industries also suggests that the development of technology-intensive industries is important for local governments. Environmental regulations also have different effects on manufacturing distribution across sectors. As pollution-intensive sectors, chemical industries agglomerated to regions with loose environmental regulations, which is indicated by the larger proportion of negative coefficients for ENV. The results also imply that the geographical dispersion of other typical industries has been driven by increasingly strict environmental regulations.
Last, the larger proportion of positive coefficients for urbanization economies and urbanization level confirms the importance of the process of urbanization, especially the improvement of the industrial infrastructure. High-tech industries pay more attention to urbanized areas with external economies and friendly investment environments in comparison with labor-intensive industries. The results also imply the negative effects of urbanization economies on labor-intensive manufacturers. In addition, estimated parameters of the development of service industries are various across sectors. The development of service economy has contributed to the geographical concentration of capital-intensive industries, in contrast with that of labor-intensive industries. With regard to the distribution of pollution- and technology-intensive industries, the impacts of the service economy differ significantly across sample cities, which is in line with our results presented in Table 6.

6. Conclusions and Discussion

The spatial restructuring of the Chinese manufacturing landscape is embedded in the unique context characterized by economic and institutional transition, and plays an increasingly critical role in regional sustainable development [14]. More recently, increasing production cost, decreasing international demands, strict environmental regulations, and regional competition have promoted the upgrading and relocation of the Chinese industries, which have reshaped the distribution of manufacturing industries in various sectors and at multiple spatial scales [9]. This study focuses on manufacturing (re)distribution at the intra-regional scale, and highlights the impacts of economic transition, institutional evolution, and regional restructuring. Specifically, we build a sectoral-prefecture socioeconomic database and introduce the GW-SSM and GTWR models to investigate the changing distribution of manufacturing industries and related driving forces in the YRD.
The location of manufacturing industries in China has been changing over time and this process has presented significant regional and sectoral variations [30]. Manufacturing output increasingly agglomerated to the core YRD before 2004, indicating a growing regional inequality in industrial development. Since 2004, however, there has been a significant tendency of geographical dispersion of manufacturing industries from the core to peripheral regions, which has also shown significant regional and sectoral heterogeneities. To be specific, the comparative advantages of labor-intensive, low-technology, and pollution-intensive sectors in the core regions have experienced significant decline, and related manufacturers tend to relocate to peripheral YRD to save costs. In contrast, capital- and technology-intensive sectors have increasingly agglomerated to the core YRD with regional advantages and industrial competitiveness.
Our findings are consistent with the conventional view that agglomeration economies and institutional transition have deeply restructured the intra-regional industrial landscape in China [14]. Especially, the transitional contexts—namely emerging changes in globalization, marketization, decentralization, and new-type urbanization—have played a critical role in reshaping manufacturing distribution. Growing inward service FDI and shrinking international trade have not only reinforced the spatial dispersion of labor-intensive and export-oriented industries, but have also contributed to the geographical concentration of high-tech firms in the metropolitan areas with regional advantages. Compared with agglomeration economies, market forces such as market integration, emerging market demands, and industrial linkages have been promoting the restructuring of China’s manufacturing distribution. More importantly, the unique institutions characterized by preferential policies, local protectionism, and environmental regulations—as well as the convergence of regional advantages—have profoundly promoted the geographical dispersion of manufacturing industries in transitional China [44]. Peripheral regions are more likely to build up comparative advantages for attracting manufacturers from the core YRD. In addition, the sharing of industrial infrastructures and other urbanization economies will facilitate the geographical concentration of industries in the highly urbanized areas, although the promotion of service industries in the new-type urbanization process could inhibit and suburbanize labor- and pollution-intensive manufacturers.
This study will contribute to the literature on industrial (re)location in the following aspects. First, this study proposes a four-dimensional conceptual framework for the spatial restructuring of industrial landscape, which integrates the urbanization process and other emerging trends into the triple transition framework [2,8]. Our framework can better uncover the relationship among transitional context, industrial (re)location, and regional sustainable development in China and other NIEs. In addition to the “First and Second Nature” advantages, we argue that state policies, local regulations, and regional integration and competition play an increasingly important role in China’s industrial geography. Second, this paper examines industrial (re)location choices within inter-city geographical areas of the YRD. We also highlight that industrial competitive advantages are profoundly influenced by the interactions among neighboring regions and relevant sectors. Third, this study introduces the GW-SSM, which is an improved form of the classical SSM, as an effective method for depicting industrial (re)distribution at an intra-regional scale. However, with the deepening transition of the Chinese economy, the spatial patterns, processes, and consequences of manufacturing development will present some new changes, which need more scholarly attention. Regional restructuring and competition have critical impacts on industrial (re)location in transitional China, which also calls for more empirical investigations.
In addition, this study can also generate some policy implications. In order to pursue regional economic growth and sustainable development, policy-makers should pay more attention to how to build up new regional advantages for promoting industrial clustering and upgrading. Thus, it is essential to adjust developmental trajectories and policies to suit specific regions. For the core YRD, efforts could be made to facilitate the industrial clustering of capital-intensive and high-tech manufacturing sectors and the development of producer services. In the less developed regions of the YRD, it is important to achieve the coupling of footloose FIEs with local assets. The enhancement of industrial embeddedness based on regional characteristics is critical to the sustainable development of related regions, as advocated by the literature on global production networks [38]. What is more, how to achieve dynamic strategic coupling between global production networks and regional development also deserve more attention from policy-makers and scholars.

Author Contributions

J.W. collected, prepared, and analyzed the data. Q.L. and F.Y. contributed to the methodologies. J.W. and Y.D.W. contributed to the conceptual framework and research design and wrote the paper.

Funding

This research was funded by the National Natural Science Foundation of China (41130750; 41671133; 41430637), the National Social Science Foundation of China (15BJL043), and the US National Science Foundation (1759746).

Acknowledgments

We would like to acknowledge the funding of the National Natural Science Foundation of China (41130750; 41671133; 41430637), National Social Science Foundation of China (15BJL043), and the US National Science Foundation (1759746). We would also like to thank Han Li, Jinlong Gao, and Komali Yenneti for their helpful comments.

Conflicts of Interest

The authors declare no conflict of interest.

References

  1. Wei, Y.D.; Liefner, I. Globalization, industrial restructuring, and regional development in China. Appl. Geogr. 2012, 32, 102–105. [Google Scholar] [CrossRef]
  2. He, C.; Wei, Y.D.; Xie, X. Globalization, institutional change, and industrial location: Economic transition and industrial concentration in China. Reg. Stud. 2008, 42, 923–945. [Google Scholar] [CrossRef]
  3. Liao, H.F.; Wei, Y.D. Space, scale, and regional inequality in provincial China: A spatial filtering approach. Appl. Geogr. 2015, 61, 94–104. [Google Scholar] [CrossRef] [Green Version]
  4. Wei, Y.D. Geography of inequality in Asia. Geogr. Rev. 2017, 107, 263–275. [Google Scholar] [CrossRef]
  5. Lin, J.; Yu, Z.; Wei, Y.D.; Wang, M. Internet Access, Spillover and Regional Development in China. Sustainability 2017, 9, 946. [Google Scholar] [CrossRef]
  6. Xiong, L.; Yu, C.; de Jong, M.; Wang, F.; Cheng, B. Economic Transformation in the Beijing-Tianjin-Hebei Region: Is It Undergoing the Environmental Kuznets Curve? Sustainability 2017, 9, 869. [Google Scholar] [CrossRef]
  7. Li, H.; Zhang, J.; Osei, E.; Yu, M. Sustainable Development of China’s Industrial Economy: An Empirical Study of the Period 2001–2011. Sustainability 2018, 10, 764. [Google Scholar] [CrossRef]
  8. Wei, Y.D. Decentralization, marketization, and globalization: The triple processes underlying regional development in China. Asian Geogr. 2001, 20, 7–23. [Google Scholar] [CrossRef]
  9. Zhu, S.; Lan, T. New economic geographies of manufacturing in China. Geogr. Compass 2016, 10, 470–481. [Google Scholar] [CrossRef]
  10. Chen, M.; Liu, W.; Lu, D. Challenges and the way forward in China’s new-type urbanization. Land Use Policy 2015, 55, 334–339. [Google Scholar] [CrossRef]
  11. Yang, C. Restructuring the export-oriented industrialization in the Pearl River Delta, China: Institutional evolution and emerging tension. Appl. Geogr. 2012, 32, 143–157. [Google Scholar] [CrossRef]
  12. Wei, Y.D.; Bi, X.; Wang, M.; Ning, Y. Globalization, economic restructuring, and locational trajectories of software firms in shanghai. Prof. Geogr. 2016, 68, 211–226. [Google Scholar] [CrossRef]
  13. Yang, C.; He, C. Transformation of China’s ‘World Factory’: Production Relocation and Export Evolution of the Electronics Firms. Tijdschr. Voor Econ. Soc. Geogr. 2017, 108, 571–591. [Google Scholar] [CrossRef]
  14. He, C.; Pan, F.; Chen, T. Research progress of industrial geography in China. J. Geogr. Sci. 2016, 26, 1057–1066. [Google Scholar] [CrossRef]
  15. Wei, Y.D.; Li, W.; Wang, C. Restructuring industrial districts, scaling up regional development: A study of the Wenzhou model, China. Econ. Geogr. 2007, 83, 421–444. [Google Scholar] [CrossRef]
  16. Liao, H.F.; Chan, R.C. Industrial relocation of Hong Kong manufacturing firms: Towards an expanding industrial space beyond the Pearl river delta. GeoJournal 2011, 76, 623–639. [Google Scholar] [CrossRef]
  17. Shen, J.; Wei, Y.D.; Yang, Z. The impact of environmental regulations on the location of pollution-intensive industries in China. J. Clean. Prod. 2017, 148, 785–794. [Google Scholar] [CrossRef]
  18. Liu, Y.; Wu, J.; Yu, D. Disentangling the Complex Effects of Socioeconomic, Climatic, and Urban Form Factors on Air Pollution: A Case Study of China. Sustainability 2018, 10, 776. [Google Scholar] [CrossRef]
  19. Wen, M. Relocation and agglomeration of Chinese industry. J. Dev. Econ. 2004, 73, 329–347. [Google Scholar] [CrossRef]
  20. Long, C.; Zhang, X. Patterns of China’s industrialization: Concentration, specialization, and clustering. China Econ. Rev. 2012, 23, 593–612. [Google Scholar] [CrossRef]
  21. Yang, C. Strategic coupling of regional development in global production networks: Redistribution of Taiwanese personal computer investment from the Pearl River Delta to the Yangtze River Delta, China. Reg. Stud. 2009, 43, 385–407. [Google Scholar] [CrossRef]
  22. Wei, Y.D. Beyond new regionalism, beyond global production networks: Remaking the Sunan model, China. Environ. Plan. C 2010, 28, 72. [Google Scholar] [CrossRef]
  23. Jiang, H.; Xu, W.; Zhang, W. Transportation Accessibility and Location Choice of Japanese-Funded Electronic Information Manufacturing Firms in Shanghai. Sustainability 2018, 10, 390. [Google Scholar] [CrossRef]
  24. Gao, J.; Yuan, F. Economic Transition, Firm Dynamics, and Restructuring of Manufacturing Spaces in Urban China: Empirical Evidence from Nanjing. Prof. Geogr. 2017, 69, 504–519. [Google Scholar] [CrossRef]
  25. Wei, Y.D.; Ewing, R. Urban Expansion, Sprawl and Inequality; Elsevier: New York, NY, USA, 2018. [Google Scholar]
  26. Pellenbarg, P.H.; Van Wissen, L.J.; Van Dijk, J. Firm migration. In Industrial Location Economics; McCann, P., Ed.; Edward Elgar Publishing: Cheltenham, UK, 2002; p. 110. [Google Scholar]
  27. Holl, A. Start-ups and relocations: Manufacturing plant location in Portugal. Pap. Reg. Sci. 2004, 83, 649–668. [Google Scholar]
  28. Krugman, P. What’s new about the new economic geography? Oxf. Rev. Econ. Policy 1998, 14, 7–17. [Google Scholar] [CrossRef]
  29. Krugman, P. Increasing returns and economic geography. J. Political Econ. 1991, 99, 483–499. [Google Scholar] [CrossRef]
  30. Fan, C.C.; Scott, A.J. Industrial agglomeration and development: A survey of spatial economic issues in East Asia and a statistical analysis of Chinese regions. Econ. Geogr. 2003, 79, 295–319. [Google Scholar] [CrossRef]
  31. Kranich, J. Agglomeration, vertical specialization, and the strength of industrial linkages. Pap. Reg. Sci. 2011, 90, 159–178. [Google Scholar] [CrossRef] [Green Version]
  32. Porter, M. Location and competitive and economic development: Local clusters in the global economy. Econ. Dev. Q. 2000, 14, 15–34. [Google Scholar] [CrossRef]
  33. Randelli, F.; Boschma, R. Dynamics of industrial districts and business groups: The case of the Marche region. Eur. Plan. Stud. 2012, 20, 1961–1974. [Google Scholar] [CrossRef]
  34. Storper, M.; Venables, A.J. Buzz: Face-to-face contact and the urban economy. J. Econ. Geogr. 2004, 4, 351–370. [Google Scholar] [CrossRef]
  35. Martin, R.; Sunley, P. Towards a developmental turn in evolutionary economic geography? Reg. Stud. 2015, 49, 712–732. [Google Scholar] [CrossRef]
  36. Hassink, R. The restructuring of old industrial areas in Europe and Asia. Environ. Plan. A 2005, 37, 571–580. [Google Scholar] [CrossRef] [Green Version]
  37. Coe, N.M.; Dicken, P.; Hess, M. Global production networks: Realizing the potential. J. Econ. Geogr. 2008, 8, 271–295. [Google Scholar] [CrossRef]
  38. Yeung, H.W.C.; Coe, N.M. Toward a dynamic theory of global production networks. Econ. Geogr. 2015, 91, 29–58. [Google Scholar] [CrossRef]
  39. Sjöberg, Ö.; Sjöholm, F. Trade liberalization and the geography of production: Agglomeration, concentration, and dispersal in Indonesia’s manufacturing industry. Econ. Geogr. 2004, 80, 287–310. [Google Scholar] [CrossRef]
  40. Flores, M.; Villarreal, A.; Flores, S. Spatial Co-location Patterns of Aerospace Industry Firms in Mexico. Appl. Spat. Anal. Policy 2017, 10, 233–251. [Google Scholar] [CrossRef]
  41. Liefner, I.; Brömer, C.; Zeng, G. Knowledge absorption of optical technology companies in Shanghai, Pudong: Successes, barriers and structural impediments. Appl. Geogr. 2012, 32, 171–184. [Google Scholar] [CrossRef]
  42. Meliciani, V.; Savona, M. The determinants of regional specialisation in business services: Agglomeration economies, vertical linkages and innovation. J. Econ. Geogr. 2015, 15, 387–416. [Google Scholar] [CrossRef]
  43. Okubo, T.; Tomiura, E. Industrial relocation policy, productivity and heterogeneous plants: Evidence from Japan. Reg. Sci. Urban Econ. 2012, 42, 230–239. [Google Scholar] [CrossRef]
  44. Zheng, D.; Kuroda, T. The impact of economic policy on industrial specialization and regional concentration of China’s high-tech industries. Ann. Reg. Sci. 2013, 50, 771–790. [Google Scholar] [CrossRef]
  45. Zhang, K.H. Globalization and regional industrial performance: Evidence from China. Pap. Reg. Sci. 2014, 93, 269–280. [Google Scholar] [CrossRef]
  46. Yuan, F.; Wei, Y.D.; Chen, W. Economic transition, industrial location and corporate networks: Remaking the Sunan Model in Wuxi City, China. Habitat Int. 2014, 42, 58–68. [Google Scholar] [CrossRef]
  47. He, C.; Zhu, S.; Yang, X. What matters for regional industrial dynamics in a transitional economy? Area Dev. Policy 2017, 2, 71–90. [Google Scholar] [CrossRef]
  48. Wei, Y.D.; Yuan, F.; Liao, H. Spatial mismatch and determinants of foreign and domestic information and communication technology firms in urban China. Prof. Geogr. 2013, 65, 247–264. [Google Scholar] [CrossRef]
  49. Zhu, S.; Pickles, J.; He, C. Global and Local Governance, and Industrial and Geographical Dynamics: A Tale of Two Clusters. In Geographical Dynamics and Firm Spatial Strategy in China; Springer: Berlin/Heidelberg, Germany, 2017; pp. 143–167. [Google Scholar]
  50. Guo, Q.; He, C.; Li, D. Entrepreneurship in China: The role of localisation and urbanisation economies. Urban Stud. 2016, 53, 2584–2606. [Google Scholar] [CrossRef]
  51. Chen, B.; Cheng, Y.-S. The Impacts of Environmental Regulation on Industrial Activities: Evidence from a Quasi-Natural Experiment in Chinese Prefectures. Sustainability 2017, 9, 571. [Google Scholar] [CrossRef]
  52. Zhang, L.; Yue, W.; Liu, Y.; Fan, P.; Wei, Y.D. Suburban industrial land development in transitional China: Spatial restructuring and determinants. Cities 2018, 78, 96–107. [Google Scholar] [CrossRef]
  53. Ge, Y. Globalization and industry agglomeration in China. World Dev. 2009, 37, 550–559. [Google Scholar] [CrossRef]
  54. Huang, H.; Wei, Y.D. Spatial inequality of foreign direct investment in China: Institutional change, agglomeration economies, and market access. Appl. Geogr. 2016, 69, 99–111. [Google Scholar] [CrossRef]
  55. Wei, Y.D.; Zhou, Y.; Sun, Y.; Lin, G.C. Production and R&D networks of foreign ventures in China: Implications for technological dynamism and regional development. Appl. Geogr. 2012, 32, 106–118. [Google Scholar]
  56. Xu, Z.; Yeh, A. Origin effects, spatial dynamics and redistribution of FDI in Guangdong, China. Tijdschr. Voor Econ. Soc. Geogr. 2013, 104, 439–455. [Google Scholar] [CrossRef]
  57. Bai, C.E.; Du, Y.; Tao, Z.; Tong, S.Y. Local protectionism and regional specialization: Evidence from China’s industries. J. Int. Econ. 2004, 63, 397–417. [Google Scholar] [CrossRef]
  58. Li, Z.; Wu, M.; Chen, B.R. Is road infrastructure investment in China excessive? Evidence from productivity of firms. Reg. Sci. Urban Econ. 2017, 65, 116–126. [Google Scholar] [CrossRef]
  59. Castells-Quintana, D.; Royuela, V. Are increasing urbanisation and inequalities symptoms of growth? Appl. Spat. Anal. Policy 2015, 8, 291–308. [Google Scholar] [CrossRef] [Green Version]
  60. Wang, L.; Shen, J. Comparative Analysis of Urban Competitiveness in the Yangtze River Delta and Pearl River Delta Regions of China, 2000–2010. Appl. Spat. Anal. Policy 2017, 10, 401–419. [Google Scholar] [CrossRef]
  61. Yuan, F.; Gao, J.; Wang, L.; Cai, Y. Co-location of manufacturing and producer services in Nanjing, China. Cities 2017, 63, 81–91. [Google Scholar] [CrossRef]
  62. Wu, C.; Wei, Y.D.; Huang, X.; Chen, B. Economic transition, spatial development and urban land use efficiency in the Yangtze River Delta, China. Habitat Int. 2017, 63, 67–78. [Google Scholar] [CrossRef]
  63. Coe, N.M.; Yeung, H.W.-C. Global Production Networks: Theorizing Economic Development in an Interconnected World; Oxford University Press, USA: Cary, NC, USA, 2015. [Google Scholar]
  64. Nazara, S.; Hewings, G.J. Spatial Structure and Taxonomy of Decomposition in Shift-Share Analysis. Growth Chang. 2004, 35, 476–490. [Google Scholar] [CrossRef]
  65. Huang, B.; Wu, B.; Barry, M. Geographically and temporally weighted regression for modeling spatio-temporal variation in house prices. Int. J. Geogr. Inf. Sci. 2010, 24, 383–401. [Google Scholar] [CrossRef]
  66. Kronenberg, K. Firm relocations in the Netherlands: Why do firms move, and where do they go? Pap. Reg. Sci. 2013, 92, 691–713. [Google Scholar] [CrossRef]
Figure 1. The conceptual framework for analyzing geographical concentration and dispersion of manufacturing industries in transitional China.
Sustainability 10 02624 g001
Figure 2. The location of the Yangtze River Delta (YRD) (Southern Jiangsu includes Nanjing (NJ), Zhenjiang (ZhJ), Changzhou (CZ), Wuxi (WX), and Suzhou (SZ). Central Jiangsu includes Yangzhou (YZ), Taizhou (TZ), and Nantong (NT). Northern Jiangsu includes Xuzhou (XZ), Lianyungang (LYG), Suqian (SQ), Huaian (HA), and Yancheng (YC). Northern Zhejiang includes Hangzhou (HZ), Ningbo (NB), Jiaxing (JX), Huzhou (HuZ), Shaoxing (SX), and Zhoushan (ZS). Southern Zhejiang includes Wenzhou (WZ), Taizhou (TZh), Jinhua (JH), Quzhou (QZ), and Lishui (LS). Northern Anhui includes Fuyang (FY), Bozhou (BZ), Suzhou (SZh), Huaibei (HB), Huainan (HN), and Bengbu (BB). Central Anhui includes Hefei (HF), Chuzhou (CZh), Luan (LA), Maanshan (MAS), Wuhu (WH), Tongling (TL), and Anqing (AQ). Southern Anhui includes Chizhou (ChZ), Xuancheng (XC), and Huangshan (HS)).
Sustainability 10 02624 g002
Figure 3. Spatial distribution of the share of gross industrial output in the YRD, 1999, 2004, 2009, and 2013. Source: Statistical Yearbook of each city, 2000–2014.
Sustainability 10 02624 g003
Figure 4. Spatial distribution of the changes of gross industrial output share in the YRD, 1999–2013. Source: Statistical Yearbook of each city, 2000–2014.
Sustainability 10 02624 g004
Figure 5. Comprehensive effects of the NIME, UNISE, and UIME of S18, during 1999–2004, 2004–2009, and 2009–2013
Sustainability 10 02624 g005aSustainability 10 02624 g005b
Figure 6. Comprehensive effects of the NIME, UNISE, and UIME of S26, during 1999–2004, 2004–2009, and 2009–2013.
Sustainability 10 02624 g006aSustainability 10 02624 g006b
Figure 7. Comprehensive effects of the NIME, UNISE, and UIME of S37, during 1999–2004, 2004–2009, and 2009–2013.
Sustainability 10 02624 g007aSustainability 10 02624 g007b
Figure 8. Comprehensive effects of the NIME, UNISE, and UIME of S40, during 1999–2004, 2004–2009, and 2009–2013.
Sustainability 10 02624 g008aSustainability 10 02624 g008b
Table 1. Changes in regional proportions of manufacturing output value in the YRD (1999–2013). Source: Statistical Yearbook of each city, 2000–2014.
RegionsShare (%)Changes in Share (%)
19992004200920131999–20042004–20092009–2013
Shanghai26.3022.7514.8712.48−3.55−7.87−2.39
Southern JS29.1833.0632.8230.033.88−0.23−2.80
Central JS7.195.9510.0711.33−1.244.121.26
Northern JS6.013.786.6211.26−2.232.834.64
Northern ZJ19.1121.5820.9717.652.47−0.61−3.31
Southern ZJ5.587.667.515.772.08−0.15−1.74
Central AH4.544.065.598.47−0.481.532.88
Northern AH1.560.780.912.06−0.780.121.15
Southern AH0.540.380.640.96−0.160.260.31
Table 2. Number of share increased and decreased manufacturing sectors in the YRD (1999–2013).
RegionsNumber of Share Increased SectorsNumber of Share Decreased Sectors
1999–20042004–20092009–20131999–20042004–20092009–2013
Shanghai825182421
Southern JS12127141419
Central JS1024171629
Northern JS725251911
Northern ZJ2313431322
Southern ZJ2314631220
Central AH722231943
Northern AH418242282
Southern AH1023211635
Note: A total of 26 two-digit manufacturing sectors in statistics.
Table 3. Backward/forward industries of certain manufacturing sectors. Backward/forward industries are identified by the coefficient ( A i j ) of direct consumption of a certain sector. Based on the input–output table of China, the A i j can be calculated by the following formula: A i j = X i j / X j ( i , j = 1 , 2 , , n ) , where, X j is the total investment in sector j , and X i j stands for the intermediate demands for products of sector i in the production process of sector j . The value of A i j ranges 0–1, and the high value indicates a strong industrial linkage. Source: The input–output table, China.
Typical SectorBackward/Forward IndustriesTypical SectorBackward/Forward Industries
S18S17, S19, S26, S28S37S32, S33, S35, S36
S26S25, S28S40S26, S28, S39
Table 4. Definitions of dependent and independent variables.
CategoriesVariablesDefinitionsAbbreviationExpected Sign
Dependent variableShare of each city’s manufacturing gross output to the whole regionLn (first-lagged ratio of a city’s gross output value of industrial enterprises to the whole region)/SHAREtnone
Independent variablesGlobalizationForeign direct investmentLn (first-lagged ratio of industrial gross output by foreign firms to the total)FDIt−1+/−
Foreign tradeLn (first-lagged total value of imports and exports/first-lagged GDP)IXTt−1+/−
Access to global economyDummy variable, 1 for global cities, national and regional hub cities, 0 for other citiesOPENt−1+/−
MarketizationLabor costLn (first-lagged average wage level of employed workers)WAGEt−1+/−
Market scale and potentialLn (first-lagged ratio of a city’s total retail sales of consumer goods to the whole region)RSCGt−1+
Market integration Dummy variable, 1 for member of the Yangtze River Delta Urban Economic Coordination Conferences, 0 for other citiesINTEGt−1+
Industrial linkagesLn (first-lagged ratio of gross industrial output value of backward-forward sectors to the total)INTERt−1+
DecentralizationPreferential policiesLn (first-lagged weighted sum strength of policy and established DZs)POLt−1+
Local protectionismLn (first-lagged ratio of value-added tax to gross industrial output)TAXt−1
Environmental regulationLn (first-lagged ratio a city’s drainage of industrial wastewater to the whole region)ENVt−1
UrbanizationUrbanization economiesLn (first-lagged ratio of a city’s total investment in fixed assets to the whole region) INVTt−1+
Development of service industryLn (first-lagged ratio of the value added of service industry to GDP by city)SERVt−1+/−
Urbanization levelLn (first-lagged ratio of the urban resident population to the total population by city)URB t−1+/−
Table 5. Result of panel data regressions.
VariablesModel 0Model 1Model 2Model 3Model 4Model 5
Constant4.020 ***4.733 ***3.754 ***2.969 **3.638 ***1.142
Ln (FDIt−1)0.100 **0.156 **0.184 ***0.163 **0.100 **0.186 ***
Ln (IXTt−1)0.194 ***0.349 ***0.362 ***0.341 ***0.246 ***
OPENt−10.0040.338 **0.457 ***0.399 **0.153−0.037
Ln (WAGEt−1)−0.201 ***−0.294 ***−0.179 **
Ln (RSCGt−1)0.614 *** 0.895 ***
INTEGt−10.410 ***0.787 ***0.820 ***0.781 ***0.433 ***0.565 ***
Ln (POLt−1)0.1070.252 * 0.039
Ln (TAXt−1)−0.149 **−0.308 ***−0.323 ***−0.321 ***−0.097−0.393 ***
Ln (ENVt−1)−0.0320.505 ***0.519 ***0.561 *** 0.209 ***
Ln (INVTt−1)0.391 *** 0.842 ***
Ln (SERVt−1)−0.901 ***−0.922 **−0.924 **−1.043 ***−1.336 ***−0.400
Ln (URBt−1)0.0005−0.102−0.110−0.241−0.043−0.099
Hausman Test Chi-Sq. Statistic56.50 ***79.27 ***76.70 ***87.60 ***53.02 ***115.30 ***
Adjusted R20.9170.8160.8130.8080.9070.870
Note: *** Significant at 0.01 level; ** Significant at 0.05 level.
Table 6. GTWR parameter estimate summaries across regions.
VariablesYRDCore RegionPeripheral Region
Model 0Model 1Model 2Model 0Model 1Model 2Model 0Model 1Model 2
Mean
(Positive)
Mean
(Positive)
Mean
(Positive)
Mean
(Positive)
Mean
(Positive)
Mean
(Positive)
Mean
(Positive)
Mean
(Positive)
Mean
(Positive)
Ln (FDIt−1)0.108
(100%)
0.133
(93.3%)
0.248
(90.9%)
0.171
(85.4%)
0.155
(85.4%)
0.230
(85.4%)
0.090
(100%)
0.100
(81.9%)
0.172
(100%)
Ln (IXTt−1)0.242
(100%)
0.292
(100%)
0.137
(87.5%)
0.163
(85.4%)
0.246
(100%)
0.240
(84.5%)
OPENt−1−0.153
(1.2%)
−0.018
(48.8%)
−0.099
(26.2%)
−0.205
(12.5%)
−0.220
(0%)
−0.065
(27.1%)
−0.166
(7.8%)
0.008
(49.1%)
−0.135
(38.8%)
Ln (WAGEt−1)0.029
(50%)
0.163
(70.7%)
−0.094
(34.1%)
−0.231
(27.1%)
−0.303
(20.8%)
−0.355
(6.3%)
−0.015
(50%)
0.185
(75.9%)
−0.191
(3.4%)
Ln (RSCGt−1)0.609
(100%)
0.898
(100%)
0.979
(100%)
0.955
(100%)
0.588
(100%)
0.921
(100%)
INTEGt−10.258
(98.8%)
0.296
(95.1%)
0.414
(89.0%)
3.739
(100%)
3.487
(97.9%)
5.467
(100%)
0.297
(100%)
0.366
(75.9%)
0.416
(88.8%)
Ln (POLt−1)−0.158
(45.7%)
−0.081
(51.2%)
−0.136
(45.7%)
0.069
(64.6%)
0.105
(79.2%)
0.158
(77.1%)
−0.151
(47.4%)
−0.133
(37.9%)
0.004
(63.8%)
Ln (TAXt−1)−0.092
(4.9%)
−0.077
(25.6%)
−0.220
(18.3%)
−0.202
(0%)
−0.252
(0%)
−0.408
(0%)
−0.118
(0%)
−0.087
(23.3%)
−0.216
(13.8%)
Ln (ENVt−1)−0.066
(31.1%)
0.073
(69.5%)
−0.016
(29.2%)
0.484
(100%)
−0.097
(25.0%)
−0.002
(60.3%)
Ln (INVTt−1)0.535
(100%)
0.975
(100%)
0.057
(58.3%)
0.489
(97.9%)
0.572
(100%)
1.013
(100%)
Ln (SERVt−1)−0.380
(15.2%)
−0.756
(7.9%)
−0.311
(39.0%)
−2.845
(0%)
−2.609
(4.2%)
−2.342
(2.1%)
−0.218
(28.4%)
−0.874
(6.9%)
0.115
(60.3%)
Ln (URBt−1)−0.043
(41.5%)
−0.110
(42.7%)
0.304
(75.6%)
2.017
(100%)
2.063
(100%)
1.592
(100%)
−0.066
(35.3%)
0.009
(50.9%)
0.170
(64.7%)
Adjusted R20.9650.9560.9830.9860.9880.9800.9370.9660.943
Note: “Mean” denotes the average value of all the coefficients, and “Positive” denotes the proportion of positive ones.
Table 7. GTWR parameter estimate summaries across sectors.
VariablesS18S26
Model 0Model 1Model 2Model 3Model 0Model 1Model 2Model 3
Mean
(Positive)
Mean
(Positive)
Mean
(Positive)
Mean
(Positive)
Mean
(Positive)
Mean
(Positive)
Mean
(Positive)
Mean
(Positive)
Ln (FDIt−1)0.121
(78.7%)
0.175
(76.8%)
0.256
(78.0%)
0.090
(75.6%)
0.259
(83.5%)
0.257
(85.4%)
0.288
(90.2%)
0.306
(100%)
Ln (IXTt−1)−0.172
(22.6%)
0.118
(70.7%)
0.037
(53.7%)
0.135
(69.5%)
OPENt−1−0.088
(36.6%)
−0.211
(28.7%)
−0.434
(22.6%)
−0.105
(36.0%)
−0.047
(38.4%)
−0.009
(43.3%)
−0.009
(48.2%)
0.320
(82.9%)
Ln (WAGEt−1)0.387
(89.0%)
0.475
(82.3%)
0.175
(54.3%)
0.326
(79.9%)
0.047
(44.5%)
−0.032
(40.9%)
−0.295
(18.9%)
−0.021
(38.4%)
Ln (RSCGt−1)0.056
(55.5%)
1.112
(98.2%)
0.691
(97.6%)
0.928
(100%)
INTEGt−10.353
(70.1%)
0.900
(86.0%)
0.917
(78.7%)
0.363
(72.0%)
0.348
(78.0%)
0.375
(77.4%)
0.539
(80.5%)
0.556
(78.0%)
Ln
(INTERt−1)
0.966
(100%)
0.939
(100%)
0.053
(66.5%)
0.150
(97.6%)
Ln (POLt−1)−0.084
(32.3%)
−0.211
(28.0%)
−0.068
(42.1%)
0.010
(51.2%)
−0.175
(27.4%)
−0.104
(32.9%)
−0.082
(45.1%)
−0.182
(34.1%)
Ln (TAXt−1)−0.148
(36.6%)
−0.209
(25.0%)
−0.273
(24.4%)
−0.125
(32.3%)
−0.293
(3.7%)
−0.258
(7.9%)
−0.439
(0%)
−0.418
(0.0%)
Ln (ENVt−1)0.201
(75.6%)
0.319
(73.2%)
0.244
(80.5%)
−0.042
(41.5%)
0.121
(60.4%)
0.376
(80.5%)
Ln (INVTt−1)0.082
(51.8%)
0.952
(96.3%)
0.284
(70.1%)
0.757
(100%)
Ln (SERVt−1)−1.409
(0%)
−1.983
(2.4%)
−1.165
(26.2%)
−1.174
(3.7%)
−0.072
(51.8%)
−0.158
(39.0%)
0.491
(80.5%)
0.074
(63.4%)
Ln (URBt−1)0.149
(63.4%)
0.159
(48.2%)
0.161
(38.4%)
−0.028
(39.0%)
−0.212
(48.2%)
−0.060
(48.2%)
0.097
(56.7%)
−0.110
(42.7%)
Adjusted R20.9590.9510.9660.9630.9530.9320.9290.892
VariablesS37S40
Model 0Model 1Model 2Model 3Model 0Model 1Model 2Model 3
Ln (FDIt−1)0.210
(78.0%)
0.225
(73.2%)
0.330
(85.4%)
0.217
(75.6%)
−0.039
(50.0%)
0.301
(97.0%)
0.307
(82.3%)
0.079
(50.0%)
Ln (IXTt−1)0.091
(53.7%)
0.243
(61.0%)
0.357
(100%)
0.860
(100%)
OPENt−10.360
(68.3%)
0.350
(62.2%)
0.371
(63.4%)
0.488
(68.3%)
0.591
(100%)
0.838
(100%)
0.301
(76.2%)
0.665
(100%)
Ln (WAGEt−1)−0.378
(19.5%)
−0.465
(22.0%)
−0.518
(22.0%)
−0.315
(17.1%)
−0.349
(50.0%)
−0.417
(1.2%)
−0.760
(6.7%)
−0.040
(25.0%)
Ln (RSCGt−1)0.248
(61.6%)
0.902
(95.1%)
−0.323
(0.0%)
0.993
(100%)
INTEGt−10.246
(58.5%)
0.262
(75.6%)
0.115
(56.1%)
0.147
(68.3%)
0.113
(75.0%)
0.451
(82.9%)
0.933
(96.3%)
Ln
(INTERt−1)
0.463
(100%)
0.548
(92.7%)
0.990
(100%)
1.148
(100%)
Ln (POLt−1)0.144
(65.9%)
0.181
(70.7%)
0.191
(61.0%)
0.178
(78.0%)
−0.395
(50.0%)
−0.398
(28.0%)
−0.328
(50.0%)
−0.052
(25.0%)
Ln (TAXt−1)−0.302
(17.1%)
−0.389
(26.8%)
−0.385
(31.7%)
−0.257
(31.7%)
−0.382
(25.0%)
−0.196
(40.9%)
−1.179
(3.0%)
−0.667
(25.0%)
Ln (ENVt−1)0.320
(68.3%)
0.480
(75.6%)
0.468
(68.3%)
0.438
(75.0%)
0.266
(93.3%)
0.389
(75.0%)
Ln (INVTt−1)−0.016
(47.6%)
0.549
(82.9%)
0.619
(100%)
1.493
(100%)
Ln (SERVt−1)0.609
(73.2%)
0.093
(46.3%)
0.403
(65.9%)
0.548
(92.7%)
−0.018
(50.0%)
−0.069
(47.0%)
0.168
(45.1%)
−1.128
(0%)
Ln (URBt−1)0.064
(68.3%)
0.755
(70.7%)
0.559
(70.7%)
−0.251
(41.5%)
0.224
(50.0%)
−0.160
(28.7%)
1.207
(88.4%)
0.783
(100%)
Adjusted R20.9380.9360.9290.9280.8980.9110.9080.899
Note: “Mean” denotes the average value of all the coefficients, and “Positive” denotes the proportion of positive ones.

