Planning of Electric Public Transport System under Battery Swap Mode


1
The Key Laboratory of Road and Traffic Engineering, Ministry of Education, Shanghai 201804, China
2
College of Transportation Engineering, Tongji University, Shanghai 201804, China
3
State High-Tech Industrial Innovation Center, Shenzhen 518063, China
*
Author to whom correspondence should be addressed.
Sustainability 2018, 10(7), 2528; https://doi.org/10.3390/su10072528
Submission received: 30 April 2018
/
Revised: 10 July 2018
/
Accepted: 16 July 2018
/
Published: 19 July 2018
(This article belongs to the Section Sustainable Transportation)
Abstract
:Applying battery electric buses (BEBs) in the city is a good means to reduce the increasing greenhouse gas emissions and crude oil dependence. Limited by the driving range and charging time, battery swap station seems to be the best option for battery electric buses to replenish energy currently. This paper presents a novel method to plan and design an electric public transport system under battery swap mode, which comprised of battery electric buses, routes, scheduling, battery swap station, etc. Thus, new routing and scheduling strategies are proposed for the battery electric bus fleets. Based on swapping and charging demand analysis, this paper establishes an algorithm to calculate the optimal scales of battery swap station, including scales of battery swapping system, battery charging system and battery packs, and power capacity of output. Regarding the case of Xuejiadao battery swap station serving 6 BEB routes in Qingdao, China, a numerical simulation program is established to evaluate the validity of our methods. The results reflect that our methods can optimize the system scales meeting an equivalent state of operation demand. In addition, sensitivity analyses are made to the scales under different values of battery capacity and charging current. It suggests that the scales and cost of battery swap station can be effectively reduced with the development of power battery manufacture and charging technology in future.
1. Introduction
1.1. Background
The continued growth in motor vehicles use worldwide will inevitably have an influence on global crude oil demand and CO2 emissions [1]. The transportation sector produced 23% of global CO2 emissions in 2012, which was the second contributor only next to the generation of electricity and heat [2]. To limit the emissions and demand for fossil fuel due to the increasing number of vehicles, developing battery electric vehicles (BEVs) seems to be a good choice [3]. Nevertheless, there are some problems using BEVs, mainly their high costs, limited driving ranges and long charging time [4]. The fixed route, schedules and stops of battery electric bus (BEB) can make these problems simpler. Besides, transit priority is considered to be an effective way to relieve traffic congestion and decrease greenhouse gas emissions [5]. Therefore, the electric public transport system is the breakthrough point of BEVs’ popularization and application.
The BEB requires more frequent energy replenishment because of the heavy daily tasks and limited driving range. So, the most significant obstacle for the electric public transport system to overcome is the energy replenishment. At present, the energy replenishment technologies are mainly divided into battery charging in the vehicle and battery swapping [6]. Charging the batteries in bus usually takes hours, even the quick charging, which is inefficient for operation and harmful to the life of batteries. However, in a battery swap station (BSS), the BEB can replace its depleted battery pack with a full one within a few minutes. Then the depleted battery packs are recharged at the station and later swapped for other arriving BEBs [7]. Consequently, the mode of battery swap seems to be more suitable for the electric public transport system at present.
1.2. Literature Review
The charging infrastructure planning is a hot spot of recent research [8]. On one hand, most studies focused on the site selection of charging stations [9]. For example, Dong et al. [1] applied a genetic algorithm to find (sub) optimal locations for the siting of public charging stations. Lee et al. [10] developed a UE-based location model of rapid charging stations for EVs in urban areas considering the batteries’ state-of-charge (SOC) and the users’ charging and travel behaviors. Cui et al. [11] regarded the site selection of charging stations as a complex multicriteria decision-making (MCDM) problem and developed a Pythagorean fuzzy VIKOR (PF-VIKOR) approach to solve it. On the other hand, many researchers aimed at seeking the optimal scales and reducing the cost of charging infrastructure. For example, Nie et al. [12] proposed a conceptual optimization model to select the battery size and charging capacity to meet a given level of service in such a way that the total cost of charging infrastructure is minimized. Sellmair et al. [4] developed an optimization method to maximize the economic benefit of the charging infrastructure for electric taxis. Yang et al. [13] presented a data-driven optimization-based approach to allocating chargers for battery electric taxis throughout a city with the objective of minimizing the infrastructure investment.
However, these studies above only focused on the charging infrastructure for the BEVs (mainly private cars and taxis) not specifically for the BEBs. The charging demands of BEB fleets are quite different from those of BEVs. Therefore, it’s necessary to propose some new and special methods to plan the charging infrastructure for the electric public transport system. There are several studies considering the charging stations for BEBs. For example, Liu et al. [14] presented a procedure for the site selection of charging stations for both BEBs and BEVs. Kemper et al. [15] proposed a model to aid the assessment of the economic feasibility of different replenishment technologies for BEBs. Wang et al. [16] designed the charging stations for BEBs at selected bus stops and minimized the total installation cost of charging stations through simulations. Rohrbeck et al. [17] used a mixed integer model with multiple periods to determine the number and location of charging stations for BEBs considering battery aging effects.
It is a fact that the existing research mostly focused on the charging station (CS). While only a few studies involved the battery swap station (BSS). For example, Mak et al. [7] developed robust optimization models that aid the planning process for deploying BSS. Liu et al. [18] introduced a mathematical model to optimize the capacities of components in the photovoltaic-based BSS. Yu et al. and Zhang et al. [19,20] compared CS and BSS in the distribution system, whose results show that BSS is more suitable for public transportation. Bobanac et al. [21] conducted a survey on EVs and BSS which suggests that the respondents are generally open to EVs and to the idea of battery swapping.
Nevertheless, even fewer attention has been given to the electric public transport system under battery swap mode except that Kaschub et al. proved the economic feasibility of BSS for BEBs [22] and Dai et al. [23] presented a novel model based on Monte Carlo simulation to forecast the load demand of BSS for BEB. However, they have never thought over the routing and scheduling strategies of the BEBs, which should be redesigned for the electric public transport system. Besides, nor did they present how to determine the design scales of the BSS based on swapping and charging demand of the BEB fleets. To sum up, none of the previous studies have ever referred to the planning and operation of the electric public transport system incorporating both the BEBs routing and the BSS design.
1.3. Objectives and Organization of the Study
To fill up the gap of research, the objective of this paper is to design an electric public transport system under battery swap mode which comprised of BEBs, routes, scheduling, battery swap station, etc. Specifically, this paper aims at setting up new routing and scheduling strategies for BEB fleets and seeking the optimal scales of swapping/charging facilities and battery packs that the BSS should deploy to satisfy the swapping and charging demand. By doing so, we can accelerate the wide adoption of BEBs in the marketplace.
The rest of this paper is organized as follows. Section 2 details the design method of the electric public transport system which includes BEB route planning, scheduling strategies, swapping and charging demand analysis, and design of the BSS. In Section 3, a case study of Xuejiadao Station in Qingdao, Shandong Province, China is conducted by numerical simulation. The results of the numerical simulation are discussed in Section 4. Finally, the conclusions are presented in Section 5.
2. Materials and Methods
Several rules and assumptions need to be made before the planning and design.
- Rule 1:
- BEB only departs from bus terminal station, running back and forth along the route counts as a round. All BEBs of the same route go to the same BSS for battery swapping, then back to bus terminal station waiting for next round.
- Rule 2:
- BEB won’t go to the BSS during a round until it has finished this round. Namely, if the energy is not enough to support next round, it’s time for the BEB to swap the battery.
- Rule 3:
- When BEB finishes the daily running hours, it heads for the BSS to replace the battery pack with a full one, no matter how much energy is left. Then, back to the bus terminal station for parking, ending the operations of a day.
The running track of BEB is shown in Figure 1.
- Assumption 1:
- Each battery pack in BEB is full initially and will be replaced with another full one when the BEB return to BSS;
- Assumption 2:
- The energy consumption of the battery pack is linearly associated with mileages ignoring the impact of weather and passenger flow;
- Assumption 3:
- The charging time of battery pack is in direct proportion to charging power and charging depth, in inverse proportion to battery energy;
- Assumption 4:
- The swapping and charging facilities in BSS is enough so that each battery pack in BEB arriving at BSS can be swapped and charged without waiting.
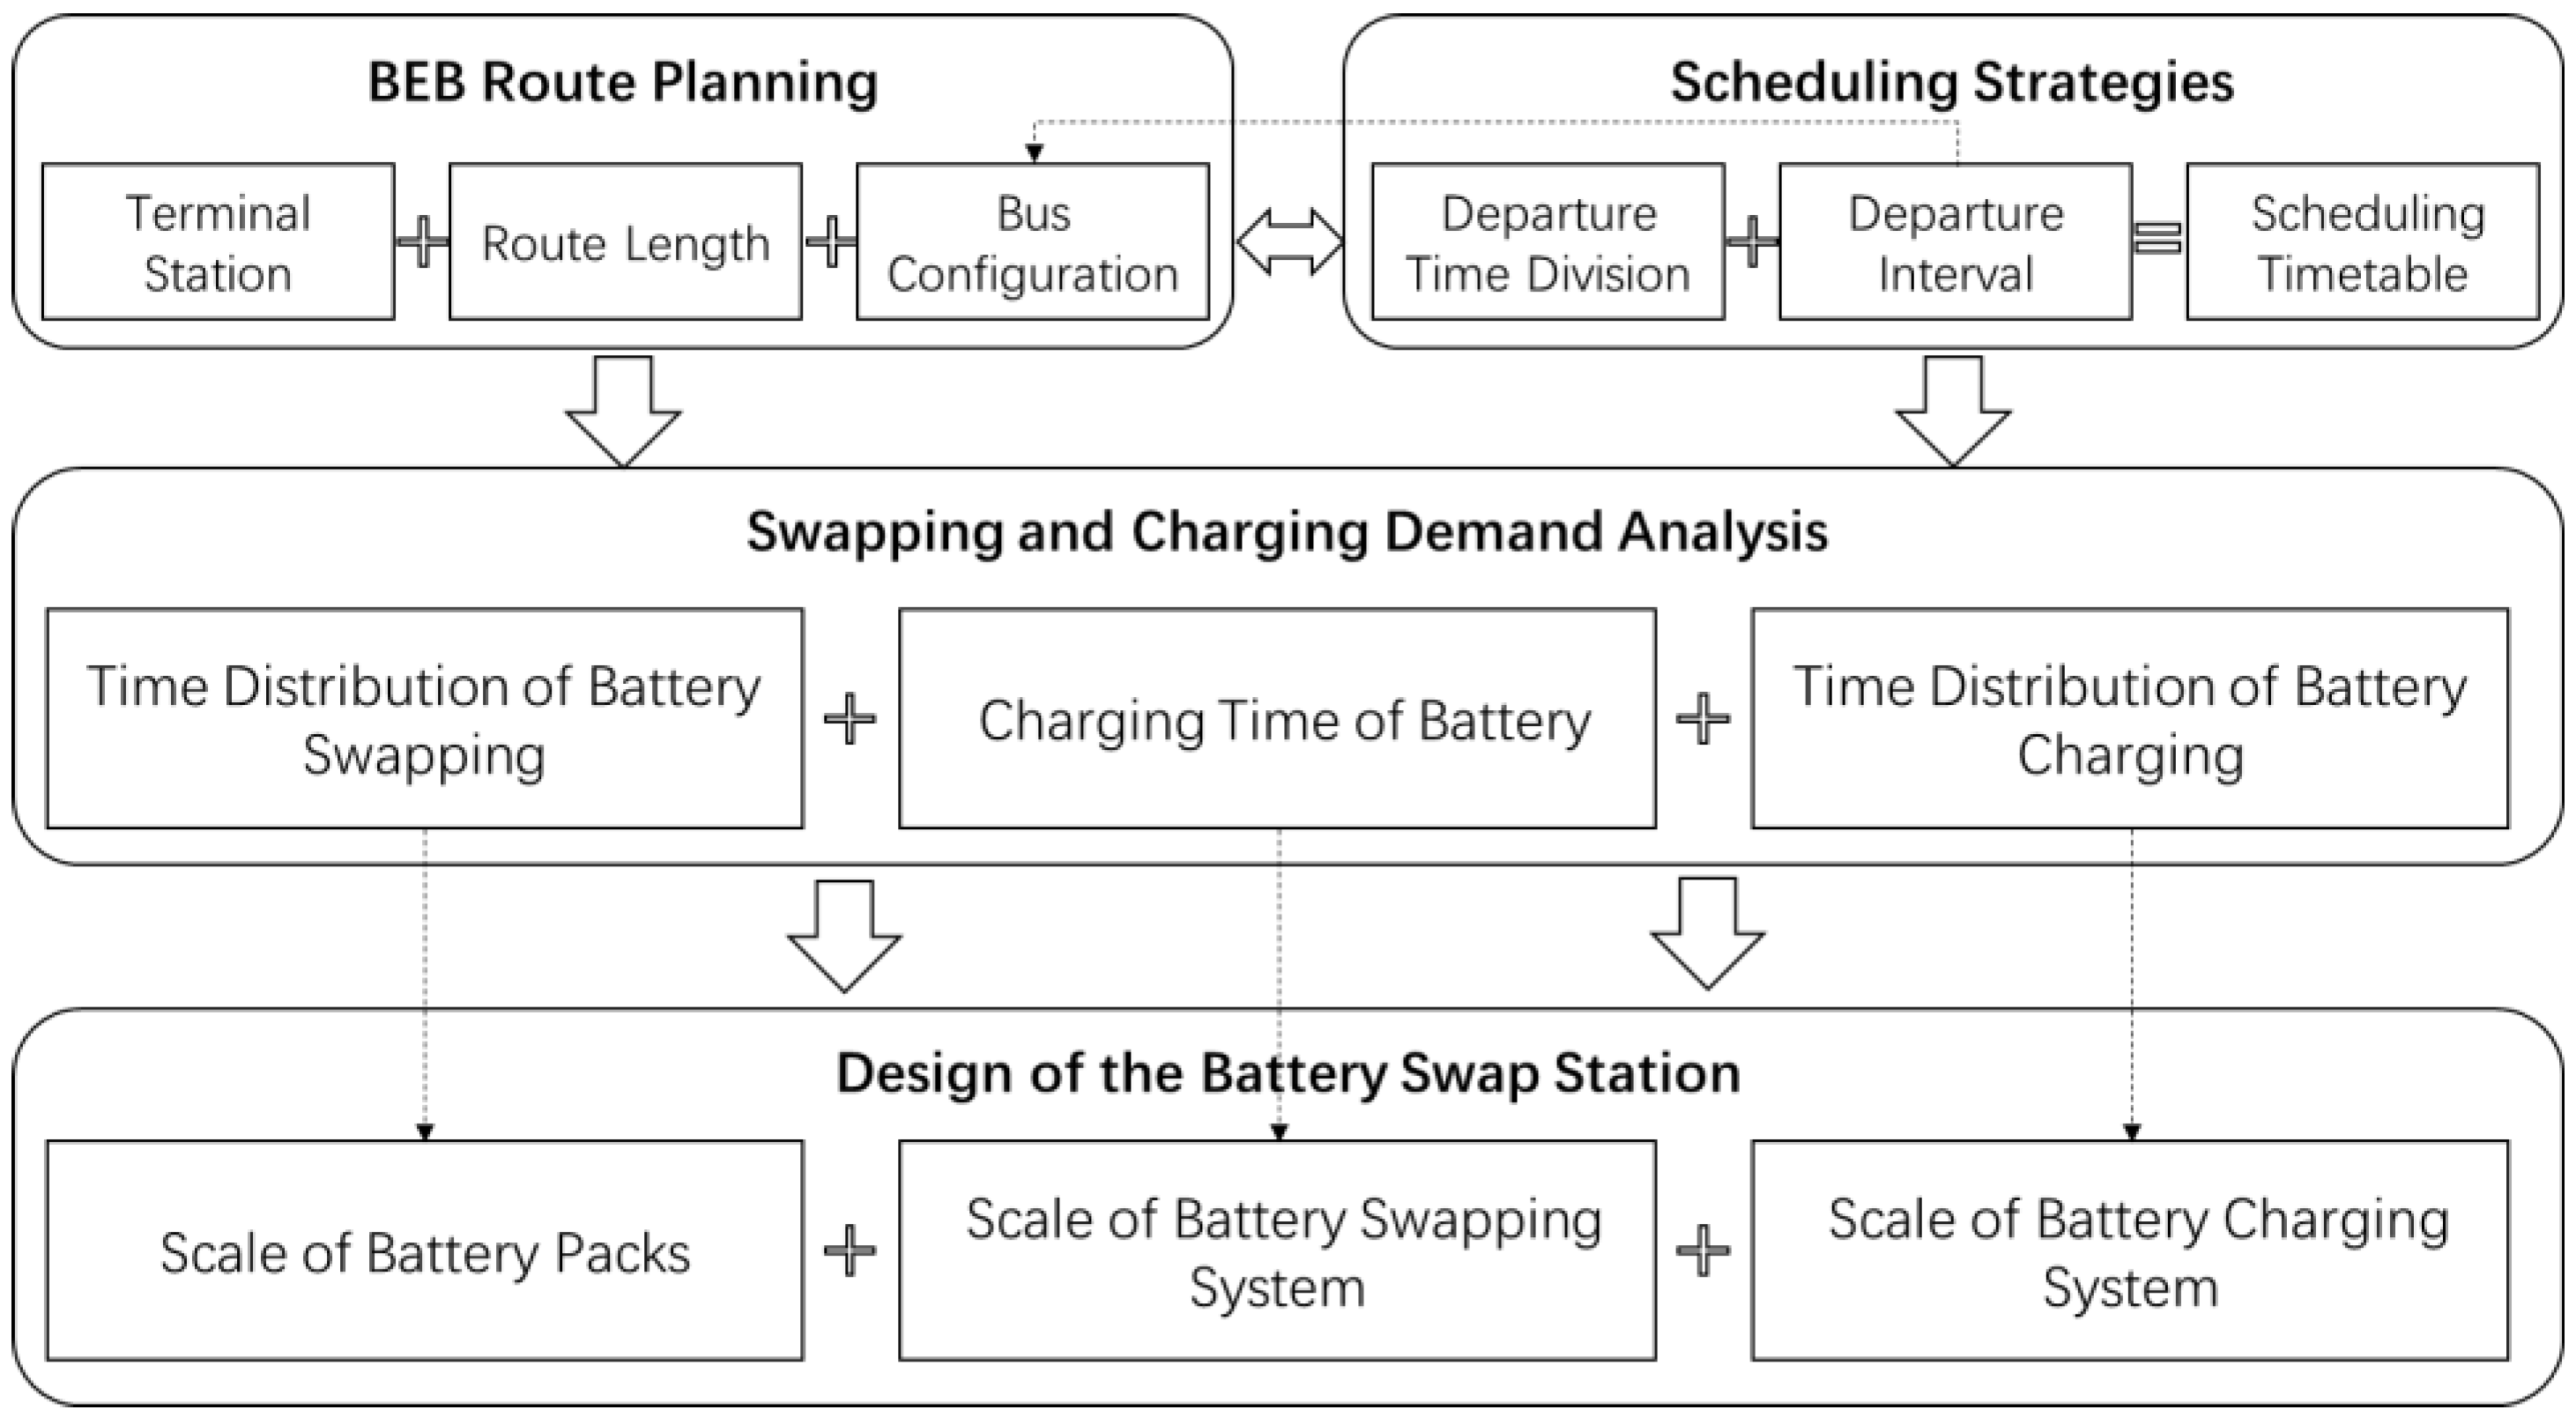
Given the rules and assumptions above, we can plan an electric public transport system under battery swap mode following Figure 2. Details about the method are described hereinafter.
2.1. BEB Route Planning
Considering the special running performance of BEBs, new routes should be planned to match with the operation and battery swapping. There are several key parameters in the process of planning.
2.1.1. Terminal Station
Terminal station is departure or arrival station of one or more routes, where a bus starts or ends its scheduled route. It provides the service of dispatching, parking, maintaining, and logistics. According to the “Design Specifications of Urban Public Transport Station, Depot and Factory (CJJ15-87)” of China, the planning land area of the terminal station is calculated as follow:
where Nbus(T) is the number of buses parking in the terminal station, a0 is the design area for each bus, usually between 90 m2 and 100 m2.
The terminal station should be set up in an open area where passenger flow distribution is more concentrated, such as the intersection of several routes. Since all the BEBs run to the BSS from the terminal station, it is significant to minimize the distance between the terminal station and BSS when selecting the site.
where l is the distance between the terminal station and BSS, lmax is usually not exceeding the route length.
2.1.2. Route Length
Plenty of studies show that the depth of discharge between 70% and 80% is beneficial to the life of the battery and provides a favorable working environment for BEB [24]. Therefore, keeping the state of charge (SOC) at a reasonable level can not only reduce operating costs but also avoid out of energy in case of uncertainty and stochasticity. Then the actual maximum driving range of BEB can be calculated as follows:
where Range is the theoretical maximum driving range of BEB (km), SOCmin is the minimum value of SOC, usually between 20% and 30%, E the energy of battery pack (kWh), e is the energy consumption of BEB running per kilometer (kWh/km), C is the electric capacity of the battery pack (Ah), and U is the voltage of the battery pack (V).
The route length in this paper which denoted as L (km) is the distance between the departure station and arrival station. In general, the mileage of running a round is 2L. The route length should not be too long so that the BEB can finish at least a round without battery swapping, nor too short as it will increase the frequency of transfer. Thus, the route length should be designed within a reasonable range.
Given the rule 2, the route length can influence the utilization rate of battery capacity in BEB. For example, if the route length is too long, when the BEB finished a round, the remainder driving range is not enough for the next round but still able to sustain a long way running. In this case, the battery capacity cannot be used sufficiently. In order to maximize the utilization rate of BEBs’ driving ranges, the route length should also satisfy the following relationship.
2.1.3. Bus Configuration
The bus configuration of a route should meet the maximum passenger traffic demand during the peak hour. Therefore, the number of buses configured for route R (Nbus(R)) depends on the turnover time and departure interval in peak hours of the route.
where Tt is the turnover time of the route (min), V the average speed of buses (km/h), nstop is the number of stops in the route, tstop is the average time of each stop (min), and IP is the maximum departure interval in peak hours (min).
2.2. Scheduling Strategies
Scheduling strategies of the public transit system may fall into two categories: (1) static scheduling which arranges the departure plans of the BEBs; and (2) dynamic scheduling which adjusts or modifies the original departure plans for emergency or special situation. This paper only discusses the static scheduling for the fcommon cases.
2.2.1. Departure Period Division
The daily operation time of a route is usually divided into peak hours and off-peak hours based on passenger flow variation with time. The same period of time has the same departure interval. We use the non-uniformity coefficient of each hour to help divide the departure period [25].
where Kti is the non-uniformity coefficient of the i-th hour, Qi is the passenger flow of the route during the i-th hour, and Qh is the average passenger flow of the route. Then, we can divide the departure period based on the value of Kti. When Kti ≥ Ktp (Ktp = 1.8~2.2), the i-th hour is a peak hour, otherwise an off-peak hour. Consequently, the continuous hours with the same range of Kti are regarded as the same departure period j.
2.2.2. Departure Interval
The departure interval is decided by passenger volume and passenger capacity of the route. Given the number of passengers arriving at each stop in a departure period j, the departure interval in this period can be calculated as follow.
where Pjk is the number of passengers arriving at the k-th bus stop during j-th departure period, and Pjmax is the maximum number of passengers arriving at a bus stop during j-th departure period, PC is the passenger capacity of the route, φ is the average load factor of the route, Fj is the frequency of departure during j-th departure period, Tj is the duration of the j-th departure period, Ij is the departure interval during i-th departure period.
2.2.3. Scheduling Timetable
Given the departure rules, departure time and departure intervals of the route, the scheduling timetable can be easily obtained (Table 1).
where Departure(m,n) represents the m-th departure time of bus n, Arrival(m,n) represent the m-th arrival time of bus n, both of them are m × n matrixes.
2.3. Swapping and Charging Demand Analysis
2.3.1. Time Distribution of Battery Swapping
According to rule 2, the maximum number of rounds a BEB can finish without swapping is calculated from Equation (18).
where fix(x) rounds the x to the nearest integer towards zero. When N ≥ Nmax, the BEB need to return to BSS for battery swapping. Then the swapping start and end time of each BEB can be calculated based on arrival time of Nmax-th round.
where SwapS (h, n) represents the start time of h-th swapping of the bus n, SwapE (h, n) represents the end time of h-th swapping of the bus n, both of them are h×n matrixes, Tl is the travel time of BEB running from terminal station to BSS, and Ts is the time each battery swapping should take.
As a result, the number of battery swapping in every minute can be counted based on SwapS (h, n) and SwapE (h, n), and sequentially recorded into matrix SwapDis(t) which reflects the time distribution of battery swapping.
2.3.2. Charging Time of Battery
The charging time of the battery pack is determined by the depth of charge (DOC) which is equal to the depth of discharge (DOD). According to the rule 2 and assumption 2, the DOC can be calculated as follow:
According to the assumption 3, the charging time of battery pack is expressed as follow:
where PCU is the charging power of charging unit (kW), and α is the battery’s charging efficiency which converts energy/power ratio to charging time and the default value is 1.3 [12].
2.3.3. Time Distribution of Battery Charging
In case the replaced battery pack will be transported to charging rack immediately, the start time of battery charging is equal to end time of battery swapping ignoring the transport time. And given the charging time of battery pack, the end time of charging is obtained.
where ChargeS(b) represents the start time of b-th battery charging, ChargeE(b) represents the end time of b-th battery charging, both of them are b × 1 matrixes.
As a result, the number of battery charging in every minute can be counted based on ChargeS(b) and ChargeE(b), and sequentially recorded into matrix ChargeDis(t) which reflects the time distribution of battery charging.
2.4. Design of the Battery Swap Station
The battery swap station mainly consists of the battery charging system, battery swapping system and monitoring system (as shown in Figure 3). Design of the BSS aims to decide the optimal scales of BSS meeting the swapping and charging demand, which include the number of charging devices and swapping robots, the number of battery packs, the power capacity of BSS, etc.
2.4.1. Scale of Battery Packs
Under battery swap mode, BEBs should be equipped with a certain amount of backup battery packs to relive the disadvantages of short driving range and long charging time. Thus, the number of the battery packs the BSS should hold (Nbattery) is calculated as
where Nb is the needed number of the backup battery packs, NBb is the actual number of the backup battery packs, NRack is the number of charging racks where the battery packs store, Nbus(S) is the number of buses the BSS serving for, and is the design margin (10%~20%). Due to the expensive cost of the battery, the number of backup battery packs should be minimized ensuring the normal operation. Therefore, we propose an algorithm (Figure 4) to calculate the optimal number of backup battery packs. The details of the algorithm are provided as follows:
- (1)
- Initialize: set the initial number of backup battery packs Nb = 0, the serial number of battery pack i = 1, and the serial number of battery swapping k = 1;
- (2)
- Battery swap: carry out the k-th battery swapping starts;
- (3)
- Judge if there exist battery packs available: If the start time of k-th battery swapping is antecedent to the end time of charging of battery i, there is no battery pack available. Then add a backup battery pack and update the number of backup battery packs Nb = Nb + 1. Otherwise, there is at least one battery pack can be replaced for the moment so that it’s not necessary to update the number of backup battery packs. Then make the serial number of battery pack point to next battery pack, i.e., i = i + 1;
- (4)
- Judge if it is the last battery swapping: if k = kmax, it indicates that there are no battery packs to be swapped anymore. Otherwise, make k = k + 1;
- (5)
- End: return the number of backup battery packs Nb.
2.4.2. Scale of Battery Swapping System
The battery swapping system is made up of several swapping units, each of which consists of a swapping lane and two swapping robots. When the BEB drives into the swapping lane and stops at the specific location, the two swapping robots will work simultaneously on both sides. The robots can automatically complete a battery swapping within 8 min.
To meet the swapping demand, the number of battery swapping units (NSU) is equal to the maximum number of BEBs whose battery packs are being swapped at the same time in the BSS, which can be obtained from the time distribution of battery swapping.
where tS is the start of service time of BSS, tE is the end of service time.
2.4.3. Scale of Battery Charging System
The battery charging system consists of a series of charging units responding to battery packs. Therefore, the output power of the charging unit should be matched with the voltage of the battery pack.
where PCU is the output power of the charging unit, I is the intensity of charging current, ηmax is the max efficiency of the charger, and δ is the reactive loss of lines.
To meet the charging demand, the number of charging unit (Ncu) should not be less than the maximum number of batteries that are charged at the same time, which can be obtained from the time distribution of battery charging.
Because each battery pack is composed of several batteries, each charging unit should deploy the same number of single chargers with matched output powers.
where Pcharger is the output power of the single charger and nb the number of batteries composing the battery pack, which is equal to the number of single chargers composing the charging unit. The total number of single chargers in the BSS can be calculated:
As a consequence, the power capacity of the battery charging system depends on the output power and number of charging units in BSS, which can be expressed as:
3. Numerical Simulation
3.1. Case Descriptions
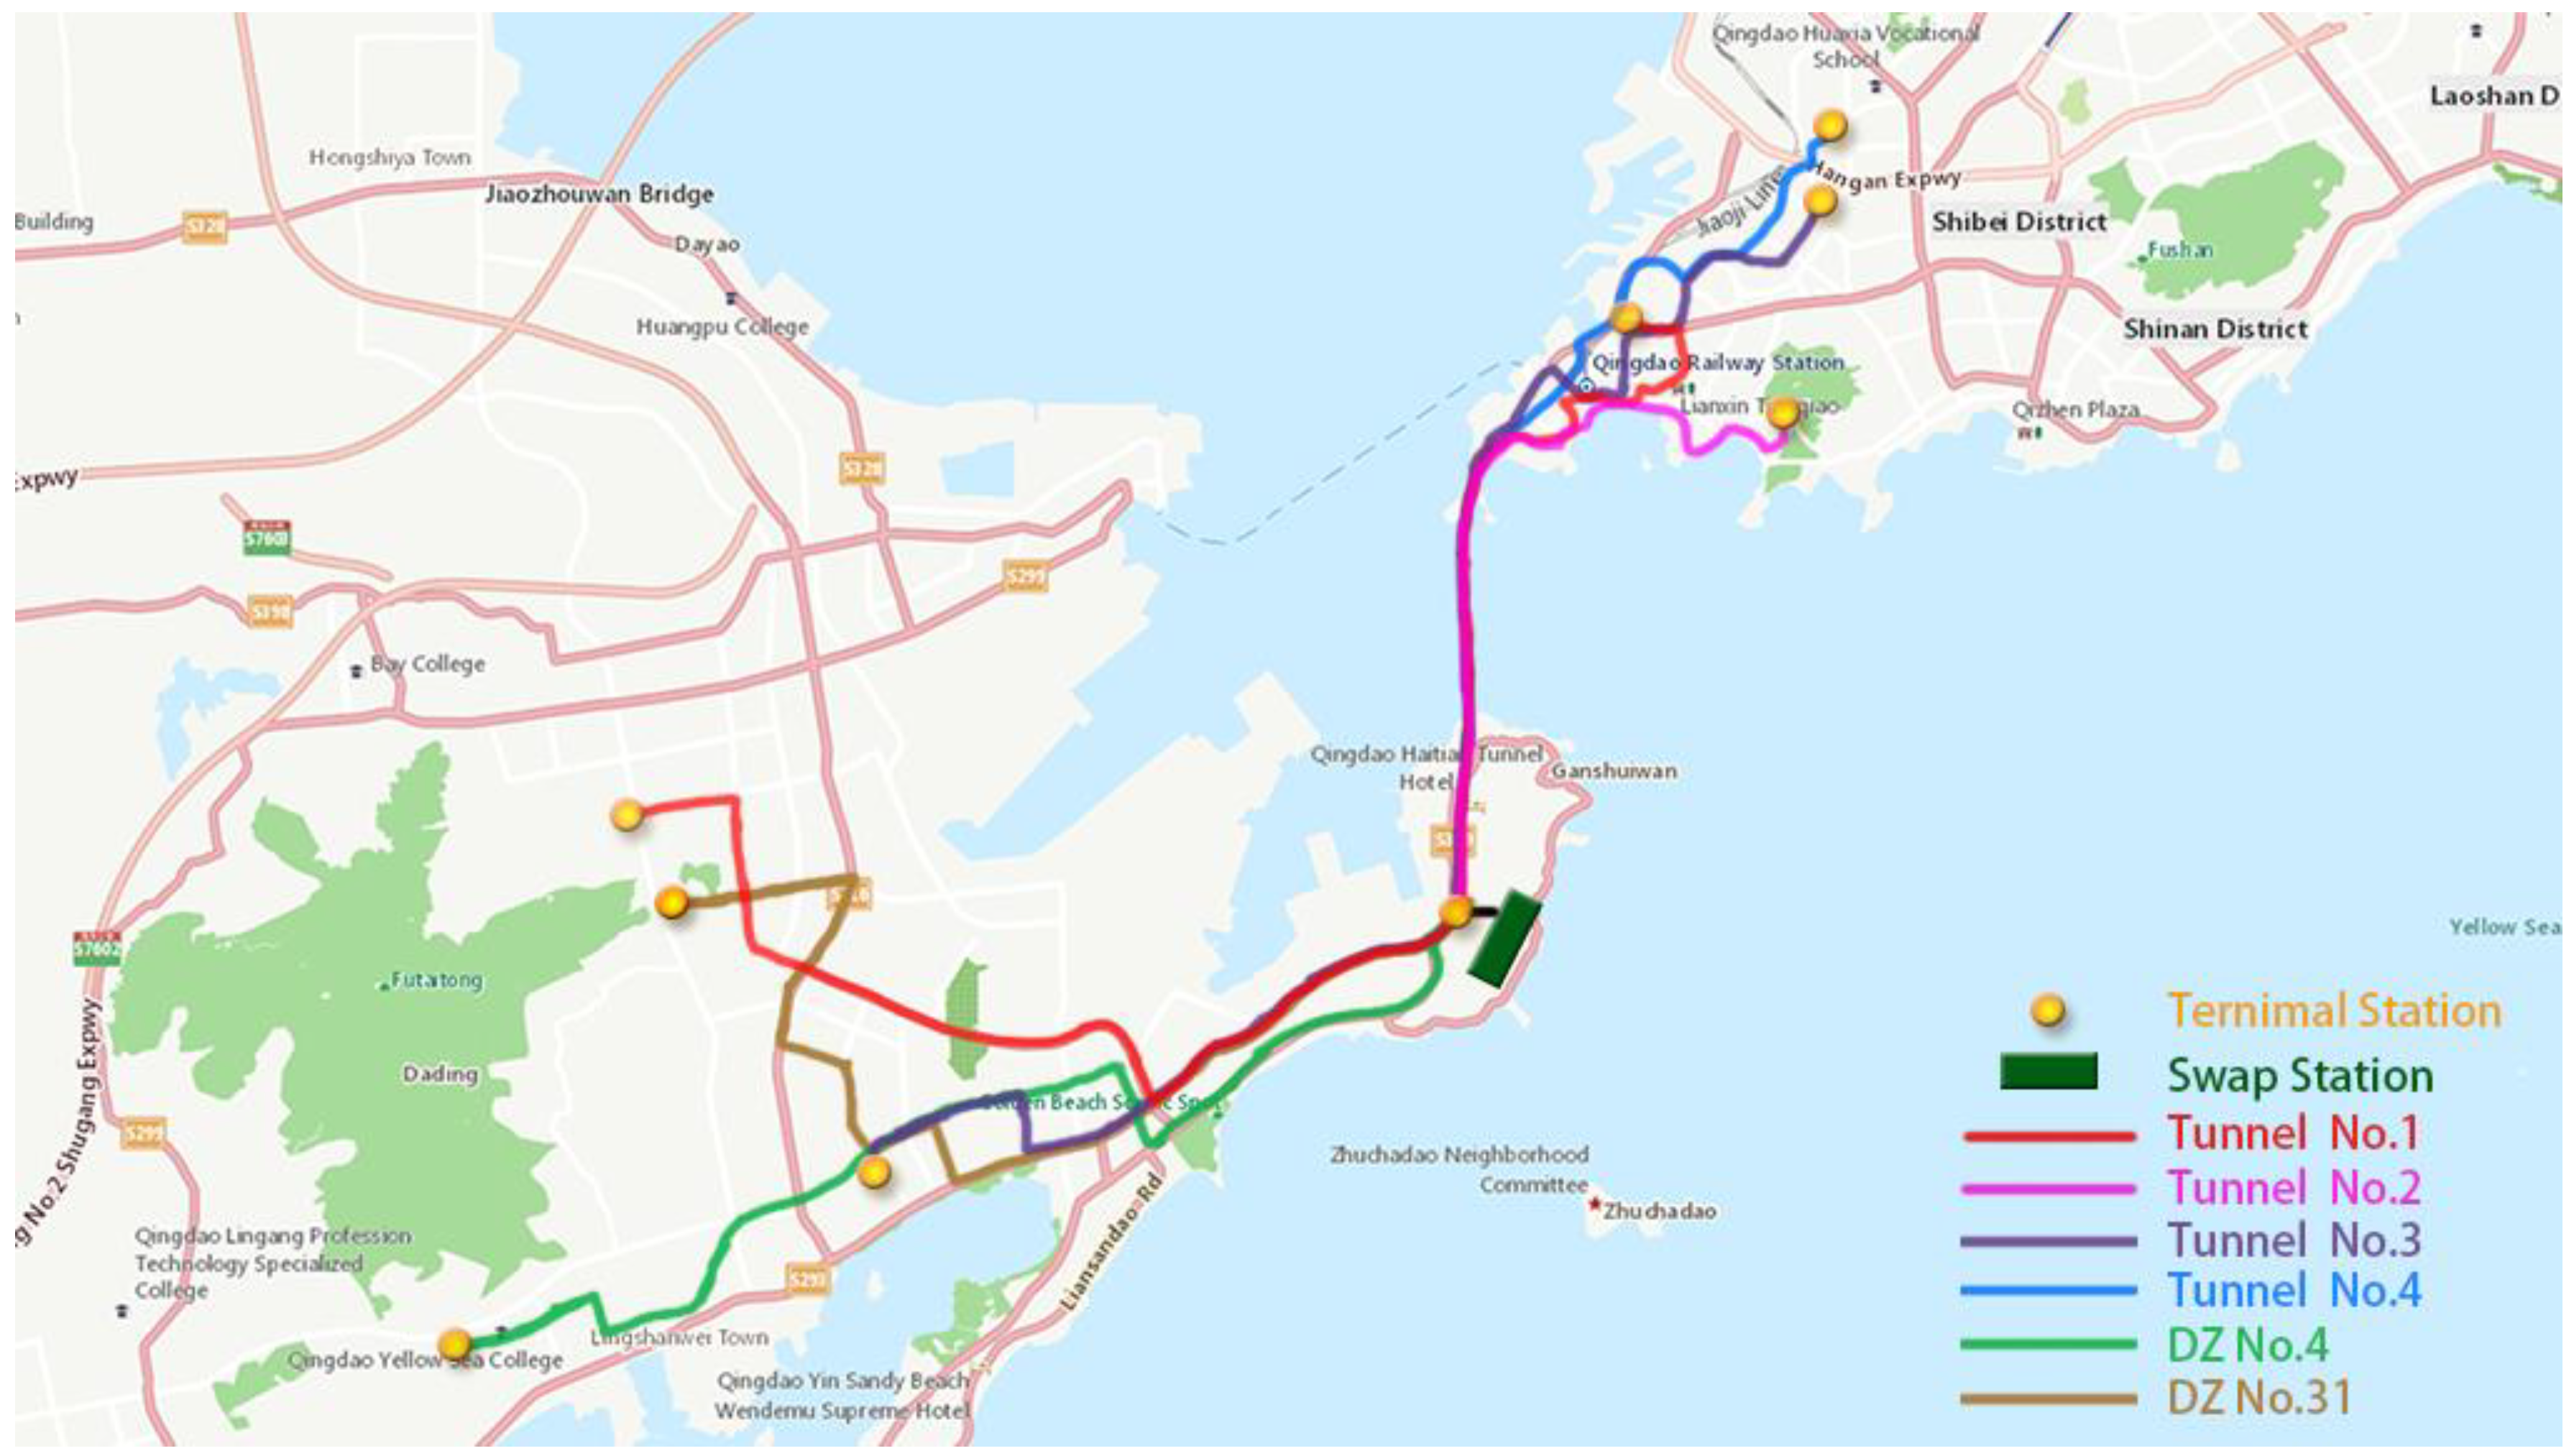
Xuejiadao Station is the world’s largest and most advanced intellectual BSS for BEBs in Qingdao, Shandong Province, China. The station is located at Huangdao Exit of Jiaozhou Bay Undersea Tunnel, which connects Qingdao and Huangdao. It is designed to serve for 6 BEB routes near the Undersea Tunnel (Figure 5). Besides, it takes only 8 min to swap a battery for a bus. Therefore, it can complete 540 times of battery swapping during the service time of one day [26]. The working process of Xuejiadao BSS is displayed in Figure 6 which is from an advertising video made by Phoenix Contact.
3.2. Simulation of Operation
Based on the method proposed above, we designed a MATLAB program to simulate the operation of Xuejiadao electric public transport system. Inputting the prepared data and run the program, the daily scheduling of the routes and operation of the BSS can be simulated minute by minute. Then, the minutely state of the BEBs, swapping systems and charging systems are recorded into matrixes: Departure(m,n) & Arrival(m,n), SwapS(h,n) & SwapE(h,n), and ChargeS(b) & ChargeE(b) respectively, by which the swapping and charging demand of the BSS can be analyzed (Figure 7).
As shown in Figure 7a, the BEBs arrive at BSS from 11:00 of the current day to 2:00 of the next day. There are two peak-hours during the service time, which are 14:00–15:00 and 20:00–21:00 respectively. And different routes have different time distributions of BEBs arriving at BSS. According to Rule 3, every BEB needs to go to swap battery pack after finished its last round of one day. Since there are no more tasks for the BEB after that, it is not necessary to complete the swapping and charging immediately. In consequence, we exclude the last battery swapping and charging of all BEBs when plotting the Figure 7b,c, which present the time distributions of battery swapping and battery charging at the BSS. The peaks of the distribution curves indicate that there are at most 5 BEBs being swapped and 73 battery packs being charged at the same time, which can decide the scales of battery swapping systems and battery charging systems according to Equations (28) and (30).
3.3. Evaluation of Operation
There are several key parameters evaluating the operation of the Xuejiadao electric public transport system as shown in Table 4. The average daily mileage measures the travel demand of the BEBs. The average daily swapping times measures the swapping demand of the BEBs. The average charging time evaluates the charging efficiency of the BSS. The max driving range per charge evaluates the capacity of the battery packs of BEBs. The energy consumption evaluates the use efficiency of the battery packs of BEBs. Thus, these parameters can reflect the operation effect of the electric public transport system. By comparing the simulated values with the actual values, it can be concluded that the simulation can provide an equivalent state of operation with the actual situation, which verifies the validity of the simulation and method proposed above.
4. Results and Discussion
Through the MATLAB simulation of operation, we can design scales of the Xuejiadao electric public transport system. Comparing the simulated values with actual values in Table 5, we find that the scales calculated by our method are mostly smaller than the actual scales. It indicates that there is redundancy in the actual configuration of Xuejiadao station. This method can optimize the system scales satisfying the equivalent state of operation demand and improve the efficiency of the system.
With the development of power battery manufacture and charging technology, the battery capacity (C) and intensity of charging current (I) will increase, which can influence the swapping and charging demand. As a result, the required scales of the BSS are changed. Thus, we make sensitivity analyses to the numbers of battery packs, swapping units and charging units, and power capacity of BSS via changing the simulation parameters: C and I (as shown in Figure 8).
We can conclude that the design scales of the electric public transport system decrease significantly when C varies from 300 Ah to 500 Ah. Less swapping and charging are needed for BEBs because the driving range of BEB can be increased as the battery capacity increases. However, if the battery capacity reached above 500 Ah, the battery energy of BEB could be enough to support whole day operation. In this case, it’s not necessary to build battery swap station since the BEBs can be charged in slow charging station after finishing all tasks of the whole day.
On the other hand, the numbers of battery packs and charging units decrease gradually, and the power capacity of BSS increases slightly with I varying from 80 A to 200 A. The changes of I have no influence on the number of swapping units. When the charging voltage is fixed, larger I means larger charging power and faster-charging speed. As a consequence, the charging time of a battery pack can be reduced, so that there is no need for more charging facilities and backup battery packs.
To sum up, with the increase of battery capacity (C) and charging current (I), fewer battery packs and swapping/charging devices are needed for a BSS so that the high cost of a BSS can be reduced effectively. Consequently, it’s important to advance the technologies in the power battery manufacture and charging in the future. And advancing battery technology seems to promise larger impacts than the charging technology.
5. Conclusions
This paper presents a novel method to design the electric public transport system under the battery swap mode. The terminal stations, route lengths, and bus configurations are replanned for BEB routes: the terminal stations should be nearby the BSS; the route length should be matched with the driving range of BEB; and the bus configuration should satisfy the departure in peak hours. Based on the running rules of BEBs, new scheduling strategies are made for the electric public transport system. The swapping and charging demand of BEB fleets can be analyzed through the scheduling timetable. Then the time distribution of battery swapping and charging are obtained. As a result, the design scales of battery swap station can be calculated, including the scales of battery packs, battery swapping system and battery charging system.
The method has been verified via a case study of Xuejiadao Station serving 6 BEB routes. With a numerical simulation, we simulate the operations of the 6 BEB routes and evaluate the simulation results. The operation parameters and scales of the electric public transport system in the simulation are close to the actual values which indicate that the design method we proposed is effective. Besides, we make sensitivity analyses to the scales of BSS under different values of battery capacity (C) and charging current (I). It suggests that advances in battery manufacture and charging technology can significantly reduce the cost of the BSS, which can promote the adoption of BEB.
This paper contributes to the planning of the alternative fuel vehicle transportation systems. It provides a design guide for government, bus companies, infrastructure operators and other decision-makers, which can avoid blind constructions and investments. However, there are also several limitations in this study, which also motivate a few future research directions. First, the rules and assumptions we proposed in this paper may not be always realized in the real world. For example, the charging time of battery pack is not in linear correlation with the charging depth since the last 10% capacity is in constant voltage charging mode, which is significantly slower. In this case, the battery may not be fully charged when it is swapped in the BEBs. As a result, the driving range of the BEBs may decrease and the charging time is variable. To make this method more practical and reliable, more investigations on the battery characteristics and charging efficiency should be conducted in future. Besides, we will further consider the stochasticity of demand in the model in the future study.
Author Contributions
Conceptualization, Y.L. and W.L.; Methodology, W.L., L.B. and H.D.; Software, W.L.; Validation, H.D.; Formal Analysis, W.L.; Investigation, L.B.; Resources, W.L.; Data Curation, H.D.; Writing-Original Draft Preparation, W.L.; Writing-Review & Editing, Y.L.; Visualization, B.L.; Supervision, Y.L.; Project Administration, Y.L.; Funding Acquisition, Y.L.
Funding
This research was funded by National Natural Science Foundation of China [grant number: 71774118, 91546115] and Science and Technology Commission of Shanghai Municipality [grant number: 16511105204].
Acknowledgments
The first author gratefully acknowledge the financial support by China Scholarship Council.
Conflicts of Interest
The authors declare no conflict of interest.
Abbreviations
| Parameter | Notation |
| a0 | the design area for each bus (km2) |
| A | the planning land area of the terminal station (km2) |
| l | the distance between terminal station and BSS (km) |
| lmax | the design maximum distance between terminal station and BSS (km) |
| L | route length, i.e., the distance between the departure station and arrival station (km) |
| Lj | the distance between the j-th stop and its next stop |
| C | electric capacity of battery pack (Ah) |
| U | voltage of battery pack (V) |
| E | energy of battery pack (kWh) |
| e | energy consumption of BEB running per kilometer (kWh/km) |
| Tt | the turnover time of the route (min) |
| Tl | the travel time of BEB running from terminal station to BSS |
| Ts | the time each battery swapping should take |
| Tch | the charging charging of battery pack |
| tS | the start of service time of BSS |
| tE | the end of service time of BSS |
| tstop | the average time of each stop (min) |
| V | the average speed of buses (km/h) |
| Range | theoretical maximum driving range of BEB (km) |
| range | actual maximum driving range of BEB (km) |
| Kti | the non-uniformity coefficient of the i-th hour |
| Qi | the passenger volume of the route during the i-th hour |
| Qh | the average passenger volume of the route |
| Pjk | the number of passengers arriving at the k-th bus stop during j-th departure period |
| Pjmax | the maximum number of passengers arriving at a bus stop during j-th departure period |
| PC | the passenger capacity of the route, |
| φ | the average passenger load factor of the route |
| Fj | the maximum frequency of departure during j-th departure period |
| Ij | the actual interval during i-th departure period |
| DOC | depth of charge of battery pack |
| DOD | depth of discharge of battery pack |
| SOC | state of charge of battery pack |
| SOCmin | the minimum value of SOC |
| I | the intensity of charging current |
| α | battery’s charging efficiency |
| δ | the reactive loss of lines |
| ηmax | the max efficiency of the charger |
| γ% | the design margin (10%~20%) |
| Nbus(T) | the number of buses parking in the terminal station |
| Nbus(R) | the number of buses configured for route R |
| Nmax | the maximum number of rounds a BEB can finish without swapping |
| Nbattery | the number of the battery packs the BSS should hold |
| Nb | needed number of the backup battery packs |
| NBb | the actual number of the backup battery packs |
| NRack | the number of charging racks where the battery packs store |
| Nbus(S) | the number of buses the BSS serving for |
| Ncharger | the total number of single chargers in the BSS |
| Ncu | the number of charging unit |
| NSU | the number of battery swapping units |
| nb | the number of batteries composing a battery pack |
| nstop | the number of stops in the route |
| PCU | the charging power of charging unit (kW) |
| Pcharger | output power of single charger |
| PS | the power capacity of battery charging system |
| Departure(m,n) | the m-th departure time of bus n |
| Arrival(m,n) | the m-th arrival time of bus n |
| SwapS (h, n) | the start time of h-th swapping of the bus n |
| SwapE (h, n) | the end time of h-th swapping of the bus n |
| ChargeS(b) | the start time of b-th battery charging |
| ChargeE(b) | the end time of b-th battery charging |
| SwapDis(t) | the time distribution of battery swapping |
| ChargeDis(t) | the time distribution of battery charging. |
References
- Dong, J.; Liu, C.; Lin, Z. Charging infrastructure planning for promoting battery electric vehicles: An activity-based approach using multiday travel data. Transp. Res. Part C Emerg. Technol. 2014, 38, 44–55. [Google Scholar] [CrossRef]
- Maria, V.D.H. CO2 Emissions from Fuel Combustion Highlights, 2014 ed.; International Energy Agency: Paris, France, 2014; p. 10. [Google Scholar]
- Li, Y.; Li, W.; Wei, Y.; Bao, L.; Deng, H. Using personal carbon dioxide trading to promote cleaner cars. Proc. Inst. Civ. Eng. Transp. 2017, 170, 86–98. [Google Scholar] [CrossRef]
- Sellmair, R.; Hamacher, T. Method of Optimization for Infrastructure of Charging Stations for Electric Taxis. In Proceedings of the 93rd Annual Meeting of the Transportation Research Board, Washington, DC, USA, 12–16 January 2014. [Google Scholar]
- Mesbah, M.; Sarvi, M.; Currie, G.; Saffarzadeh, M. Policy-making tool for optimization of transit priority lanes in urban network. Transp. Res. Rec. J. Transp. Res. Board 2010, 2197, 54–62. [Google Scholar] [CrossRef] [Green Version]
- Chen, L.; Wu, M.; Xu, X. The development and applications of charging/battery swap technologies for EVs. In Proceedings of the 5th International Conference on Electricity Distribution, Shanghai, China, 10–14 September 2012. [Google Scholar]
- Mak, H.Y.; Rong, Y.; Shen, Z. Infrastructure Planning for Electric Vehicles with Battery Swapping. Manag. Sci. 2013, 59, 1557–1575. [Google Scholar] [CrossRef]
- Foley, A.M.; Winning, I.J.; Gallachoir, B. State-of-the-art in electric vehicle charging infrastructure. In Proceedings of the IEEE Vehicle Power and Propulsion Conference (VPPC), Lille, France, 1–3 Septermber 2010; pp. 1–6. [Google Scholar]
- Li, W.; Li, Y.; Fan, J.; Deng, H. Siting of Carsharing Stations Based on Spatial Multi-Criteria Evaluation: A Case Study of Shanghai EVCARD. Sustainability 2017, 9, 152. [Google Scholar] [CrossRef]
- Lee, Y.; Kim, H.; Kho, S.; Lee, C. UE-based Location Model of Rapid Charging Stations for EVs with Batteries that Have Different States-of-charge. In Proceedings of the Transportation Research Board 93rd Annual Meeting, Washington, DC, USA, 12–16 January 2014. [Google Scholar]
- Cui, F.; You, X.; Shi, H.; Liu, H. Optimal siting of electric vehicle charging stations using pythagorean fuzzy vikor approach. Math. Probl. Eng. 2018, 2018, 9262067. [Google Scholar] [CrossRef]
- Nie, Y.M.; Ghamami, M. A corridor-centric approach to planning electric vehicle charging infrastructure. Transp. Res. Part B Methodol. 2013, 57, 172–190. [Google Scholar] [CrossRef]
- Yang, J.; Dong, J.; Hu, L. A data-driven optimization-based approach for siting and sizing of electric taxi charging stations. Transp. Res. Part C Emerg. Technol. 2017, 77, 462–477. [Google Scholar] [CrossRef]
- Liu, Y.; Guo, S.; Chen, Z. Site Selection and Scale Determination for Electric Vehicle Charging Stations. In Proceedings of the 91st Annual Meeting of the Transportation Research Board, Washington, DC, USA, 22–26 January 2012. [Google Scholar]
- Kemper, F.P.; Suh, I. Implementation Cost Comparison of Different Types of Electric Vehicle Energy Replenishment Technologies for Public Transit Bus Systems. Transp. Res. Rec. J. Transp. Res. Board 2013, 2352, 11–19. [Google Scholar]
- Wang, X.; Yuen, C.; Hassan, N.U.; An, N.; Wu, W. Electric Vehicle Charging Station Placement for Urban Public Bus Systems. IEEE Trans. Intell. Transp. Syst. 2017, 18, 128–139. [Google Scholar] [CrossRef]
- Rohrbeck, B.; Berthold, K.; Hettich, F. Location Planning of Charging Stations for Electric City Buses Considering Battery Ageing Effects. In Operations Research Proceedings 2017; Springer: Cham, Switzerland, 2018; pp. 701–707. [Google Scholar]
- Liu, N.; Chen, Z.; Liu, J.; Tang, X.; Xiao, X.; Zhang, J. Multi-objective optimization for component capacity of the photovoltaic-based battery switch stations: Towards benefits of economy and environment. Energy 2014, 64, 779–792. [Google Scholar] [CrossRef]
- Yu, Z.; Zhao, Y.D.; Yan, X.; Ke, M.; Jun, H.Z.; Jing, Q. Electric Vehicle Battery Charging/Swap Stations in Distribution Systems: Comparison Study and Optimal Planning. IEEE Trans. Power Syst. 2014, 29, 221–229. [Google Scholar]
- Zhang, T.; Chen, X.; Yu, Z.; Zhu, X.; Shi, D. A Monte-Carlo Simulation Approach to Evaluate Service Capacities of EV Charging and Battery Swapping Stations. IEEE Trans. Ind. Inf. 2018. [Google Scholar] [CrossRef]
- Bobanac, V.; Pandzic, H.; Capuder, T. Survey on electric vehicles and battery swapping stations: Expectations of existing and future EV owners. In Proceedings of the 2018 IEEE International Energy Conference (ENERGYCON), Limassol, Cyprus, 3–7 June 2018. [Google Scholar]
- Kaschub, T.; Paetz, A.; Jochem, P.; Fichtner, W. Feasibility of battery switch stations for local emission free public transport. In Proceedings of the Enerday 7th Conference on Energy Economics and Technology, Dresden, Germany, 27 April 2012. [Google Scholar]
- Dai, Q.; Cai, T.; Duan, S.; Zhao, F. Stochastic Modeling and Forecasting of Load Demand for Electric Bus Battery-Swap Station. IEEE Trans. Power Deliv. 2014, 29, 1909–1917. [Google Scholar] [CrossRef]
- Axsen, J.; Burke, A.; Kurani, K.S. Batteries for Plug-In Hybrid Electric Vehicles (PHEVs): Goals and the State of Technology Circa; Institute of Transportation Studies, University of California: Davis, CA, USA, 2008. [Google Scholar]
- Zhang, X. Research on Integrated Bus and Driver Scheduling. Master’s Thesis, Beijing Jiaotong University, Beijing, China, 2008. [Google Scholar]
- World’s Largest Electric Vehicle Charging and Changing Station Starts Trial Operation. Available online: http://www.sgcc.com.cn/ywlm/mediacenter/inspotlight/09/255598.shtml (accessed on 15 February 2015).
Figure 1.
The running track of BEB.

Figure 2.
Flow diagram of planning method.

Figure 3.
The example layout of the battery swap station [6].
Figure 3.
The example layout of the battery swap station [6].

Figure 4.
Algorithm flowchart for calculating the number of backup battery packs.
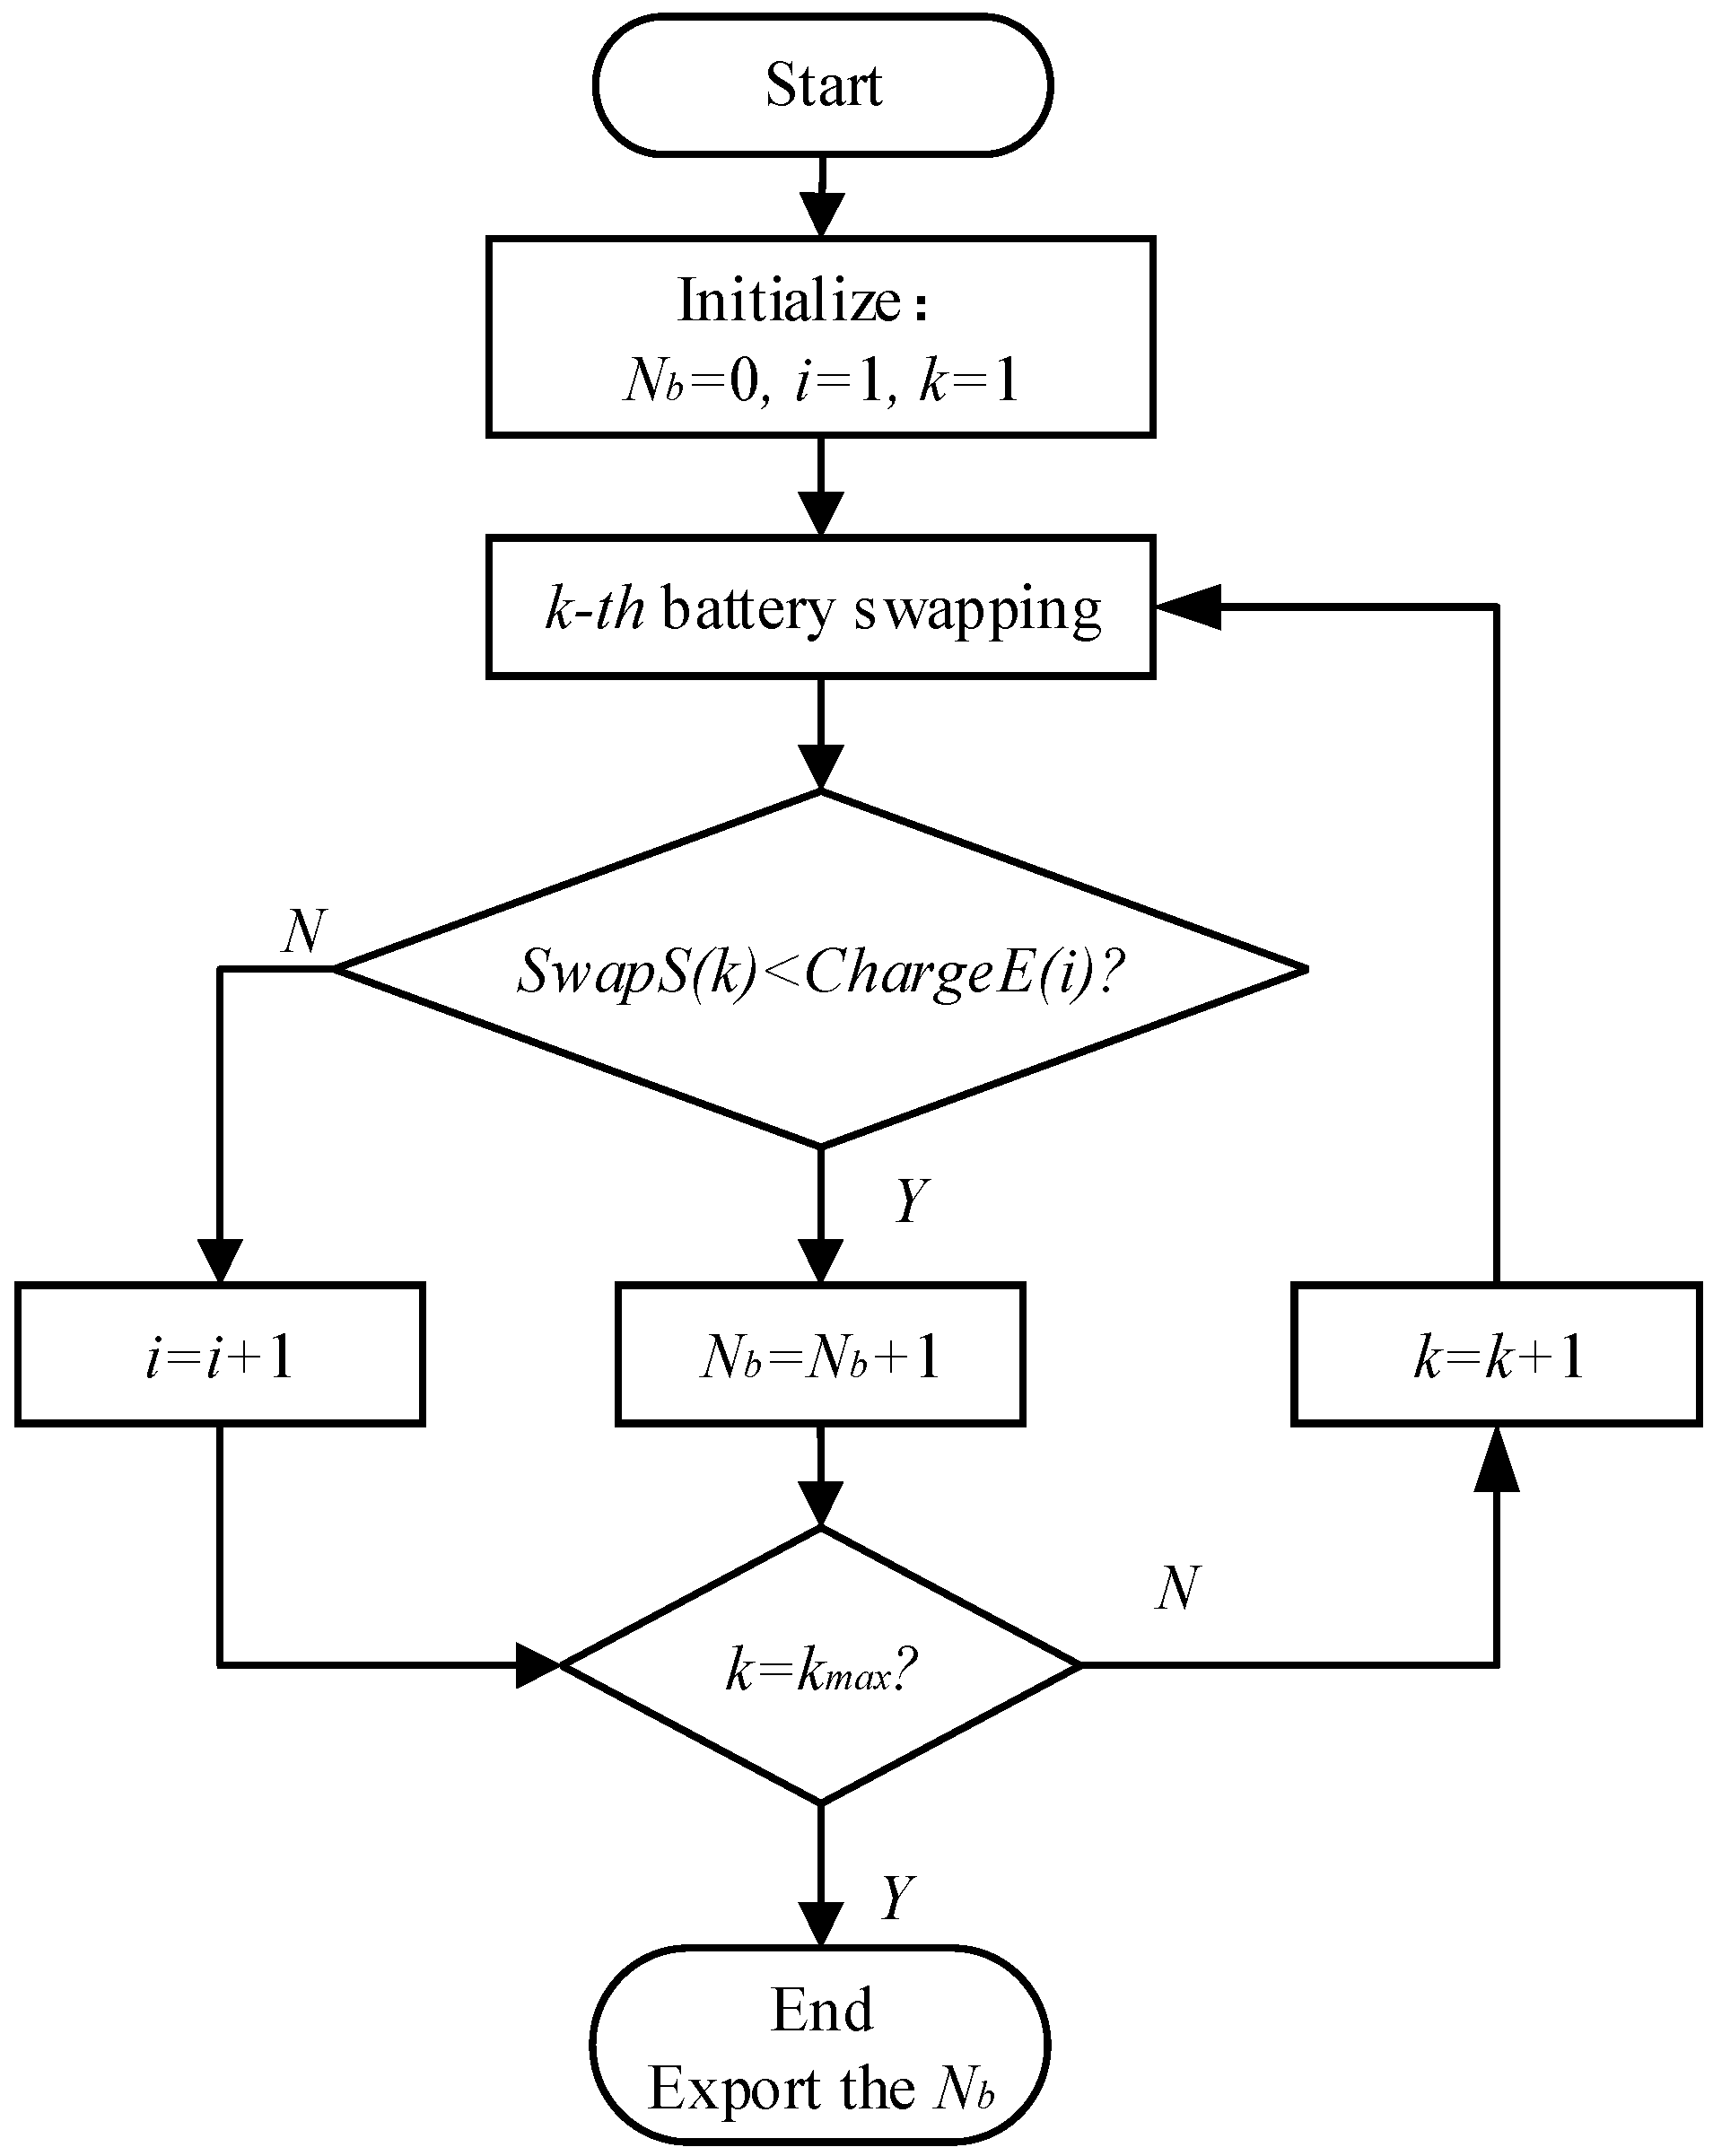
Figure 5.
Spatial layout of BEB routes and BSS.

Figure 6.
Working process of battery swapping for the BEB at the BSS.

Figure 7.
Swapping and charging demand analysis. (a) Time distribution of BEBs arriving at BSS; (b) Time distribution of battery swapping; (c) Time distribution of battery charging.
Figure 7.
Swapping and charging demand analysis. (a) Time distribution of BEBs arriving at BSS; (b) Time distribution of battery swapping; (c) Time distribution of battery charging.

Figure 8.
Sensitivity analysis of design scales.


Table 1.
Example of scheduling timetable.
| Serial Number of | Departure Time (m,n) | Arrival Time (m,n) | Serial Number of | Swap Start Time (h,n) | Swap End Time (h,n) | ||
|---|---|---|---|---|---|---|---|
| Round (m) | Bus (n) | Swap (h) | Bus (n) | ||||
| 1 | 1 | 6:00 | 6:30 | 1 | 1 | 10:35 | 10:43 |
| 1 | 2 | 6:10 | 6:40 | 1 | 2 | 10:45 | 10:53 |
| 1 | 3 | 6:20 | 6:50 | 1 | 3 | 10:55 | 11:03 |
| … | … | … | … | … | … | … | … |
| 2 | 1 | 7:00 | 7:30 | 2 | 1 | 18:30 | 18:38 |
| 2 | 2 | 7:05 | 7:35 | 2 | 2 | 18:40 | 18:48 |
| 2 | 3 | 7:10 | 7:40 | 2 | 3 | 18:50 | 18:58 |
| … | … | … | … | … | … | … | … |
Table 2.
Operation and Scheduling of the BEB Routes.
| Details | Tunnel No.1 | Tunnel No.2 | Tunnel No.3 | Tunnel No.4 | DZ No.4 | DZ No.31 |
|---|---|---|---|---|---|---|
| Number of Stops | 16 | 8 | 15 | 8 | 41 | 33 |
| Service Time | 05:40–21:00 | 05:30–21:25 | 6:10–21:00 | 6:00–21:00 | 05:50–22:35 | 05:50–22:00 |
| Length of Route | 33 km | 14 km | 28.8 km | 16.5 km | 23 km | 16.5 km |
| Average Speed | 30 km/h | 30 km/h | 30 km/h | 30 km/h | 20 km/h | 20 km/h |
| Distance between Terminal Station and BSS | 13 km | 0.5 km | 12.5 km | 0.5 km | 0.5 km | 0.5 km |
| Turnover Time of the Route * | 148 min | 64 min | 130 min | 74 min | 179 min | 132 min |
| Interval (off-peak) | 6–10 min | 5–8 min | 5–8 min | 5–8 min | 5–8 min | 6–10 min |
| Interval (peak) | 4–6 min | 4–6 min | 4–6 min | 4–6 min | 4–5 min | 5–8 min |
* average time of each stop is 0.5 min.
Table 3.
Simulation Parameter Setting.
| Parameter | C | nb | U | I | E | Range | SOCm | ηmax | φ | |
|---|---|---|---|---|---|---|---|---|---|---|
| Value | 300 Ah | 9 | 750 V | 80 A | 225 kWh | 180 km | 20% | 85% | 90% | 20% |
Table 4.
Comparison of the Simulated and Actual Values of the Operation Parameters.
| Operation Parameters | Average Daily Mileage | Average Daily Swapping Times | Average Charging Time | Max Driving Range per Charge | Energy Consumption |
|---|---|---|---|---|---|
| Simulated Value | 204 km | 1.83 | 139 min | 130.86 km | 1.25 kWh/km |
| Actual Value | 190 km | 2.00 | 144 min | 132.68 km | 1.2 kWh/km |
| Deviation | 7.37% | −8.50% | −3.47% | −1.37% | 4.17% |
Table 5.
Comparison of the Simulated and Actual Scale of the System.
| Scales | NBus | NBattery | NRack | NSU | NCU | NCharger | PCU | PCharger | PS |
|---|---|---|---|---|---|---|---|---|---|
| Simulated Value | 180 | 275 | 95 | 6 | 88 | 792 | 78 kW | 8.67 kW | 6.9 MW |
| Actual Value | 180 | 300 | 120 | 6 | 120 | 1080 | 90 kW | 10 kW | 8 MW |
| Deviation | 0.00% | −8.33% | −20.83% | 0.00% | −26.67% | −26.67% | −13.33% | −13.33% | −13.75% |
© 2018 by the authors. Licensee MDPI, Basel, Switzerland. This article is an open access article distributed under the terms and conditions of the Creative Commons Attribution (CC BY) license (http://creativecommons.org/licenses/by/4.0/).
Share and Cite
MDPI and ACS Style
Li, W.; Li, Y.; Deng, H.; Bao, L. Planning of Electric Public Transport System under Battery Swap Mode. Sustainability 2018, 10, 2528. https://doi.org/10.3390/su10072528
AMA Style
Li W, Li Y, Deng H, Bao L. Planning of Electric Public Transport System under Battery Swap Mode. Sustainability. 2018; 10(7):2528. https://doi.org/10.3390/su10072528
Chicago/Turabian StyleLi, Wenxiang, Ye Li, Haopeng Deng, and Lei Bao. 2018. "Planning of Electric Public Transport System under Battery Swap Mode" Sustainability 10, no. 7: 2528. https://doi.org/10.3390/su10072528
Note that from the first issue of 2016, this journal uses article numbers instead of page numbers. See further details here.