The Effect of Open Innovation on Technology Value and Technology Transfer: A Comparative Analysis of the Automotive, Robotics, and Aviation Industries of Korea


Abstract
:1. Introduction
1.1. Research Hypothesis
1.2. Research Scope and Method
2. Literature Review and Research Framework
2.1. Literature Review
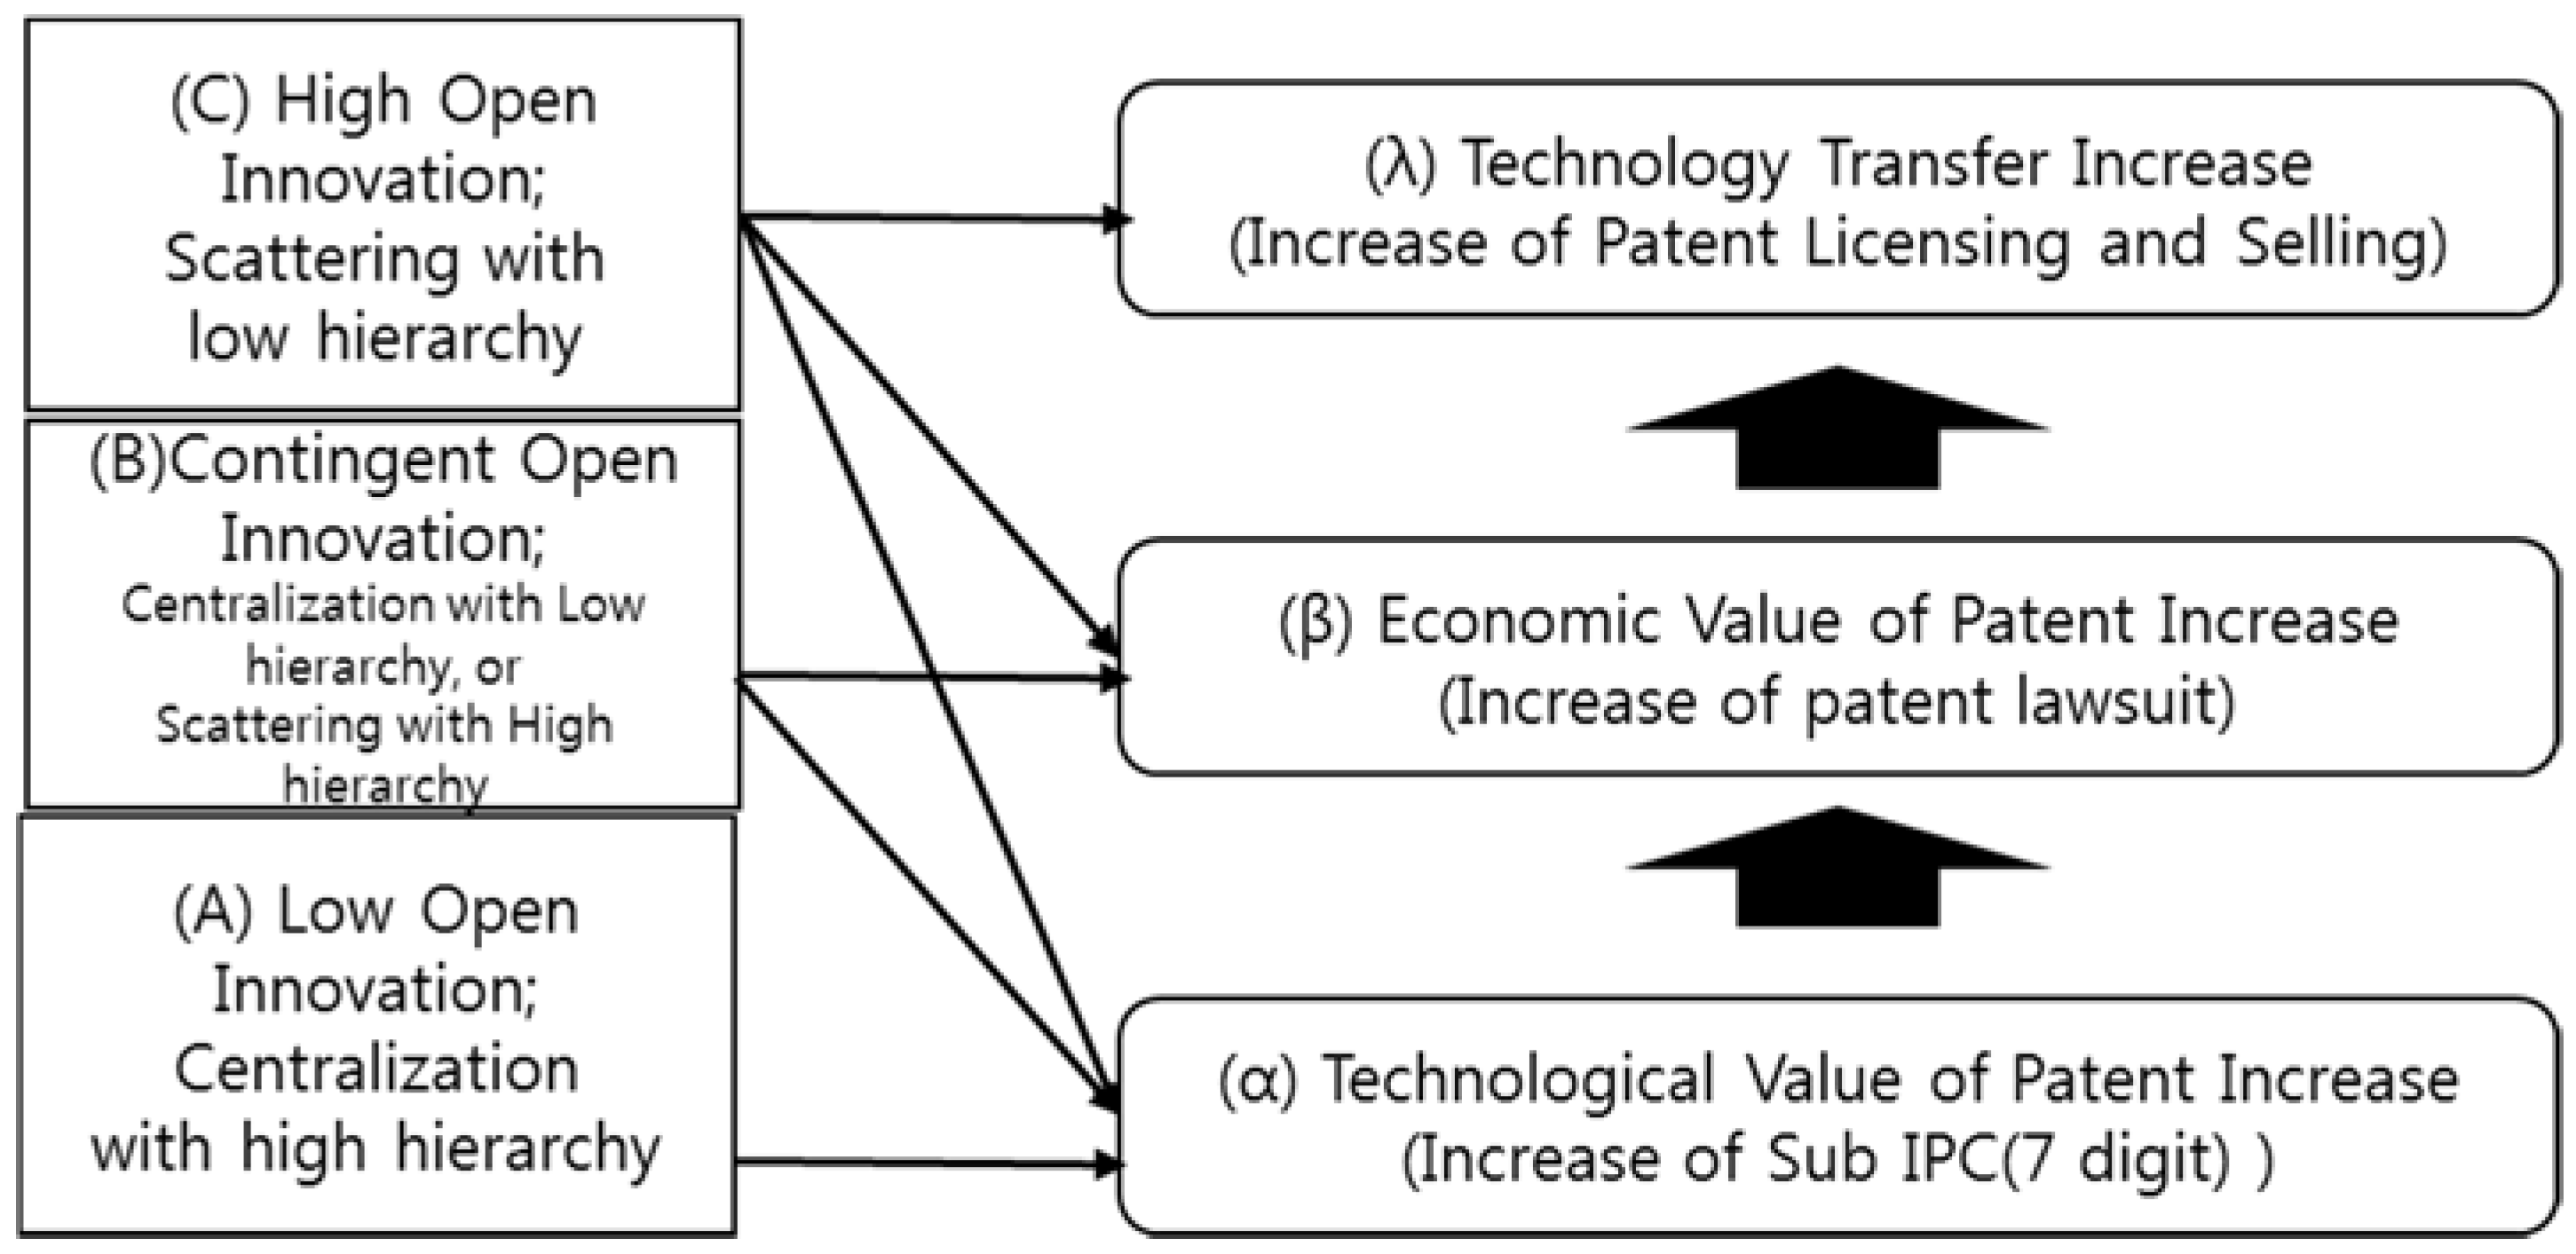
2.2. Research Framework and Hypothesis
3. Analysis and Hypothesis Tests
3.1. Descriptive Analysis of Patent Statistics
3.1.1. Ratio of Joint Patent Application
3.1.2. Analysis According to the International Patent Classification
3.1.3. Patent Disputes
3.1.4. Number of Technology Transfer Cases
3.2. Analysis and Hypothesis Test of Open Innovation Effects in the Aviation Industry
3.3. Analysis and Hypothesis Test of Open Innovation Effects in the Automobile Industry
3.4. Analysis and Hypothesis Test of Open Innovation Effects in the Robot Industry
4. Discussion
4.1. High Concentration of Top Companies in Korea Is Opposite to Their Low Open Innovation
4.2. Leading Companies in Major Industries of Korea Are Still Focusing on Closed Innovation
4.3. The Possibility of Commercializing Patents Increases through Coapplying Them
5. Conclusions
5.1. Implication
5.2. Limitations and Future Research Agenda
Author Contributions
Acknowledgments
Conflicts of Interest
References
- Park, H.S. Technology convergence, open innovation, and dynamic economy. J. Open Innov. Technol. Mark. Complex. 2017, 13, 24. [Google Scholar] [CrossRef]
- Bowen, J.T. Global production networks, the developmental state and the articulation of Asia Pacific economies in the commercial aircraft industry. Asia Pac. Viewp. 2007, 48, 312–329. [Google Scholar] [CrossRef]
- Park, Y.; Lee, S.; Lee, S. Patent analysis for promoting technology transfer in multi-technology industries: The Korean aerospace industry case. J. Technol. Transf. 2012, 37, 355–374. [Google Scholar] [CrossRef]
- Dyer, J.H.; Chu, W. The role of trustworthiness in reducing transaction costs and improving performance: Empirical evidence from the United States, Japan, and Korea. Organ. Sci. 2003, 14, 57–68. [Google Scholar] [CrossRef]
- Park, S.; Hartley, J.L.; Wilson, D. Quality management practices and their relationship to buyer’s supplier ratings: A study in the Korean automotive industry. J. Oper. Manag. 2001, 19, 695–712. [Google Scholar] [CrossRef]
- Yun, J.J.; Won, D.; Jeong, E.; Park, K.; Yang, J.; Park, J. The relationship between technology, business model, and market in autonomous car and intelligent robot industries. Technol. Forecast. Soc. 2016, 103, 142–155. [Google Scholar] [CrossRef]
- Kim, Y.-Z.; Lee, K. Sectoral innovation system and a technological catch-up: The case of the capital goods industry in Korea. Glob. Econ. Rev. 2008, 37, 135–155. [Google Scholar] [CrossRef]
- Lechevalier, S.; Nishimura, J.; Storz, C. Diversity in patterns of industry evolution: How an intrapreneurial regime contributed to the emergence of the service robot industry. Res. Policy 2014, 43, 1716–1729. [Google Scholar] [CrossRef]
- Sohn, S.Y.; Kim, M.J. Strategies for revitalization for intelligent robot industry in Korea based on structural equation model. Ind. Robot 2010, 37, 97–105. [Google Scholar] [CrossRef]
- Lundvall, B.-Å. Innovation studies: A personal interpretation of the state of the art. In Innovation Studies: Evolution and Future Challenges; Fagerberg, J., Martin, B., Andersen, E.S., Eds.; Oxford University Press: New York, NY, USA, 2013; pp. 21–70. ISBN 978-0-19-968634-6. [Google Scholar]
- Chesbrough, H.W. Open Innovation: The New Imperative for Creating and Profiting from Technology; Harvard Business Press: Brighton, MA, USA, 2003; pp. 34–36, ISBN-10: 1422102831. [Google Scholar]
- Mention, A.-L.; Asikainen, A.-L. Measuring the impact of inbound open innovation practices on performance. In Services Open Innovation Research, Management and Practice; Tidd, J., Ed.; World Scientific: Singapore, 2014; Volume 23, pp. 237–265. ISBN 978-1-78326-280-9. [Google Scholar]
- Leydesdorff, L.; Ivanova, I. “Open innovation” and “triple helix” models of innovation: Can synergy in innovation systems be measured? J. Open Innov. Technol. Mark. Complex. 2016, 2, 11. [Google Scholar] [CrossRef]
- Chesbrough, H.W.; Teece, D.J. Organizing for Innovation: When Is Virtual Virtuous? The Transfer and Licensing of Know-How and Intellectual Property: Understanding the Multinational Enterprise in the Modern World; World Scientific: Singapore, 2008; pp. 335–341. ISBN 978-981-256-849-6. [Google Scholar]
- Yun, J.J.; Won, D.; Park, K. Dynamics from open innovation to evolutionary change. J. Open Innov. Technol. Mark. Complex. 2016, 2, 7. [Google Scholar] [CrossRef]
- Romer, P. Foreword. In Patents, Citations, and Innovations: A Window on the Knowledge Economy; Trajtenberg, M., Jaffe, A.B., Eds.; MIT Press: Cambridge, UK, 2002; pp. 9–11. ISBN 9780262100953. [Google Scholar]
- Sneed, K.A.; Johnson, D.K. Selling ideas: The determinants of patent value in an auction environment. R D Manag. 2009, 39, 87–94. [Google Scholar] [CrossRef]
- Agarwal, R.; Ganco, M.; Ziedonis, R.H. Reputations for toughness in patent enforcement: Implications for knowledge spillovers via inventor mobility. Strateg. Manag. J. 2009, 30, 1349–1374. [Google Scholar] [CrossRef]
- Reitzig, M.; Wagner, S. The hidden costs of outsourcing: Evidence from patent data. Strateg. Manag. J. 2010, 31, 1183–1201. [Google Scholar] [CrossRef]
- Aoki, R.; Schiff, A. Promoting access to intellectual property: Patent pools, copyright collectives, and clearinghouses. R D Manag. 2008, 38, 189–204. [Google Scholar] [CrossRef]
- Joshi, A.M.; Nerkar, A. When do strategic alliances inhibit innovation by firms? Evidence from patent pools in the global optical disc industry. Strateg. Manag. J. 2011, 32, 1139–1160. [Google Scholar] [CrossRef]
- Hagedoorn, J.; Cloodt, M. Measuring innovative performance: Is there an advantage in using multiple indicators? Res. Policy 2003, 32, 1365–1379. [Google Scholar] [CrossRef]
- Yun, J.J.; Jeong, E.; Park, J. Network analysis of open innovation. Sustainability 2016, 8, 729. [Google Scholar] [CrossRef]
- Galabova, L.P. Developing a knowledge-based economy through innovation policy: The cases of Bulgaria, Finland and Scotland. Sci. Public Policy 2012, 39, 802–814. [Google Scholar] [CrossRef]
- Johnstone, N.; Haščič, I.; Popp, D. Renewable energy policies and technological innovation: Evidence based on patent counts. Environ. Resour. Econ. 2010, 45, 133–155. [Google Scholar] [CrossRef]
- Brouwer, E.; Kleinknecht, A. Innovative output, and a firm’s propensity to patent: An exploration of CIS micro data. Res. Policy 1999, 28, 615–624. [Google Scholar] [CrossRef]
- Czarnitzki, D.; Hussinger, K.; Leten, B. The Market Value of Blocking Patent Citations; Paper No. 11-021; ZEW Discussion: Mannheim, Germany, 2011. [Google Scholar] [CrossRef]
- Chen, Y.-S.; Chang, K.-C. The nonlinear nature of the relationships between the patent traits and corporate performance. Scientometrics 2010, 82, 201–210. [Google Scholar] [CrossRef]
- Chen, Y.-S.; Chang, K.-C. The relationship between a firm’s patent quality and its market value—The case of US pharmaceutical industry. Technol. Forecast. Soc. Chang. 2010, 77, 20–33. [Google Scholar] [CrossRef]
- Gupta, A.K.; Dey, A.R.; Shinde, C.; Mahanta, H.; Patel, C.; Patel, R.; Sahay, N.; Sahu, B.; Vivekanandan, P.; Verma, S.; et al. Theory of open inclusive innovation for reciprocal, responsive and respectful outcomes: Coping creatively with climatic and institutional risks. J. Open Innov. Technol. Mark. Complex. 2016, 2, 16. [Google Scholar] [CrossRef]
- Svirina, A.; Zabbarova, A.; Oganisjana, K. Implementing open innovation concept in social business. J. Open Innov. Technol. Mark. Complex. 2016, 2, 20. [Google Scholar] [CrossRef]
- Fier, H.; Pyka, A. Is it worth all the trouble? An assessment of the economic value of firm patent applications with shared intellectual property rights in the biotechnology industry Technology Transfer in a Global Economy. In Technology Transfer in a Global Economy; Audretsch, D., Lehmann, E., Link, A., Sarnecker, A., Eds.; Springer: New York, NY, USA, 2012; pp. 123–142. ISBN 978-1-4614-6102-9. [Google Scholar]
- Hicks, D.; Narin, F. Strategic Research Alliances and 360 Degree Bibliometric Indicators. In Strategic Research Partnerships–Proceedings from a National Science Foundation Workshop; Janowski, J.E., Link, A.N., Vonortas, N.S., Eds.; National Science Foundation: Washington, DC, USA, 2001. [Google Scholar]
- Hagedoorn, J. Sharing intellectual property rights—An exploratory study of joint patenting amongst companies. Ind. Corp. Chang. 2003, 12, 1035–1050. [Google Scholar] [CrossRef]
- Hagedoorn, J.; Kranenburg, H.V.; Osborn, R.N. Joint patenting amongst companies‒exploring the effects of inter-firm R&D partnering and experience. Manag. Decis. Econ. 2003, 24, 71–84. [Google Scholar]
- Yun, J.J.; Jeong, E.; Yang, J. Open innovation of knowledge cities. J. Open Innov. Technol. Mark. Complex. 2015, 1, 16. [Google Scholar] [CrossRef]
- Yun, J.J.; Avvari, M.V.; Jeong, E.-S.; Lim, D.-W. Introduction of an objective model to measure open innovation and its application to the information technology convergence sector. Int. J. Technol. Policy Manag. 2014, 14, 383–400. [Google Scholar] [CrossRef]
- Yun, J.J.; Jeong, E.; Lee, C.; Park, J.; Zhao, X. Effect of distance on open innovation: Differences among institutions according to patent citation and reference. Sustainability 2017, 9, 1478. [Google Scholar] [CrossRef]
- Ma, Z.; Lee, Y. Patent application and technological collaboration in inventive activities: 1980–2005. Technovation 2008, 28, 379–390. [Google Scholar] [CrossRef]
- Teece, D.J. Profiting from technological innovation: Implications for integration, collaboration, licensing and public policy. Res. Policy 1986, 15, 285–305. [Google Scholar] [CrossRef]
- Ejermo, O. Patent Diversity as a Predictor of Regional Innovativeness in Sweden; Università Commerciale Luigi Bocconi: Milan, Italy, 2003. [Google Scholar]
- Suzuki, J.; Kodama, F. Technological diversity of persistent innovators in Japan: Two case studies of large Japanese firms. Res. Policy 2004, 33, 531–549. [Google Scholar] [CrossRef]
- Verspagen, B. Measuring intersectoral technology spillovers: Estimates from the European and US patent office databases. Econ. Syst. Res. 1997, 9, 47–65. [Google Scholar] [CrossRef]
- De Silva, L.R.; Uyarra, E.; Oakey, R. Academic entrepreneurship in a resource-constrained environment: Diversification and synergistic effects. In Technology Transfer in a Global Economy; Audretsch, D., Lehmann, E., Link, A., Starnecker, A., Eds.; Springer: Boston, MA, USA, 2012; Volume 28, pp. 73–97. ISBN 978-1-4614-6102-9. [Google Scholar]
- Putnam, J.; Evenson, R.E. Inter-Sectoral Technology Flows: Estimates from a Patent Concordance with an Application to Italy; Yale University: New Haven, CT, USA, 1994. [Google Scholar]
- Jaife, A. Technological Opportunity and spillovers of R&D: Evidence from firms’ patents, profits, and market value. Am. Econ. Rev. 1986, 76, 984–1001. [Google Scholar]
- Lee, J.J.; Yoon, H. A comparative study of technological learning and organizational capability development in complex products systems: Distinctive paths of three latecomers in military aircraft industry. Res. Policy 2015, 44, 1296–1313. [Google Scholar] [CrossRef]
- Park, H.; Kang, M.J.; Son, S. Factors affecting quality and performance—A case study of Korean aircraft maintenance unit. Total Qual. Manag. Bus. 2012, 23, 197–219. [Google Scholar] [CrossRef]
- Park, B.G. Politics of scale and the globalization of the South Korean automobile industry. Econ. Geogr. 2003, 79, 173–194. [Google Scholar] [CrossRef]


| Category | B60 (Automotive) | B25J (Robot) | B64 (Aviation) | Total |
|---|---|---|---|---|
| Category | 44,131 | 3896 | 1293 | 49,320 |
| 53,694 | 48,061 | 4253 | 1380 | |
| 60,330 | 53,941 | 4849 | 1540 | |
| History of administrative processes | 305 | 426 | 97 | 828 |
| Patent litigation | 958 | 123 | 41 | 1122 |
| Category | Name |
|---|---|
| TT_1 | [Exclusive License] [Full Transfer] Transfer of Right |
| TT_2 | [Exclusive License] Request for the Registration of the Establishment of License |
| TT_3 | [Non-exclusive License] Request for the Registration of the Establishment of License |
| TT_4 | [Patent Right] [Partial Transfer] Transfer of Right |
| TT_5 | [Patent Right] [Full Transfer] Transfer of Right |
| TT_6 | [Patent Right] [Partial Transfer of Share] Transfer of Right |
| TT_7 | [Patent Right] [Full Transfer of Share] Transfer of Right |
| Division | Automobile | Robotics | Aviation |
|---|---|---|---|
| Total number of patents | 44,131 | 3896 | 1293 |
| Top 3 firms number of patents (ratio %) | 16,611 (37.6%) | 491 (12.6%) | 506 (39.1%) |
| Number of joint applicant patents | 3277 | 279 | 67 |
| Total number of applicants | 48,060 | 4253 | 1380 |
| Average ratio of joint applied patents by each firm → Open innovation breadth | 24.11 | 27.25 | 23.18 |
| Top 3 firms Open innovation breadth | 1.75 | 4.57 | 1.59 |
| Average number of applicants in each patent by each firm → Open innovation depth | 1.37 | 1.49 | 1.41 |
| Top 3 firms Open innovation depth | 1.02 | 1.05 | 1.02 |
| Division | Car | Robotics | Aviation |
|---|---|---|---|
| Total number (A) | 44,131 | 3896 | 1293 |
| Multiple case (B) | 14,285 | 2088 | 686 |
| Convergence technology ratio (B/A) (%) | 32.4 | 53.6 | 53.1 |
| Division | Numbers | Ratio (%) |
|---|---|---|
| Car | 958 | 2.2 |
| Robotics | 123 | 3.2 |
| Aviation | 41 | 3.2 |
| Division | Subtotal | TT_1 | TT_2 | TT_3 | TT_4 | TT_5 | TT_6 | TT_7 | Ratio |
|---|---|---|---|---|---|---|---|---|---|
| Car | 305 | 13 | 4 | 43 | 217 | 28 | 0.7 | ||
| Robotics | 426 | 2 | 23 | 10 | 23 | 338 | 2 | 28 | 10.9 |
| Aviation | 97 | 5 | 7 | 7 | 69 | 1 | 8 | 7.5 | |
| Total/Average | 828 | 2 | 41 | 21 | 73 | 624 | 3 | 64 | 6.4 |
| Category | Mean | SD | 1 | 2 | 3 | 4 | 5 | 6 |
|---|---|---|---|---|---|---|---|---|
| 1. OI depth (OID) | 4.138 | 16.412 | - | |||||
| 2. OI breadth (OIB) | 0.355 | 0.832 | 0.518 ** | |||||
| 3. IOI × ROI | 0.517 | 8.407 | 0.809 ** | 0.556 ** | ||||
| 4. (IOI × ROI)2 | 70.789 | 1455.558 | 0.807 ** | 0.505 ** | 0.994 ** | |||
| 5. Total number of technology transfers | 1.560 | 1.017 | 0.307 ** | 0.137 | 0.274 * | 0.281 * | ||
| 6. Total number of disputes | 1.316 | 0.620 | 0.405 * | 0.295 | 0.188 | 0.186 | −0.186 * | |
| 7. Total number of IPCs (7D) | 7.641 | 34.982 | 0.991 ** | 0.472 ** | 0.772 ** | 0.769 ** | 0.282 * | 0.414 ** |
| Dependent Variables (Row) Independent Variables (Column) | Regression 1 | Regression 2 | ||||
|---|---|---|---|---|---|---|
| b | Standard β | t | b | Standard β | t | |
| OID × OIB | 0.010 | 0.358 | 0.859 | −0.133 | −4.626 | −0.346 |
| (OID × OIB)2 | 0.001 | 4.987 | 0.373 | |||
| R2 | 0.128 | 0.158 | ||||
| F | 0.737 | 0.375 | ||||
| Dependent Variables (Row) Independent Variables (Column) | Regression 1 | Regression 2 | ||||
|---|---|---|---|---|---|---|
| b | Standard β | t | b | Standard β | t | |
| OID × OIB | 0.003 | 0.226 | 0.518 | −0.151 | −12.623 | −0.998 |
| (OID × OIB)2 | 0.001 | 12.856 | 1.016 | |||
| R2 | 0.051 | 0.246 | ||||
| F | 0.269 | 0.651 | ||||
| Dependent Variables (Row) Independent Variables (Column) | Regression 1 | Regression 2 | ||||
|---|---|---|---|---|---|---|
| b | Standard β | t | b | Standard β | t | |
| OID × OIB | 2.703 | 0.782 * | 2.803 | −48.064 | −13.900 | −2.600 |
| (OID × OIB)2 | 0.292 | −14.691 | 2.748 | |||
| R2 | 0.611 | 0.865 | ||||
| F | 7.858 * | 12.852 * | ||||
| Category | Mean | SD | 1 | 2 | 3 | 4 | 5 | 6 |
|---|---|---|---|---|---|---|---|---|
| 1. OI depth (OID) | 8.639 | 170.432 | - | |||||
| 2. OI breadth (OIB) | 0.676 | 7.018 | 0.923 * | |||||
| 3. OID × OIB | 0.922 | 72.278 | 0.947 * | 0.931 * | ||||
| 4. (OID × OIB)2 | 5224.173 | 4.315 | 0.944 * | 0.927 * | 1.000 * | |||
| 5. Total number of technology transfers | 1.905 | 3.570 | −0.570 | 0.066 | −0.660 | −0.660 | ||
| 6. Total number of disputes | 2.339 | 4.524 | 0.703 * | 0.692 * | 0.612 * | 0.605 * | −0.605 * | |
| 7. Total number of IPCs (7D) | 13.330 | 267.679 | 0.995 * | 0.936 * | 0.936 * | 0.955 * | −0.955 * | 0.709 * |
| Dependent Variables (Row) Independent Variables (Column) | Regression 1 | Regression 2 | ||||
|---|---|---|---|---|---|---|
| b | Standard β | t | b | Standard β | t | |
| OID × OIB | −0.001 | −0.080 | −0.414 | −0.009 | −1.151 | −0.065 |
| (OID × OIB)2 | 1.407 × 10⁻⁶ | 1.072 | 0.061 | |||
| R2 | 0.006 | 0.006 | ||||
| F | 0.172 | 0.085 | ||||
| Dependent Variables (Row) Independent Variables (Column) | Regression 1 | Regression 2 | ||||
|---|---|---|---|---|---|---|
| b | Standard β | t | b | Standard β | t | |
| OID × OIB | 0.011 | 0.943 * | 14.707 | 0.278 | 24.864 * | 6.976 |
| (OID × OIB)2 | −4.482 × 10⁻⁵ | −23.922 * | −6.712 | |||
| R2 | 0.889 | 0.959 | ||||
| F | 216.296 * | 307.116 * | ||||
| Dependent Variables (Row) Independent Variables (Column) | Regression 1 | Regression 2 | ||||
|---|---|---|---|---|---|---|
| b | Standard β | t | b | Standard β | t | |
| OID × OIB | 3.508 | 0.989 * | 34.277 | 50.655 | 14.277 * | 29.448 |
| (OID × OIB)2 | −0.008 | −13.289 * | −27.411 | |||
| R2 | 0.978 | 0.999 | ||||
| F | 1174.897 * | 17288.739 * | ||||
| Category | Mean | SD | 1 | 2 | 3 | 4 | 5 | 6 |
|---|---|---|---|---|---|---|---|---|
| 1. OI depth (OID) | 5.286 | 13.472 | - | |||||
| 2. OI breadth (OIB) | 0.567 | 1.294 | 0.456 * | |||||
| 3. OID × OIB | 0.456 | 4.365 | 0.523 * | 0.603 * | ||||
| 4. (OID × OIB)2 | 19.242 | 488.277 | 0.389 * | 0.384 * | 0.917 * | |||
| 5. Total number of technology transfers | 2.071 | 3.156 | 0.641 * | 0.288 * | 0.300 * | 0.191 * | ||
| 6. Total number of disputes | 1.677 | 1.533 | 0.591 * | 0.228 ** | 0.470 * | 0.509 * | 0.397 | |
| 7. Total number of IPCs (7D) | 9.364 | 30.489 | 0.956 * | 0.313 * | 0.415 * | 0.330 * | 0.551 * | 0.483 * |
| Dependent Variables (Row) Independent Variables (Column) | Regression 1 | Regression 2 | ||||
|---|---|---|---|---|---|---|
| b | Standard β | t | b | Standard β | t | |
| OID × OIB | 0.404 | 0.537 * | 2.846 | 1.022 | 1.359 | 2.039 |
| (OID × OIB)2 | −0.029 | −0.856 | 1.284 | |||
| R2 | 0.288 | 0.345 | ||||
| F | 8.098 * | 5.005 * | ||||
| Dependent Variables (Row) Independent Variables (Column) | Regression 1 | Regression 2 | ||||
|---|---|---|---|---|---|---|
| b | Standard β | t | b | Standard β | t | |
| OID × OIB | 0.184 | 0.702 * | 4.407 | 0.248 | 0.948 | 1.626 |
| (OID × OIB)2 | −0.003 | −0.257 | −0.440 | |||
| R2 | 0.493 | 0.498 | ||||
| F | 19.425 * | 9.418 * | ||||
| Dependent Variables (Row) Independent Variables (Column) | Regression 1 | Regression 2 | ||||
|---|---|---|---|---|---|---|
| b | Standard β | t | b | Standard β | t | |
| OID × OIB | 7.747 | 0.740 * | 4.913 | 7.734 | 0.738 | 1.332 |
| (OID × OIB)2 | 0.001 | 0.001 | 0.002 | |||
| R2 | 0.547 | 0.547 | ||||
| F | 24.141 * | 11.467 * | ||||
© 2018 by the authors. Licensee MDPI, Basel, Switzerland. This article is an open access article distributed under the terms and conditions of the Creative Commons Attribution (CC BY) license (http://creativecommons.org/licenses/by/4.0/).
Share and Cite
Yun, J.J.; Jeong, E.; Lee, Y.; Kim, K. The Effect of Open Innovation on Technology Value and Technology Transfer: A Comparative Analysis of the Automotive, Robotics, and Aviation Industries of Korea. Sustainability 2018, 10, 2459. https://doi.org/10.3390/su10072459
Yun JJ, Jeong E, Lee Y, Kim K. The Effect of Open Innovation on Technology Value and Technology Transfer: A Comparative Analysis of the Automotive, Robotics, and Aviation Industries of Korea. Sustainability. 2018; 10(7):2459. https://doi.org/10.3390/su10072459
Chicago/Turabian StyleYun, Jinhyo Joseph, EuiSeob Jeong, YoungKyu Lee, and KyungHun Kim. 2018. "The Effect of Open Innovation on Technology Value and Technology Transfer: A Comparative Analysis of the Automotive, Robotics, and Aviation Industries of Korea" Sustainability 10, no. 7: 2459. https://doi.org/10.3390/su10072459