Article

An Innovative Approach to Determining High-Risk Nodes in a Complex Urban Rail Transit Station: A Perspective of Promoting Urban Sustainability

1
School of Economics and Management, Chongqing University of Posts and Telecommunications, Chongqing 400065, China
2
School of Economics and Management, Chongqing Jiaotong University, Chongqing 400074, China
3
School of Construction Management and Real Estate, Chongqing University, Chongqing 400045, China
*
Authors to whom correspondence should be addressed.
Sustainability 2018, 10(7), 2456; https://doi.org/10.3390/su10072456
Submission received: 17 June 2018 / Revised: 6 July 2018 / Accepted: 11 July 2018 / Published: 13 July 2018
(This article belongs to the Section Sustainable Transportation)

Abstract

:
Public safety presents high importance in urban sustainable development. Transportation safety is a significant section in public safety. Over the last couple of decades, as a sustainable means of public transportation, urban rail transit presents a rapid development in China. Increasing initiatives and practices have been engaged with views to facilitating people’s travel and intensive utilizing land resources. Echoing this, rail transit stations with multi-floor structure have been built and show structure complexity. Due to this complexity, there is a need to focus on risk management for the stations to guarantee operation safety. Accordingly, this research introduces an innovative approach to identify high-risk nodes in the complex rail transit stations. The high-risk nodes are determined according to two aspects, which are the key nodes of the station and presenting large passenger volumes. Complex network analysis and field investigation were adopted in this study. The Lianglukou rail transit station in Chongqing, China was selected for case study. The research results in this study indicate that (1) in platform floors, stairs/escalators are almost high-risk nodes; (2) columns and metal fences that have been determined as high-risk nodes are located near stairs/escalators; (3) in concourse floor, the determined high-risk nodes present relative high degree centrality and low betweenness centrality compared with nodes in platform floor. The obtained high-risk nodes are helpful for the management firms to develop risk mitigation measures and re-allocate their resources to create a safe environment for passengers in the stations. The guarantee for the rail transit station operation safety plays an important role in enhancing urban sustainability.

1. Introduction

Public safety is necessary in achieving sustainable development, which has been considered to be an significant indicator in urban sustainability evaluation [1,2]. Transportation safety is an indispensable section in public safety [3,4,5,6,7,8,9]. In recent years, the size of cities in China have been expanding rapidly with the growth of urbanization, which leads to a large amount of transportation requirements [10]. Qualified with advantages of high speed, low pollution, large transportation, low energy consumption, and comfort, urban rail transit, including metro and light rail, is in conformity with the principle of sustainable development, and provides a variety of environmental, economic and social benefits, which are particularly applicable for urban transportation [11]. So far, over 200 cities all over the world have been operating metros. Also, in China, the urban rail transit developed in a high speed and became a main component of urban public transport [12]. At present, 43 Chinese cities in total have obtained official approval to construct urban rail transit, and more than 9000 km of transit is in planning [13]. More and more cities in China enter the “rail transit era”. Aiming at facilitating people’s lives and intensively utilizing land resources, many newly built rail transit stations in China demonstrate obvious features of multi-floor structure integration in three-dimensional space and crowded people on each floor. Various components and relationships among the components exist in the station. Thus, the station shows complexities and could be recognized as a complex system [14,15]. In this paper, the stations are titled as “complex rail transit stations” (CRTSs). The CRTSs facilitate people’s traffic transfer. However, the CRTSs are also subject to various kinds of potential risks during operation due to their complex structures, crowding of people, and their openness [12,14]. The potential risk events include fire, explosion, and terrorist attacks, etc. [16]. The secure and stable operation of the CRTSs presents high significance in urban sustainable development. Nevertheless, according to the investigations in the rail transit stations, including Xizhimen Station in Beijing, Lianglukou Station in Chongqing, security guards are randomly moving in the station [17,18]. Some nodes, including passenger aggregation nodes and passengers’ transfer nodes, need specific security protection. For example, arranging security guards with equipment around the nodes could decrease the occurrence possibility of emergency events, such as terrorist attacks, fire, etc. Therefore, it is meaningful to study the high-risk nodes of CRTSs, which could be referred to in the management.
Until now, considerable efforts have been devoted by the researchers in order to guarantee the safety of the rail transit stations. The vulnerability of the urban rail transit has been previously emphasized [19]. Song et al. [3] emphasized that the safe operation of the rail transit could promote sustainable development of cities, and explored the rail transit system vulnerability factors based on the integrated method of AHP (analytic hierarchy process) and ISM (interpretative structural modeling). Regarding the large subway system as complex networks, Angeloudis and Fisk [20] stated that the high connectivity but low maximum vertex degree of the networks shape robustness to random attack. It indicated that the urban rail transit network is vulnerable to the node-based attacks, especially the highest betweenness node-based attacks, even though it is rather robust to random attacks [21,22]. Bruyelle et al. [23] and Qian and Lin [24] conducted research on the occurrences of terrorist attacks against rail-based vehicles. The critical systems were identified, and the design improvements of the metro coaches were proposed to guarantee security [20,25]. The assessment for the vulnerable nodes within the rail transit station showed a high level of necessity. Many counter-measures were formulated to increase the resilience to risk events [24,26,27]. Infrastructure operation safety was emphasized and complex network was considered to be a useful instrument for the studies [23,25,28]. In the field of urban rail transit network, some valuable results have been obtained. Latora and Marchioris [29] discussed the small-world characteristics of the Bostosn subway network and provided precious insights on the general features of real transportation networks. Lee et al. [30] focused on the statistical properties and topological consequences of the Metropolitan Seoul Subway system. The passenger flow weight distribution of the station was calculated. During operation time, the passengers showed high density in the station and the occupant safety in emergencies presented high importance [31,32]. The capacity of the exits was measured by video recording and on-site observations, and then the dynamic features of the emergency evacuation process at each time-step were calculated [33]. Precursors of the emergencies in the rail transit stations were identified and analyzed. Kyriakidis, Hirsch, and Majumdar [34] analyzed 27 accidents precursors in six categories and developed a model to assess safety maturity of the metro railway. In addition, the relationships exploration showed that a positive correlation exists between injuries and precursors.
Legislation requirements for transportation and emissions limits have also been issued for the safe operation of rail transit stations. In China, laws and regulations in national level and municipal level that rail transit must comply with for safe operation have been formulated. These include the Emergency Plan for the Disposal of Urban Subway Accidents, issued by the Ministry of Emergency Management of China [35], Regulations on Operation and Management of Urban Rail Transit issued by the Ministry of Transport of China [36], and Instructions on Ensuring Safe Operation of Urban Rail Transit issued by the General Office of the State Council of China [37], etc. Regulations in municipal level have also been formulated, such as the Emergency Plan for the Disposal of Rail Transit Operation Accidents in Shanghai [38], and the Emergency Plan for the Disposal of Rail Transit Emergency Events in Chongqing [39], etc. In addition, regulations or laws for transportation safety have also been established in other countries, such as the United States [4], Nigeria [40], etc. Thus, safe operation of the rail transit has been emphasized in legislation and regulations. In addition, emissions limits standards have also been issued for various transportation subsectors, including light-duty vehicles, heavy-duty vehicles (buses and trucks), rail, aviation, marine, agriculture, and off-road [41]. For instance, in California, SB375 is the first regulation to focus on travel demand’s contribution to aggressive greenhouse gas emissions [41]. In China, the emissions limits standards for vehicles with fuel consumption, such as heavy-duty vehicles and motorcycle, have been issued by the Ministry of Ecology and Environment [42]. For rail transit, some emissions limits standards have been formulated for the construction stage. This includes the Environmental Vibration and Noise Emission Control in the Construction of Urban Rail Transit [43]. In the operation stage, urban rail transit is recognized as a sustainable transportation mode due to low pollution and low energy consumption. Cities with high-density neighborhoods developed around passenger rail transit systems are the most sustainable model for urban areas [44]. Thus, as an important section for the urban sustainable development, the influence of rail transit impacting on environment are continuously being considered at every stage, and the considerations are helpful for preventing the social security events, such as mass incidents.
According to the review of the existing studies, it can be seen that rail transit station risk prevention is a hot research topic. From macro to micro, studies have been conducted from various angles, including rail transit vulnerability, networks, passengers, precursors of the emergencies, legislation requirements, emissions limits, etc. Nevertheless, the high-risk nodes in the micro spaces of CRTSs still have fewer research achievements. Aiming at the absences, this research focuses on the determination for risk nodes within CRTSs through an innovative approach, which is are the combined studies in two aspects. Firstly, considering the station architectural structure and passenger flow features, the complex networks of the nodes in every floor of CRTSs are established and the key nodes are identified. Secondly, on-site passenger volumes of every node in the station are recorded. The temporal and spatial characteristics of passenger volumes in the station are analyzed. The high-risk node determination is based on the key node identification and passenger volume statistics. The research on the high-risk nodes relies on network analysis to identify relationships between nodes and discusses the factors responsible for the main concentrations of passengers, which is the first innovative feature of the approach. Besides, the consideration for the passenger aggregation nodes through passenger volumes analysis is another innovative feature. In this study, the Lianglukou rail transit station in Chongqing, China, was selected as the study case.

2. Materials and Methods

Field investigation and complex network analysis were employed in this study for passenger volume statistics and key nodes identification. Field investigation has been recognized as a useful method in many studies for field data collection [45,46,47]. Thus, in this study, field investigation was firstly implemented to clarify the structure of the station, to obtain the passenger flow features, passenger aggregation nodes in every floor, and the corresponding passenger volumes. Secondly, the complex networks of every floor were established and the key nodes were identified through complex network analysis. The complex network analysis presents two advantages. On the one hand, the utilization of this method was based on the contents obtained from the field investigation, including the structure of the station, the passenger aggregation nodes in every floor, and passenger flow features in the station. Thus, the implementation of this method was based on the objective information of the station. On the other hand, the connection and interaction abilities of the nodes were judged through centrality analysis for the nodes, and the centrality was sorted according to the degree centrality and betweenness centrality calculation results. Therefore, the judgement for the connection and interaction abilities was in accordance with accurate mathematical calculation. Some other methods have also been adopted in the analysis of passenger flow features and key nodes determination in indoor environment, mainly including field observation [45], video observation [48], interview [49], social force model [50], and cellular automata (CA) model [51], etc. These methods were useful for the studies. However, defects were presented as compared with complex networks and their inapplicability was shown for this study. The utilization of the methods of field observation, video observation, and interview are based on subjective judgment, and then the description for the passenger flow features and relationships among different nodes is generally based on qualitative analysis [52,53]. The above illustration for the complex network emphasizes two advantages, which are objective information and accurate mathematical calculation. Thus, compared with subjective judgment and qualitative analysis of the previous three methods, complex network analysis presents more objective qualities and accuracy. Besides, the methods social force model and cellular automata (CA) model were initially applied in the field of evacuation [50,54]. Even though some modifications have been made for behavior analyzation usage in daily operation [50,51], the accurate relationship of the nodes in the constrained space cannot be clearly demonstrated, and further the key nodes could not be determined with accurate data support as complex network analysis does. Therefore, complex network analysis was been chosen to identify nodes with strong connection and interaction abilities in this study. The study sites and the employment of the two methods are introduced as follows.

2.1. Study Sites

The Chongqing Lianglukou rail transit station was selected as the study case. The Chongqing rail transit developed quickly over recent years. Until December 2017, a total of six lines were in operation, incorporating 155 stations and 13 transfer stations. The operation mileage reached 264.3 km and ranked first in midwest China [55]. In the 13 transfer stations, the Lianglukou rail transit station is the transfer station of Line 1 and Line 3. Due to the multi-floor complex structure of the Lianglukou station, it was selected as the study case. Besides, another important reason for the selection was that extreme large volumes of transfer passengers are present in the station due to some distinctive stations occupying Line 1 and Line 3, including five commercial centers (CC1–CC5), three railway stations (RS1–RS3), and the airport of Chongqing, as shown in Figure 1. According to the statistics, the average daily transfer passenger volume is nearly 170,000. The extremely large transfer passenger volumes result in a much higher density of passengers in the constrained space of the station [56]. The safe operation of the station deserves much attention.

2.2. Field Investigation in the Lianglukou Rail Transit Station

Field investigations have been conducted seven times in the Lianglukou station, as shown in Table 1. The structure of the station, passenger flow features, and the passenger volume data were investigated during field investigation.
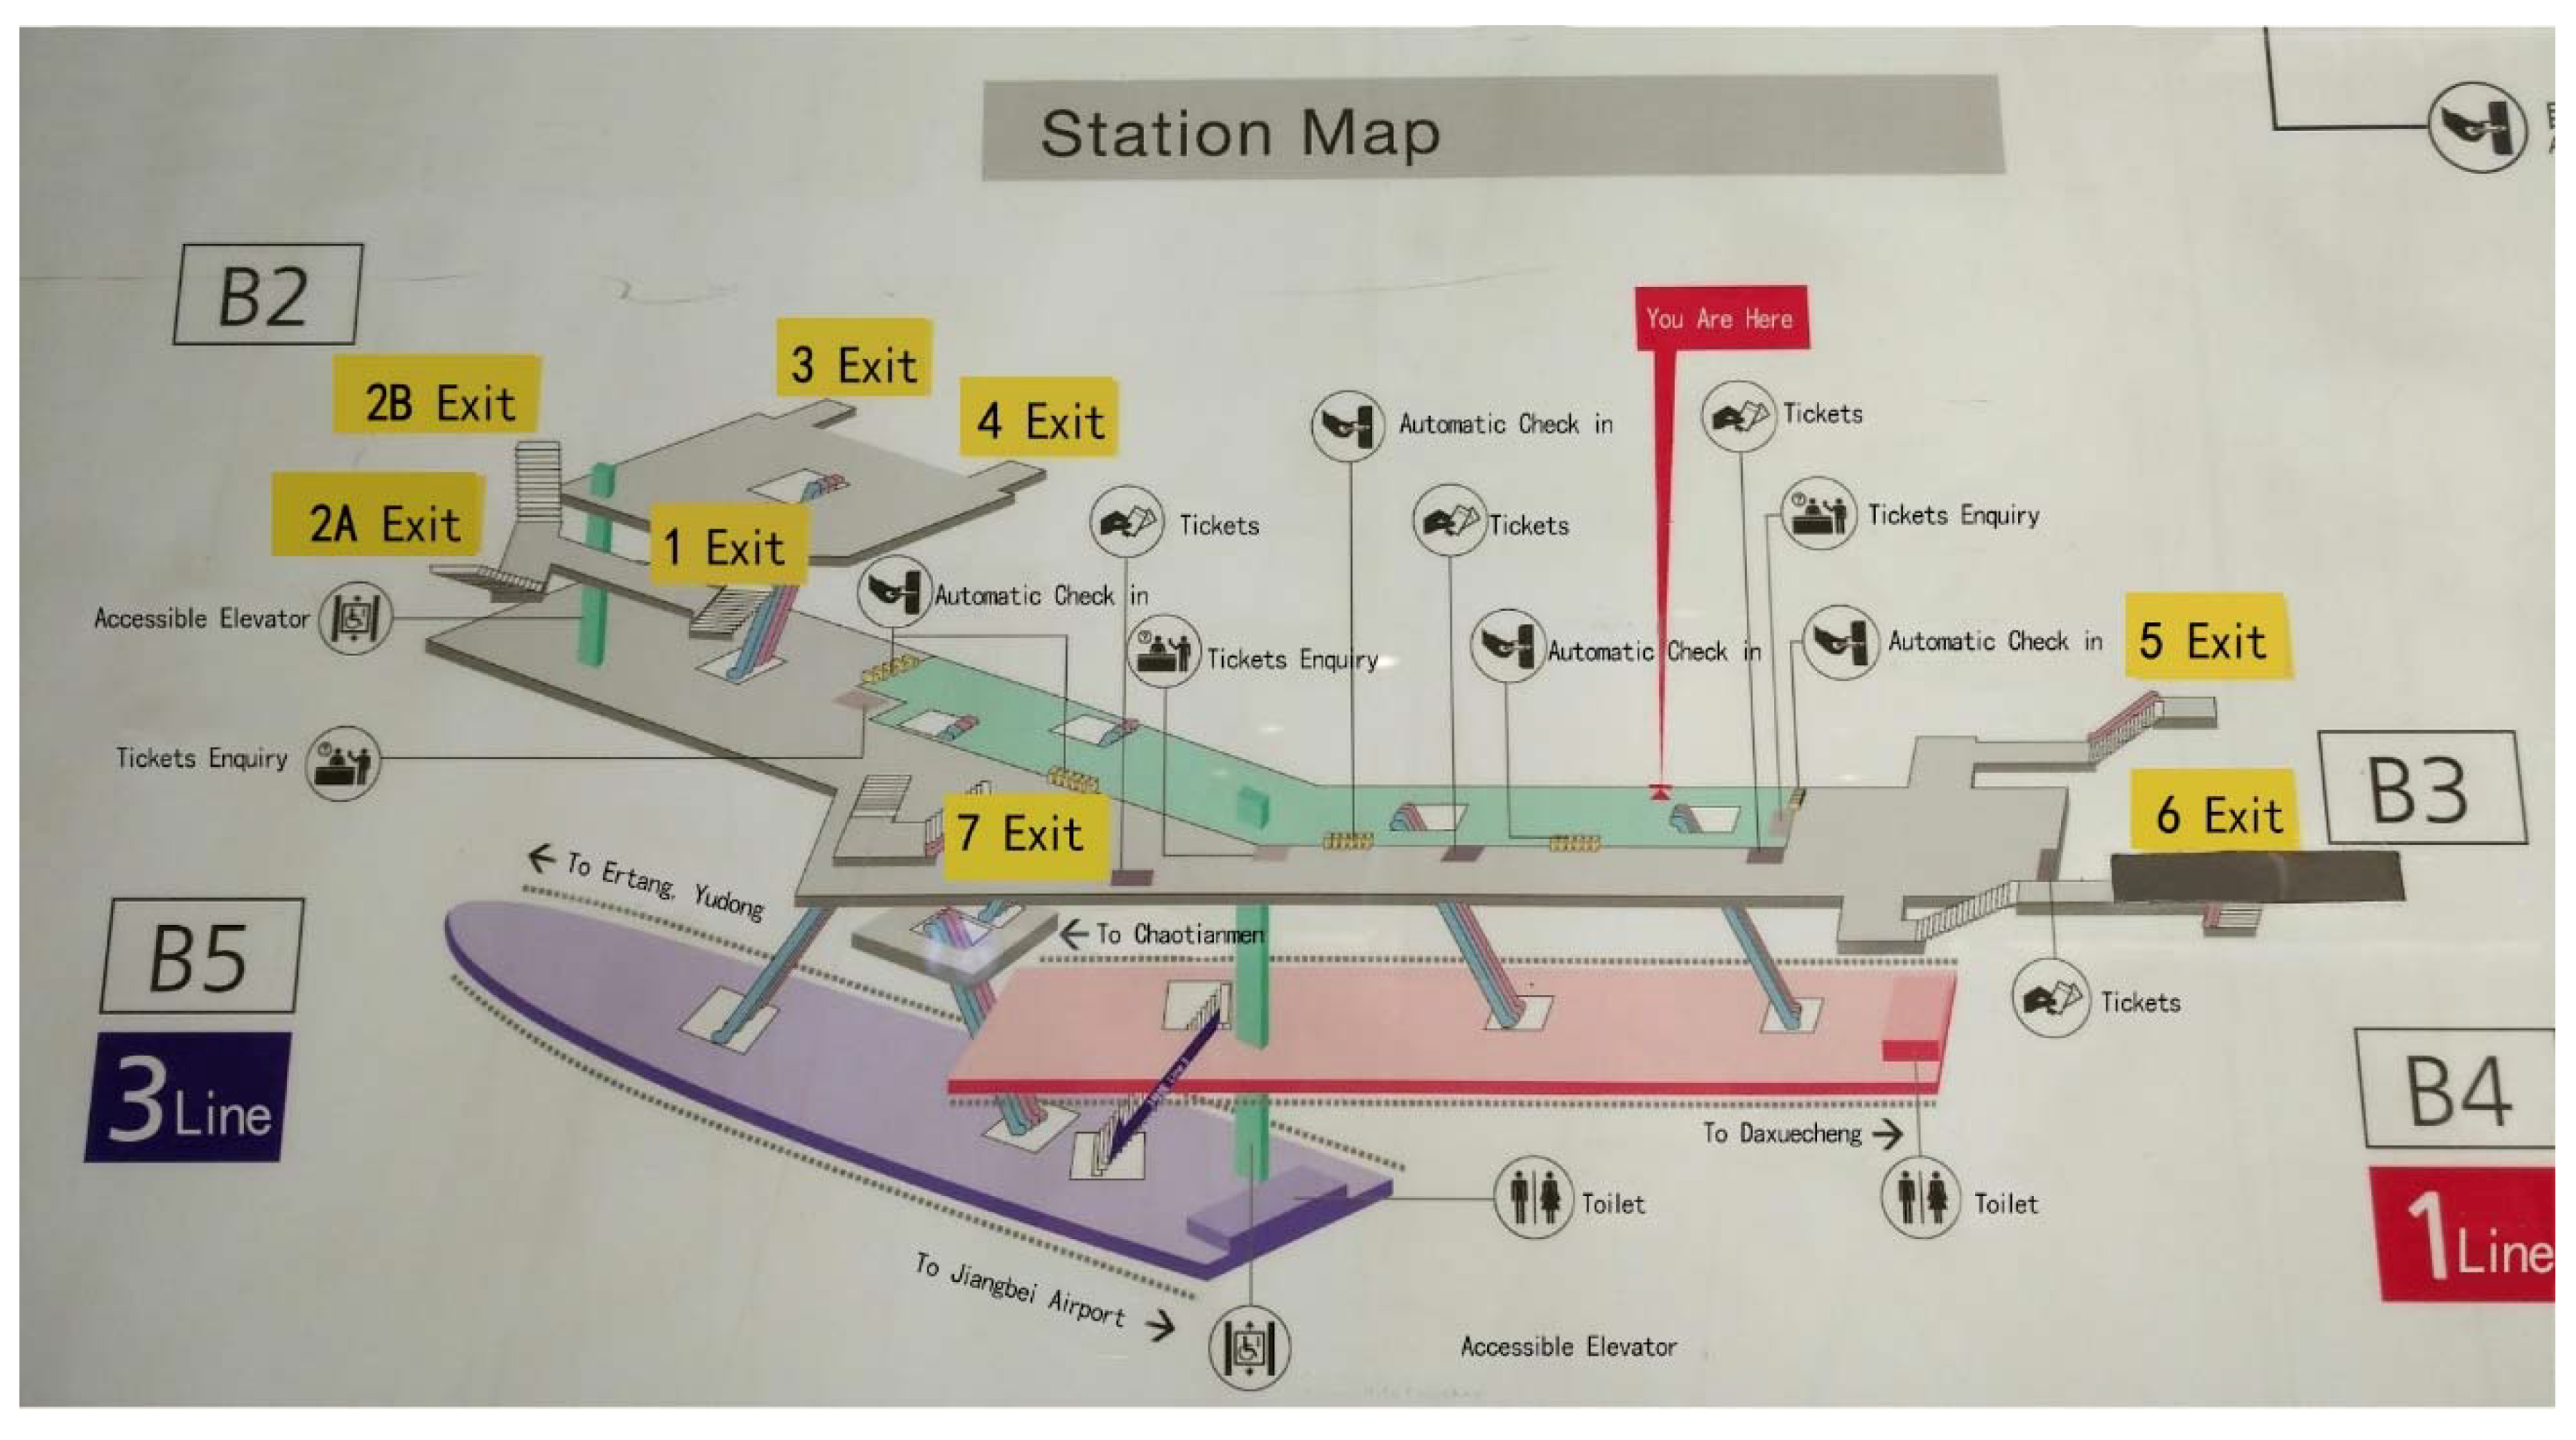
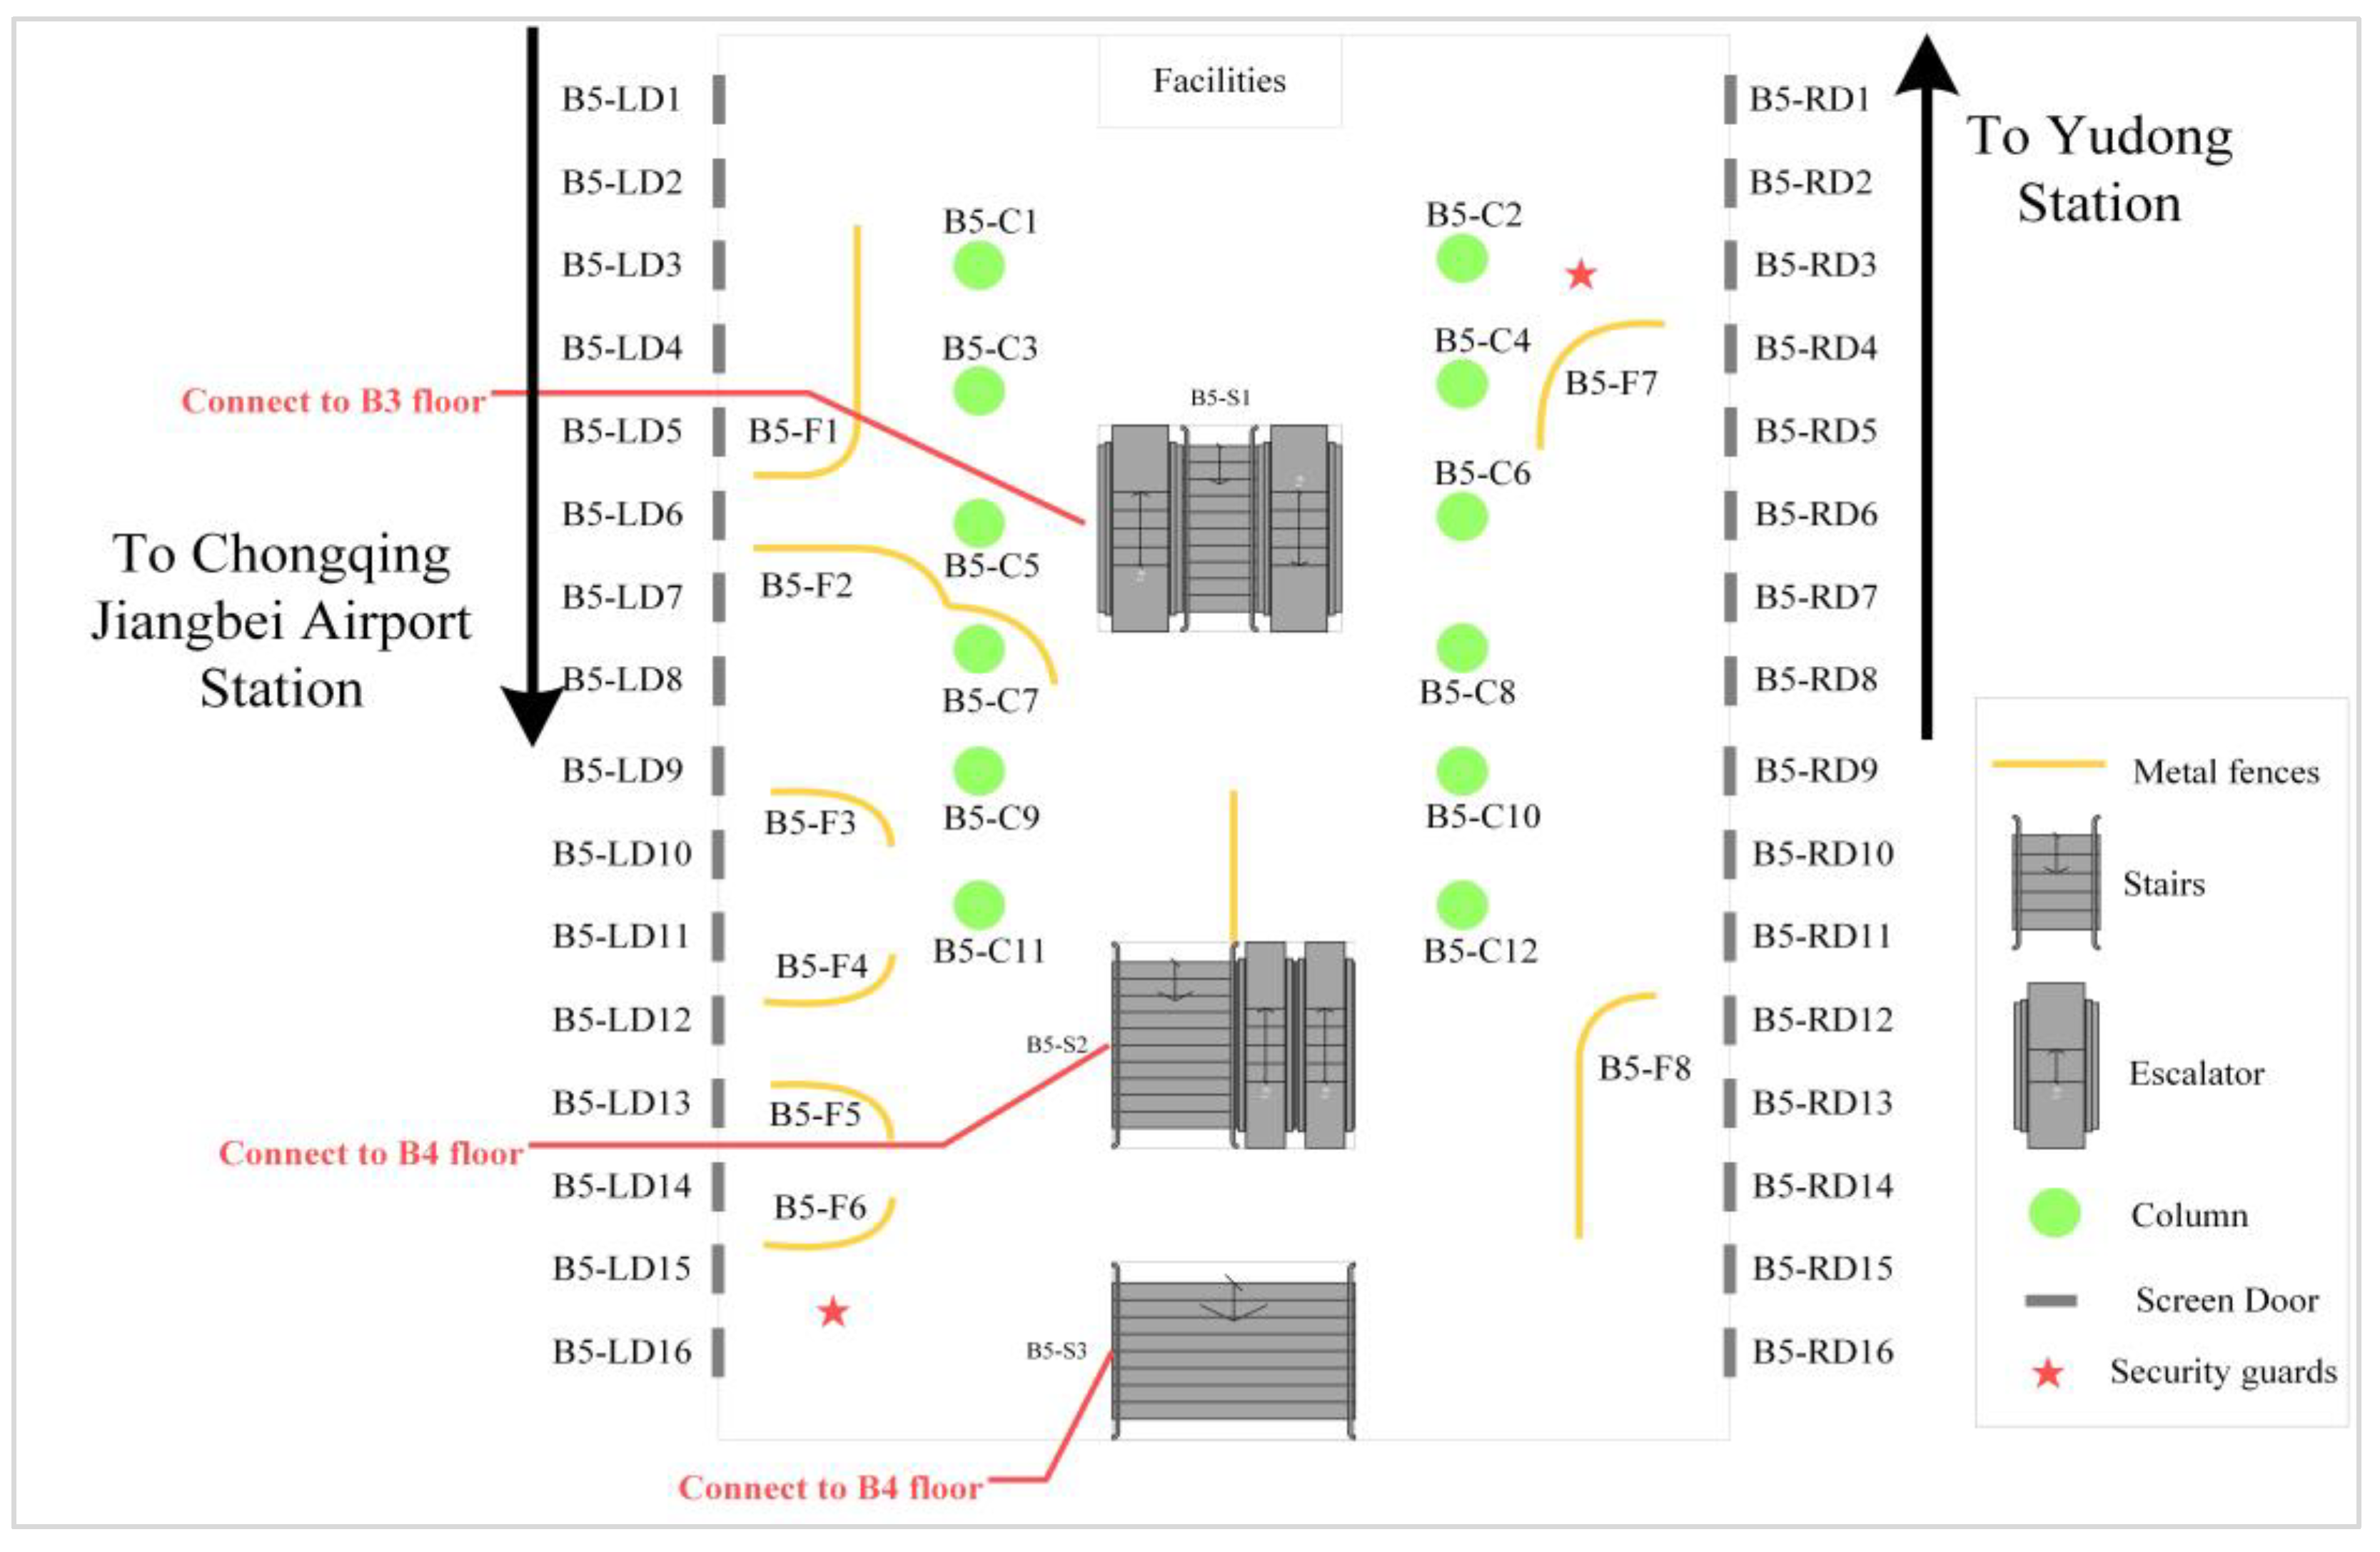
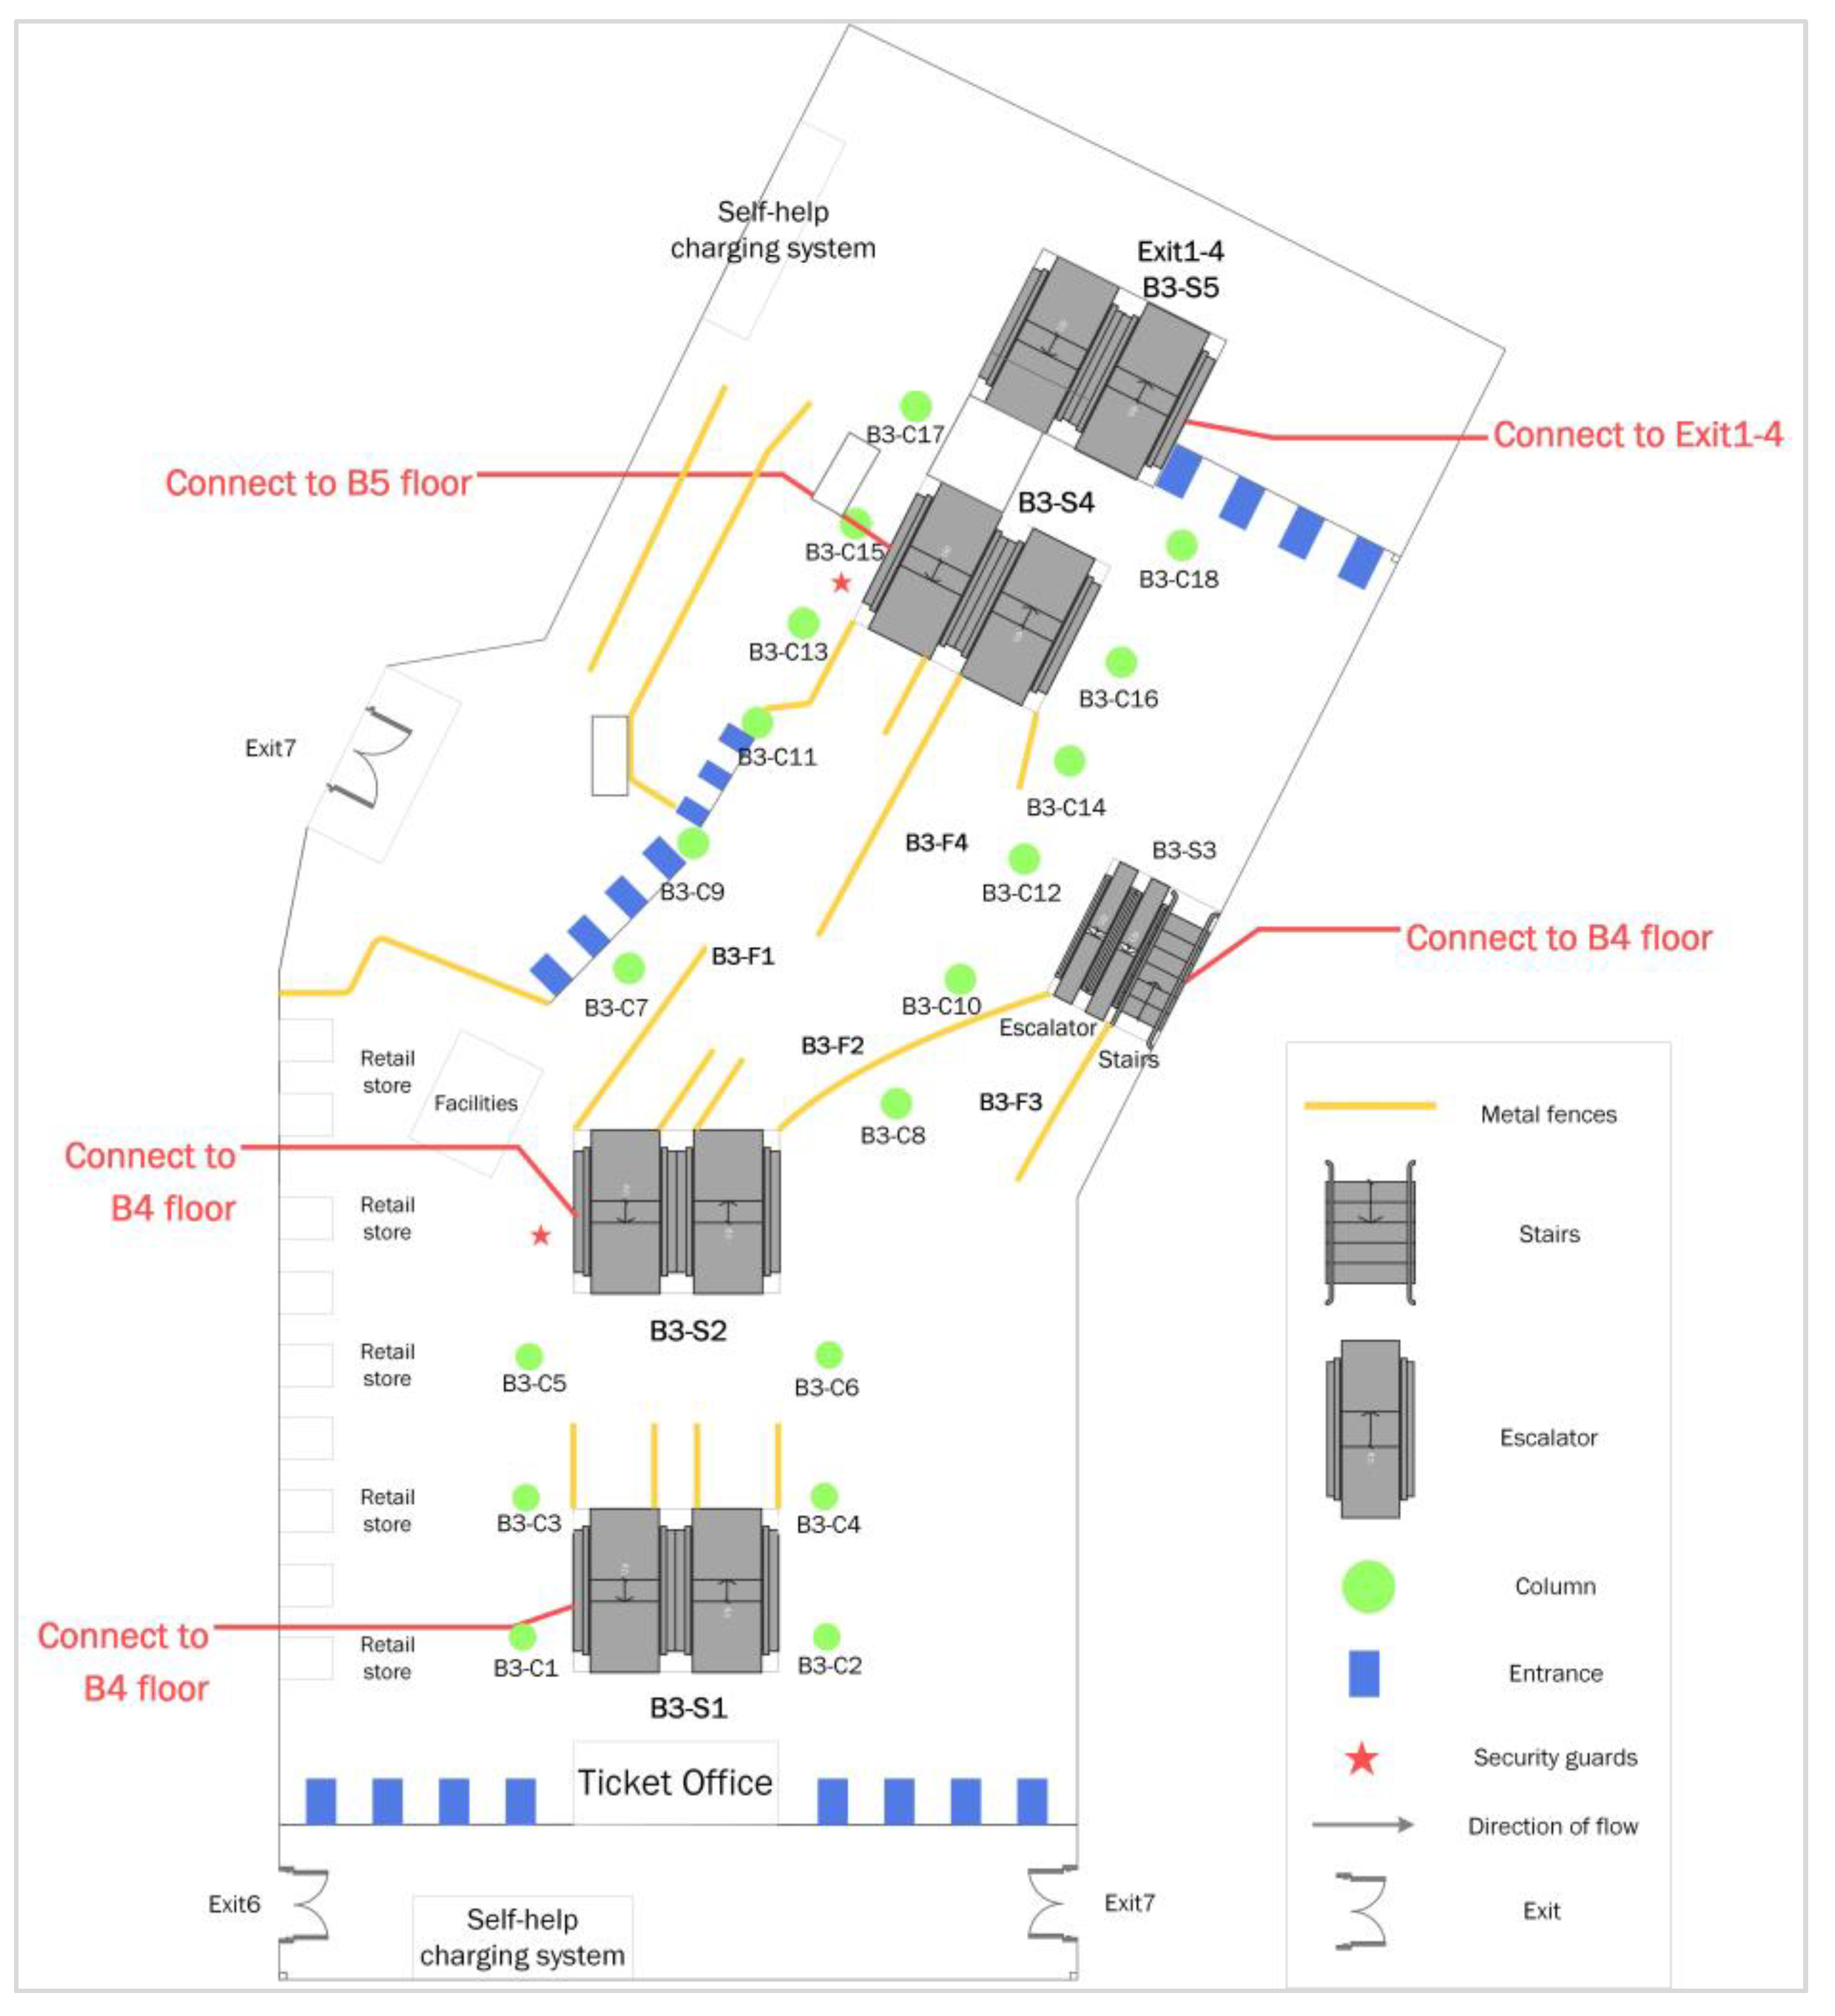
There are four floors in the Lianglukou station, which are floors B2, B3, B4, and B5. According to investigations, passenger volumes are mainly concentrated on the floors of B3, B4, and B5, while only a small number of passengers are present on the B2 floor during daily operation. Thus, this study mainly focused on the floors of B3, B4, B5. The B3 floor is the concourse floor and includes four exits, which are Exit 5, Exit 6, Exit 7, and the unified Exit 1–4 (the independent Exit 1, Exit 2A, Exit 2B, Exit 3, and Exit 4 are in the B2 floor). The B4 floor is the platform floor of Line 1, including 24 screen doors in each side and thus a total of 48 screen doors on this floor. The B5 floor is the platform floor of Line 3. Sixteen screen doors are present on each side and thus a total of 32 screen doors are present on the B5 floor. The B3 floor, B4 floor, and B5 floor connect with each other through five stairs/escalators. The Lianglukou station map is shown in Figure 2.
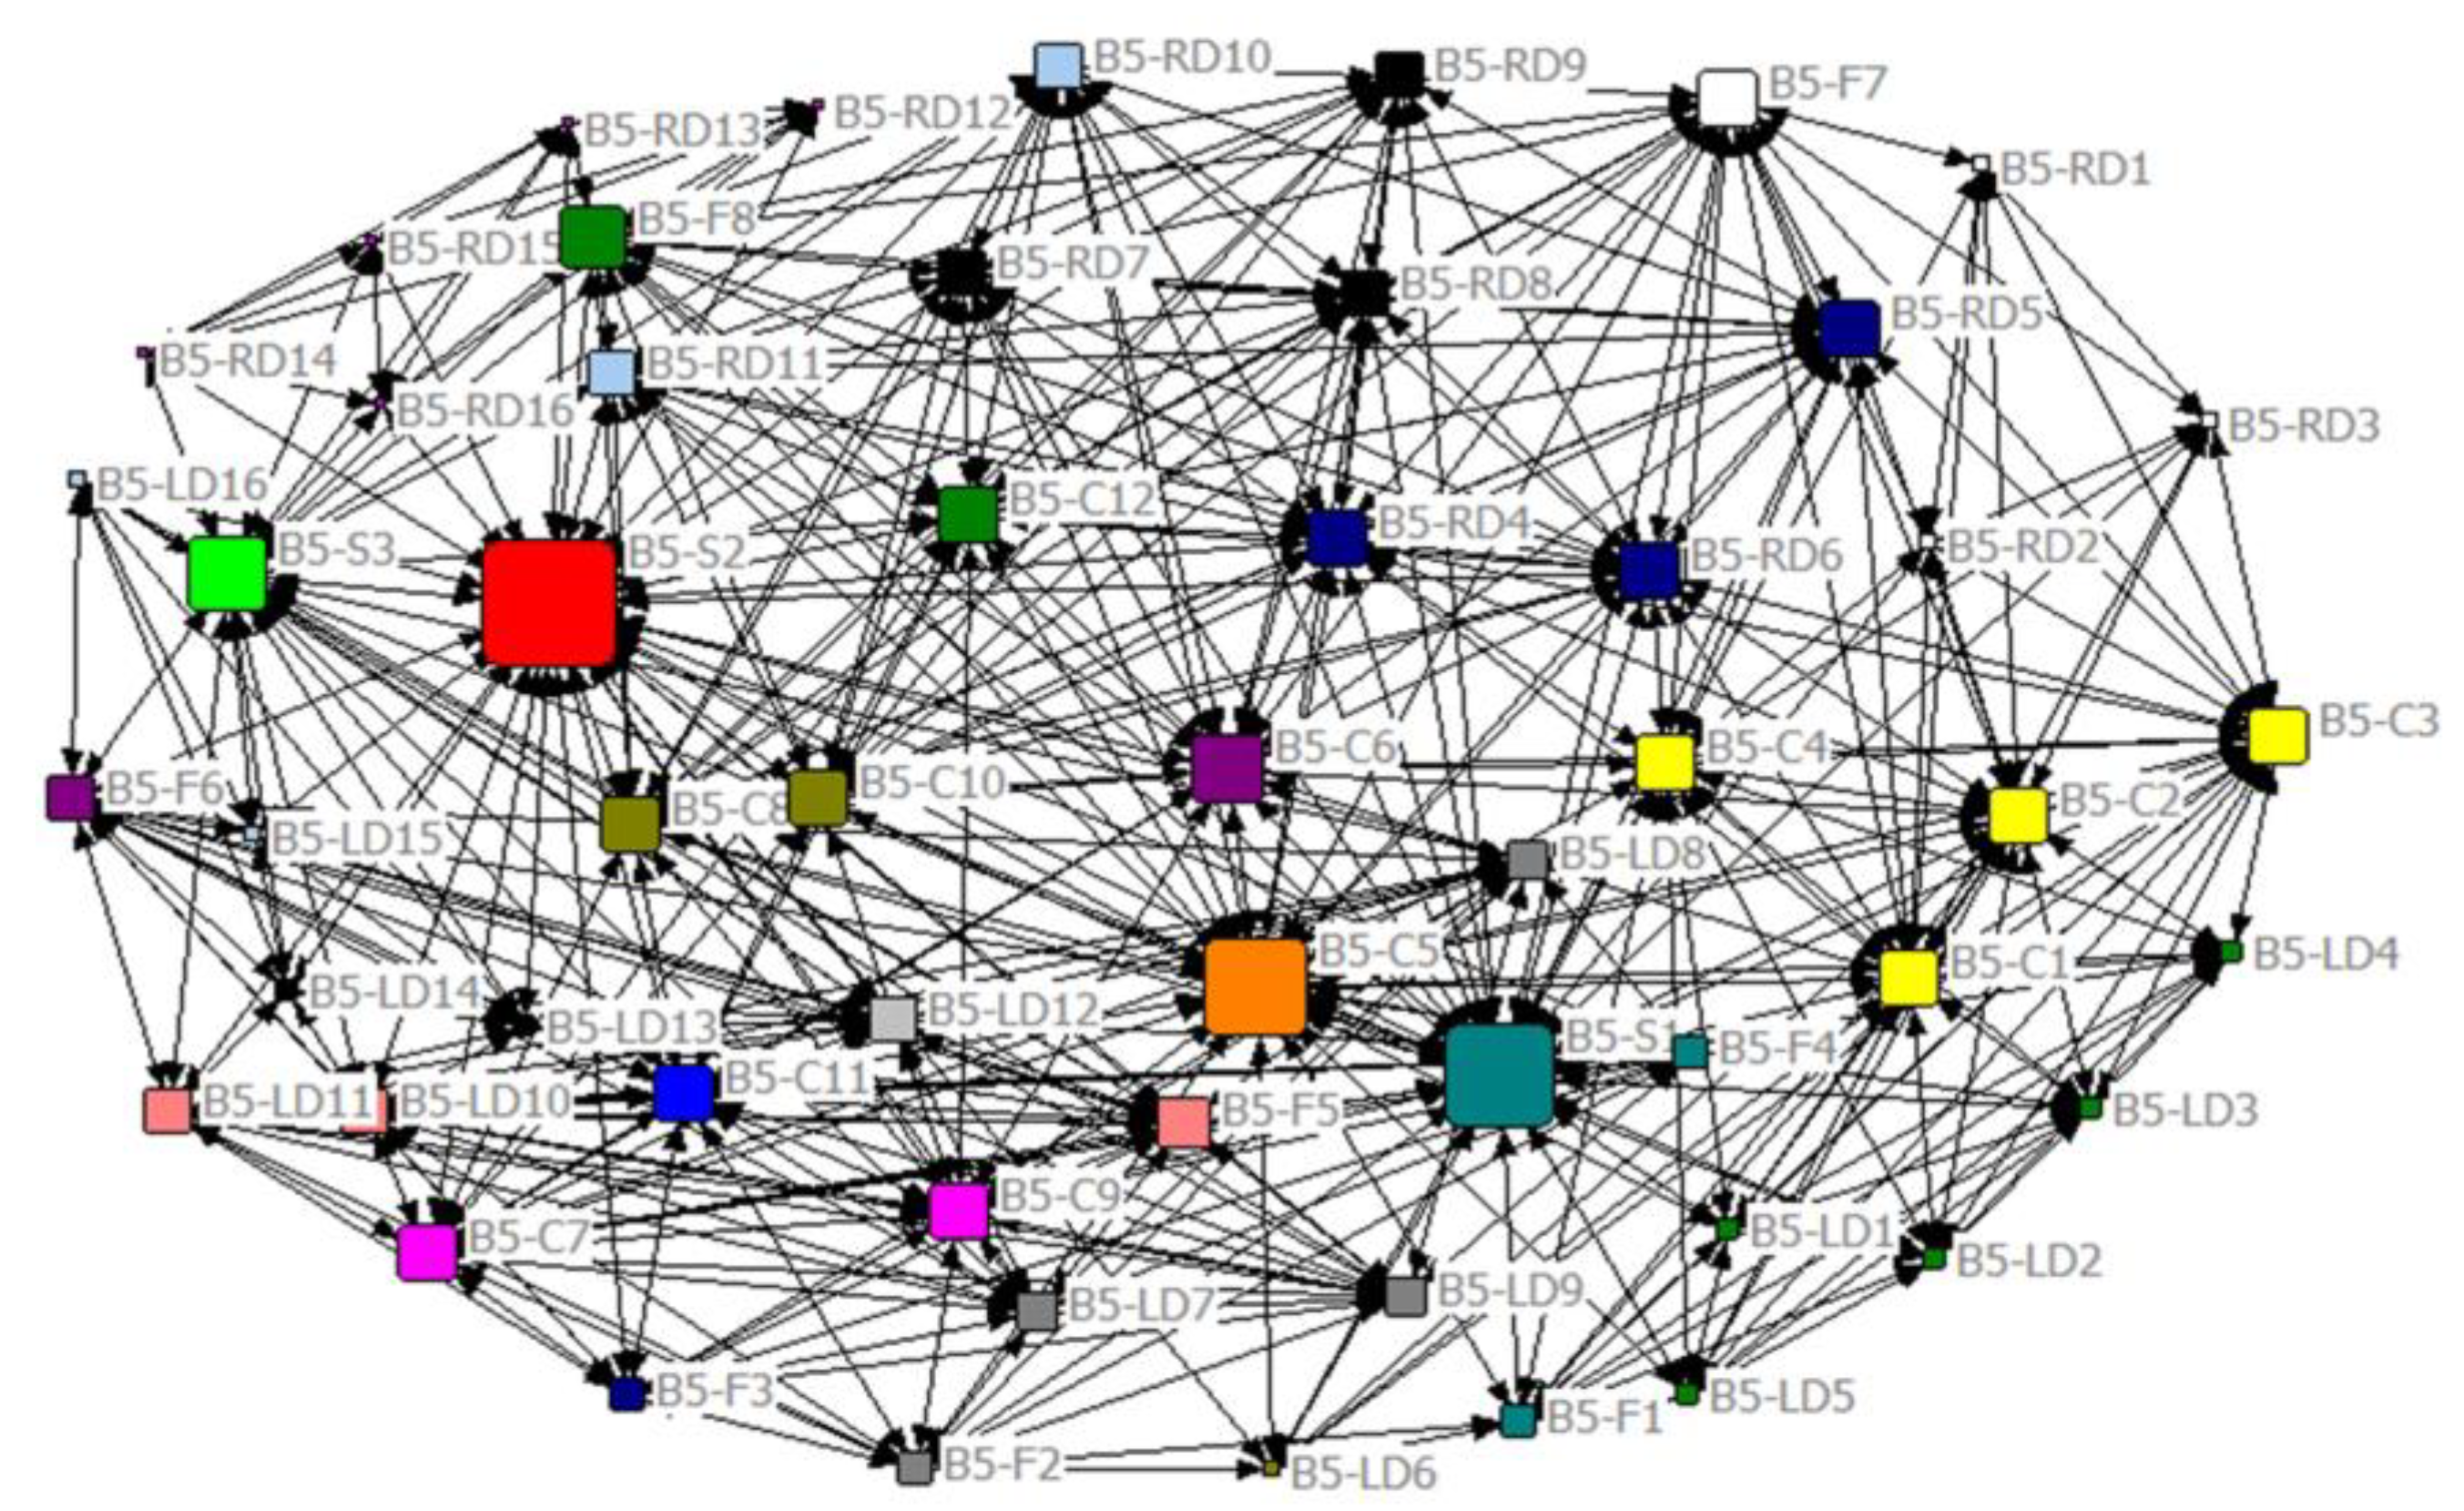
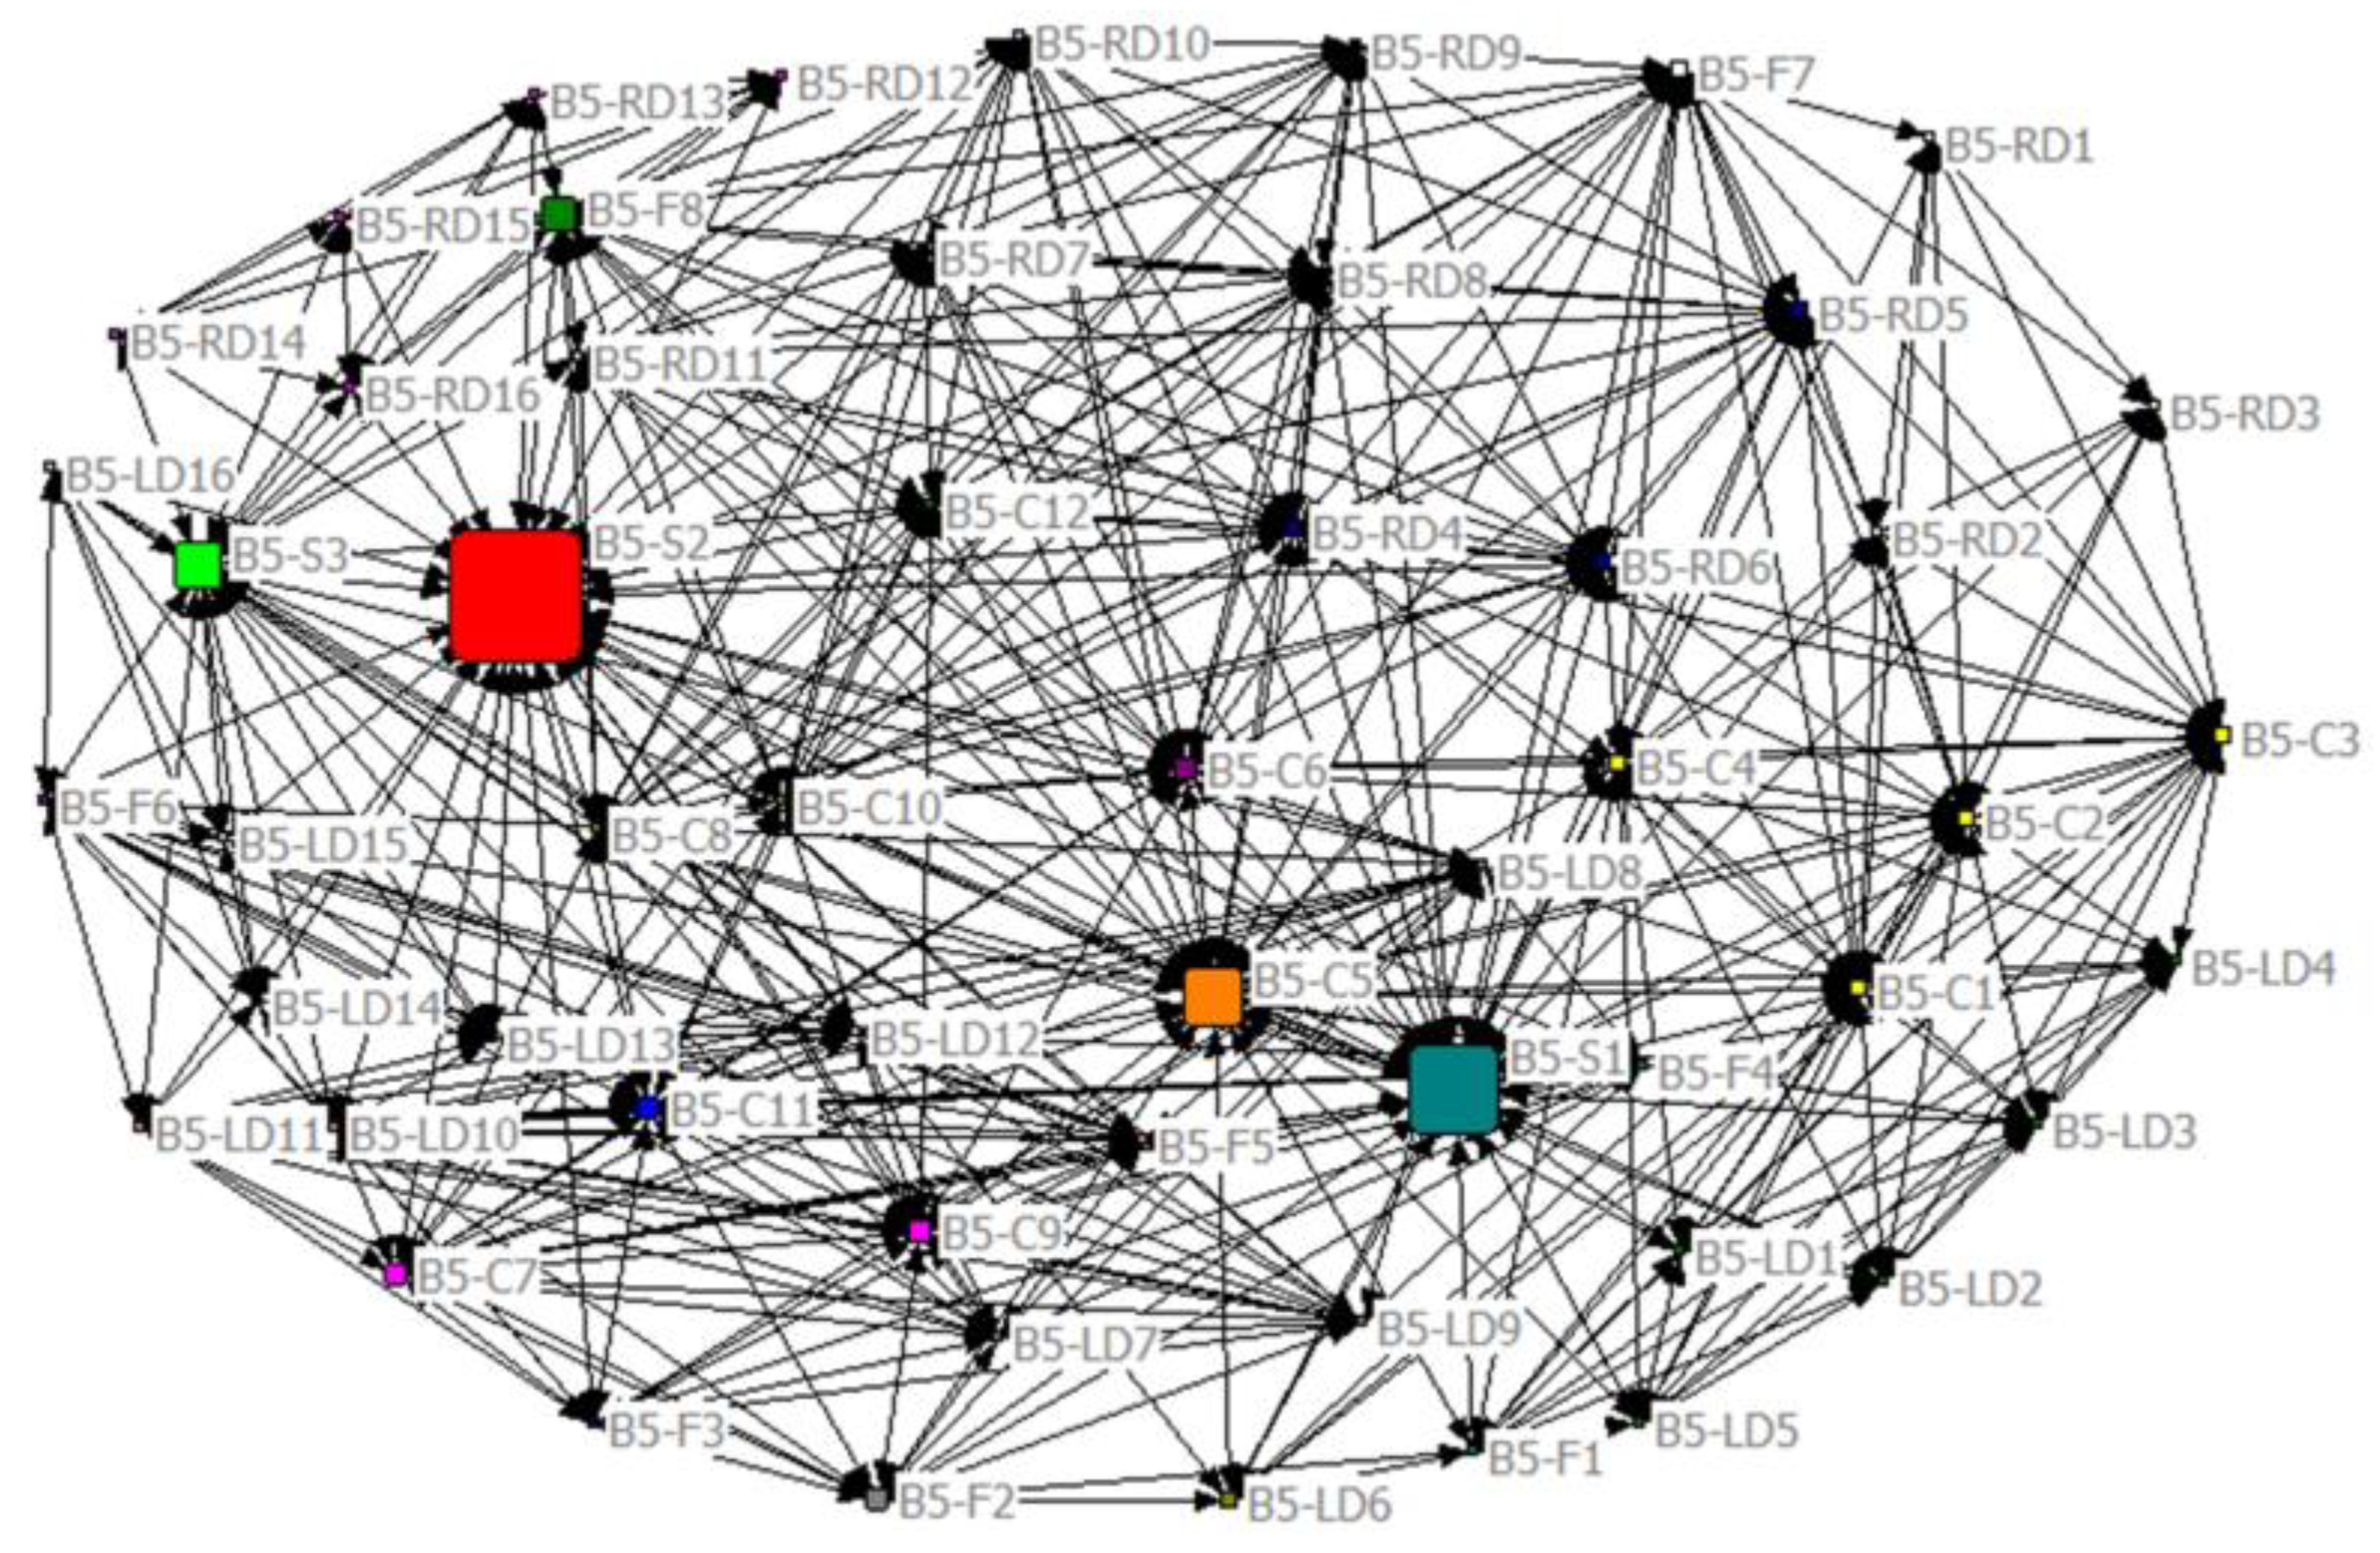
Through detailed field investigations, the layout plans of each floor were drawn. The screen doors, stairs/escalators, metal fences, and the columns are passenger aggregation nodes and were coded in the layout plans. For example, the screen doors in the left side of B5 floor were coded as B5–LD1, B5–LD2…, and the stairs/escalators, the metal fences, the columns in B5 floor were coded as B5–Sxx, B5–Fxx, and B5–Cxx, respectively. The layout plan of B5 floor is shown in Figure 3. The layout plans of the B3 floor and B4 floor are shown in Figure A1 and Figure A2. Besides, the dimensional data of the three floors, including length, width, and area, were measured and are shown in Table 2. (Appendix A).
In addition, on-site passenger volume statistics were conducted during field investigations. The detailed statement for the passenger volume statistics is in Section 3.2.

2.3. Complex Network Construction

Complex network construction is the basis for complex network analysis. The coded facilities, including screen doors, stairs/escalators, metal fences, and columns, were passenger aggregation nodes. Different nodes are connected through passenger flow movements. Thus, the passenger flows shape into networks, in which the coded facilities were the nodes and the passenger flow movement among nodes were connecting lines. The passenger flow networks were constructed based on complex network theory [57]. Complex network theory emerged in recent years and offers an innovative insight to reveal the topological characteristic of complex interactions [16]. It is a type of network with non-trivial topological features—features that often occur in graphs that model real systems such as social networks, computer networks, etc. [58]. The complex network was constructed through the employment of the software UCINET. UCINET is a social network analysis program developed by Stephen P. Borgatti, Martin G. Everett, and Linton C. Freeman [59]. The program is distributed by Analytic Technologies. UCINET works in tandem with freeware program called NETDRAW for visualizing networks [60]. Many characteristics of the network could be analyzed through UCINET, including density, centrality, regions, egonetworks, structures holes, clusters, etc.
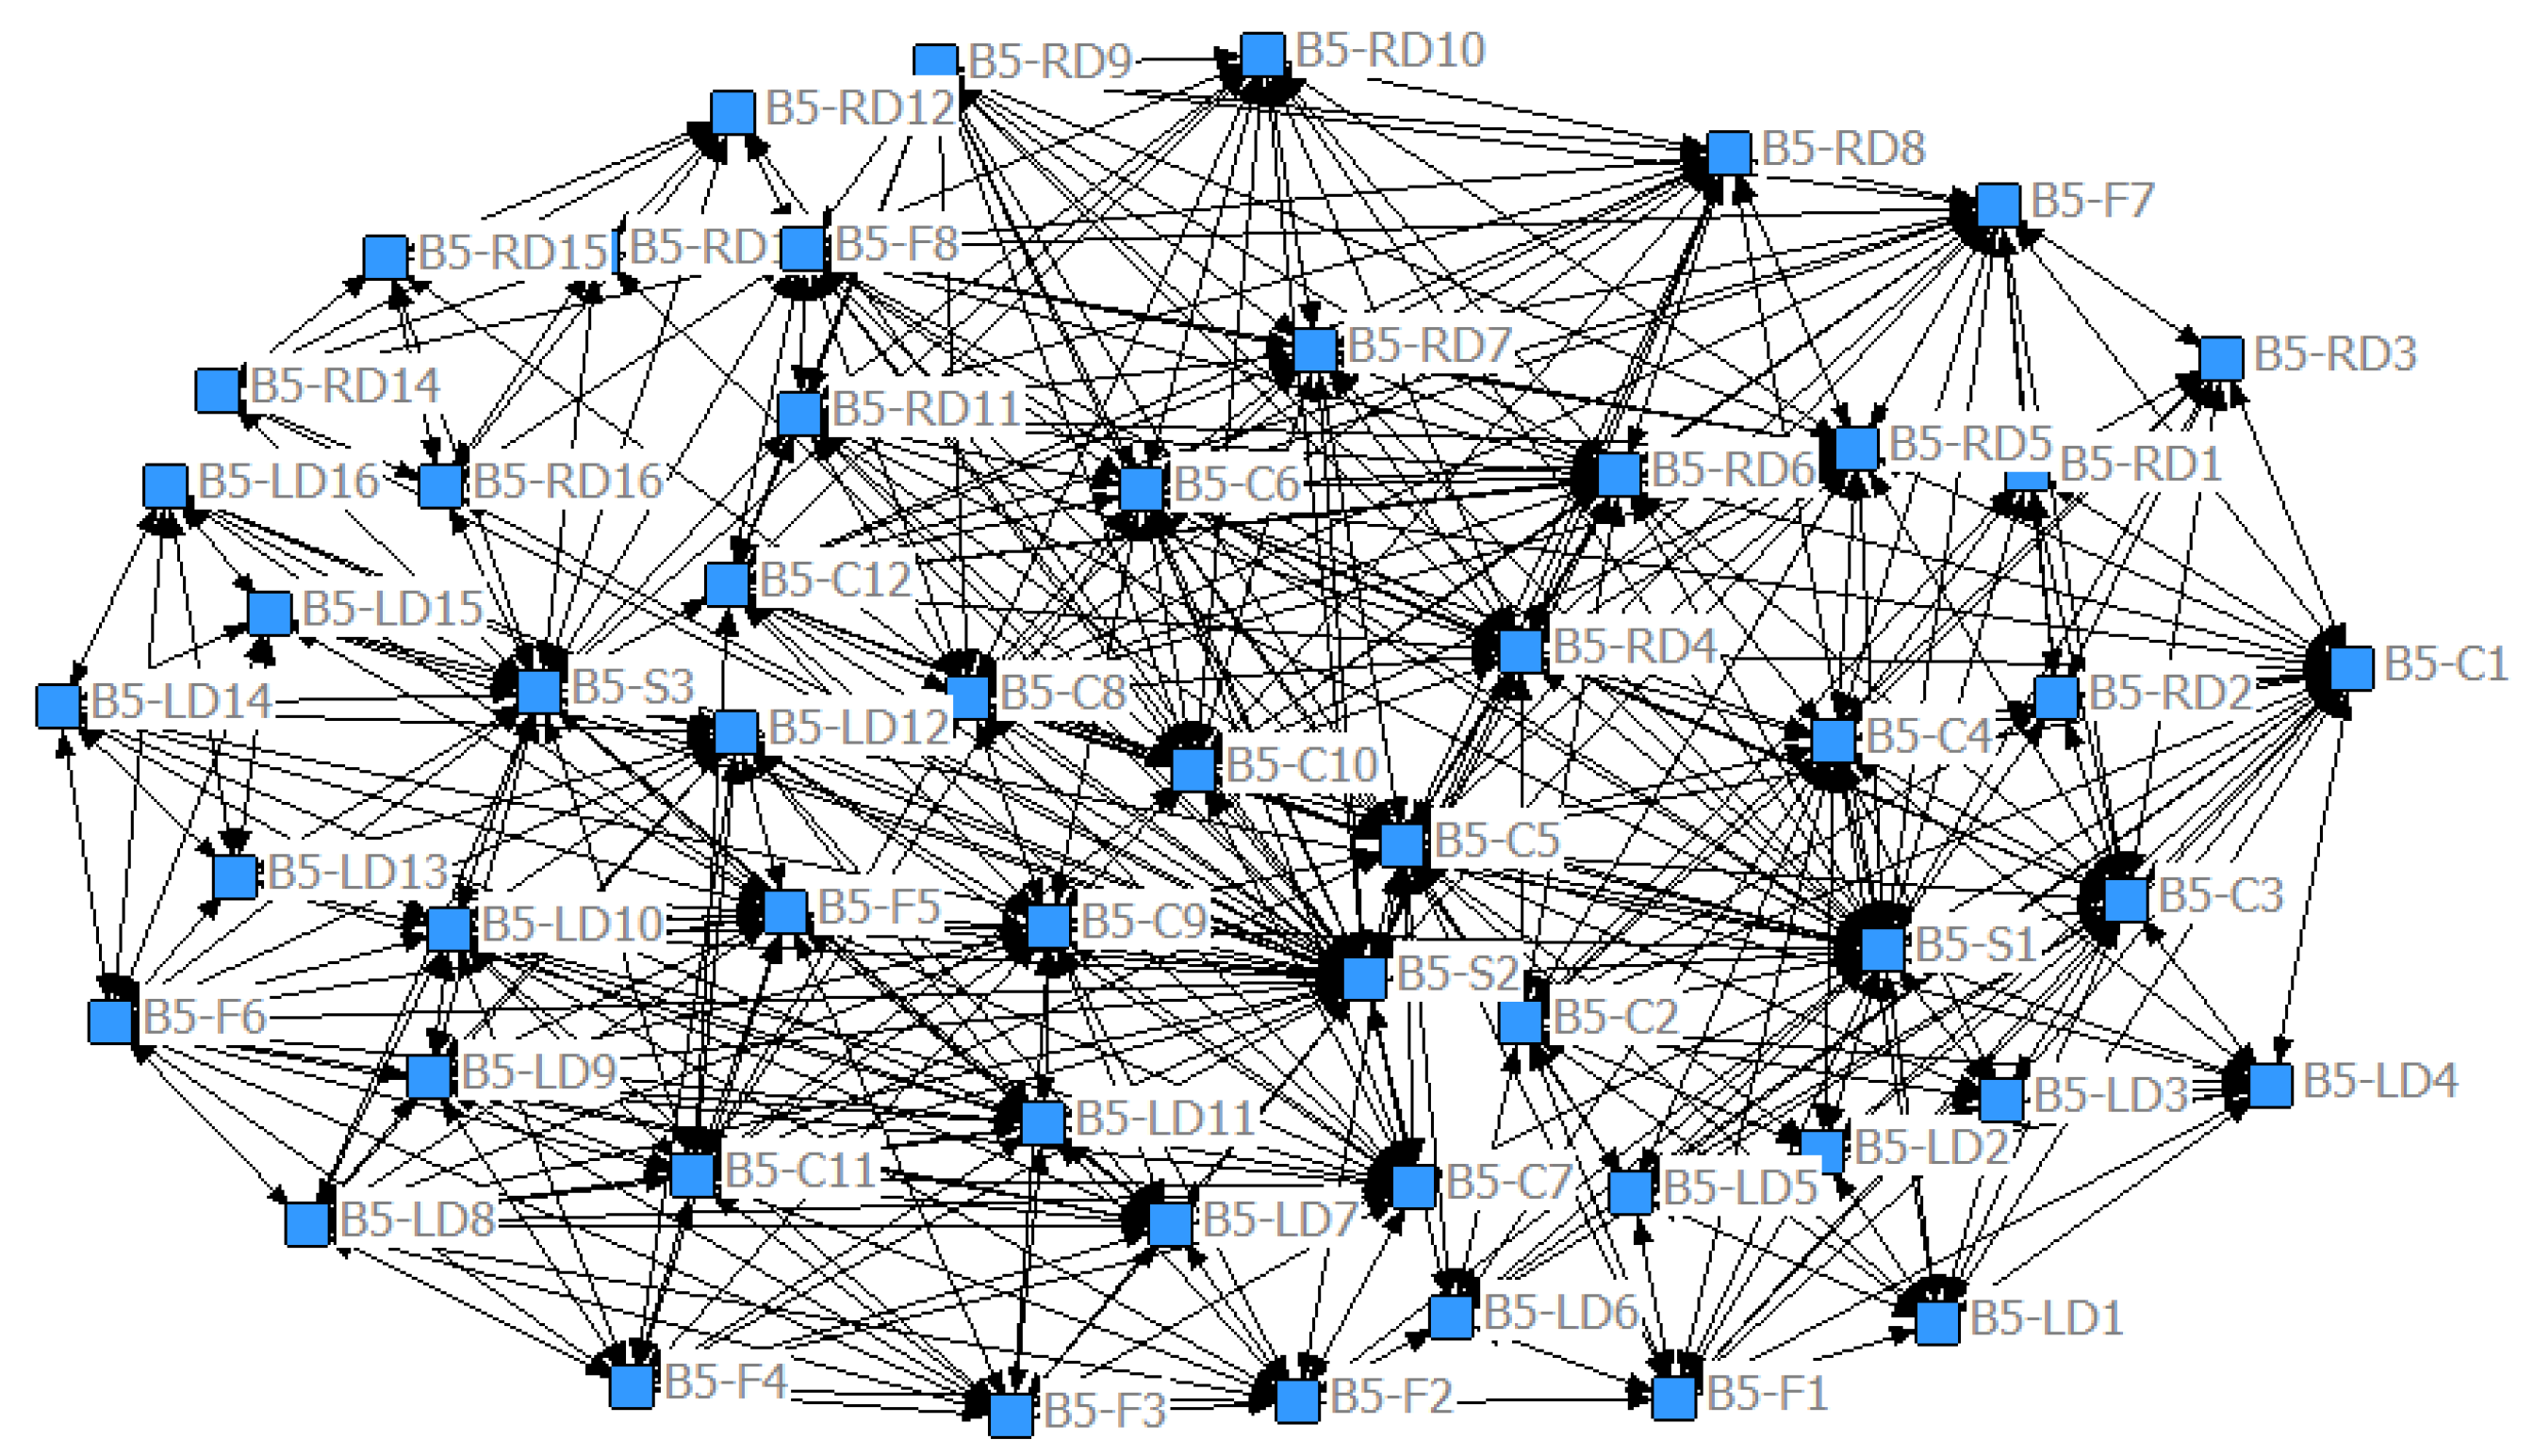
According to the field investigation in the Lianglukou Station, there were 32, 68, 55 passenger aggregation nodes on the three floors, respectively. Taking the B5 floor as an example, the 55 passenger aggregation nodes are shown in Table 3.
The establishment of the complex network mainly included three steps.
(1)
Formulating judgment table for the relationship of each pair of nodes [61]. If the two nodes are connected through passenger flow, then the relationship of the two nodes is marked as 1. For instance, passengers who go through the escalator/stair B5–S1 may go to and gather around the column 1 (B5–C1) and wait for the train. Then the B5–S1 node connects to the B5–C1 node and the relationship of B5–S1 and B5–C1 is marked as 1. Otherwise, the relationship is marked as 0. After judgment for all the nodes, the relationship judgment table is formulated.
(2)
Importing the relationship judgment table into the UCINET software for calculation.
(3)
Presenting the complex network through the NETDRAW program.
The complex networks of each layer were constructed based on the identified passenger aggregation nodes and passenger flow features. The complex network of B5 layer is shown in Figure 4.

3. Key Nodes Identification and On-Site Passenger Volume Statistics

3.1. Key Nodes Identification through Complex Network Analysis

The analysis for the constructed complex networks was implemented for each floor. Three features of the networks were measured, including density, degree centrality, and betweenness centrality. Density analysis is network overall analysis, while degree centrality and betweenness centrality are network nodes analysis [62]. The network overall analysis is the macro analysis and introduction for the network, which is useful for obtaining knowledge of the whole network. The network nodes analysis is the analysis for the micro nodes and is the basis for key nodes identification.

3.1.1. Density

Density of the network is the ratio of existing connections to the maximum possible connections in a network. The density of the complex network demonstrates the connections among the passenger aggregation nodes. In this study, the judgment for the connections is based on the passenger flow features, which were recorded during field investigation in the station. The higher the density, the more connections among the nodes in this floor, and the bigger movement scope of the passengers in the floor. The densities of the three networks were obtained through the calculation of the software UCINET, as shown in Table 4.
The B3 floor is the concourse floor, while the B4 floor and B5 floor are platform floors. The two kinds of floors presented different passenger movement features. The density of B3 floor was 0.792, which was a very high level of complex network density. The high density 0.792 states that passengers in the B3 floor presented high tendency of flows from one passenger aggregation node to others. Among the 32 nodes, the maximum possible number of connections was 32 × (32−1)/2 = 496. Thus, the total number of the actual connections among nodes in the B3 floor was 496 × 0.792 = 392. During daily operation, passengers in the B3 floor went through relatively more nodes and more space than passengers in the B4 floor and the B5 floor for arrival, transfer, or departure. Thus, compared with the B3 floor, the densities of the B4 and B5 floors were relatively lower, being 0.291 and 0.292. Getting on or getting off the train are two main activities of passengers on these two floors. For example, passengers getting off the train may go through screen doors and directly go to the escalator for departure. The scopes of these two activities are small.

3.1.2. Degree Centrality

The degree centrality of the network demonstrates the ability that one node in the network directly connects and interacts to other nodes. The higher the degree centrality is, the higher the interactive ability of the node is, and the node is closer to the center of the network. The degree centralities of the three networks was obtained by UCINET, among which the degree centrality of the B5 floor is shown in Figure 5. The top five nodes in each network are shown in Table 5.
According to the calculation results, the columns from B3–C7 to B3–C11 present relatively higher degree centralities than other nodes in the scope of B3 floor. Especially the degree centralities of the columns B3–C8 and B3–C10 were both 1.000, which mean that these two nodes connect and interact to all the other nodes in the B3 floor network. The two nodes B3–C8 and B3–C10 located nearby B3–S3 and B3–S2 and in the pedestrian path between B3–S2 and B3–S4, B3–S1 and B3–S3. The node B3–S3 always aggregate transfer passenger flow from B4 floor to B3 floor and the inverse. In addition, the pedestrian path shows large volumes of transfer passengers from Line 1 to Line 3 and in the inverse direction. Passengers’ movement in this area connected B3–C8 and B3–C10 to all other nodes in this network, including columns, stairs/escalators, and exits. Besides, the degree centralities of the nodes B3–C7, B3–C9, and B3–C11 were all 0.968. These columns were between B3–S2 and B3–S4 and large numbers of transfer passengers went through these two nodes. The passengers connected these columns to other nodes and presented a high degree of centrality.
On the B4 floor, the degree centralities of the nodes B4–S2 and B4–S3 ranked in the top two, which were 0.766 and 0.612, respectively. From these two stairs/escalators, passengers may go to other nodes on the B4 floor, including B4–S1, left screen doors and right screen doors, columns, and metal fences. These two nodes were the center of the network that connected the B4 floor to the B3 floor. Passengers from the B4 floor to the B3 floor go through these two stairs/escalators. B4–S1 connected the B4 floor and B5 floor, but the direction was only from B5 floor to B4 floor. The node B4–S1 connected some other nodes, including B4–C1, B4–C2, B4–F1, left screen doors, and right screen doors, and the degree of centrality was 0.433. The metal fence B4–F3 connected to B4–S2, B4–S3, columns B4–C4, B4–C6, B4–C8, and left screen doors and right screen doors. The metal fence B4–F3 plays the role of guiding passenger flow, splitting large volume of passengers. Compared with B4–F1, which was located near to B4–S2, this metal fence guides the passenger from two key nodes in the B4 floor network, which are B4–S2 and B4–S3. In addition, the column B4–C2 connected to B4–S1, B4–S2, B4–F3, and screen doors, through passenger flow. This column connects to and interact with key nodes in the B4 floor network and presented a high degree of centrality.
Passengers’ movements among stairs/escalators, columns, and metal fences shaped connections in the network and the calculation showed that the central nodes of the B5 floor were B5–S1, B5–S2, B5–C5, B5–S3, and B5–C6. The three nodes, B5–S1, B5–S2, and B5–S3, were three significant passenger aggregation nodes. They connected large volumes of transfer passengers and the passengers who move from these stairs/escalators to other columns, metal fences, and screen doors. The columns B5–C5 and B5–C6 mainly link transfer passengers who go through B5-S1, and also present a high degree of centrality.

3.1.3. Betweenness Centrality

The betweenness centrality of the network is the ability of a node to occupy the shortest path between two other nodes, which is the ability measurement of the nodes as a “bridge”. The higher the betweenness centrality is, the more the shortest paths this node occupies between other two nodes, and more connections between nodes must go through this node. The betweenness centralities of the three networks were been obtained from UCINET, among which the B5 floor network is shown in Figure 6. The top five nodes in each network are shown in Table 6.
On the B3 floor, the nodes B3–C10, B3–C8 showed obvious high betweenness centrality. Due to these two columns being located in the cross area of B3–S2, B3–S3, and B3–S4, and some nodes, such as columns B3–C7 to B3–C12, and metal fences B3–F1, B3–F2, B3–F4 were all in this area, these two columns were always in the shortest path among some other nodes as “bridges”. Thus, the betweenness centralities of the nodes B3–C10 and B3–C8 were very high. The betweenness centrality of the node B3–C11 ranked third. The node is in the cross area of B3–S2, B3–S4, and Exit 7. The node B3–C11 is the intermediary of the nodes Exit 7, B3–C7 to B3–C12, B3–F1, B3–F2, and B3–F4.
On the B4 floor, the nodes B4–S2, B4–S3, B4–F3 presented high betweenness centralities. The two stairs/escalators directly connect to the B3 floor. The three nodes shaped a triangle, and large volume of transfer passengers were in the cross area of the nodes. The two stairs/escalators and the metal fence B4–F3 were connection intermediaries for other nodes, including columns B4–C3 to B4–C14, metal fence B4–F2, left screen doors, and right screen doors.
In B5 floor, the nodes B5–S2, B5–S1, and B5–C5 were three nodes with high betweenness centralities. B5–S2 and B5–S1 were two stairs/escalators connecting to the B4 floor and the B3 floor, respectively. Therefore, large numbers of transfer passengers may move around these two nodes and go to other nodes, including columns B5–C1 to B5–C12, metal fences B5–F1, B5–F2, B5–F3, B5–F4, and B5–F7. The node B5–C5 was near B5–S1 and in the path from B5–S1 to B5–S2. Also, B5–F1 and B5–F2 were near B5–C5. Thus, the node B5–C5 is always a “bridge” for passengers to travel to other nodes.

3.2. On-Site Passenger Volume Statistics

To obtain the passenger volume data, field investigation for passenger volume statistics were conducted on weekdays (5 June 2017 to 9 June 2017) and weekends (3 June 2017 to 4 June 2017 and 10 June 2017 to 11 June 2017). Passenger volumes showed distinct features in different time periods of a day. For instance, the rush hours on weekdays were always in the periods of 7:30–9:00 and 17:00–19:00. Thus, the investigated day was classified into multi periods. In addition, the passenger volumes presented different features on weekdays and weekends. For example, rush hour only existed on weekdays. Thus, the time period classifications were different for weekday and weekend, as shown in Table 7.
During field investigation, the passenger volumes of the nodes in different time periods were recorded by using photos or videos. The passenger volumes in every time period on weekday and weekend of the identified key nodes were obtained. The passenger volumes in the same time period showed similar features. For example, the time periods 7:30–9:00 and 17:10–18:30 in weekday were rush hours, and presented continuous high-density passenger flows. Passenger volumes during the time periods 10:00–10:30 and 15:30–16:00 show lower density compared with the rush hour. Every time period lasted from 30 min to 90 min. Due to the similar features of passenger flows in every time period, one or two time points were chosen to demonstrate the features of the time periods. As a result, the passenger volume on the time points of 8:00, 8:30, 9:00, 10:10, 11:10, 11:40, 13:30, 15:40, 17:30, and 18:20 on a weekday, and the time points of 10:10, 10:30, 11:00, 13:30, 15:30, 17:30, 19:30, and 20:00 on a weekend are further presented in detail in line charts, as shown in Figure 7 and Figure 8 in Section 4.1 and Section 4.2. The obtained passenger data could be a useful reference for high-risk node determination.

4. Results: High-Risk Nodes Determination

The high-risk node determination was based on the results of key nodes identification and passenger volume statistics, which means that the high-risk nodes were the nodes with strong connection and interaction abilities, and presents features of large passenger volumes, simultaneously.

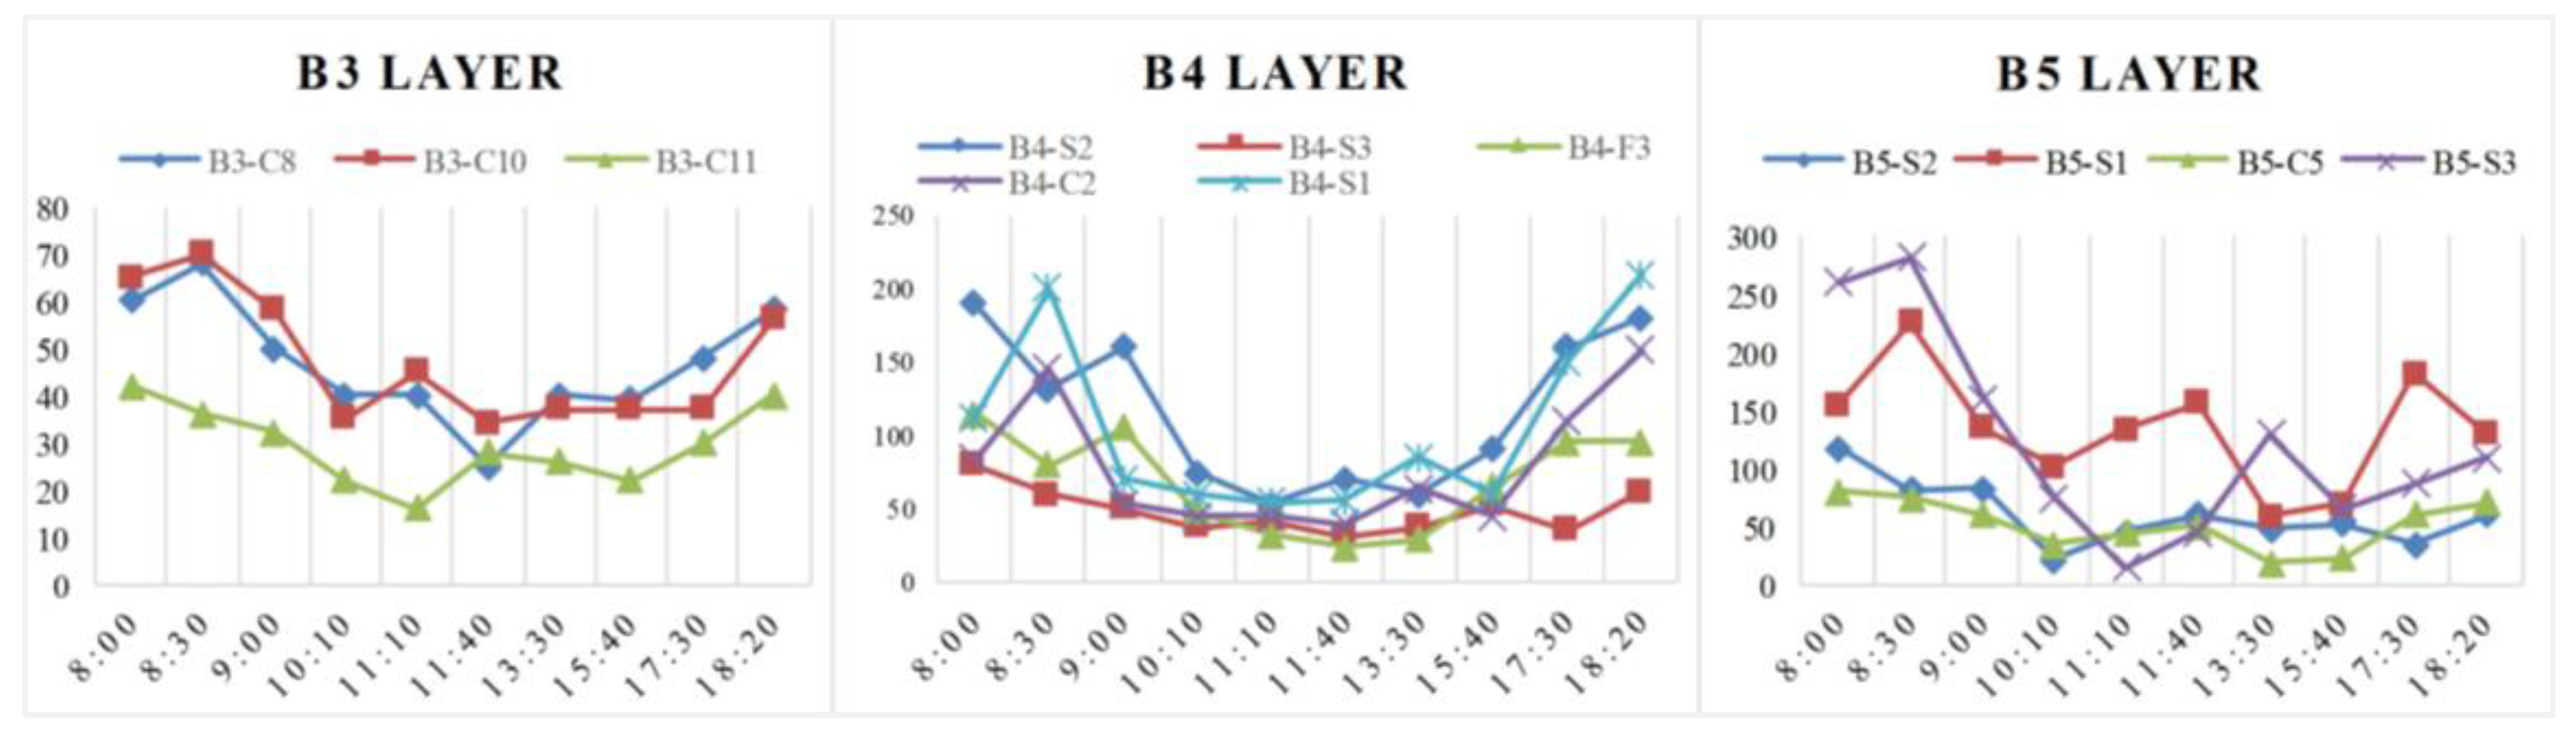
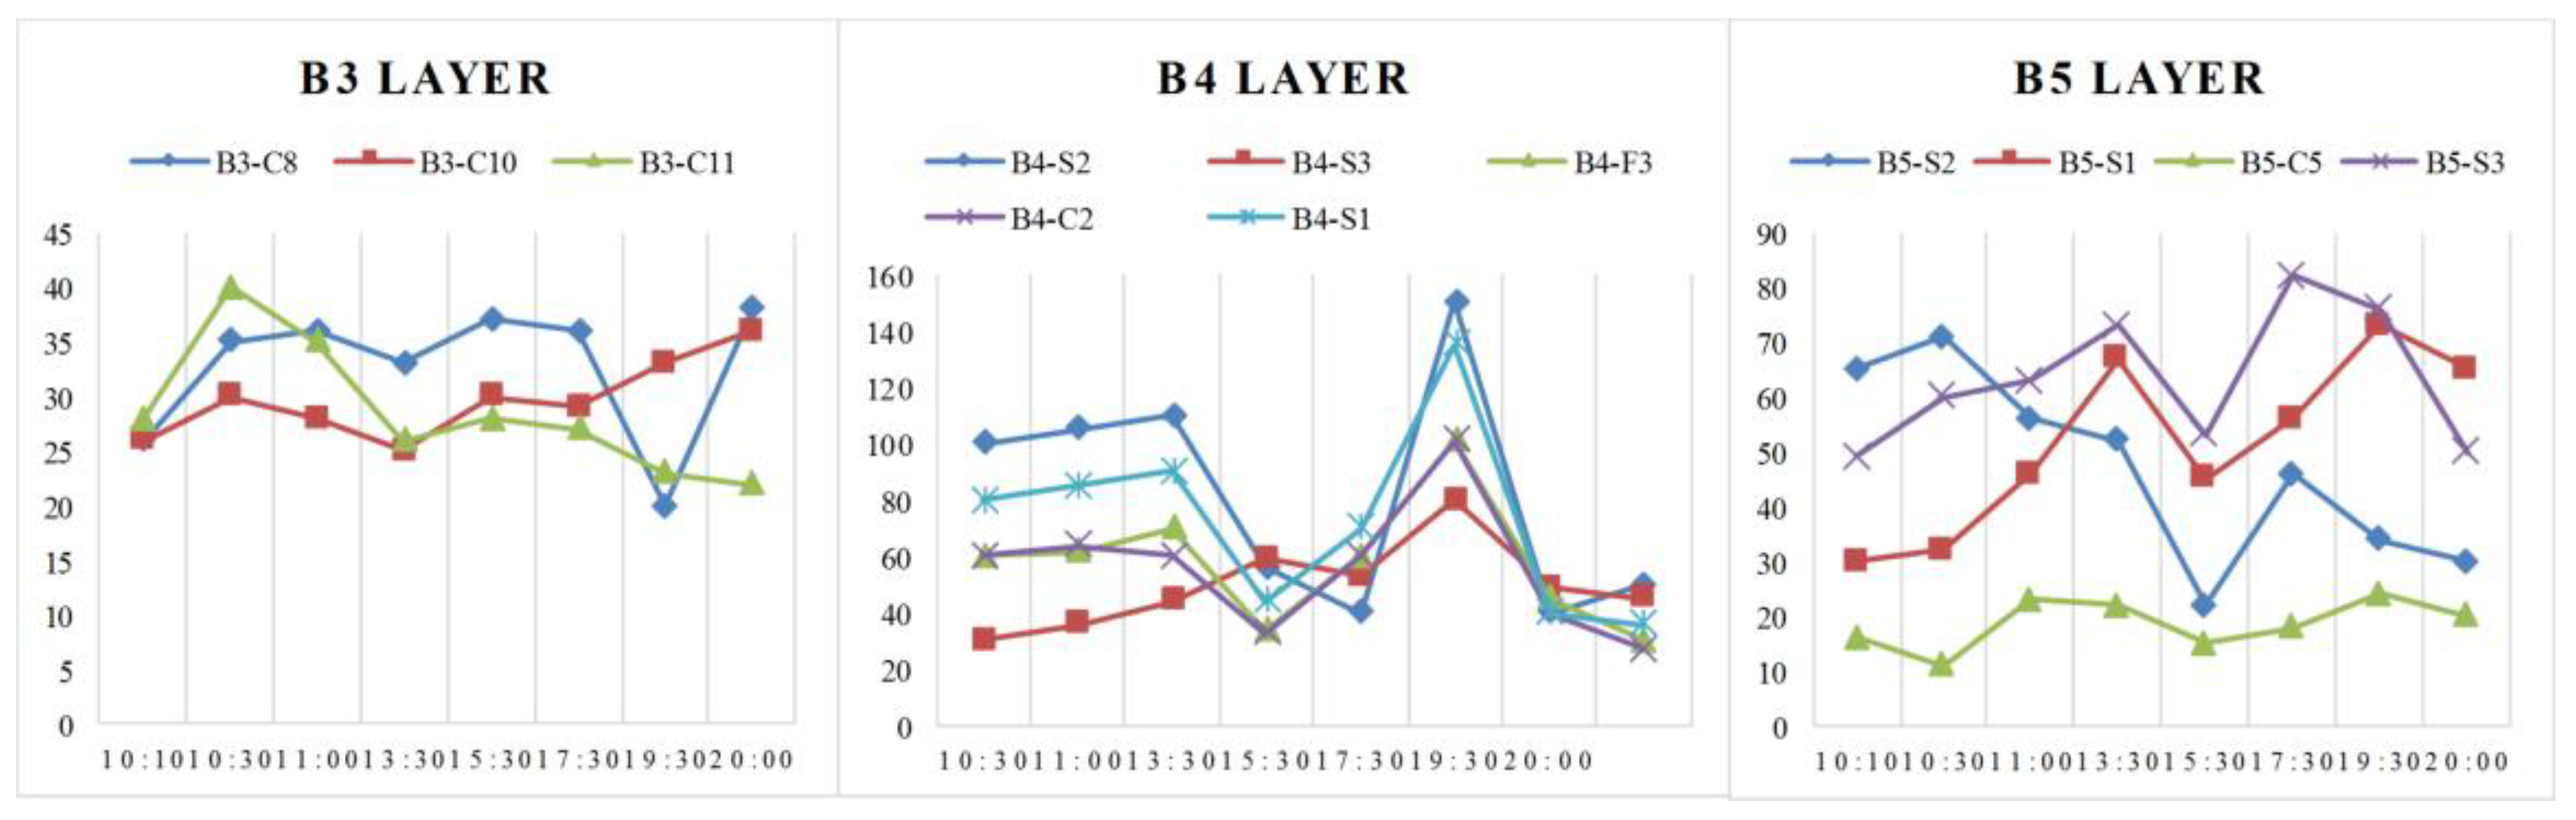
4.1. High-Risk Nodes Determination (Weekday)

The line charts clearly show the passenger volumes of the different identified key nodes in various time points. In the line chart, the higher the point, the larger passenger volume the point represents. On the B3 floor, the passenger volumes of the nodes B3–C8 and B3–C10 were obviously higher than the node B3–C11. Besides, the degree centrality and the betweenness centrality of the two nodes ranked in the top two among the nodes in the B3 floor network. Thus, the nodes B3–C8 and B3–C10 were determined as high-risk nodes on the B3 floor in rail transit weekday operation. On the B4 floor, the nodes B4–S2, B4–C2, B4–S1 showed higher passenger volumes. Also, these three nodes were identified key nodes which rank in top five among the nodes in B4 floor network. The nodes B4–S2, B4–C2, and B4–S1 were determined as high-risk nodes in B4 floor in rail transit weekday operation. Besides, although the node B4–F3 presented relatively lower passenger volumes, the degree centrality and the betweenness centrality of the node ranked third among the nodes in the B4 floor network. B4–F3 was also determined as the high-risk node on the B4 floor, based on synthetic consideration. On the B5 floor, the nodes B5–S1 and B5–S3 showed obviously higher passenger volumes. The two nodes also ranked in top five among the nodes on the B5 floor network in the evaluation of centrality. Therefore, the nodes B5–S1 and B5–S3 were determined as the high-risk nodes in B5 floor in the rail transit weekday operation.

4.2. High-Risk Nodes Determination (Weekend)

In B3 floor, the nodes, B3–C8, B3–C10, and B3–C11, showed similar passenger volume, while the three nodes were also the identified key nodes and ranked in top five among the nodes in the B3 floor network. Thus, the three nodes were determined as the high-risk nodes on the B3 floor in rail transit weekend operation. On the B4 floor, the four nodes B4–S2, B4–F3, B4–C2, and B4–S1, showed higher passenger volumes, especially the nodes B4–S2 and B4–S1. The four nodes were all identified key nodes and thus they were determined as the high-risk nodes for rail transit weekend operation. On the B5 floor, the nodes B5–S2, B5–S1, and B5–S3 displayed obvious higher passenger volumes than the node B5–C5. Therefore, the nodes B5–S2, B5–S1, and B5–S3 were determined as the high-risk nodes in rail transit weekend operation.
The determined high-risk nodes are listed in Table 8.

5. Discussion

Through combined utilization of field investigation and complex network analysis, a total of 18 nodes on the three floors of the station are determined as high-risk nodes in the Lianglukou station. The determined high-risk nodes present obvious features of strong connection and interaction abilities, due to high degree centrality and betweenness centrality. Besides, the nodes are also passenger aggregation nodes with large passenger volumes. This innovative approach to determining high-risk nodes could also be used for other CRTSs.
According to the analysis for the determined high-risk nodes, three results could be summed up: (1) In platform floors, stairs/escalators are almost high-risk nodes. For example, B4–S1, B4–S2, B5–S1, B5–S2, and B5–S3 are determined high-risk nodes. Through field investigation, the passengers present maximum numbers around stairs/escalators when the train arrives, and the aggregated passengers are shaped as an arch. Also, the stairs/escalators are the core nodes of passengers’ transfer. (2) Columns and metal fences that have been determined as high-risk nodes are located near stairs/escalators. Such as B4–C2 and B4–F3, people who take stairs/escalators must go through these facilities. Thus, these facilities are the nodes with strong connection and interaction abilities, and present the feature of large passenger volumes, which are determined as high-risk nodes. (3) On the concourse floor, the determined high-risk nodes present a relatively high degree of centrality and low betweenness centrality compared with the platform floor. This can be concluded through horizontal comparison in Table 5 and Table 6. The determined high-risk nodes are columns located nearby stairs/escalators, exits, and metal fences, including B3–C8, B3–C10, and B3–C11. Due to a broader field with less nodes compared with platform floors, passengers present a lower betweenness centrality in the concourse floor. Besides, because of fewer nodes, the nodes could connect and interact to other nodes directly, which shows a higher degree of centrality. The obtained results could also be directly used in general judgment for CRTSs’ high-risk nodes.

6. Conclusions

As a major component of public transportation service system, urban rail transit developed very quickly in China over the most recent decade. Many CRTSs are always aggregated with crowded passengers in daily operation, especially the transfer stations in the occupation of multi rail transit lines. The public safety of CRTSs deserves much attention. In this study, through key nodes identification and on-site passenger volumes statistics, the high-risk nodes of CRTSs were determined. The Chongqing Lianglukou rail transit station was selected for the case study and 8(on weekday)/10(on weekend) high-risk nodes on the three floors were obtained. On the one hand, the research results could be useful references for the establishment of risk management strategies for rail transit management firms to guarantee the safety of CRTSs. The high-risk nodes present high degree centralities, high betweenness centralities, and large volume of passenger flow. Thus, security strategies could be formulated from these three aspects. For example, strategies such as installing more metal fences around nodes with high degree centralities to split passenger flows could be formulated. On the other hand, the obtained high-risk nodes could be location guidelines for managers to implement security strategies, including where to arrange more policemen, where to install more metal fences, where to place security equipment, etc. The determined high-risk nodes are useful answers for these questions. Thus, the research provides valuable information to implement effective strategies to guarantee the safe operation of urban rail transit stations and ensure urban public safety, which play an important role in enhancing urban sustainability. Based on the research results, simulation for passengers’ movement in high-risk nodes of CRTSs under emergency conditions is another research direction and could be further explored deeply in the rail transit station risk research.

Author Contributions

The authors H.X. designed the study and draft the manuscript; L.J. and S.C. contributed to the research methodology. M.D. and N.S. collected passenger volume data and analyzed the data. All authors have read and approved the final version of the manuscript.

Funding

This study was supported by the research funding: (1) MOE (Ministry of Education in China) Project of Humanities and Social Sciences “The Operational Risk Pressure and Resilient Response Strategies of the Complex Urban Public Spaces” (No. 17YJC630189); (2) Chongqing Research Program of Basic Research and Frontier Technology “The Operational Risk Pressure Evaluation and Resilience Establishment Strategies for the Integrated Passenger Transport Hub” (No. cstc2017jcyjAX0359); (3) 2017 Humanities and Social Science Research Project of Chongqing Education Commission “The Risk Pressure and Resilient Space Establishment Strategies of the Complex Urban Public Spaces” (No. 17SKG053); (4) The Doctoral Funding of the Chongqing University of Posts and Telecommunications “The Risk Management of the Complex Urban Public Spaces Based on Resilience Construction”(No. A2017-01); (5) The Undergraduate Research Training Program of the Chongqing University of Posts and Telecommunications (No. A2017-59).

Acknowledgments

The authors would like to acknowledge the experts who joined in the research and those who provided suggestions. In addition, the authors are grateful to the editor and the two anonymous reviewers for their valuable and constructive comments and suggestions.

Conflicts of Interest

The authors declare no conflict of interest.

Appendix A

Figure A1. The layout plan of B3 floor.
Sustainability 10 02456 g0a1
Figure A2. The layout plan of B4 floor.
Sustainability 10 02456 g0a2

References

  1. Shen, L.; Jorge Ochoa, J.; Shah, M.N.; Zhang, X. The application of urban sustainability indicators—A comparison between various practices. Habitat Int. 2011, 35, 17–29. [Google Scholar] [CrossRef]
  2. Tan, Y.; Xu, H.; Zhang, X. Sustainable urbanization in China: A comprehensive literature review. Cities 2016, 55, 82–93. [Google Scholar] [CrossRef]
  3. Song, L.; Li, Q.; List, G.; Deng, Y.; Lu, P. Using an AHP-ISM based method to study the vulnerability factors of urban rail transit system. Sustainability 2017, 9, 1065. [Google Scholar] [CrossRef]
  4. Waycaster, G.C.; Matsumura, T.; Bilotkach, V.; Haftka, R.T.; Kim, N.H. Review of regulatory emphasis on transportation safety in the United States, 2002–2009: Public versus private modes. Risk Anal. 2018, 38, 1085–1101. [Google Scholar] [CrossRef] [PubMed]
  5. Torretta, V.; Rada, E.C.; Schiavon, M.; Viotti, P. Decision support systems for assessing risks involved in transporting hazardous materials: A review. Saf. Sci. 2017, 92, 1–9. [Google Scholar] [CrossRef]
  6. Ercan, T.; Onat, N.C.; Tatari, O. Investigating carbon footprint reduction potential of public transportation in United States: A system dynamics approach. J. Clean. Prod. 2016, 133, 1260–1276. [Google Scholar] [CrossRef]
  7. Schiavon, M.; Redivo, M.; Antonacci, G.; Rada, E.C.; Ragazzi, M.; Zardi, D.; Giovannini, L. Assessing the air quality impact of nitrogen oxides and benzene from road traffic and domestic heating and the associated cancer risk in an urban area of Verona (Italy). Atmos. Environ. 2015, 120, 234–243. [Google Scholar] [CrossRef]
  8. Van, H.T.; Choocharukul, K.; Fujii, S. The effect of attitudes toward cars and public transportation on behavioral intention in commuting mode choice-A comparison across six Asian countries. Transp. Res. Part A Policy Pract. 2014, 69, 36–44. [Google Scholar] [CrossRef]
  9. Ciuta, S.; Schiavon, M.; Chistè, A.; Ragazzi, M.; Rada, E.C.; Tubino, M.; Badea, A.; Apostol, T. Role of feedstock transport in the balance of primary PM emissions in two case-studies: RMSW incineration vs. sintering plant. UPB Sci. Bull. Ser. D Mech. Eng. 2012, 74, 211–218. [Google Scholar]
  10. Jiao, L.; Shen, L.; Shuai, C.; He, B. A novel approach for assessing the performance of sustainable urbanization based on structural equation modeling: A China case study. Sustainability 2016, 8, 910. [Google Scholar] [CrossRef]
  11. Litman, T. Impacts of rail transit on the performance of a transportation system. Transp. Res. Rec. 2005, 23–29. [Google Scholar] [CrossRef]
  12. Qin, F.; Zhang, X.; Zhou, Q. Evaluating the impact of organizational patterns on the efficiency of urban rail transit systems in China. J. Transp. Geogr. 2014, 40, 89–99. [Google Scholar] [CrossRef]
  13. CCTV Net 43 Chinese Cities Obtain Official Approval to Construct Urban Rail Transit. Available online: http://news.cctv.com/2016/09/09/ARTISgjaZfZXhKQKRuKiIJbF160909.shtml (accessed on 9 September 2017).
  14. Xu, H.; Xue, B. Key indicators for the resilience of complex urban public spaces. J. Build. Eng. 2017, 12, 306–313. [Google Scholar] [CrossRef]
  15. Chopra, S.S.; Dillon, T.; Bilec, M.M.; Khanna, V. A network-based framework for assessing infrastructure resilience: a case study of the London metro system. J. R. Soc. Interface 2016, 13, 1–11. [Google Scholar] [CrossRef] [PubMed]
  16. Li, Q.; Song, L.; List, G.F.; Deng, Y.; Zhou, Z.; Liu, P. A new approach to understand metro operation safety by exploring metro operation hazard network (MOHN). Saf. Sci. 2017, 93, 50–61. [Google Scholar] [CrossRef]
  17. Namoco, R.A.; Lago, E.M.; Pailagao, R.O.; Vallar, J.B. An Integer Programming Approach for Patrol Police Allocation in an Urban City in the Philippines. Indian J. Sci. Technol. 2017, 10, 1–8. [Google Scholar] [CrossRef] [Green Version]
  18. Lau, H.C.; Yuan, Z.; Gunawan, A. Patrol scheduling in urban rail network. Ann. Oper. Res. 2016, 239, 317–342. [Google Scholar] [CrossRef]
  19. Zhang, J.; Wang, S.; Wang, X. Comparison analysis on vulnerability of metro networks based on complex network. Phys. A Stat. Mech. Appl. 2018, 496, 72–78. [Google Scholar] [CrossRef]
  20. Angeloudis, P.; Fisk, D. Large subway systems as complex networks. Phys. A Stat. Mech. Appl. 2006, 367, 553–558. [Google Scholar] [CrossRef]
  21. Beck, G.; Kropp, C. Infrastructures of risk: A mapping approach towards controversies on risks. J. Risk Res. 2011, 14, 1–16. [Google Scholar] [CrossRef]
  22. Liu, J.; Lu, H.; Ma, H.; Liu, W. Network vulnerability analysis of rail transit plans in Beijng-Tianjin-Hebei region considering connectivity reliability. Sustainability 2017, 9, 1479. [Google Scholar] [CrossRef]
  23. Bruyelle, J.L.; O’Neill, C.; El-Koursi, E.M.; Hamelin, F.; Sartori, N.; Khoudour, L. Improving the resilience of metro vehicle and passengers for an effective emergency response to terrorist attacks. Saf. Sci. 2014, 62, 37–45. [Google Scholar] [CrossRef]
  24. Qian, Q.; Lin, P. Safety risk management of underground engineering in China: Progress, challenges and strategies. J. Rock Mech. Geotech. Eng. 2016, 8, 423–442. [Google Scholar] [CrossRef]
  25. Sun, D.; Zhao, Y.; Lu, Q. Vulnerability analysis of urban rail transit networks: A case study of Shanghai, China. Sustainability 2015, 7, 6919–6936. [Google Scholar] [CrossRef]
  26. Yang, Y.; Liu, Y.; Zhou, M.; Li, F.; Sun, C. Robustness assessment of urban rail transit based on complex network theory: A case study of the Beijing Subway. Saf. Sci. 2015, 79, 149–162. [Google Scholar] [CrossRef]
  27. Busslinger, A.; Nyfeler, S.; Reinke, P. Sustainable design of underground rail systems—Aerodynamics at the interface of rolling stock and civil construction. In The Aerodynamics of Heavy Vehicles III; Springer: Cham, Switzerland, 2015; pp. 61–81. [Google Scholar]
  28. Shi, C.; Zhong, M.; Nong, X.; He, L.; Shi, J.; Feng, G. Modeling and safety strategy of passenger evacuation in a metro station in China. Saf. Sci. 2012, 50, 1319–1332. [Google Scholar] [CrossRef]
  29. Latora, V.; Marchiori, M. Is the Boston subway a small-world network? Phys. A Stat. Mech. Appl. 2002, 314, 109–113. [Google Scholar] [CrossRef] [Green Version]
  30. Lee, K.; Jung, W.S.; Park, J.S.; Choi, M.Y. Statistical analysis of the metropolitan Seoul subway system: Network structure and passenger flows. Phys. A Stat. Mech. Appl. 2008, 387, 6231–6234. [Google Scholar] [CrossRef]
  31. Cox, A.; Prager, F.; Rose, A. Transportation security and the role of resilience: A foundation for operational metrics. Transp. Policy 2011, 18, 307–317. [Google Scholar] [CrossRef]
  32. Greenberg, M.; Lioy, P.; Ozbas, B.; Mantell, N.; Isukapalli, S.; Lahr, M.; Altiok, T.; Bober, J.; Lacy, C.; Lowrie, K.; Mayer, H.; Rovito, J. Passenger rail security, planning, and resilience: Application of network, plume, and economic simulation models as decision support tools. Risk Anal. 2013, 33, 1969–1986. [Google Scholar] [CrossRef] [PubMed]
  33. Wu, G.Y.; Chien, S.W.; Huang, Y.T. Modeling the occupant evacuation of the mass rapid transit station using the control volume model. Build. Environ. 2010, 45, 2280–2288. [Google Scholar] [CrossRef]
  34. Kyriakidis, M.; Hirsch, R.; Majumdar, A. Metro railway safety: An analysis of accident precursors. Saf. Sci. 2012, 50, 1535–1548. [Google Scholar] [CrossRef]
  35. Ministry of Emergency Management of the People’s Republic of China Emergency Plan for the Disposal of Urban Subway Accidents. Available online: http://www.chinasafety.gov.cn/gk/yjjy/201804/t20180419_200414.shtml (accessed on 3 July 2018).
  36. Ministry of Transport of the People’s Republic of China Regulations on Operation and Management of Urban Rail Transit. Available online: http://www.ycrbc.com/xinwenzhongxin/xingyedongtai2/2018-06-04/205.html (accessed on 3 July 2018).
  37. General Office of the State Council in China Instructions on Ensuring Safe Operation of Urban Rail Transit. Available online: http://www.gov.cn/zhengce/content/2018-03/23/content_5276875.htm (accessed on 3 July 2018).
  38. Emergency Management Committee of Shanghai Emergency Plan for the Disposal of Rail Transit Operation Accidents in Shanghai. Available online: http://www.shanghai.gov.cn/shanghai/node2314/node2319/n31973/n32019/n32022/n32024/u21ai858107.shtml (accessed on 3 July 2018).
  39. General Office of Chongqing Municipal People’s Government Emergency Plan for the Disposal of Rail Transit Emergency Events in Chongqing. Available online: http://www.cq.gov.cn/publicinfo/web/views/Show!detail.action?sid=4058000 (accessed on 3 July 2018).
  40. Gana, A.J.; Emmanuel, J.A. Road transportation and traffic law enforcement in Nigeria: A case study of the Federal Road Safety Corps (FRSC). West Afr. J. Ind. Acad. Res. 2014, 11, 134–151. [Google Scholar]
  41. Yang, C.; McCollum, D.; McCarthy, R.; Leighty, W. Meeting an 80% reduction in greenhouse gas emissions from transportation by 2050: A case study in California. Transp. Res. Part D Transp. Environ. 2009, 14, 147–156. [Google Scholar] [CrossRef] [Green Version]
  42. Ministry of Ecology and Environment of the People’s Republic of China Standard of Atmospheric Pollutant Emission for Mobile Source. Available online: http://kjs.mep.gov.cn/hjbhbz/bzwb/dqhjbh/dqydywrwpfbz/index.shtml (accessed on 4 July 2018).
  43. Ministry of Ecology and Environment of the People’s Republic of China Environmental Vibration and Noise Emission Control in the Construction of Urban Rail Transit. Available online: http://www.zhb.gov.cn/gkml/hbb/bgth/201512/t20151230_320802.htm (accessed on 4 July 2018).
  44. Litman, T.; Burwell, D. Issues in sustainable transportation. Int. J. Glob. Environ. Issues 2006, 6, 331–347. [Google Scholar] [CrossRef]
  45. Liu, X.; Li, L.; Liu, X.; Zhang, T.; Rong, X.; Yang, L.; Xiong, D. Field investigation on characteristics of passenger flow in a Chinese hub airport terminal. Build. Environ. 2018, 133, 51–61. [Google Scholar] [CrossRef]
  46. Chen, F.; Wu, Q.; Zhang, H.; Li, S.; Zhao, L. Relationship analysis on station capacity and passenger flow: A case of Beijing subway Line 1. J. Transp. Syst. Eng. Inf. Technol. 2009, 9, 93–98. [Google Scholar] [CrossRef]
  47. Chen, Z.; Su, L.; Zhang, C. Research on the synergy degree of aboveground and underground space along urban rail transit from the perspective of urban sustainable development. Sustainability 2016, 8, 934. [Google Scholar] [CrossRef]
  48. Hwangbo, H.; Kim, J.; Kim, S.; Gu Ji, Y. Toward universal design in public transportation systems: An analysis of low-floor bus passenger behavior with video observations. Hum. Factors Ergon. Manuf. Serv. Ind. 2015, 25, 183–197. [Google Scholar] [CrossRef]
  49. Cessford, G.; Muhar, A. Monitoring options for visitor numbers in national parks and natural areas. J. Nat. Conserv. 2003, 11, 240–250. [Google Scholar] [CrossRef]
  50. Liao, M.; Liu, G. Modeling passenger behavior in nonpayment areas at rail transit stations. Transp. Res. Rec. J. Transp. Res. Board 2015, 2534, 101–108. [Google Scholar] [CrossRef]
  51. Zeng, W.; Nakamura, H.; Chen, P. A modified social force model for pedestrian behavior simulation at signalized crosswalks. Procedia Soc. Behav. Sci. 2014, 138, 521–530. [Google Scholar] [CrossRef]
  52. Babbie, E. The Basics of Social Research; Wadsworth Cengage: Belmont, CA, USA, 2014; pp. 303–304. [Google Scholar]
  53. Wikipedia Qualitative Research. Available online: https://en.wikipedia.org/wiki/Qualitative_research#cite_note-1 (accessed on 3 July 2018).
  54. Li, F.; Chen, S.; Wang, X.; Feng, F. Pedestrian evacuation modeling and simulation on metro platforms considering panic impacts. Procedia Soc. Behav. Sci. 2014, 138, 314–322. [Google Scholar] [CrossRef]
  55. Chongqing Rail Transit (Group) Co. Ltd. The Chongqing Rail Transit Operation Mileage Reaches to 264.3 Kilometers. Available online: http://www.cqmetro.cn/wwwroot_release/crtweb/xwzx/zhxw/337181.shtml (accessed on 6 January 2018).
  56. Jiao, L.; Shen, L.; Shuai, C.; Tan, Y.; He, B. Measuring crowdedness between adjacent stations in an urban metro system: A Chinese case study. Sustainability 2017, 9, 2325. [Google Scholar] [CrossRef]
  57. Clark-Ginsberg, A. Participatory risk network analysis: A tool for disaster reduction practitioners. Int. J. Disaster Risk Reduct. 2017, 21, 430–437. [Google Scholar] [CrossRef]
  58. Boccaletti, S.; Latora, V.; Moreno, Y.; Chavez, M.; Hwang, D.U. Complex networks: Structure and dynamics. Phys. Rep. 2006, 424, 175–308. [Google Scholar] [CrossRef] [Green Version]
  59. Borgatti, S.P.; Everett, M.G.; Freeman, L.C. UCINET. In Encyclopedia of Social Network Analysis and Mining; Springer Science + Business Media: New York, NY, USA, 2014; pp. 2261–2306. ISBN 978-1-4614-6169-2. [Google Scholar]
  60. Mingxin, Z. Social Network Analysis: History, Concepts, and Research. In Handbook of Social Network Technologies and Applications; Springer: Boston, UK, 2010; pp. 3–21. [Google Scholar]
  61. Chen, X.; Zhou, L.; Yue, Y.; Zhou, Y.; Liu, L. Data-driven method to estimate the maximum likelihood space- time trajectory in an urban rail transit system. Sustainability 2018, 10, 1752. [Google Scholar] [CrossRef]
  62. Wu, X.; Dong, H.; Tse, C.K.; Ho, I.W.H.; Lau, F.C.M. Analysis of metro network performance from a complex network perspective. Phys. A Stat. Mech. Appl. 2018, 492, 553–563. [Google Scholar] [CrossRef]
Figure 1. The distinctive stations connect to the Lianglukou station.
Sustainability 10 02456 g001
Figure 2. The Lianglukou station map.
Sustainability 10 02456 g002
Figure 3. The layout plan of the B5 floor.
Sustainability 10 02456 g003
Figure 4. The complex network of the B5 layer.
Sustainability 10 02456 g004
Figure 5. The degree centrality of nodes in the B5 floor network.
Sustainability 10 02456 g005
Figure 6. The betweenness centrality of nodes in the B5 floor network.
Sustainability 10 02456 g006
Figure 7. Line charts of the identified key nodes’ passenger volumes on weekday.
Sustainability 10 02456 g007
Figure 8. Line charts of the identified key nodes’ passenger volumes on weekend.
Sustainability 10 02456 g008
Table 1. Time periods classification on weekday and weekend.
DateTimeInvestigation Contents
5 May 201710:00–16:00Structure of the station
8 May 201713:00–16:00Structure and passenger aggregation nodes of B3 Floor
15 May 201713:00–16:00Structure and passenger aggregation nodes of B4 Floor
22 May 201713:00–16:00Structure and passenger aggregation nodes of B5 Floor
5 June 2017–9 June 20177:30–18:30Passenger volume statistics for the floors of B3, B4, and B5
3 June 2017–4 June 201710:10–20:10Passenger volume statistics for the floors of B3, B4, and B5
10 June 2017–11 June 201710:10–20:10Passenger volume statistics for the floors of B3, B4, and B5
Table 2. The dimensional data of the three layers of Lianglukou Station.
FloorLength (m)Width (m)Area (m2)
B3103.8151557
B496121152
B5107.4121288.8
Table 3. The 55 passenger aggregation nodes of B5 floor.
No.ColumnsLeft DoorRight DoorEscalators/StairsMetal Fences
1B5–C1B5–LD1B5–RD1B5–S1B5–F1
2B5–C2B5–LD2B5–RD2B5–S2B5–F2
3B5–C3B5–LD3B5–RD3B5–S3B5–F3
4B5–C4B5–LD4B5–RD4 B5–F4
5B5–C5B5–LD5B5–RD5 B5–F5
6B5–C6B5–LD6B5–RD6 B5–F6
7B5–C7B5–LD7B5–RD7 B5–F7
8B5–C8B5–LD8B5–RD8 B5–F8
9B5–C9B5–LD9B5–RD9
10B5–C10B5–LD10B5–RD10
11B5–C11B5–LD11B5–RD11
12B5–C12B5–LD12B5–RD12
13 B5–LD13B5–RD13
14 B5–LD14B5–RD14
15 B5–LD15B5–RD15
16 B5–LD16B5–RD16
Table 4. The densities of each layer networks.
LayerB3 LayerB4 LayerB5 Layer
Density0.7920.2910.292
Table 5. Nodes with top five degree centralities on the three floors.
No.B3 FloorDegreenDegreeB4 FloorDegreenDegreeB5 FloorDegreenDegree
1B3–C8311.000B4–S2520.766B5–S2390.722
2B3–C10311.000B4–S3410.612B5–S1320.593
3B3–C7300.968B4–F3320.478B5–C5310.574
4B3–C9300.968B4–C2300.448B5–S3240.444
5B3–C11300.968B4–S1290.433B5–C6230.426
Table 6. Nodes with top five betweenness centralities on the three floors.
No.B3 FloorBetweennessB4 FloorBetweennessB5 FloorBetweenness
1B3–C109.407B4–S2591.011B5–S2750.55
2B3–C89.407B4–S3255.775B5–S1441.847
3B3–C117.957B4–F3164.735B5–C5303.6
4B3–C137.418B4–S1121.867B5–S3225.744
5B3–C147.418B4–C282.606B5–F8129.28
Table 7. Time period classification of weekdays and weekends.
DateTime Periods
Weekday7:30–9:0010:00–10:3011:00–11:5013:30–14:1015:30–16:0017:10–18:30
Weekend10:10–11:1013:10–14:1015:10–16:1016:50–17:5019:10–20:10
Table 8. Determined high–risk nodes.
FloorWeekdayWeekend
B3 floorB3–C8, B3–C10B3–C8, B3–C10, B3–C11
B4 floorB4–S2, B4–C2, B4–S1, B4–F3B4–S2, B4–C2, B4–S1, B4–F3
B5 floorB5–S1, B5–S3B5–S1, B5–S2, B5–S3

