Article

Potential Sources of Anthropogenic Copper Inputs to European Agricultural Soils

1
European Commission, Joint Research Centre, Directorate for Sustainable Resources, IT-21027 Ispra (VA), Italy
2
Environmental Geosciences Department, University of Basel, CH-4056 Basel, Switzerland
*
Author to whom correspondence should be addressed.
Sustainability 2018, 10(7), 2380; https://doi.org/10.3390/su10072380
Submission received: 8 June 2018 / Revised: 26 June 2018 / Accepted: 5 July 2018 / Published: 9 July 2018

Abstract

:
In the European Union (EU), copper concentration in agricultural soil stems from anthropogenic activities and natural sources (soil and geology). This manuscript reports a statistical comparison of copper concentrations at different levels of administrative units, with a focus on agricultural areas. Anthropogenic sources of diffuse copper contamination include fungicidal treatments, liquid manure (mainly from pigs), sewage sludge, atmospheric deposition, mining activities, local industrial contamination and particles from car brakes. Sales of fungicides in the EU are around 158,000 tonnes annually, a large proportion of which are copper based and used extensively in vineyards and orchards. Around 10 million tonnes of sewage sludge is treated annually in the EU, and 40% of this (which has a high copper content) is used as fertilizer in agriculture. In the EU, 150 million pigs consume more than 6.2 million tonnes of copper through additives in their feed, and most of their liquid manure ends up in agricultural soil. These three sources (sales of fungicides, sewage sludge and copper consumption for pigs feed) depend much on local traditional farming practices. Recent research towards replacing copper spraying in vineyards and policy developments on applying sewage and controlling the feed given to pigs are expected to reduce copper accumulation in agricultural soil.

Graphical Abstract

1. Introduction

Humans have known about copper (Cu) for at least 10,000 years; it has been used extensively across the world by, for example, Egyptians, Greeks, Romans, Aztecs, Balkans and Chinese cultures [1,2]. Copper is used in construction, machinery, energy, transport, electronics, agriculture and, in recent years, for animal nutrition [3]. In the 1880s, a fungicide (based on a mixture of copper sulfate, lime and water) became widely used to control mildew in grapes vines [2]. In the 1950s, the antifungal properties of copper were demonstrated in laboratories [4]. On a global scale, the use of copper in agriculture increased after 1987 [3].
Soil pollution poses a significant risk to human health, as recognized in a recent review of contaminated sites in Europe [5]. In particular, heavy metals from industrial waste can be a source of contamination of soil and, thus, of drinking water, food and animal fodder [6]. The contamination of agricultural soil with inorganic (copper) and organic pesticides is of particular concern for the state of our environment and for food safety [7]. Policy organizations such as the Finnish and Swedish Ministries of Environment [8] and Joint Research Centre [9] together with literature findings [10] propose a concentration of 100 mg kg−1 as a threshold for human health consideration for copper in soil. However, this threshold value of 100 mg kg−1 can vary from country to country [11]. A long-running debate is whether the underlying parent material [12] or agricultural practices [1] are the more important driver of copper accumulation in soil. A recent pan-European study by Ballabio et al. developed a regression model to identify the main soil, climate and geological properties that can influence copper distribution [13]. This regression model for copper distribution in the European Union (EU), based on 21,682 soil samples, found that high copper levels in vineyards are mostly related to management practices at regional level (including frequent Cu-based fungicide treatments) [13]. In addition to management practices, the regression model [13] found that main drivers of high copper concentrations are also high clay content, high pH and heavy summer rainfall. The influence of geology is limited to certain parent materials such as tephra and acidic volcanic rocks (high copper concentration) while sedimentary rocks and fluvial deposits have lower copper levels [13]. The present paper follows that study [13], by investigating the anthropogenic activities that lead to copper accumulation, with a specific focus on agriculture.
The objectives of this study were: (1) to investigate the anthropogenic factors influencing copper accumulation in agricultural topsoils; (2) to link land use and agricultural management with copper concentration; and (3) to identify which areas of the EU may be most affected. It was not among the objectives of this study to challenge any local or regional study that has been performed with a greater number of soil samples or more precise knowledge of drivers influencing copper values at local scale.

2. Materials and Methods
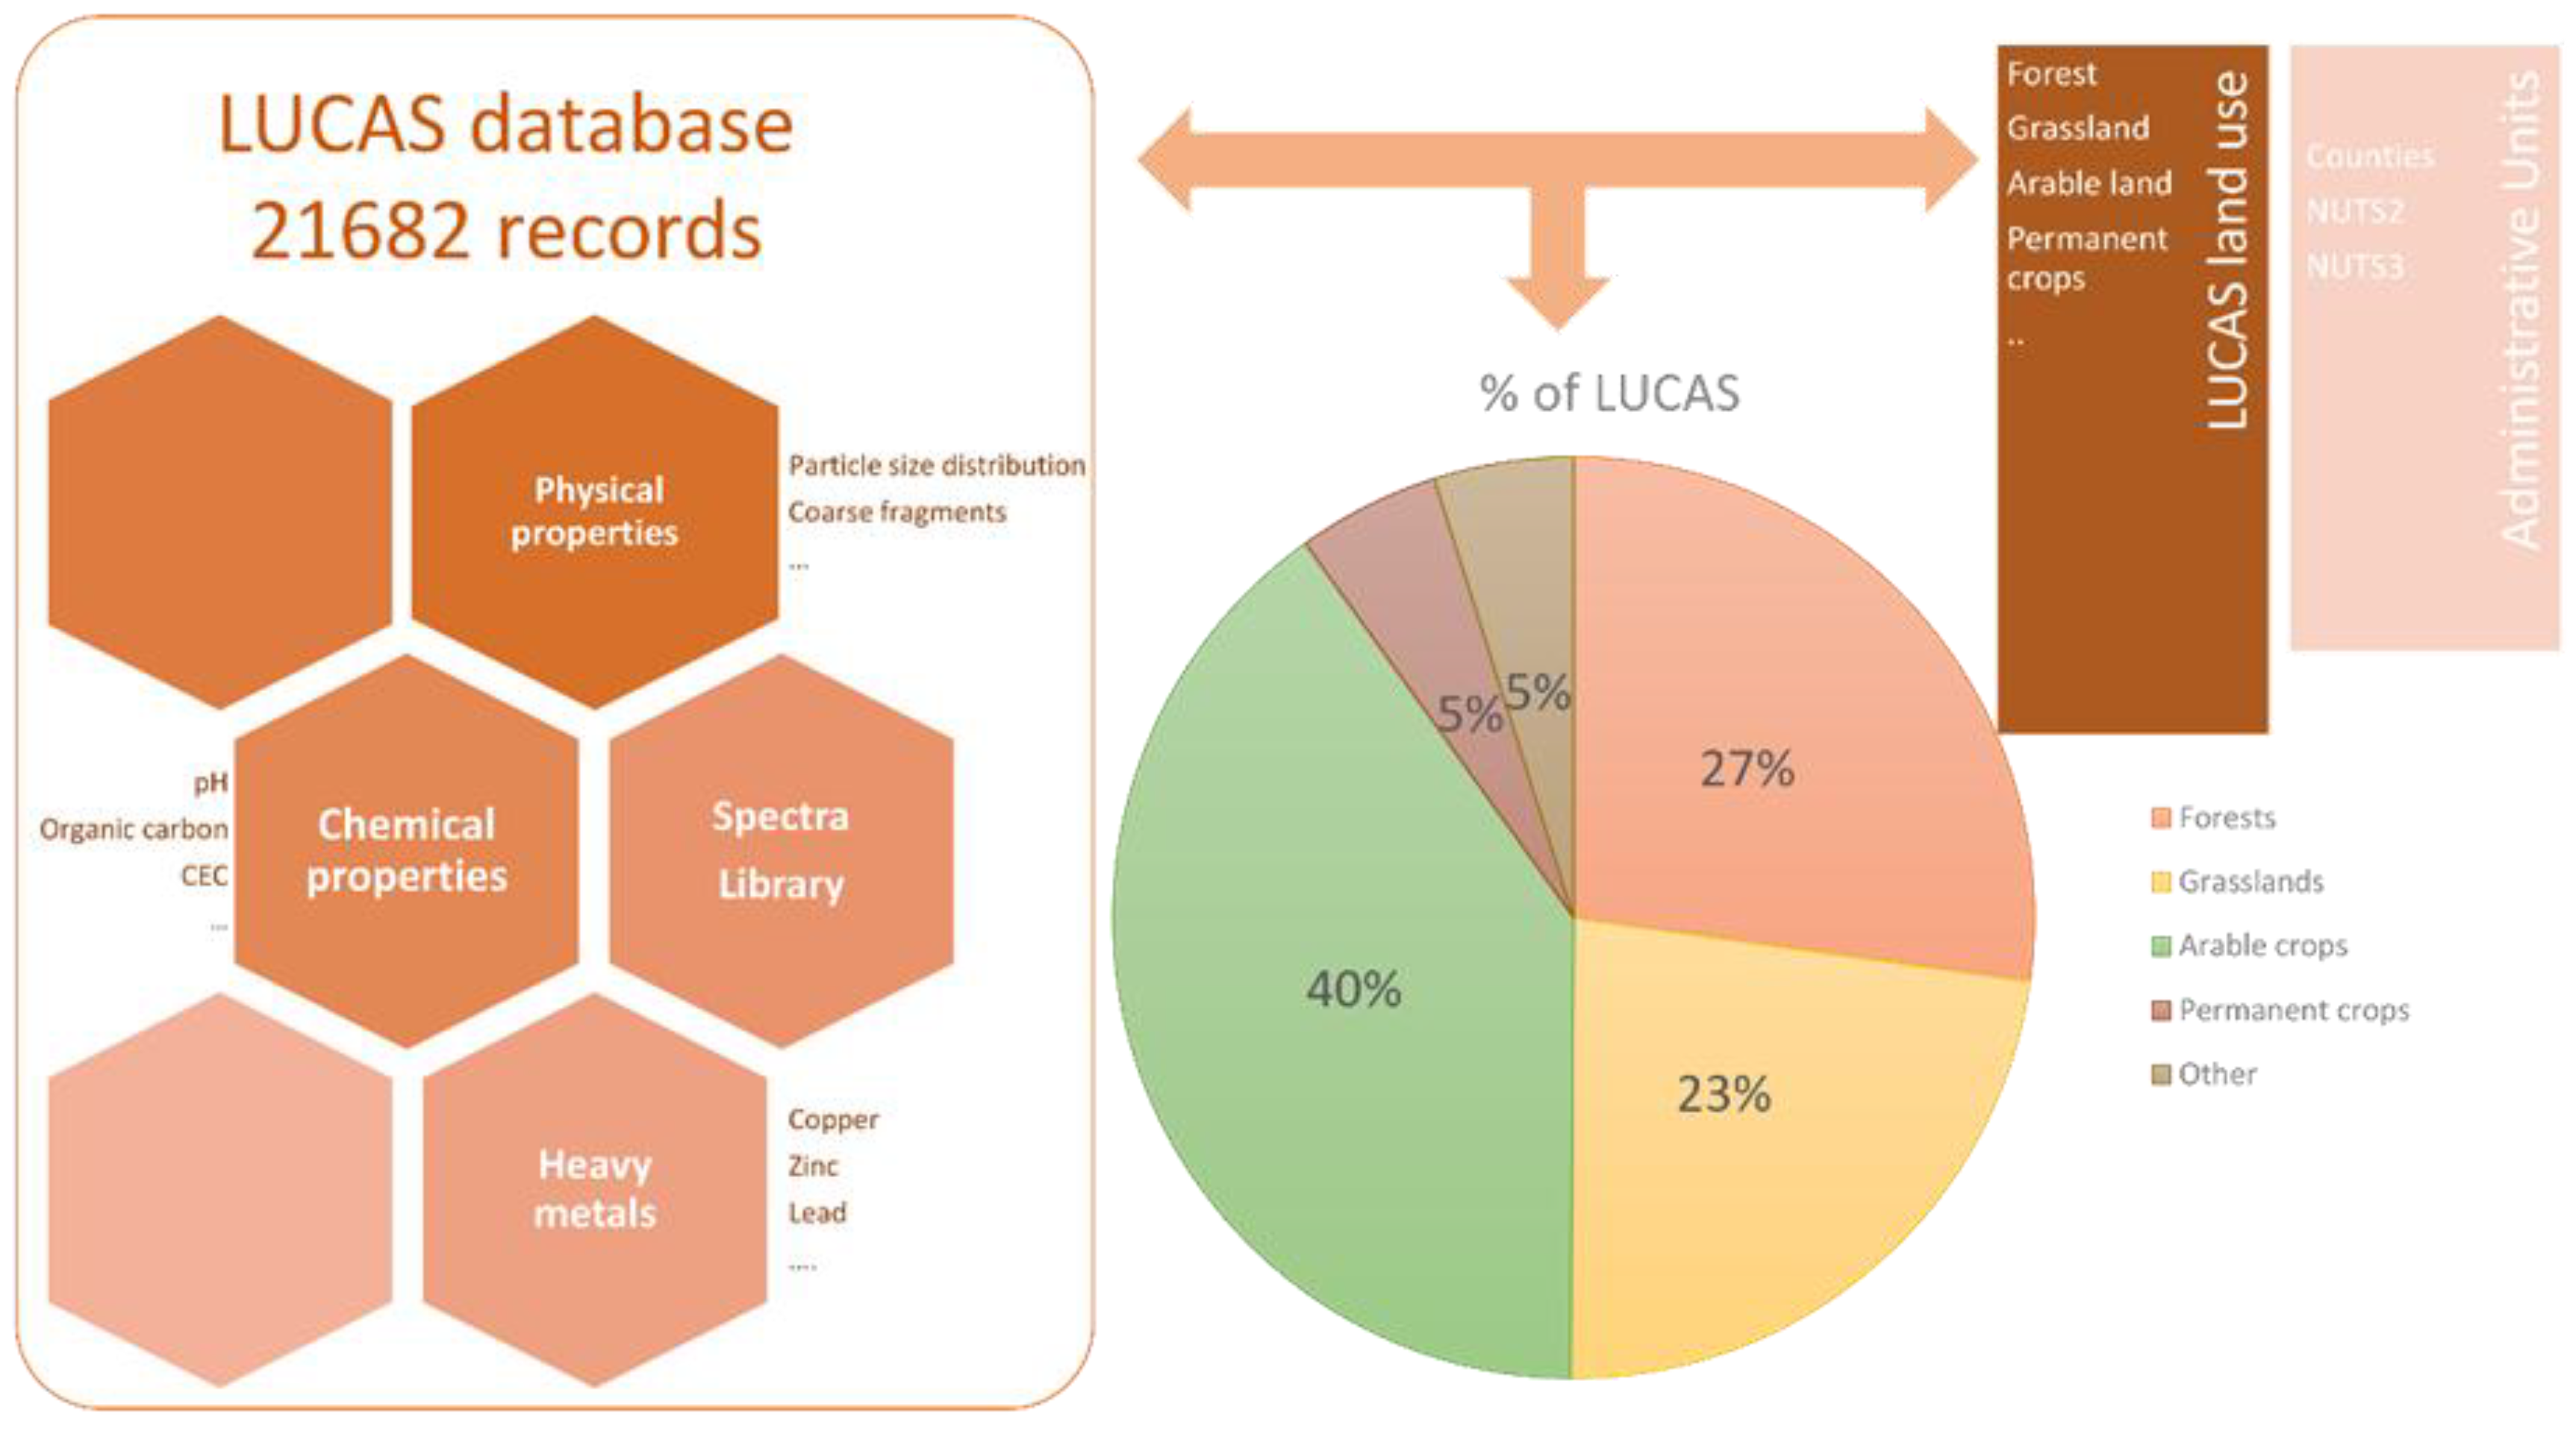
2.1. Geodatabases

The study used the topsoil database from the Land Use/Land Cover Area frame Survey (LUCAS) [14] (known as LUCAS Topsoil), which contains records of the physical and chemical properties of 21,682 soil samples in 27 EU Member States (excluding Croatia) (Figure 1). The laboratory analysis of the physical and chemical properties (including copper) used standard ISO methods including a validation process [15]. The soil samples were taken from the uppermost 20 cm of surveyed soil and more details on both the LUCAS topsoil sampling scheme and the analysis can be found in recently published papers [14,15,16].
Surveyors also noted the land cover type (e.g., cropland, forest, and grassland). The LUCAS topsoil survey focused mainly on agricultural areas, with cropland samples constituting 45% of the total (5% of which are located in permanent crops), while grassland and forest samples make up 22.9% and 27.2%, respectively.
LUCAS Topsoil is the most comprehensive harmonized soil database for the EU, as it has 13 categories of physical and chemical properties, analysis of 12 heavy metals, and a visible and near infrared spectral library (Figure 1). In addition, LUCAS Topsoil is up to date, as it uses sampling data from 2009 and 2012.
LUCAS Topsoil can be linked with other georeferenced data sources, such as the LUCAS land cover survey and the European Union administrative units (Figure 1). The LUCAS land cover survey is a point survey organized by the statistical service of the European Commission (EUROSTAT) every three years [17]. The surveyors visit approximately 270,000 locations and recording the land cover type (forest, grassland, arable, etc.), land use and other landscape features [14].
The Nomenclature of Territorial Units for Statistics (NUTS) is the official EU database for delineating administrative units at different levels (country, region, province and municipality). The NUTS2 geographical regions are often used for developing regional policies and therefore many environmental indicators are presented at this scale. Across the 27 EU Member States, there are 285 NUTS2 administrative units, with areas ranging from 13 km2 to 165,075 km2 and populations of 0.8–3 million inhabitants [18].

2.2. Statistical Analysis per Geographical Units and Land Cover Types

For the copper attribute of the LUCAS Topsoil database, we performed a statistical analysis to assess the mean, median, skewness and percentiles. The copper data were aggregated according to different administrative units such as countries and regions. At country level, we provide the mean, median and the interquartile range (IQR). The IQR is the measure where the average 50% of the values are located and shows where the bulk of an attribute’s value lies.
The data are also analyzed by land cover groups aggregated on annual croplands, permanent crops, forests and grasslands. As the objective of the paper is to understand how management practices are influencing copper distribution, we focus on annual and permanent croplands.

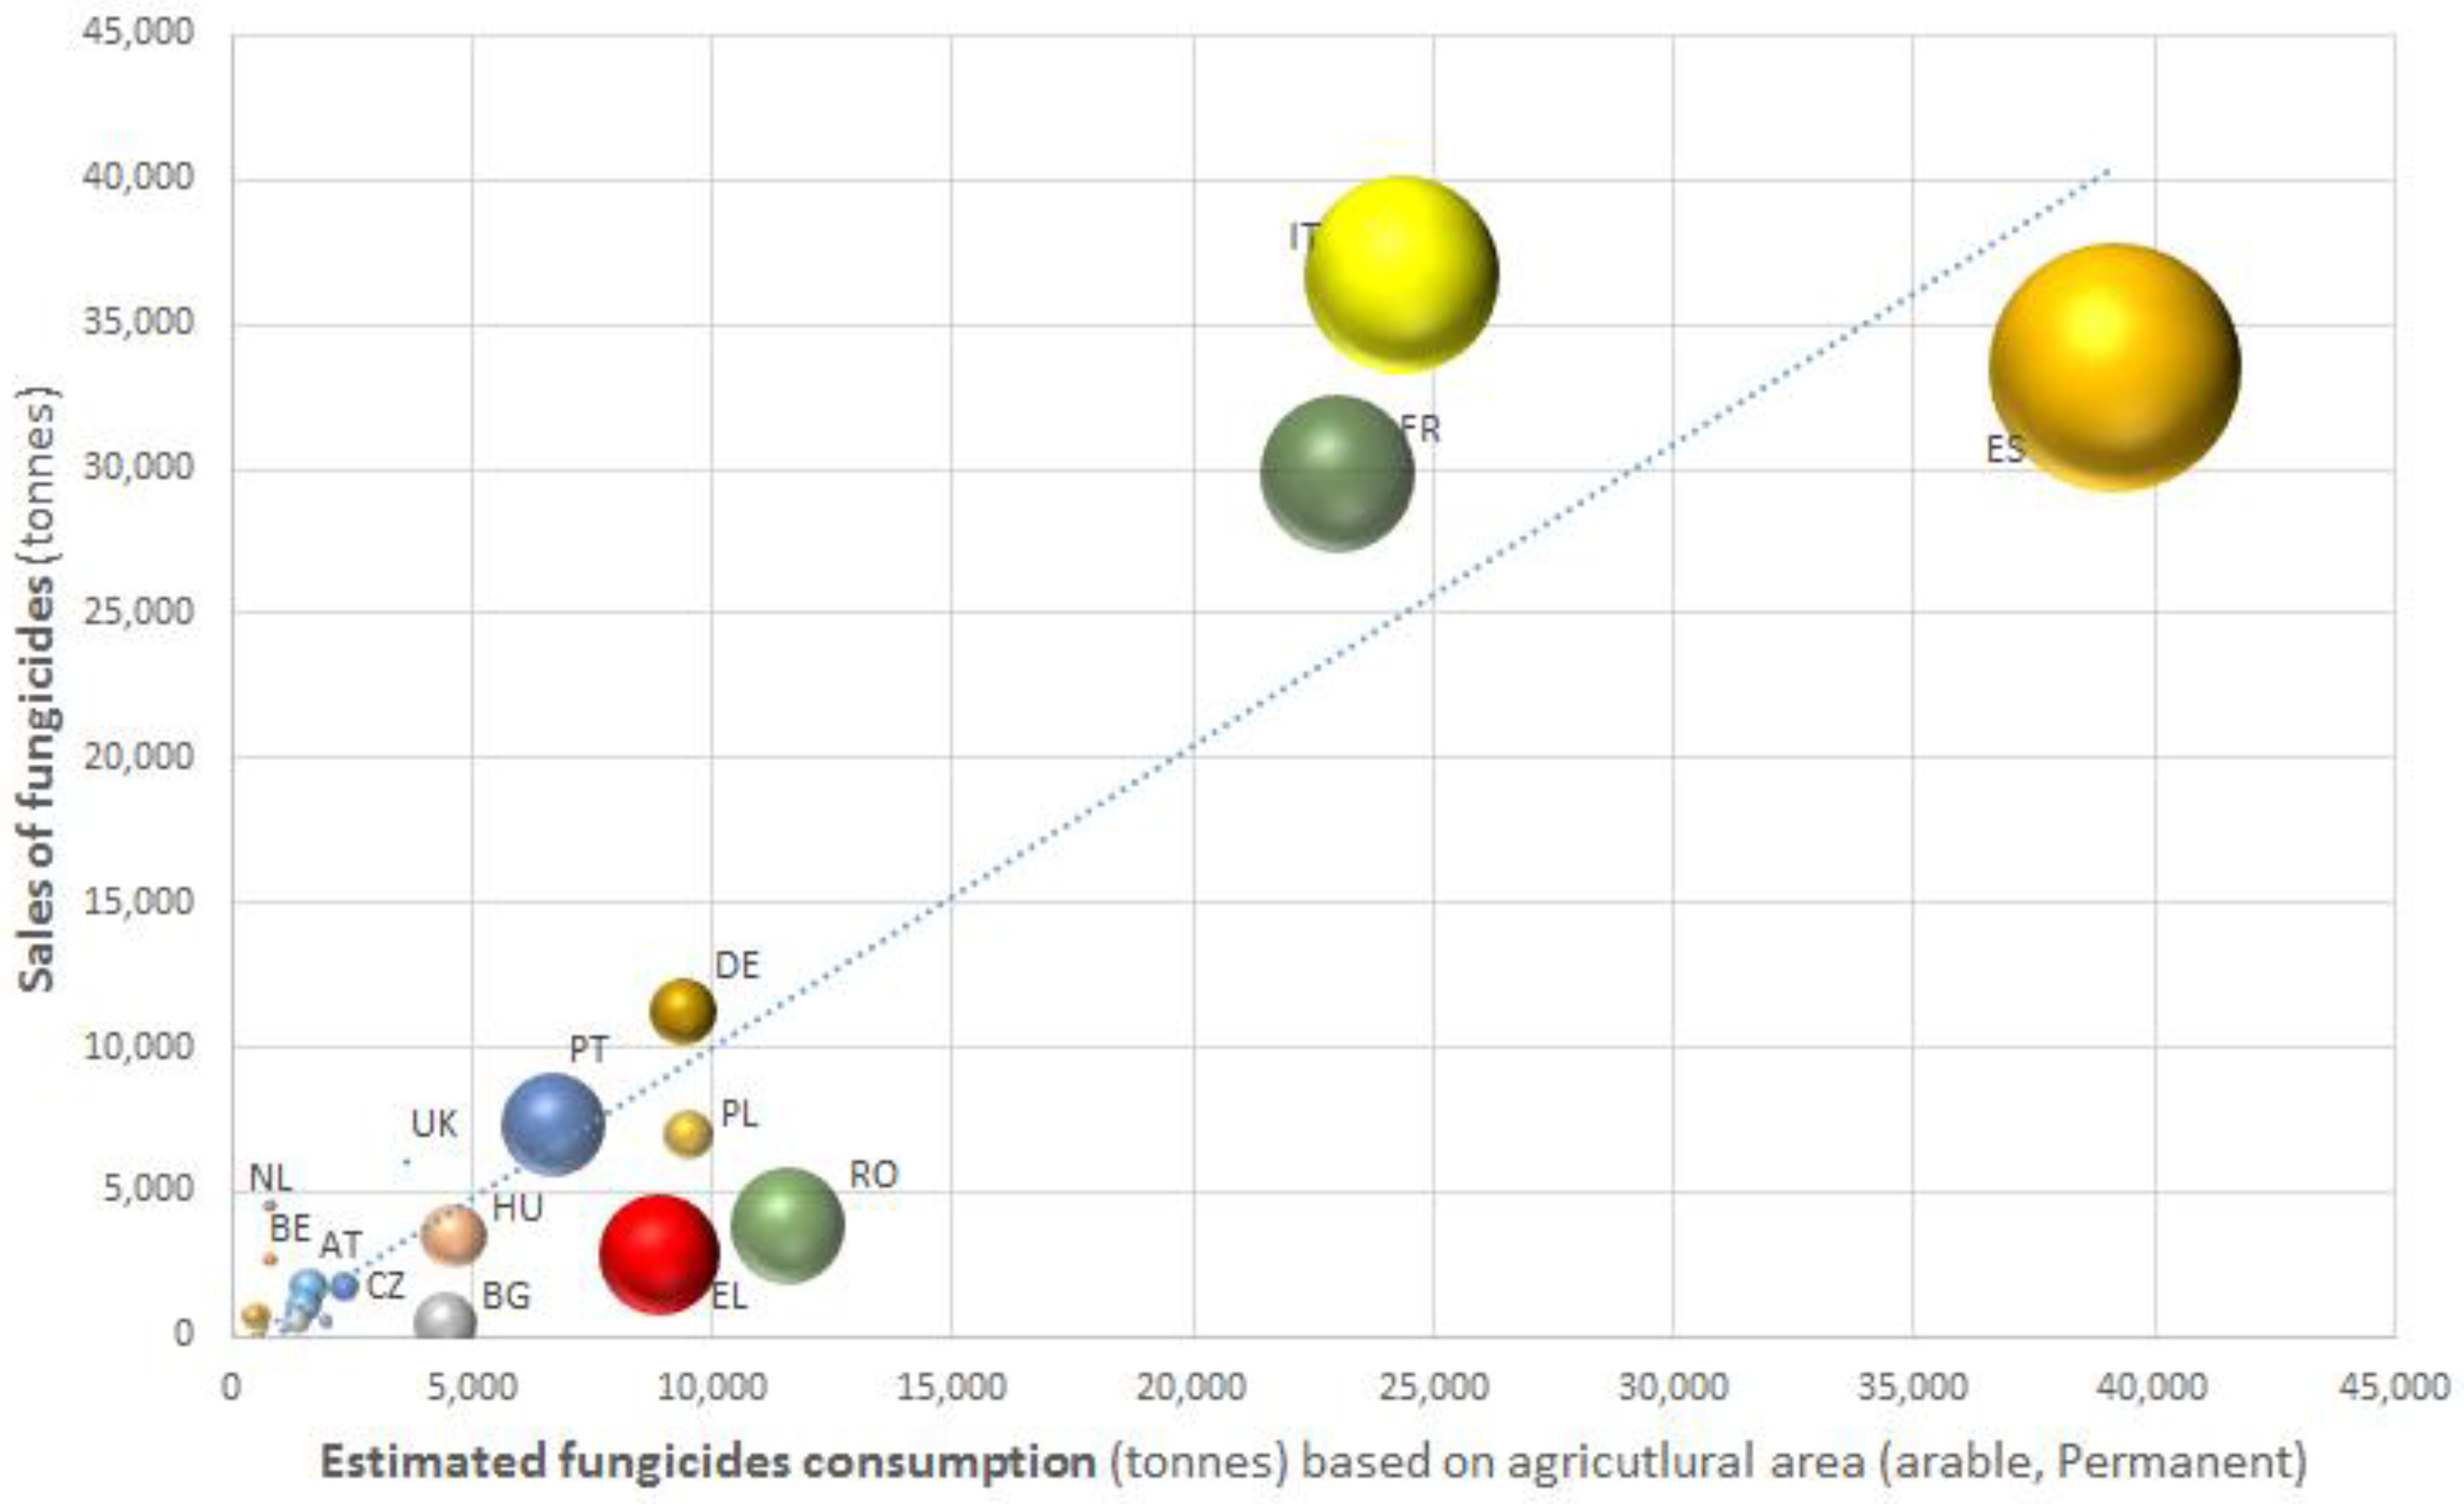
2.3. Modeling Copper Use in Relation to Fungicides Sales

The EUROSTAT agri-environmental indicator “consumption of pesticides” contains data from EU Member States on the sales of “fungicides and bactericides” [19]. As information on actual applications are not readily available, the data for this indicator may be considered a proxy for copper use in these countries. We estimated the mean consumption as tonnes per country based on the statistics available for 2011–2015 (mean value). According to the EU statistics, 63% of all fungicides in the EU (total 158,800 tonnes) are sold in three countries (Italy, France and Spain), each of which consumes approximately 30,000–37,000 tonnes of fungicides per year.
Based on CORINE land cover data for 2012 [20], we estimated the number of hectares under each different land cover in all Member States. The permanent crop cover (i.e. vineyards, olive groves and fruit trees) was around 10.3 million hectares, which corresponds to 6.4% of the total agricultural land of the EU. We developed a model to predict the average fungicide consumption per hectare at EU level in both permanent crops and arable lands. The model consumption rate is “forced” by the sales of fungicides and based on the following formula:
ESFi = PCi * PCC + ALi * ALC
For a given Member State i, the estimated sales of fungicides (ESFi) were obtained by adding up the fungicides applied to permanent crops (PCi: the hectares of permanent crops in Member State i; and PCC: the rate of permanent crops consumption) and the fungicides applied to arable land (ALi: the hectares of arable land in Member State i; and ALC: the rate of arable lands consumption). The model distinguishes between the consumption of fungicides in permanent crops and that in arable lands. The sum of estimated sales of fungicides in the EU should be close to the mean consumption of fungicides available from Eurostat statistics (approximately 158,800 tonnes).

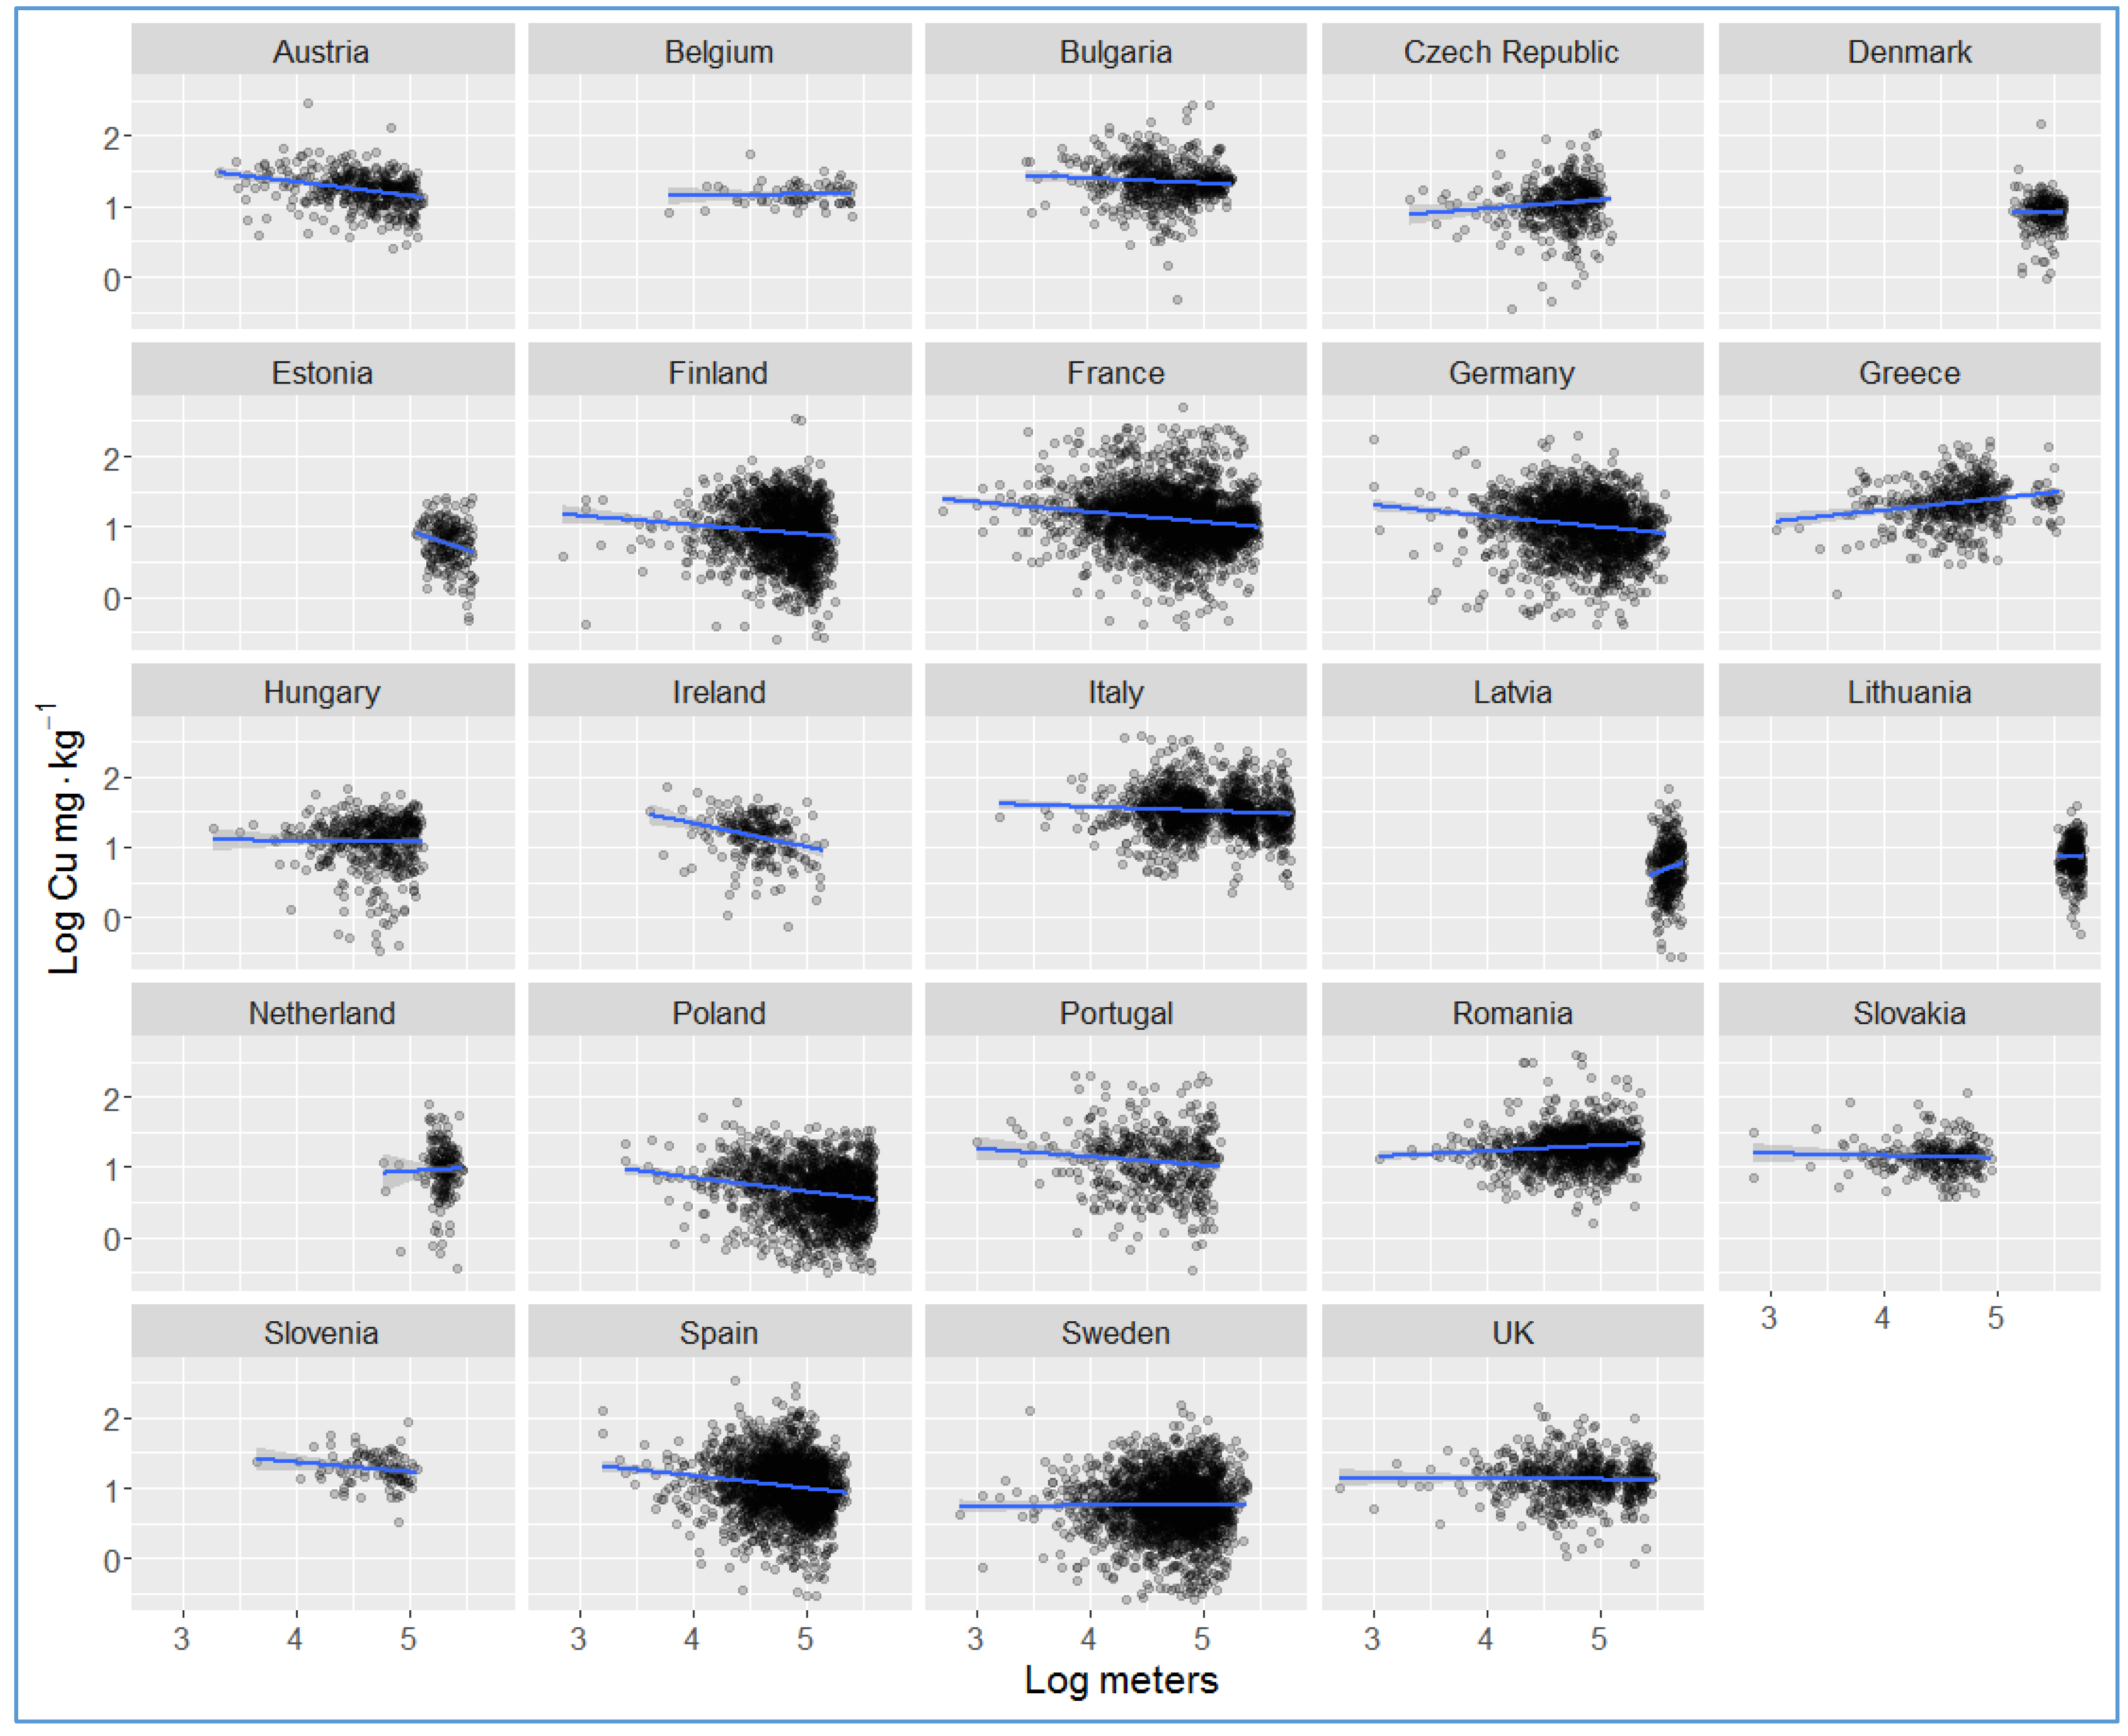
2.4. Modeling the Copper Concentration in Relation to Distance from Mines

The possible influence of mining activities on topsoil copper levels was investigated using the mines database taken from the Minerals4EU platform [21] (http://minerals4eu.brgm-rec.fr/minerals4EU/). The database includes 1080 identified copper mines; of these, 217 have available data on past production and activity status. The regression model fits the copper concentration in relation to distance from the copper mines in European Union.

3. Results

The Section 3.1 provides the main descriptive statistics on copper from the LUCAS Topsoil database. Then, the Section 3.2 describes the geographical distribution of copper by administrative unit. The copper distribution in forests and grasslands is described briefly, followed by a detailed analysis of croplands, with a focus on permanent crops. The copper concentration in vineyards is of great concern because of the elevated values here compared with other croplands.

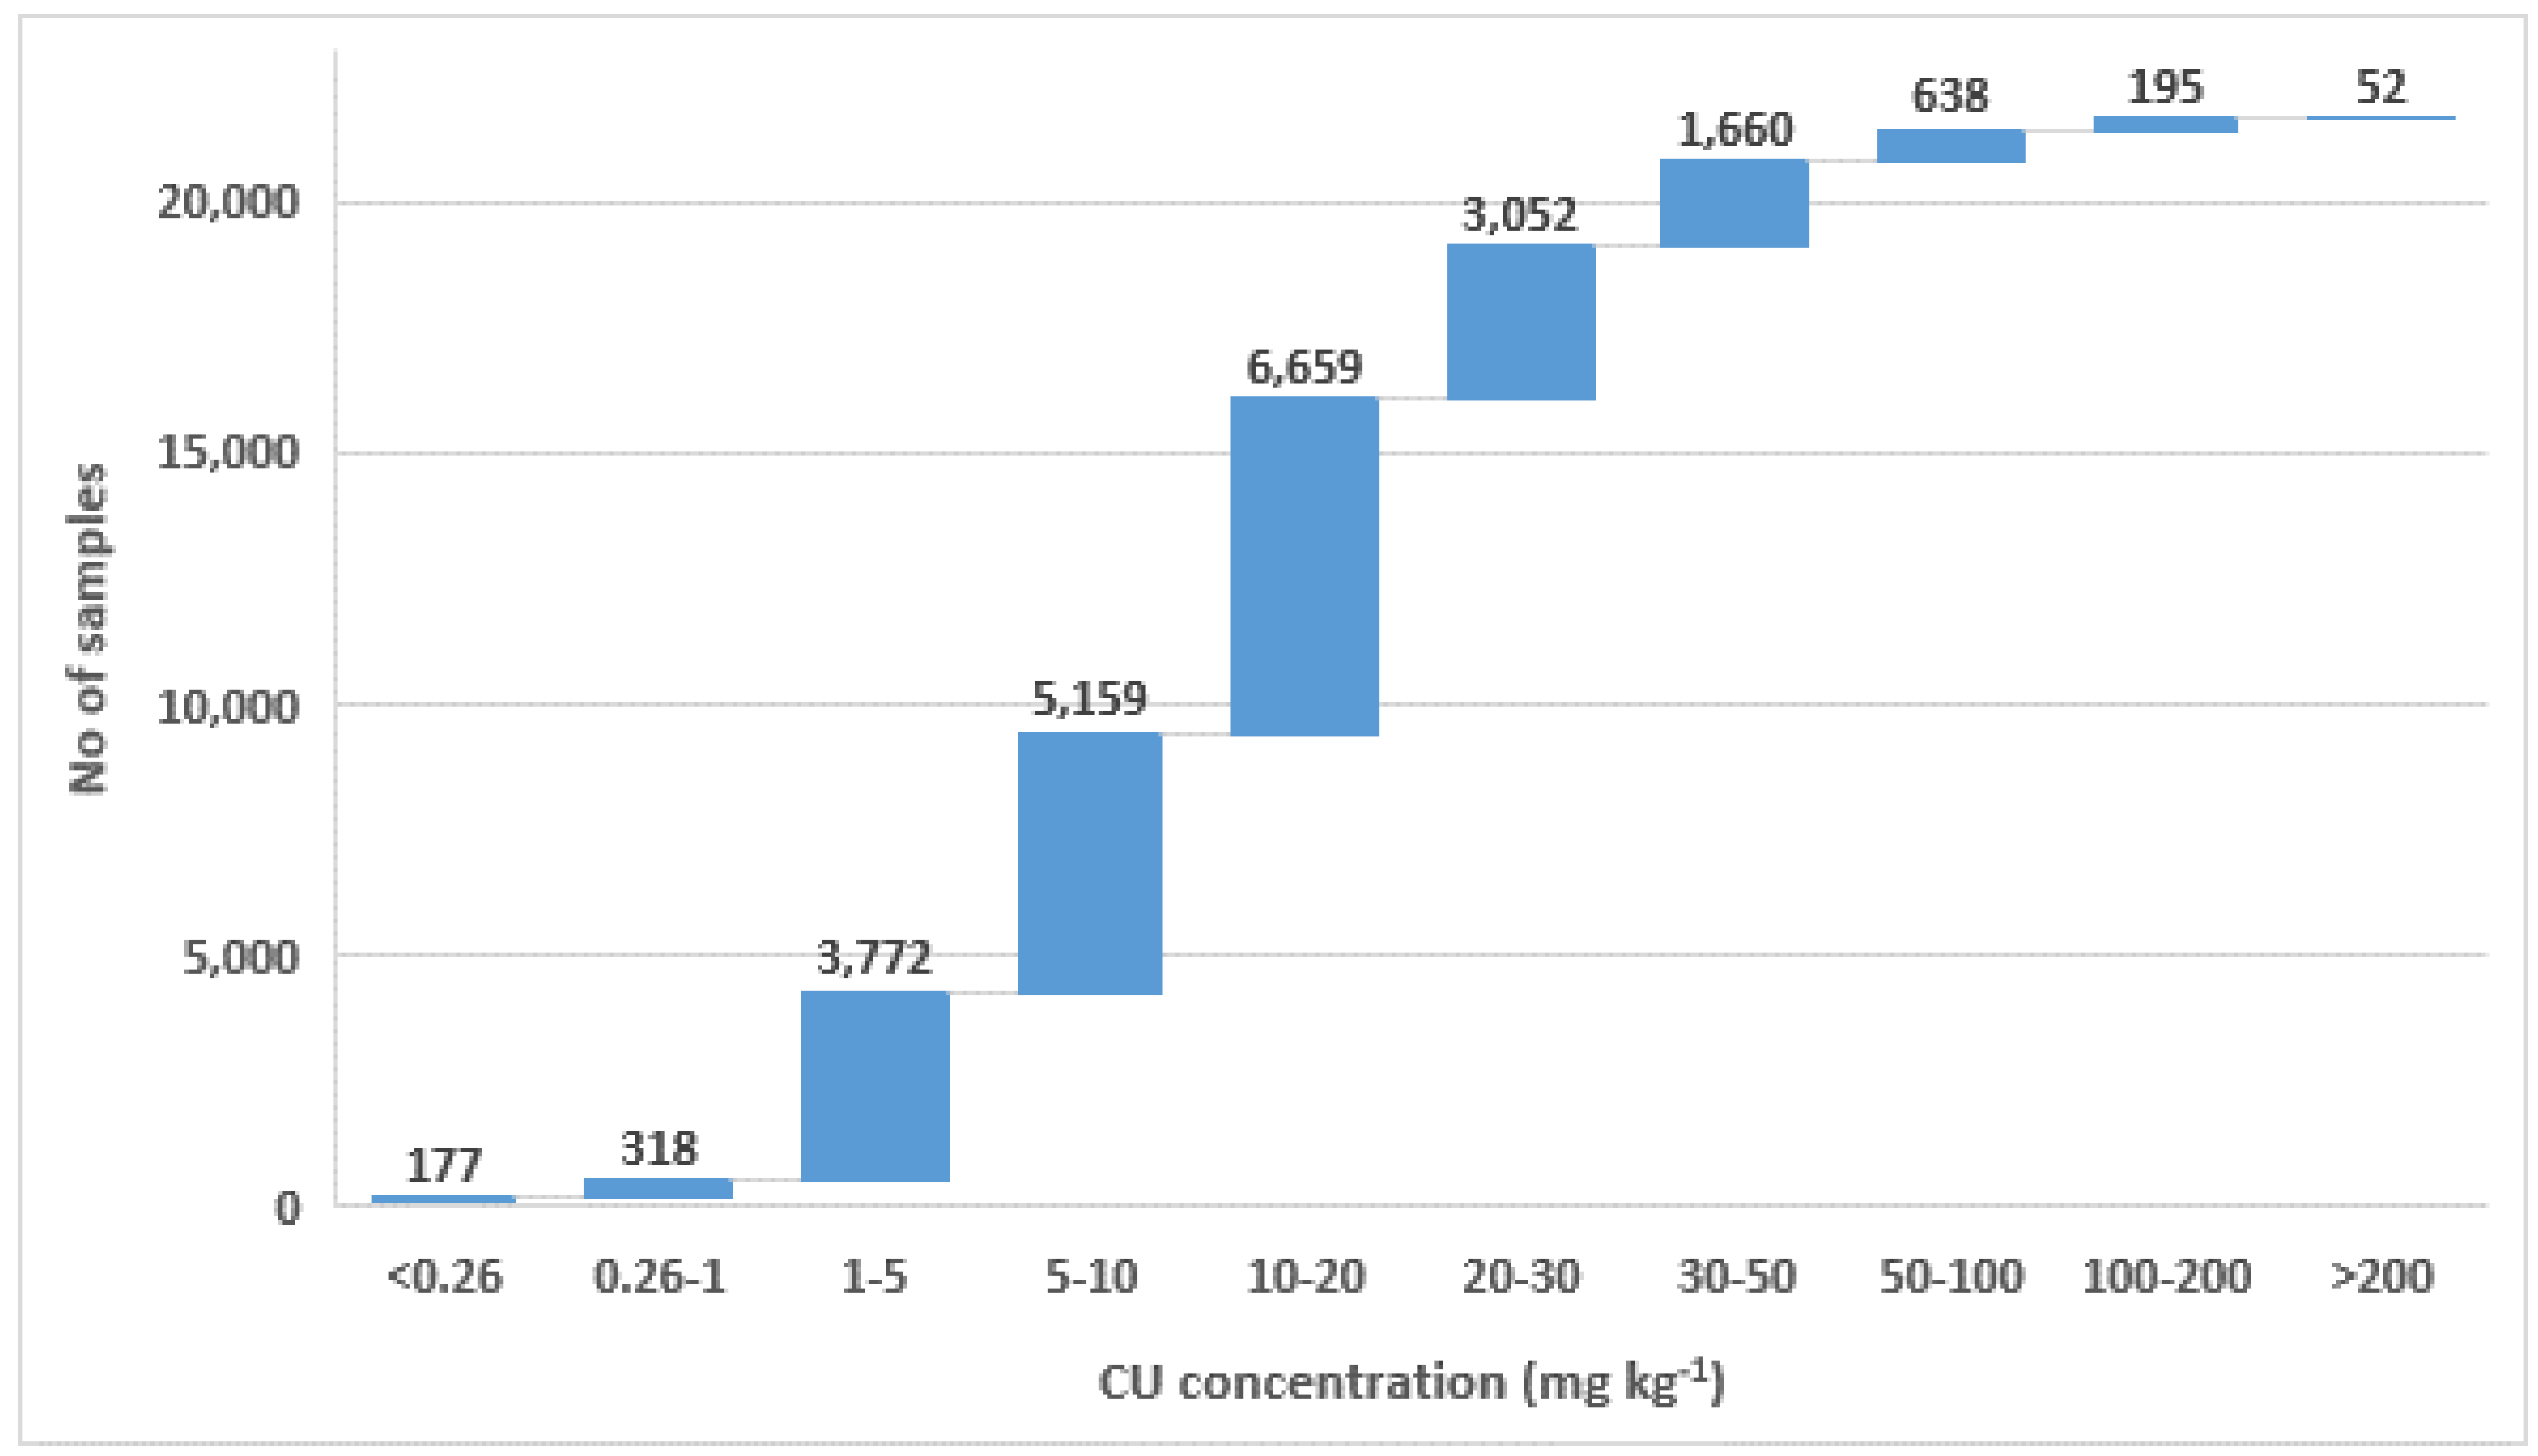
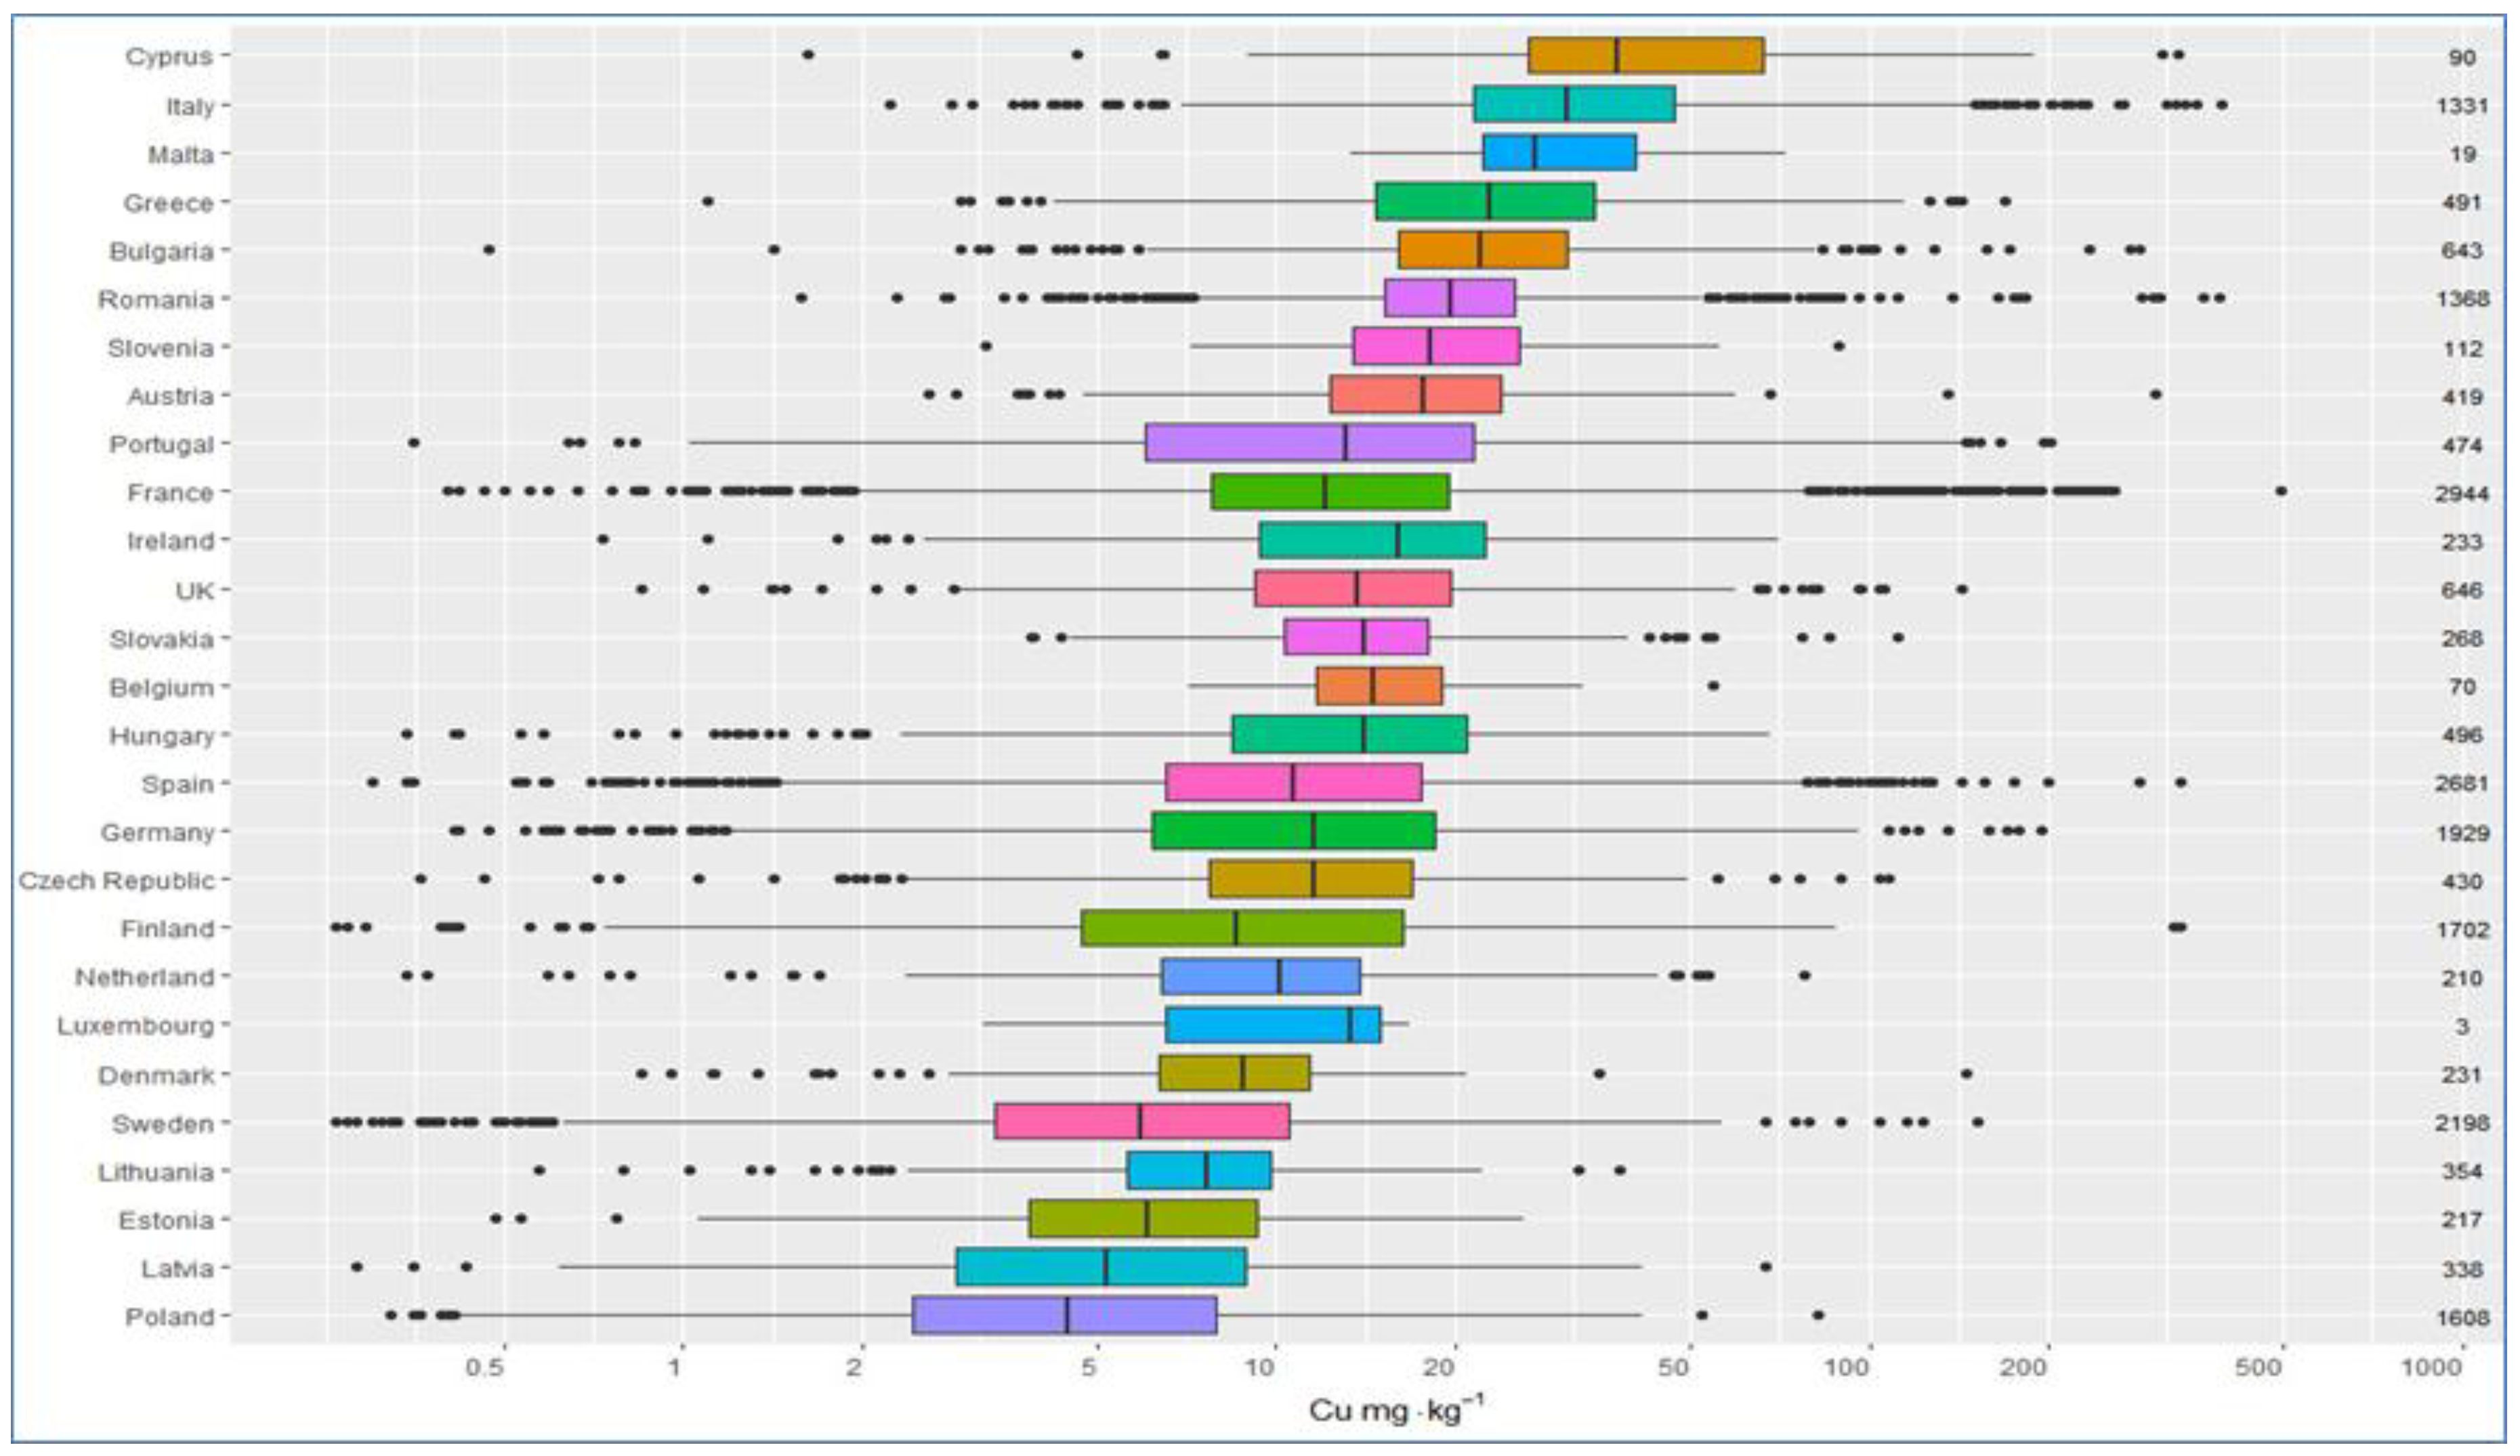
3.1. Descriptive Statistics

The mean copper concentration from the LUCAS Topsoil database is 16.86 mg kg−1 and the 50th percentile is 11.57 mg kg−1, with a positive skewness. Almost 19% of the total samples have a copper concentration of less than 5 mg kg−1, and 44% of samples have a concentration of less than 10 mg kg−1 (Figure 2). The majority of samples (55%) fall in the range 5–20 mg kg−1. Finally, three quarters of the samples have a Cu concentration of less than 20 mg kg−1. Considering that the copper threshold at which soil is considered to be at risk for human health is 100 mg kg−1 [8,9], only 1.1% of the samples should be further assessed as being at risk.

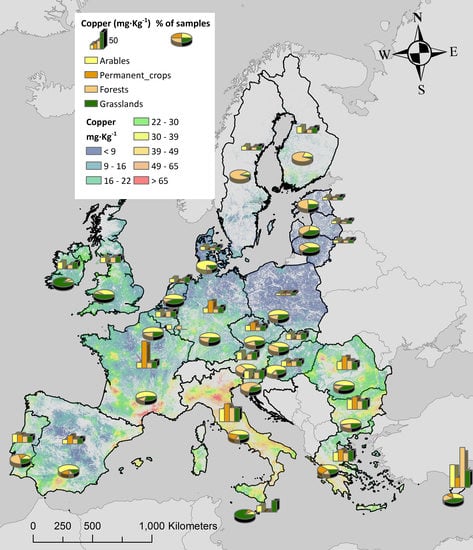
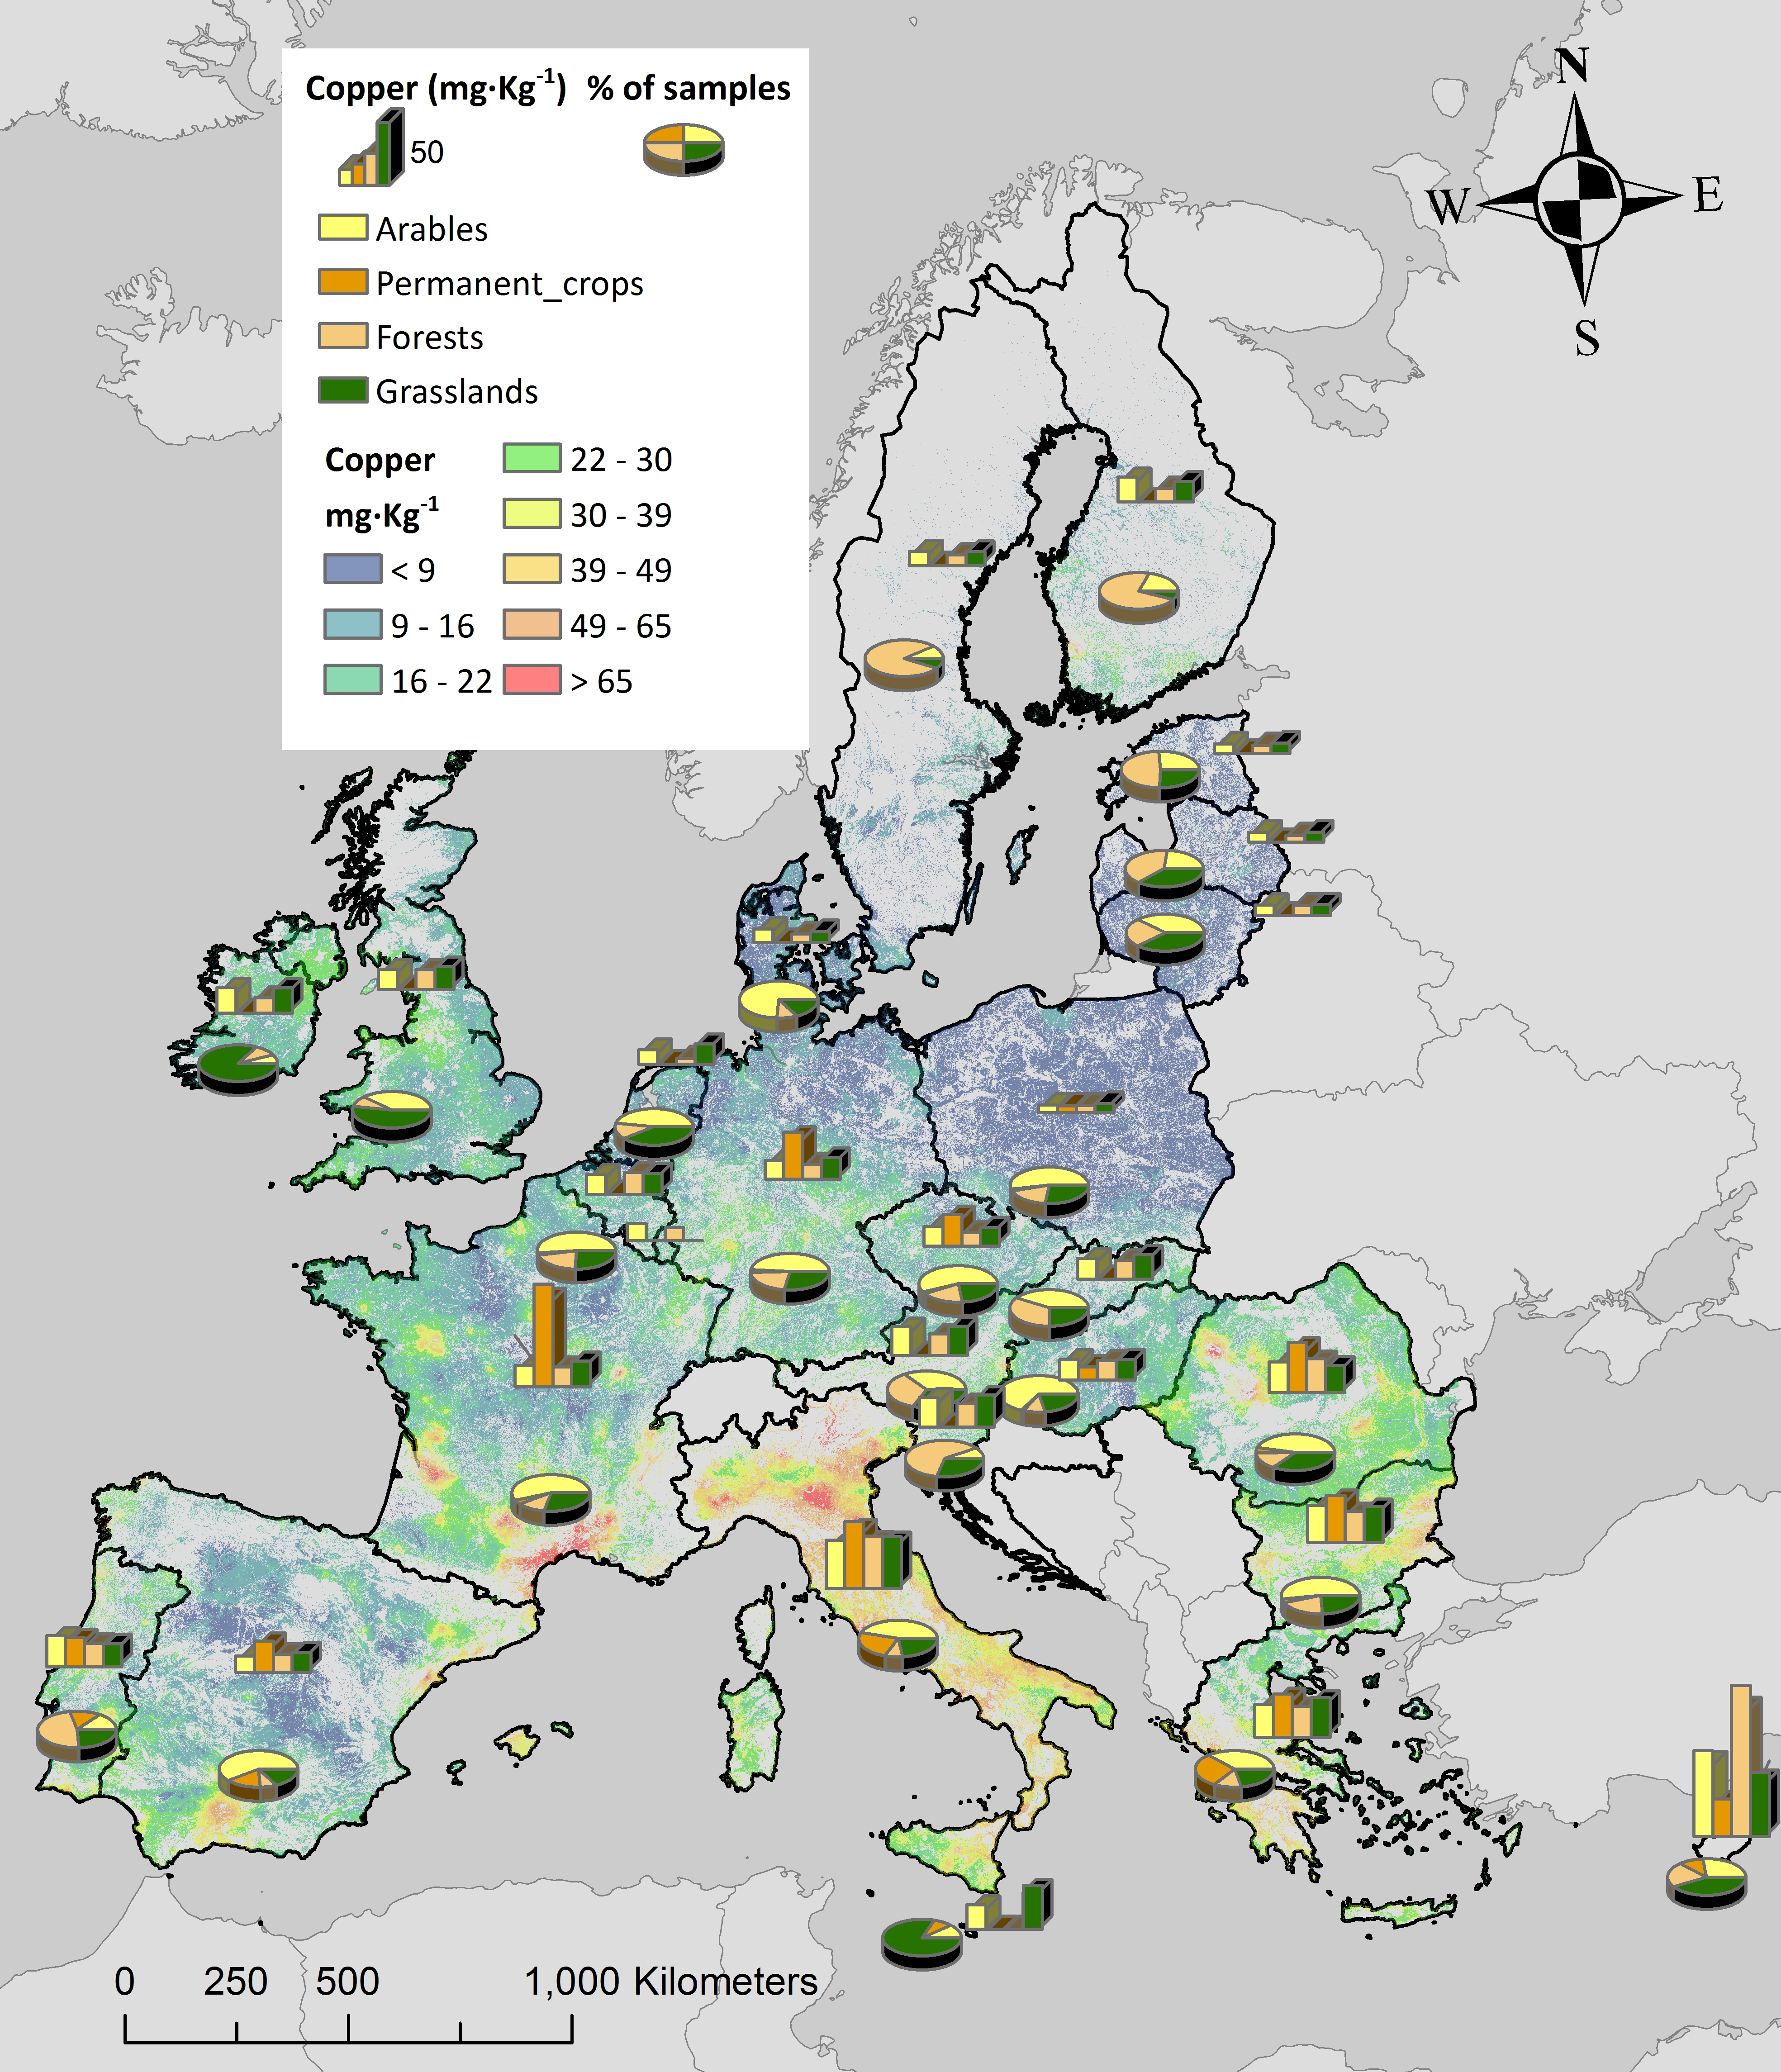
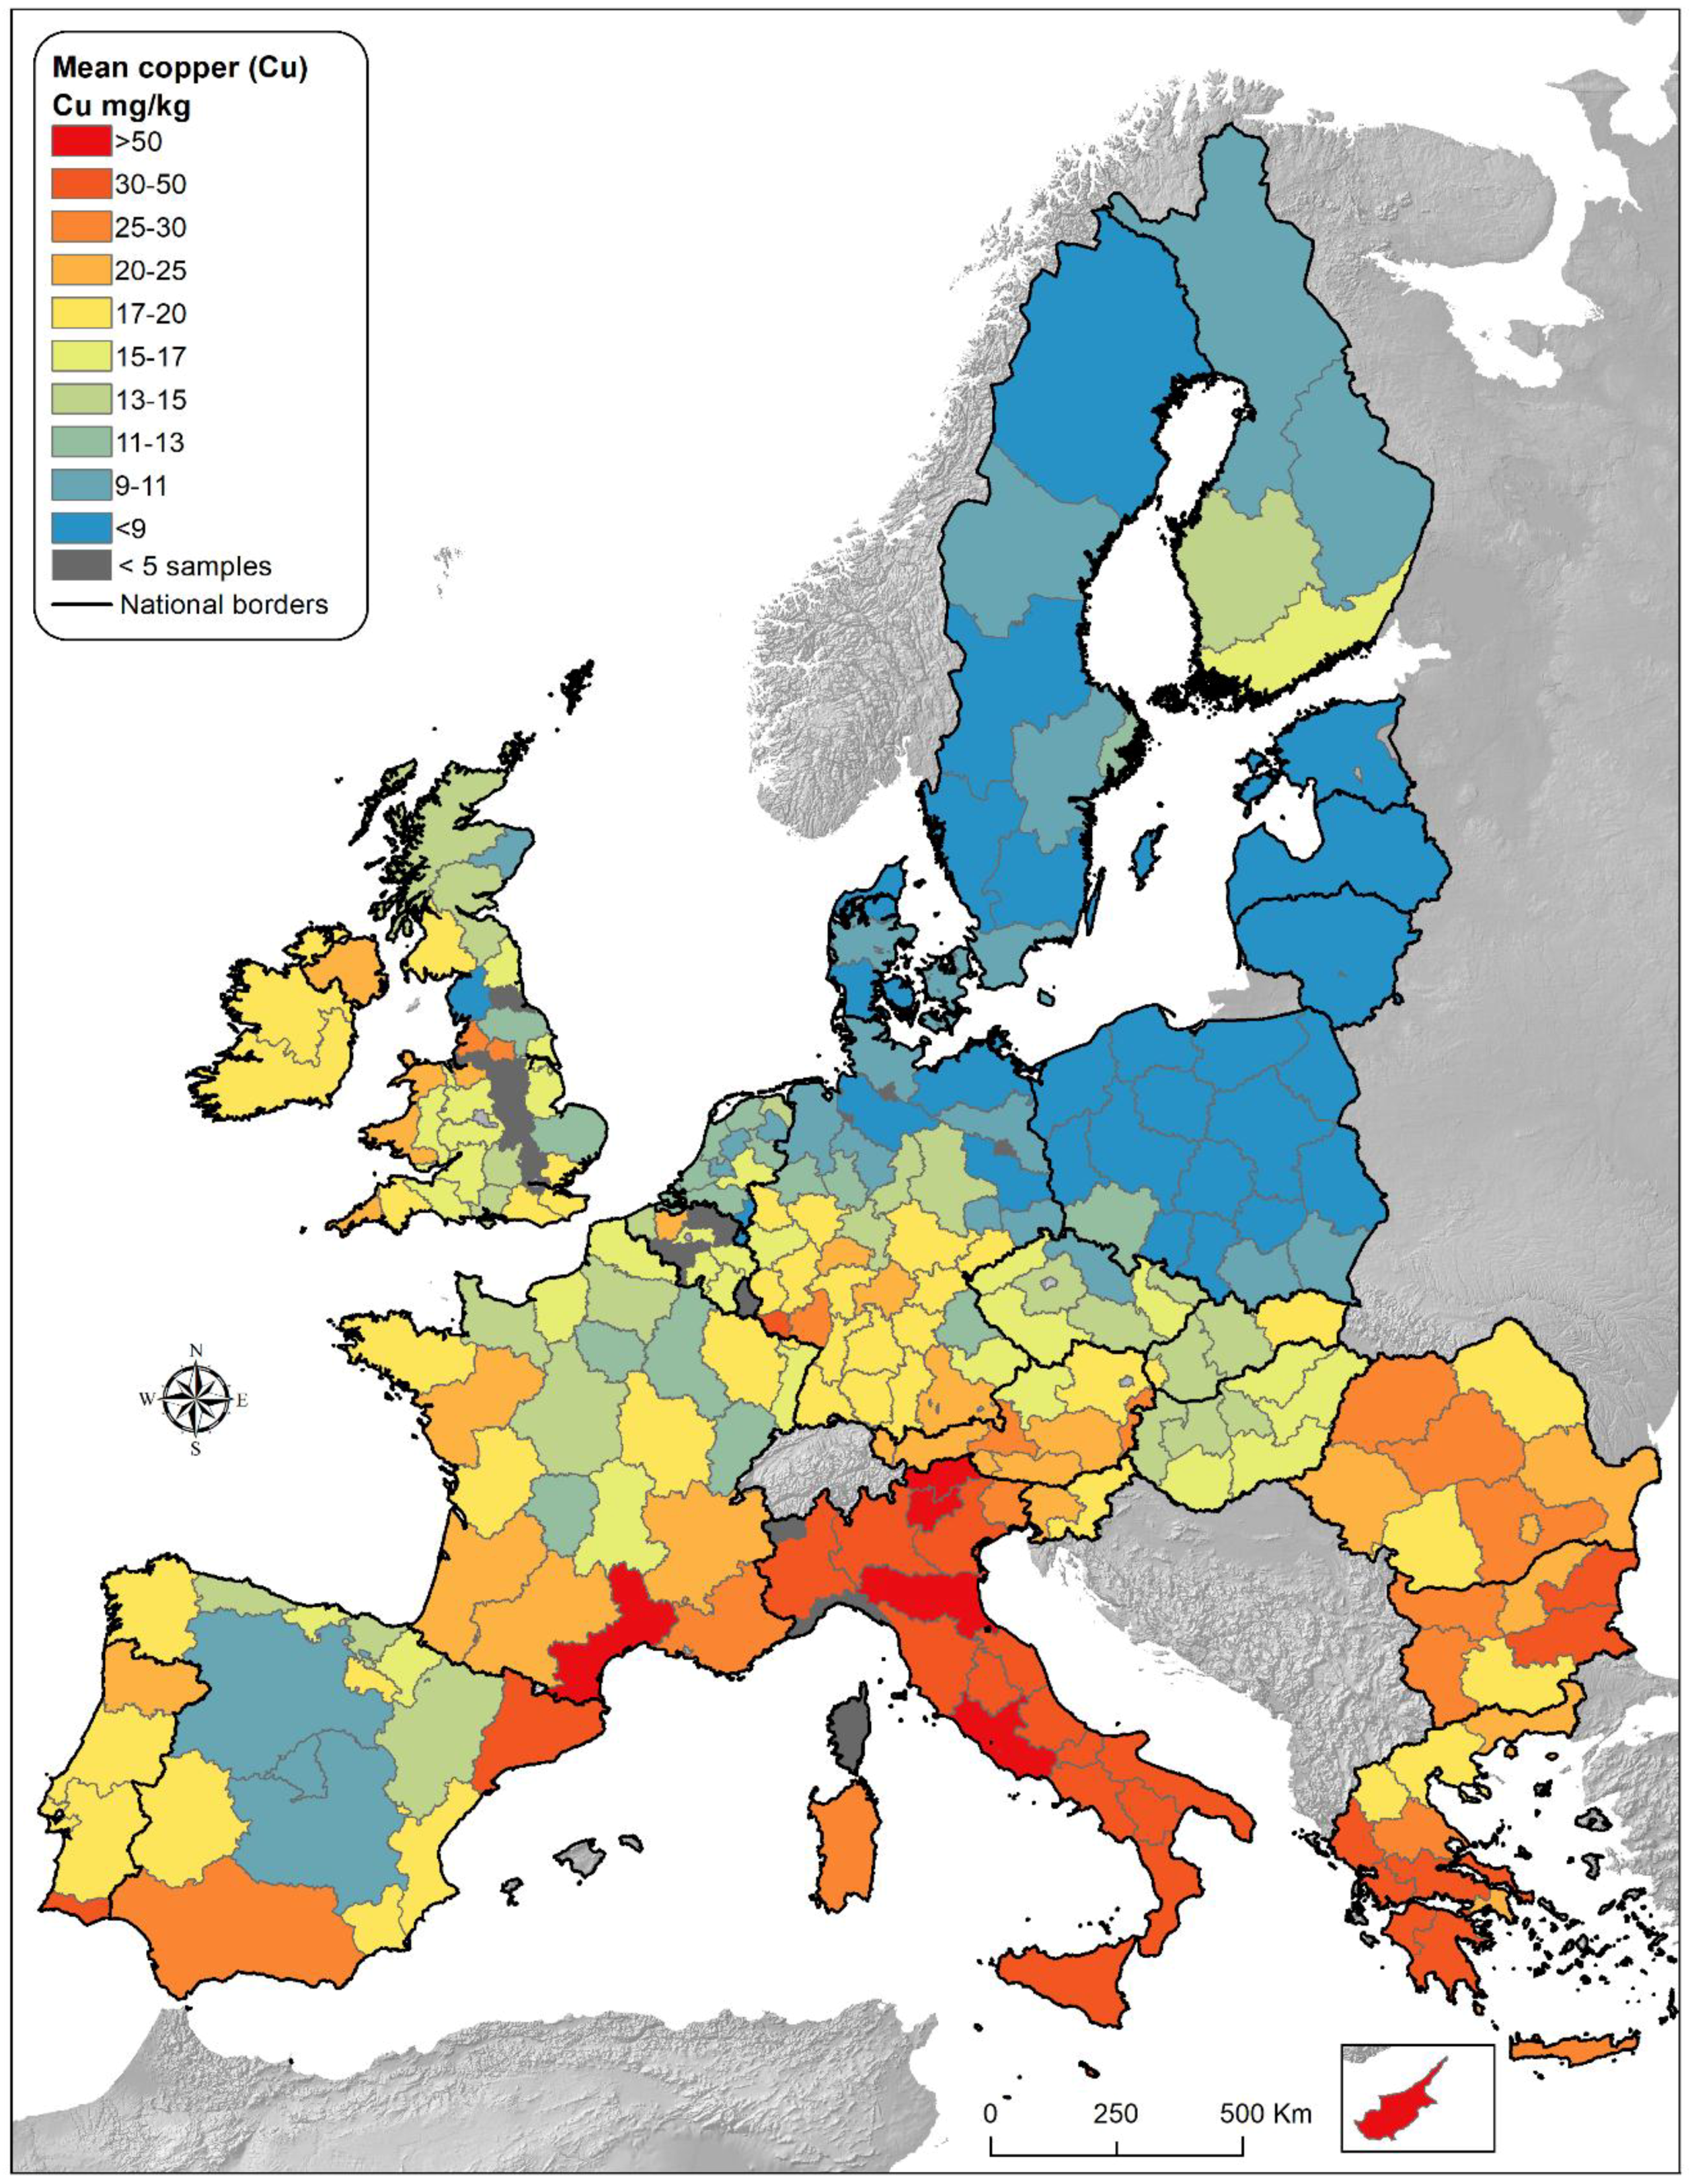
3.2. Overview of Geographical Distribution of Copper by Administrative Unit

At country level, Cyprus is estimated to have the highest mean copper concentration in topsoil (53.41 mg kg−1), followed by Italy (41.22 mg kg−1), Malta (33.11 mg kg−1), Greece (27.97 mg kg−1), Bulgaria (27.71 mg kg−1) and Romania (23.38 mg kg−1). The lowest mean values are found in the Baltic states, Poland, Sweden and Denmark (all less than 10 mg kg−1). In all countries, the median values are lower than the mean values, as the distribution is positively-skewed due to many low Cu values and few outliers.
As for the mean, the highest median Cu concentration is found in Cyprus (37.5 mg kg−1), followed by Italy (30.86 mg kg−1), Malta (27.43 mg kg−1), Greece (22.91 mg kg−1) and Bulgaria (22.15 mg kg−1). The lowest median Cu concentration is found in Poland (4.36 mg kg−1), followed by Latvia (4.95 mg kg−1), Sweden (5.76 mg kg–1), Estonia (5.95 mg kg–1), Lithuania (7.62 mg kg–1), Finland (8.55 mg kg−1) and Denmark (8.79 mg kg–1) (Figure 3).
High Cu concentration in Cyprus was also confirmed by Zissimos et al. [22] and is closely related to mining activities. In France, the median Cu concentration (12.11 mg kg−1) is much lower than the mean (19.23 mg kg−1) because there are few outliers (Figure 3). Similarly, Portugal has a wide dispersion of values with high variability. Some countries have similar mean and median values because there are no outliers: Ireland (mean 17.49 mg kg−1, median 16.11 mg kg−1), Belgium (mean 15.9 mg kg−1, median 14.62 mg kg−1) and Hungary (mean 15.39 mg kg−1, median 14.12 mg kg−1).
In Figure 3, the horizontal line indicates values 1.5 times the IQR. According to this interpretation, the highest middle quartile concentrations are in Romania, Slovakia, Belgium and the countries with the lowest median values (Figure 3).
A simple geographic distribution of Cu concentration can be assessed using the mean value for each NUTS2 region (Figure 4). For convenience, the term “region” is used to describe this level of geography. For 33 NUTS2 regions (mainly metropolitan cities), we had no soil samples, while for 19 other regions we had fewer than five LUCAS samples because of reduced sampling coverage (they are denoted as “few samples” on the legend of Figure 4). For 63 regions, we had >100 available samples; for 69 regions, we had 50–100 samples; and, for the remaining 101 regions, we had 5–50 samples.
According to this regional analysis, the mean Cu concentration in topsoil is higher than 50 mg kg−1 in Trentino-Alto Adige, Emilia-Romagna and Lazio in Italy (and Veneto has a mean value of 49 mg kg−1); in the Languedoc-Roussillon region in France; and in Cyprus (the locations mentioned are reported in Supplement Figure S1). In the other Italian regions, Malta, west Greece, east Bulgaria, Catalonia (Spain) and Algarve (Portugal), the mean Cu concentration is between 30 and 50 mg kg−1. By contrast, the majority of regions in Northern and Eastern Europe have Cu concentrations below 20 mg kg−1 (the locations mentioned are reported in Supplement Figure S1).

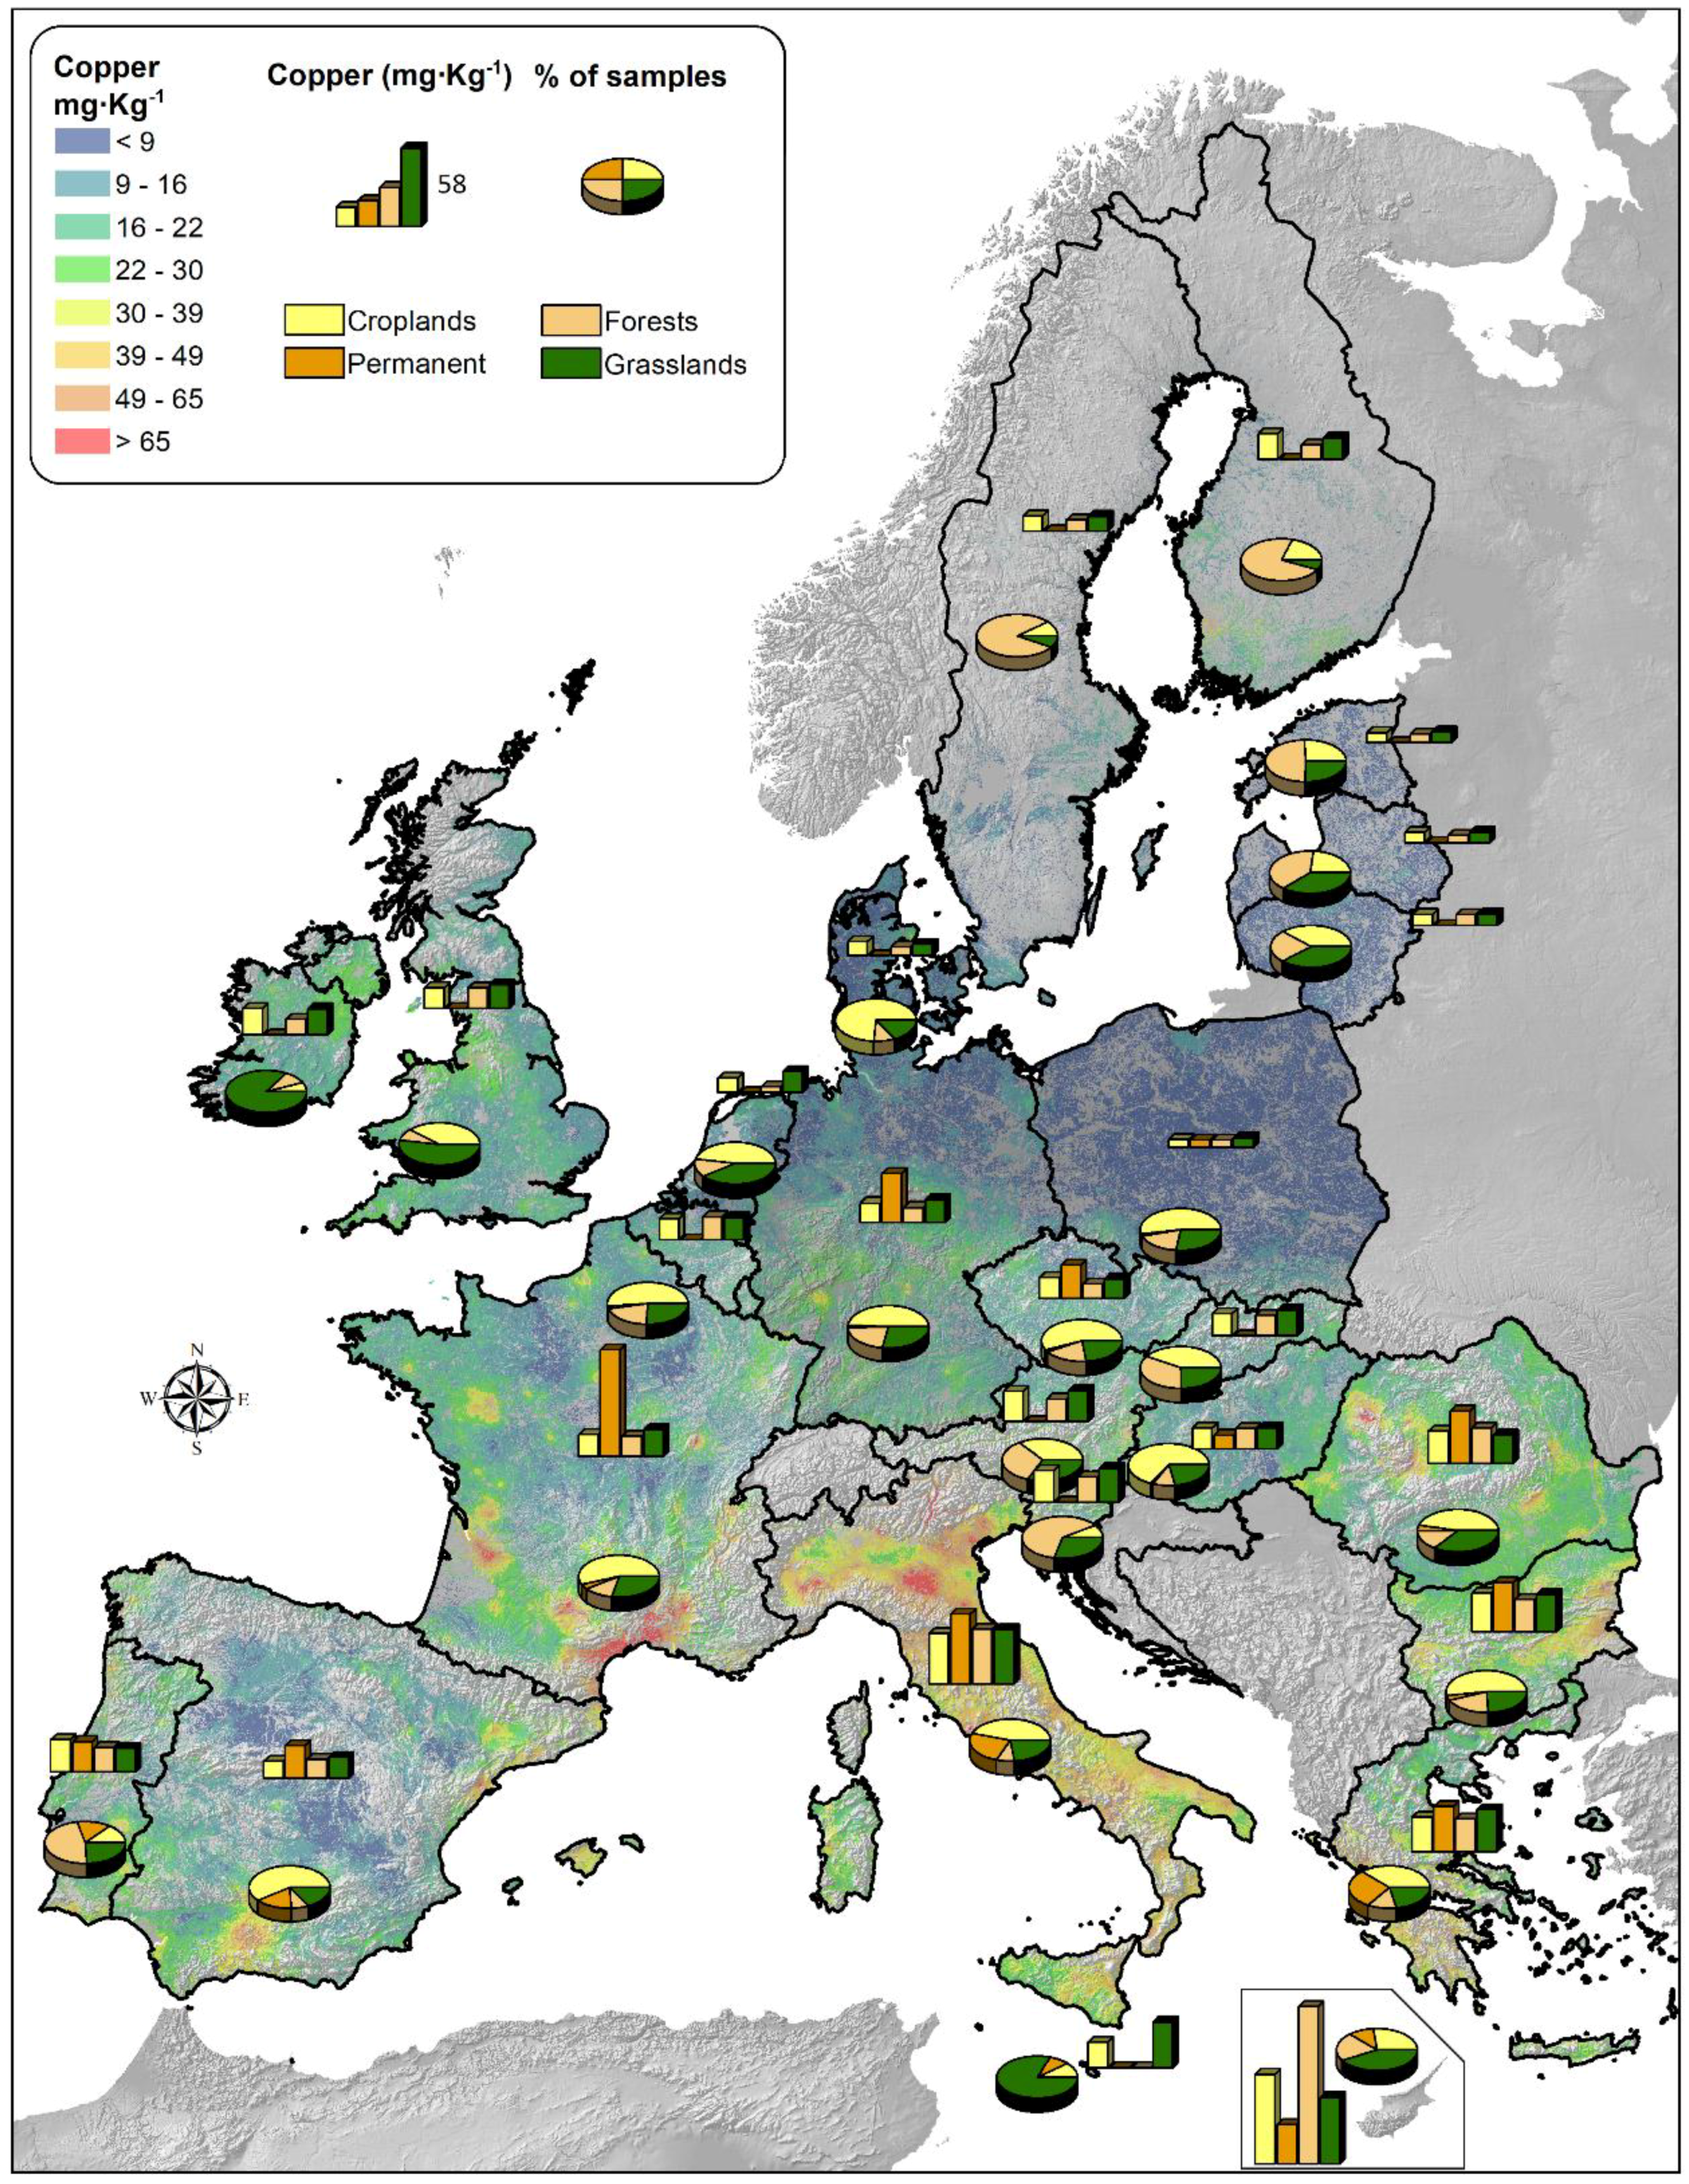
3.3. Copper Distribution in Forests and Grasslands

For the EU, the mean Cu concentration in grasslands is 18.23 mg kg−1, while in forests it is significantly lower (11.98 mg kg−1). In comparison by countries (Figure 5), the mean Cu concentration in croplands or permanent crops is higher than forests or grasslands with the exception of Cyprus and Malta. Broadleaf forests (e.g., acacia, beech, oak and eucalyptus) have almost double the mean Cu concentration of coniferous forests (e.g., spruce, hemlock, pine and fir): 17.66 mg kg−1 and 9.37 mg kg−1, respectively. Compared with a coniferous forest, a broadleaf wood has a very thin forest floor, so the deposited Cu tends to be retained mostly in the top mineral layer [23]. The highest mean Cu concentration in broadleaf forests is in Italy, with 42.65 mg kg−1, followed by Romania with 26.72 mg kg−1 and Bulgaria with 24.17 mg kg−1. In Sweden, Germany, Finland and Spain, the mean concentration is much lower (<14 mg kg−1).
The mean Cu concentration is very low in coniferous forests in Finland, Sweden, Poland and Germany (<10.5 mg kg−1). It is notable that all seven soil samples from coniferous forests in Cyprus had a Cu concentration higher than 50 mg kg−1 and the mean was 126 mg kg−1, which may be related to past mining activities [22].
Regarding grasslands, the highest mean Cu concentration in the EU is measured in Cyprus, at 48.74 mg kg−1, followed by 39.83 mg kg−1 in Italy, 33.66 mg kg−1 in Malta and 30.59 mg kg−1 in Greece (Figure 5). The grasslands of Romania, Bulgaria and Slovenia have copper concentrations in the range 20–30 mg kg−1, while those of France, Ireland and the United Kingdom have concentrations close to the European average (18 mg kg−1). The Baltic states, Denmark and Poland have very low mean Cu concentrations in both grasslands and forests (<10 mg kg−1) (Figure 5).

3.4. Copper Distribution in Croplands

The main aim of this study was to analyze copper distribution in the topsoil of croplands. Taking into account 9765 croplands samples (45% of the total), we mapped the mean Cu concentration at regional level, overlaying the presence of vineyards, olive groves and fruit trees (Figure 6).
The mean Cu concentration in croplands is higher than the overall mean in regions where samples were mainly taken from vineyards and olive groves (Figure 6). Comparing the overall concentration (Figure 4) with that of croplands (Figure 6), the Cu concentration is higher in the regions of Mediterranean countries with permanent crops (Italy, Greece, Spain, Portugal and France), together with a few regions in Romania, Bulgaria and Germany.
The soil data can be assigned to two main categories of croplands: (a) arable lands (annual crops), with 8676 soil samples (around 40% of the total); and (b) permanent crops, with 1084 soil samples (5% of the total). In samples from arable land, the mean concentration is 16.7 mg kg−1 and the median is 12.8 mg kg−1. In Cyprus, Italy, Bulgaria and Greece, the mean Cu concentration in arable lands is greater than 25 mg kg−1 (Figure 5).
Of all types of land use, permanent crops have the highest copper concentration, at 36.57 mg kg−1, with a median of 22.55 mg kg−1. Fruit trees have a relatively high mean concentration, at 27.32 mg kg−1, with 3.4% of the samples showing a Cu concentration above the threshold limit of 100 mg kg−1 [13]. In this category, pears have the highest concentration (37 mg kg−1), while cherries have the lowest (20 mg kg−1). In a study in Italy, the high concentration of copper in pears was linked to the frequent use of copper sprays for controlling plant diseases such as brown spot, the European canker and fire blight [24]. All other fruit trees (i.e. apples, walnuts, citrus fruit and other tree berries) show values close to the mean.
Olive trees are mainly grown in Mediterranean countries (e.g., Italy, Spain, Greece and Portugal); the mean Cu concentration in 421 soil samples from olive cultivation is 33.5 mg kg−1, with high variability between those four countries. Italy’s olive groves show a higher mean Cu concentration (41.18 mg kg−1) than those in Greece and Spain (approximately 31.5 mg kg−1). Olive groves in Portugal have a much lower mean Cu concentration (17.76 mg kg−1) than those in other Mediterranean countries.
At regional level, Catalonia (Spain), Lazio, Campania, Abruzzo and Calabria (all Italy) show mean Cu concentrations in olive groves higher than 50 mg kg−1. Overall, the 20 soil samples (4.8% of the total) that have a Cu concentration above the threshold are mainly found in Italy and Spain (the locations mentioned are reported in Supplementary Figure S2). Finally, some findings show regional differences in the same land cover within a single country. For example, olive groves in Peloponnesus (Greece) have a mean Cu concentration of 39.3 mg kg−1, compared with 24 mg kg−1 in Crete. In addition, olive groves in Castilla (Spain) have a much lower mean Cu (9.46 mg kg−1) than those in Andalusia (35.62 mg kg−1) and Catalonia (65.3 mg kg−1) (the locations mentioned are reported in Supplement Figure S2).

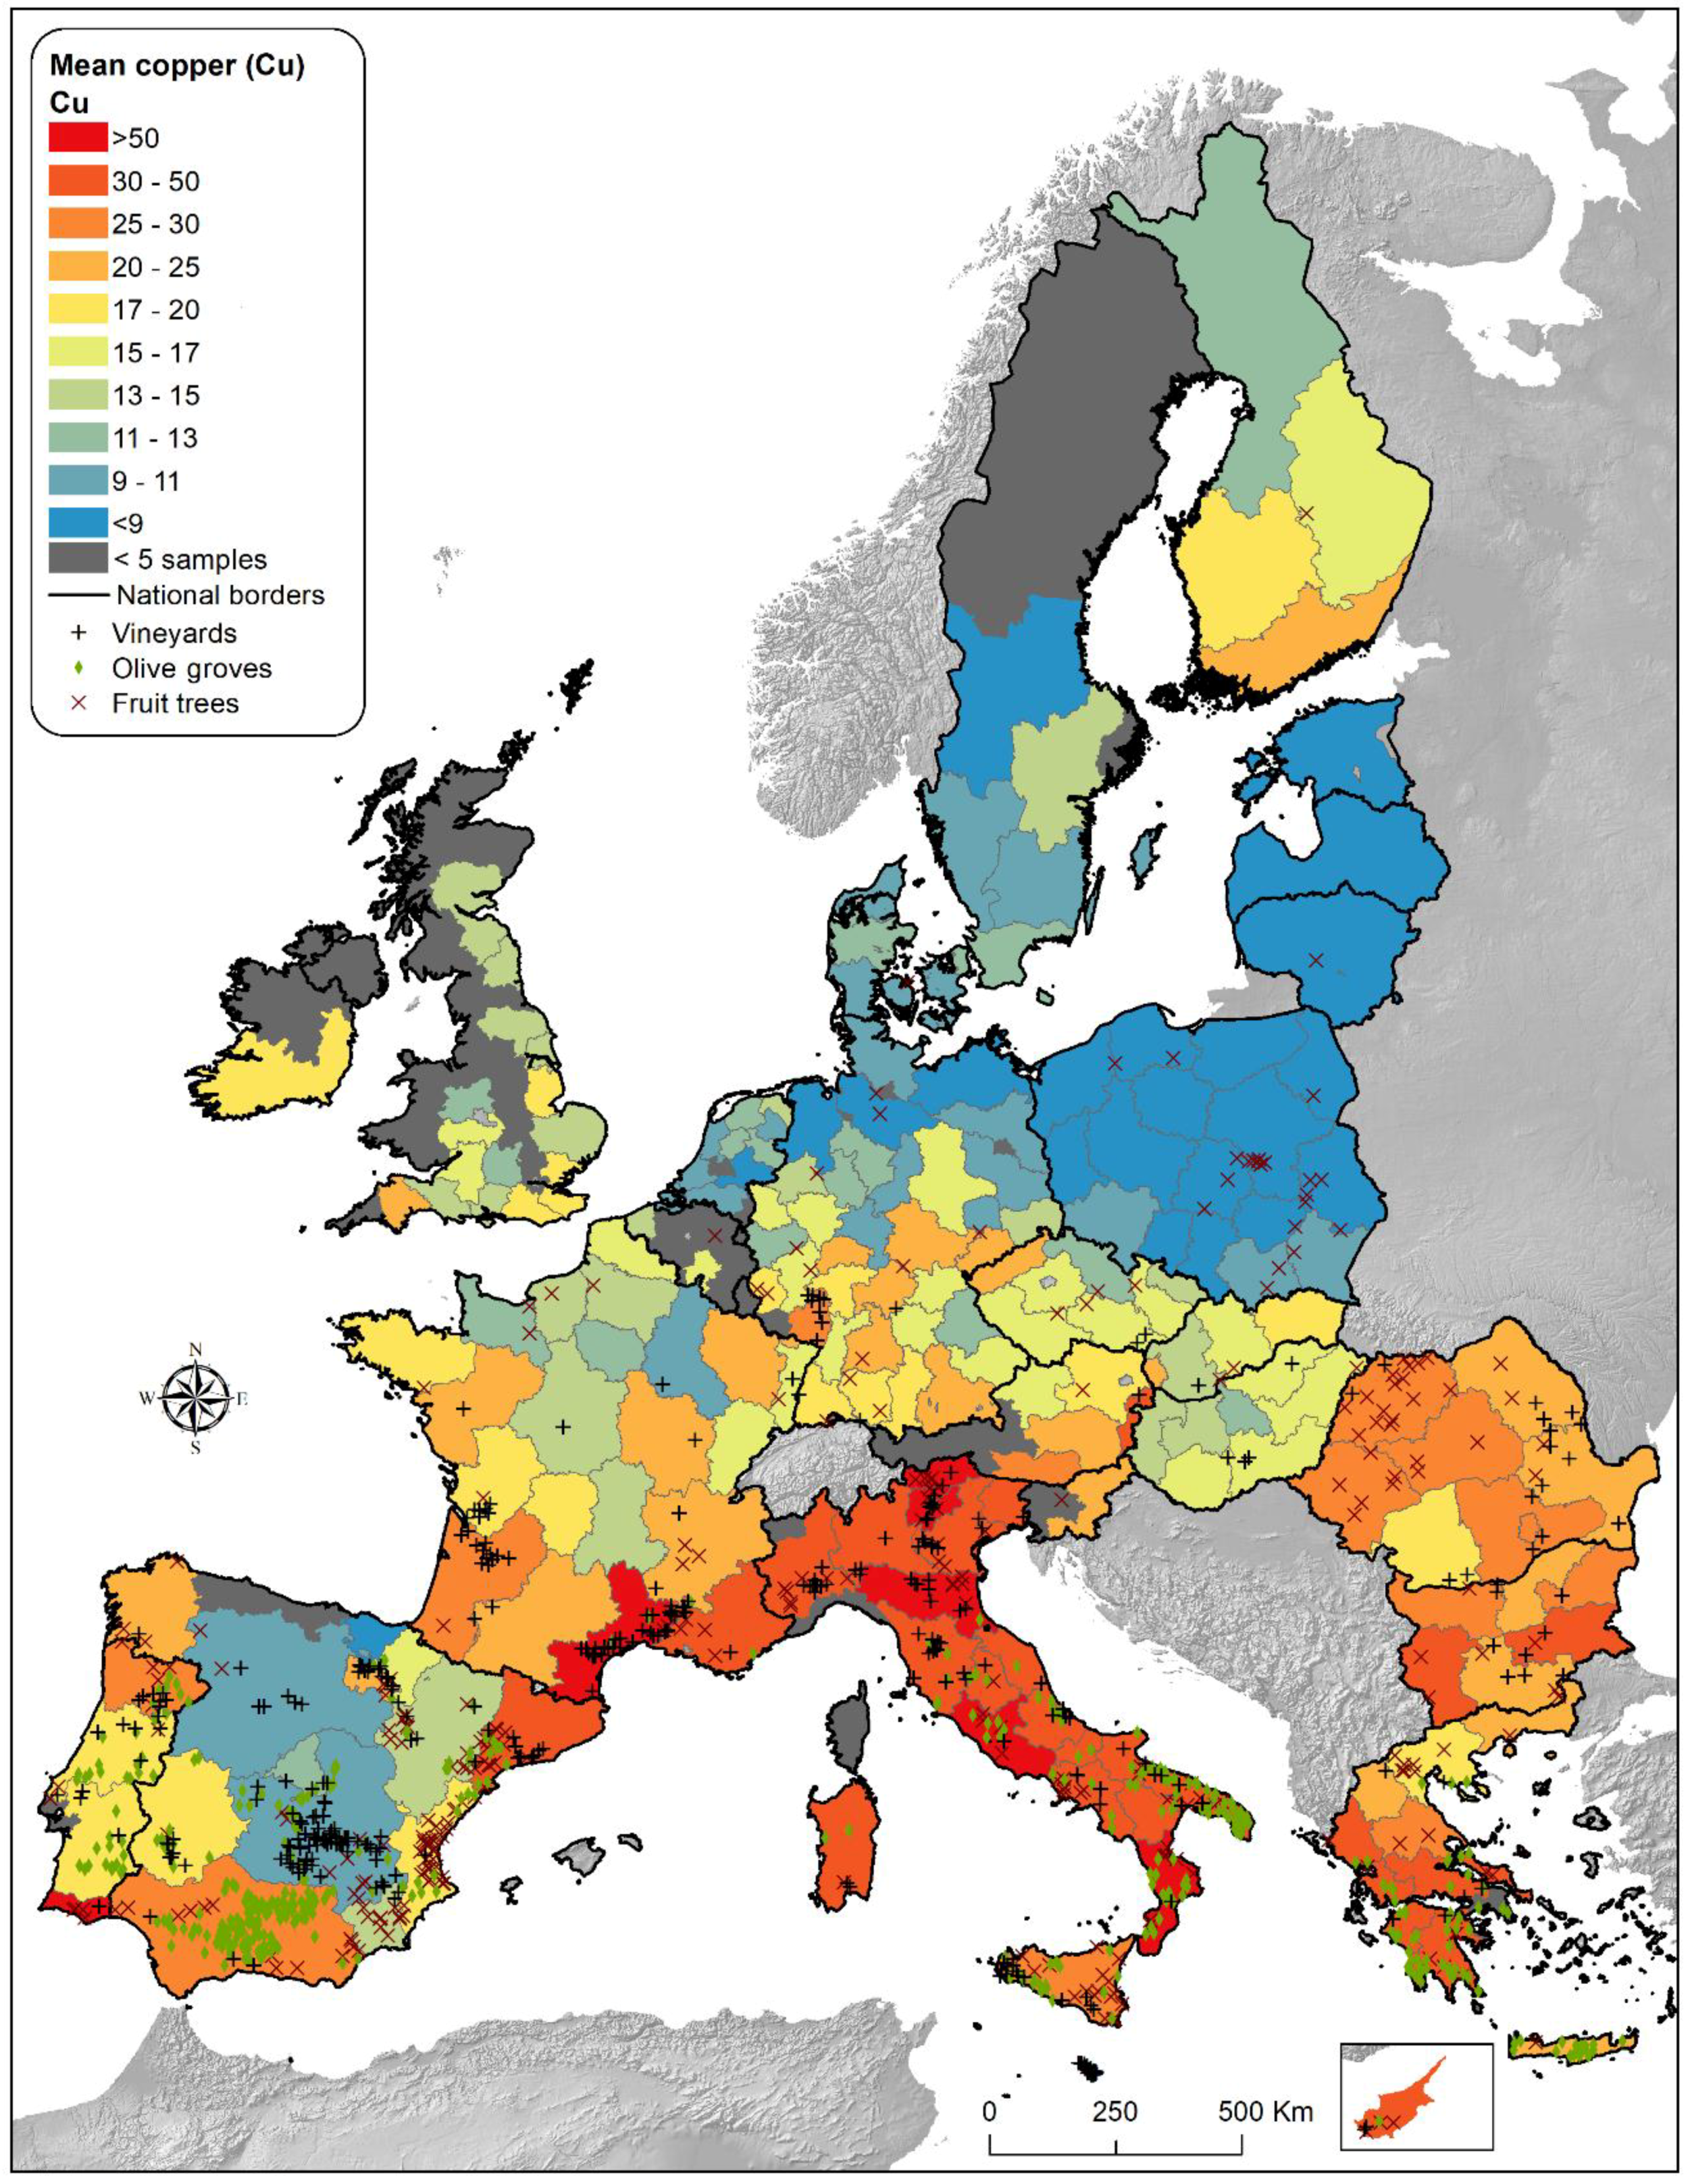
3.5. Analysis of Copper in Vineyards

There is a long tradition in Europe of using Cu-based fungicides in vineyards to better control vine downy mildew [25]. Another major reason for the extensive use of copper as a fungicide is its relatively low market cost [2].
In the LUCAS Topsoil database, 342 soil samples (1.6% of the total) were taken from vineyards (Figure 6). The detected mean Cu concentration in vineyards is the highest for all types of land cover in LUCAS. Vineyards have a mean Cu concentration of 49.26 mg kg−1, with very high variability between countries (Table 1). Moreover, vineyards are the land cover class with the highest proportion (14.6%) of soil samples with values above the proposed threshold (100 mg kg−1) [8,9,16].
A regional analysis of French vineyards shows the highest mean Cu concentration in Aquitaine (95.77 mg kg−1), followed by Languedoc-Roussillon (94.74 mg kg−1). In Provence-Alpes-Côte d’Azur (88.46 mg kg−1) and Poitou-Charentes (68.59 mg kg−1), the mean Cu concentration in vineyards is 3–4 times higher than that in all other types of land. Furthermore, in the vineyards of the first three aforementioned French regions, half of the soil samples have Cu concentrations higher than the threshold.
The main wine-producing areas of Italy also have high mean Cu concentrations in vineyards. The province of Trento has an average Cu concentration of 220.9 mg kg−1 (six soil samples), Emilia-Romagna has 110.44 mg kg−1 (nine samples), Tuscany has 64.81 mg kg−1 (12 samples), Veneto has 58.90 mg kg−1 (eight samples) and Piedmont 52.38 has mg kg−1 (nine samples).

4. Discussion

According to a well-known study [26], the anthropogenic influence on copper distribution is stronger than the geogenic or pedogenic influence. This section discusses the main sources of high copper concentrations due to anthropogenic activities (e.g., fungicide treatments), with a focus on vineyards. In addition to the literature findings, we used fungicide sales as a proxy for copper use in agricultural areas. As liquid manure affects copper concentration levels in areas with a high density of pigs in clay soils, we also examined this aspect.

4.1. Fungicide Sales as a Proxy for Copper Use

According to Mackie et al. [27], the mean application rate of fungicides in Europe is about 8 kg ha−1 year−1 for permanent crops and 1–2 kg ha−1 year−1 for arable crops, whereas other world regions have much higher rates. Similar to this study, Provenzano et al. [28] estimated the mean fungicide rate to be about 7.4 kg ha−1, which is higher than that permitted by EU regulations (6.4 kg ha−1). Our model fit (described in Section 2.3) resulted in an average fungicide consumption of 8.1 kg ha−1 for permanent crops and 0.54 kg ha−1 for arable land.
The estimated fungicide consumption was compared with the sales statistics (Figure 7). The size of the bubbles in Figure 7 is proportional to the area covered by permanent crops, which have a higher consumption of fungicides than other croplands. Obviously, countries below the dotted line are those that consume less fungicide than estimated by our model (Equation 1 in Section 2.3). Although Spain has the highest proportion (34.6%) of permanent crops in the EU, sales show that farmers do not use fungicides intensively. In addition to different local patterns and exceptions, the vineyards in Spain are often tilled and plowed, so they are characterized by reduced green cover, which was also found recently in an estimation of the cover management erosion factor [29]. In addition, it is noted that the newer Member States (e.g., Poland, Romania, Bulgaria and Hungary) do not use fungicides intensively in farming. On the other hand, France and Italy show a higher quantity of fungicide consumption than the estimate. This was in line with our findings that higher copper concentrations are found in certain wine-producing areas of Italy and France.
This analysis should be treated with care since there are no detailed data available per fungicide category. The data on fungicides and bactericides include data for three categories: “inorganic fungicides” (e.g., copper), “fungicides based on carbamates and dithiocarbamates” and “other fungicides and bactericides”. The outliers in the Netherlands and Belgium are due to the use for arable crops (potatoes, onions, bulbs and horticultural crops) of other fungicides and bactericides that do not contain copper compounds (Fungicides based on carbamates and dithiocarbamates, and other fungicides). For example, in Belgium, only 10% of the total fungicides sales in 2016 were inorganic fungicides. This hypothesis is also confirmed both by personal communication with national statistical authorities and by the statistics “use of plant protection products in the European Union” [30]. The application of fungicides in vineyards is closely related to the management practices followed by farmers. Moreover, it was verified with remote sensing data (comparing the fraction of bare soil in different countries per land cover type) that vineyards are plowed more often in Spain than in north Italy and France [29]. Finally, in Spain, copper treatment does not have as long a tradition as does in Italy and France.

4.2. Copper Concentration and Liquid Manure in Agricultural Soils

Copper (mostly in the form of copper sulfate) is often added to pig feed to suppress bacterial action in the gut and to maximize feed utilization by the animals [31]. Consequently, the Cu concentration in pig manure is an order of magnitude higher than that in other animal manure (e.g., cattle, poultry and sheep) [32]. In the United Kingdom, it is estimated that there is 643 tonnes of Cu annually in livestock manure.
According to Food and Agriculture Organization of the United Nations (FAO) statistics and Eurostat data on livestock production, the density of pigs per km2 is extremely high in Dutch, Belgian, Danish and north German regions [33]. Nevertheless, the sandy soil in those areas does not retain Cu, unlike clay soils [34]. As found recently in a regression analysis of the copper distribution in Europe [13], copper retention in topsoils is favored in clay soils that have relatively high pH and are in wet (humid) conditions. The leaching of copper and mobility as a result of erosional processes is a complex issue that can be addressed at local scale where detailed data on copper input and sediment distribution are also available.
In Southern Europe, a relatively high density of pigs (> 100 per km2) has been recorded in north Italian regions (Lombardy and Emilia Romagna), Spain (Catalonia and Navarre) and Malta (see Supplement Figure S3). In north Italy, it is common to use the slurry and manure from intensive farming as a fertilizer in crop production [35]. In most cases, the slurry has a high concentration of copper and zinc, as it comes from pig farms [36]. This liquid manure can be a potential source of high copper concentration where the high density of pigs is combined with clay and alkaline soils (higher pH) where farmers traditionally use pig slurry as manure.

4.3. Sewage Sludge and Copper

An additional problem of Cu is related to wastewater treatments, where high Cu concentrations remain in treated sewage sludge [37]. Water pipes, copper roofs and other household copper installations contribute to increased copper concentration in municipal wastewaters and sewage sludge [38]. Sewage sludge is a source of organic matter and includes a high amount of plant available nutrients [39]. It is known that sludge can improve soil properties and it is frequently applied on agricultural fields lacking in organic matter [40].
The copper concentration in agricultural soils is closely related to uncontrolled solid waste discharges and liquid waste from households or agricultural enterprises [26]. In addition to the study in Croatia [26], Nicholson et al. [41] estimated the major contribution of sewage sludge to high copper concentrations in certain agricultural areas in England and Wales. The arable lands of south Sweden, where sewage sludge has recently been applied, showed the highest increase in copper [39].
According to statistical data, around 10 million tonnes of dry solids are produced in the EU annually. It is estimated that 4 million tonnes are used in agriculture as organic amendments [40,42]. In the EU-27 countries, the highest sludge production was observed in Germany, the United Kingdom, Spain, France and Italy (>1 million tonnes) [43]. In the United Kingdom, approximately 480,000 tonnes of dried sewage sludge is used on agricultural land [41]. The copper content of sewage sludge (on dry solids) is high, ranging 100–500 mg kg−1 [44]. The Member States have adopted stricter restrictions for sludge disposal in soil than those determined in Directive 86/278/ EEC by setting lower limit values for heavy metals (including copper) [45,43]. This implies that advanced sludge technologies (e.g., wet oxidation, pyrolysis, on-site incineration, etc.) need to be adopted to remove toxic compounds [43,45].

4.4. Influence of Mines on Copper Concentration

Copper concentration decreases almost exponentially with distance from the mining works. According to a study in a copper excavation situated on Parys Mountain (United Kingdom) [46], the copper concentration decrease exponentially after a distance of 1 km from the mine. In a similar study in south Spain (mines of Tharsis, Ríotinto and Huelva) [47], the authors concluded that elevated copper concentrations in soils were found to be restricted to the immediate vicinity of the mines and smelters (maximum 2–3 km).
To assess the possible impact of mining activities, a regression model was fit including various distance metrics calculated from the copper mines database downloaded from the Minerals4EU platform [21]. Since the LUCAS Topsoil includes relatively few samples in close distance to mines, we have used the logarithmic scale to plot the results. The X-axis (Figure 8) shows the distance of surveyed samples from mine locations and there are few samples in distance less than 1000 m. The result shows that there is no univocal correlation between the distance from copper mines and the topsoil copper content at EU level (Figure 8). The negative slope of the regression lines indicates that some form of correlation between distance from mines and Cu levels is present. This trend is present for some EU countries such as Finland, France, Germany, Ireland, Poland and Spain. Unfortunately, there are limited samples in close distance (e.g., 1 km) to copper mines.

4.5. Other Anthropogenic Sources of Copper Accumulation

Atmospheric deposition (e.g., industrial emissions) can also influence copper concentrations in soil [48]. Airborne copper emissions can be both natural (volcano eruption, forest fires and wind suspension of dust) and anthropogenic [49], predominantly from mining, smelting, fuel combustion and refining industries. According to a United Kingdom soil pollutant survey [50], the median Cu concentration in soils close to industrial sites (28.8 mg kg−1) was 67% higher than that in rural areas (17.3 mg kg−1).
The atmospheric deposition of Cu varies from 5 to 100 g Cu ha−1 year−1 [51]. Alloway et al. [52] noted that the highest copper deposition rates (>50 g ha−1 year−1) were found in Italy, Germany, England and Wales. The copper industry in Europe is economically important, employing more than 50,000 people directly and indirectly, sustaining millions of jobs [53]. Furthermore, the sector has made much progress in reducing heavy metal emissions [41,54].
In addition, particles from the wear of automobile brakes are a significant source of copper emissions [48]. Brake pads can contain copper, zinc and brass. In a study of pollution in roadside soil, the copper concentration in soil closer to highways (<10 m) was found to be 7% higher than that in soil more than 10 m from the highway [55].

4.6. Recent Developments in Copper Use

Excess copper levels can harm both above and belowground biodiversity (bacteria and earthworms), plant development and food quality, and present other environmental risks [13]. These effects have led to regulatory restrictions on using copper (maximum doses that can be applied per hectare and per year) and even bans on its use for plant protection in countries such as the Netherlands and Denmark [56].
Of course, alternatives to copper have to be proposed. Dagostin et al. [57] carried out an extensive study (112 treatments) in north Italy and Switzerland to find novel compounds that could be effective against downy mildew, and are less toxic than copper and compatible with organic farming principles. According to their findings, copper-based fungicides are still the most efficient against downy mildew, but there is potential to improve copper formulas that will control those diseases and be less toxic than metallic copper [57]. Kuehne et al. [58] reached similar conclusions as they tested the use of alternative compounds to copper for pest management in organic farming.
A recent review by INRA (French National Institute for Agricultural Research) reported that genetics or natural products with biocidal effects (biocides and natural stimulants), in combination with certain control measures (e.g., contaminated crop residues), can be alternatives to extensive copper use in agriculture [59].
The copper content of sewage sludge can be reduced by using absorption systems (e.g., a mix of granulated iron hydroxide (GEH) and calcium carbonate), using advanced treatments able to remove toxic compounds and better controlling sewage application in agriculture. In the Netherlands, a proposed solution is the use of certified compost with labels showing the heavy metals composition (including copper) [60]. Similarly, legislation in Finland and Denmark proposes using fertilizers with certified low metal content.
In a recent policy recommendation, the European Food Safety Authority (EFSA) recommended that the copper content in complete feed for piglets should not exceed 25 mg kg−1 (compared with the past threshold of 170 mg kg−1) [61]. This would contribute significantly to reducing the copper released into EU agricultural soils from liquid manure by more than 1600 tonnes [61].

5. Conclusions

High concentrations of Cu have been noted in specific land uses such as vineyards and other orchards (e.g., olive groves and pears) that may be affected by the application of Cu-based fungicides for controlling plant diseases. Those outputs are also confirmed by fungicide sales, which is a significant proxy for concluding that copper is overused in France and Italy, and underused in Spain and Eastern Europe.
An additional source of high Cu concentrations in agricultural soil is the intensive fertilization with pig slurry. In regions where pig slurry is traditionally used as a fertilizer, this practice combined with a high density of pigs and clay soils, can result in Cu accumulation. Sewage sludge and atmospheric deposition (in areas close to mines) are additional anthropogenic activities that, alongside climatic conditions, soil properties and geology, are drivers of high-level Cu concentration. According to literature findings, the Cu concentration is relatively high in a 1–2 km distance from mines. We have developed a regression model plotting the negative effect of distance to mines in relation to copper concentration but this trend should be further explored with more samples close to mining activities.
At policy level, managing heavy metal balances in the environmental framework requires well-defined soil protection policies with a specific focus on agricultural soils. The sustainable management of our soils requires a strong policy framework that protects soils, makes scientific contributions to best management practices and involves various stakeholders (farmers, industry, municipalities, etc.).

Supplementary Materials

The following are available online at https://www.mdpi.com/2071-1050/10/7/2380/s1, Figure S1: Regions with major Cu Concentration (higher than 50 mg kg−1); Figure S2: Regional differences in copper concentration in olive groves. Figure S3: Pig density at pixel level (left) and at regional level (right).

Author Contributions

Conceptualization, P.P. and L.M.; Methodology, P.P., E.L. and C.B.; Formal Analysis and mapping, P.P., C.B, P.B. and S.S.; Investigation, P.P. and C.B.; Data Curation, S.S. and P.B.; Writing—Original Draft Preparation, P.P., A.J. and P.B.; Writing—Review and Editing, P.P., E.L. and C.B. Project Administration and overview, L.M. and P.P. Validation, A.O.

Acknowledgments

We thank Eurostat for supporting the LUCAS Survey and the Directorate-General for Environment for funding the analysis of heavy metals, and RECARE FP7 Programme (Grant No 603498).

Conflicts of Interest

The authors declare no conflict of interest.

References

  1. Alloway, B.J. Sources of heavy metals and metalloids in soils. In Heavy Metals in Soils; Springer: Dordrecht, The Netherlands, 2013; pp. 11–50. [Google Scholar]
  2. Borkow, G.; Gabbay, J. Copper, an ancient remedy returning to fight microbial, fungal and viral infections. Curr. Chem. Biol. 2009, 3, 272–278. [Google Scholar]
  3. Richardson, H.W. Handbook of Copper Compounds and Applications; CRC Press: New York, NY, USA, 1997; ISBN 1-4822-7746-8. [Google Scholar]
  4. Benns, B.G.; Gingras, B.A.; Bayley, C.H. Antifungal activity of some thiosemicarbazones and their copper complexes. Appl. Microbiol. 1960, 8, 353–356. [Google Scholar] [PubMed]
  5. Panagos, P.; Van Liedekerke, M.; Yigini, Y.; Montanarella, L. Contaminated sites in Europe: review of the current situation based on data collected through a European network. J. Environ. Public Health 2013, 2013. [Google Scholar] [CrossRef] [PubMed]
  6. Rajaganapathy, V.; Xavier, F.; Sreekumar, D.; Mandal, P.K. Heavy metal contamination in soil, water and fodder and their presence in livestock and products: a review. J. Environ. Sci. Technol. 2011, 4, 234–249. [Google Scholar]
  7. Komárek, M.; Čadková, E.; Chrastný, V.; Bordas, F.; Bollinger, J.-C. Contamination of vineyard soils with fungicides: A review of environmental and toxicological aspects. Environ. Int. 2010, 36, 138–151. [Google Scholar] [CrossRef] [PubMed]
  8. Ministry of Environment. Government Decree on the Assessment of Soil Contamination and Remediation Needs. Available online: https://www.ecolex.org/details/legislation/government-decree-on-the-assessment-of-soil-contamination-and-remediation-needs-no-214-of-2007-lex-faoc113198/ (accessed on 1 March 2017).
  9. Gawlik, B.M.; Bidoglio, G. Background Values in European Soils and Sewage Sludges; European Commission: Brussels, Belgium, 2006.
  10. Adriano, D.C. Trace Elements in Terrestrial Environments: Biogeochemistry, Bioavailability, and Risk of Metals; Springer-Verlag: New York, NY, USA, 2001; 866 p. [Google Scholar]
  11. Carlon, C. Derivation Methods of Soil Screening Values in Europe. A Review and Evaluation of National Procedures towards Harmonization; European Commission: Ispra, Italy, 2007; p. 306.
  12. Pietrzak, U.; McPhail, D.C. Copper accumulation, distribution and fractionation in vineyard soils of Victoria, Australia. Geoderma 2004, 122, 151–166. [Google Scholar] [CrossRef]
  13. Ballabio, C.; Panagos, P.; Lugato, E.; Huang, J.-H.; Orgiazzi, A.; Jones, A.; Fernández-Ugalde, O.; Borrelli, P.; Montanarella, L. Copper distribution in European topsoils: An assessment based on LUCAS soil survey. Sci. Total Environ. 2018, 636, 282–298. [Google Scholar] [CrossRef] [PubMed]
  14. Orgiazzi, A.; Ballabio, C.; Panagos, P.; Jones, A.; Fernández-Ugalde, O. LUCAS Soil, the largest expandable soil dataset for Europe: a review. Eur. J. Soil Sci. 2018, 69, 140–153. [Google Scholar] [CrossRef]
  15. Cristache, C.; Comero, S.; Locoro, G. Validation of A Horizontal Method for Trace Elements in Soil, Sludge and Biowaste; Publications Office of the European Union: Luxembourg, 2013. [Google Scholar]
  16. Tóth, G.; Hermann, T.; Da Silva, M.R.; Montanarella, L. Heavy metals in agricultural soils of the European Union with implications for food safety. Environ. Int. 2016, 88, 299–309. [Google Scholar] [CrossRef] [PubMed]
  17. Palmieri, A.; Martino, L.; Dominici, P.; Kasanko, M. Land cover and land use diversity indicators in LUCAS 2009 data. In Land Quality and Land Use Information; Tóth, G., Németh, T., Eds.; Publications Office of the European Union: Luxembourg, 2011; pp. 59–68. [Google Scholar]
  18. Panagos, P.; Ballabio, C.; Yigini, Y.; Dunbar, M.B. Estimating the soil organic carbon content for European NUTS2 regions based on LUCAS data collection. Sci. Total Environ. 2013, 442, 235–246. [Google Scholar] [CrossRef] [PubMed]
  19. EUROSTAT. Agri-Environmental Indicator-Consumption of Pesticides. Available online: http://ec.europa.eu/eurostat/statistics-explained/index.php/Agri-environmental_indicator_-_consumption_of_pesticides (accessed on 20 October 2017).
  20. COPERNICUS. CORINE Land Cover. Available online: https://land.copernicus.eu/pan-european/corine-land-cover/clc-2012 (accessed on 25 December 2017).
  21. Lopes, C.; Quental, L.; Oliveira, D.; Filipe, A.; Pereira, A. INSPIRE data harmonisation of mineral resources: Contribution of MINERALS4EU project. Mapping 2018, 187, 56–63. [Google Scholar]
  22. Zissimos, A.M.; Cohen, D.R.; Christoforou, I.C. Land use influences on soil geochemistry in Lefkosia (Nicosia) Cyprus. J. Geochem. Explor. 2017, 187, 6–20. [Google Scholar] [CrossRef]
  23. Huang, J.-H.; Ilgen, G.; Matzner, E. Fluxes and budgets of Cd, Zn, Cu, Cr and Ni in a remote forested catchment in Germany. Biogeochemistry 2011, 103, 59–70. [Google Scholar] [CrossRef]
  24. Toselli, M.; Schiatti, P.; Ara, D.; Bertacchini, A.; Quartieri, M. The accumulation of copper in soils of the Italian region Emilia-Romagna. Plant Soil Env. 2009, 55, 74–79. [Google Scholar] [CrossRef] [Green Version]
  25. Adrees, M.; Ali, S.; Rizwan, M.; Ibrahim, M.; Abbas, F.; Farid, M.; Zia-ur-Rehman, M.; Irshad, M.K.; Bharwana, S.A. The effect of excess copper on growth and physiology of important food crops: A review. Environ. Sci. Pollut. Res. 2015, 22, 8148–8162. [Google Scholar] [CrossRef] [PubMed]
  26. Romic, M.; Romic, D. Heavy metals distribution in agricultural topsoils in urban area. Environ. Geol. 2003, 43, 795–805. [Google Scholar] [CrossRef]
  27. Mackie, K.A.; Müller, T.; Kandeler, E. Remediation of copper in vineyards–a mini review. Environ. Pollut. 2012, 167, 16–26. [Google Scholar] [CrossRef] [PubMed]
  28. Provenzano, M.R.; El Bilali, H.; Simeone, V.; Baser, N.; Mondelli, D.; Cesari, G. Copper contents in grapes and wines from a Mediterranean organic vineyard. Food Chem. 2010, 122, 1338–1343. [Google Scholar] [CrossRef]
  29. Panagos, P.; Borrelli, P.; Meusburger, K.; Alewell, C.; Lugato, E.; Montanarella, L. Estimating the soil erosion cover-management factor at the European scale. Land Use Policy 2015, 48, 38–50. [Google Scholar] [CrossRef] [Green Version]
  30. EUROSTAT. The use of Plant Protection Products in the European Union. Available online: http://ec.europa.eu/eurostat/documents/3217494/5611788/KS-76-06-669-EN.PDF (accessed on 10 January 2018).
  31. Nicholson, F.A.; Chambers, B.J.; Williams, J.R.; Unwin, R.J. Heavy metal contents of livestock feeds and animal manures in England and Wales. Bioresour. Technol. 1999, 70, 23–31. [Google Scholar] [CrossRef]
  32. Xiong, X.; Yanxia, L.; Wei, L.; Chunye, L.; Wei, H.; Ming, Y. Copper content in animal manures and potential risk of soil copper pollution with animal manure use in agriculture. Resour. Conserv. Recycl. 2010, 54, 985–990. [Google Scholar] [CrossRef]
  33. EUROSTAT. Agricultural Production—Animals. 2018. Available online: http://ec.europa.eu/eurostat/statistics-explained/index.php/Agricultural_production_-_animals (accessed on 2 May 2018).
  34. Smolders, E.; Oorts, K.; Lombi, E.; Schoeters, I.; Ma, Y.; Zrna, S.; McLaughlin, M.J. The availability of copper in soils historically amended with sewage sludge, manure, and compost. J. Environ. Qual. 2012, 41, 506–514. [Google Scholar] [CrossRef] [PubMed]
  35. Amorosi, A.; Guermandi, M.; Marchi, N.; Sammartino, I. Fingerprinting sedimentary and soil units by their natural metal contents: A new approach to assess metal contamination. Sci. Total Environ. 2014, 500, 361–372. [Google Scholar] [CrossRef] [PubMed]
  36. Mantovi, P.; Bonazzi, G.; Maestri, E.; Marmiroli, N. Accumulation of copper and zinc from liquid manure in agricultural soils and crop plants. Plant Soil 2003, 250, 249–257. [Google Scholar] [CrossRef]
  37. Karvelas, M.; Katsoyiannis, A.; Samara, C. Occurrence and fate of heavy metals in the wastewater treatment process. Chemosphere 2003, 53, 1201–1210. [Google Scholar] [CrossRef]
  38. Boller, M.A.; Steiner, M. Diffuse emission and control of copper in urban surface runoff. Water Sci. Technol. 2002, 46, 173–181. [Google Scholar] [CrossRef] [PubMed]
  39. Fjällborg, B.; Dave, G. Toxicity of copper in sewage sludge. Environ. Int. 2003, 28, 761–769. [Google Scholar] [CrossRef] [Green Version]
  40. Roig, N.; Sierra, J.; Martí, E.; Nadal, M.; Schuhmacher, M.; Domingo, J.L. Long-term amendment of Spanish soils with sewage sludge: effects on soil functioning. Agric. Ecosyst. Environ. 2012, 158, 41–48. [Google Scholar] [CrossRef]
  41. Nicholson, F.A.; Smith, S.R.; Alloway, B.J.; Carlton-Smith, C.; Chambers, B.J. An inventory of heavy metals inputs to agricultural soils in England and Wales. Sci. Total Environ. 2003, 311, 205–219. [Google Scholar] [CrossRef]
  42. Eurostat Sewage Sludge. Sewage Sludge Production and Disposal. Available online: http://ec.europa.eu/eurostat/web/environment/water/main-tables (accessed on 20 April 2018).
  43. Kelessidis, A.; Stasinakis, A.S. Comparative study of the methods used for treatment and final disposal of sewage sludge in European countries. Waste Manag. 2012, 32, 1186–1195. [Google Scholar] [CrossRef] [PubMed]
  44. Milieu. Environmental, Economic and Social Impacts of the use of Sewage Sludge on Land. Available online: http://ec.europa.eu/environment/archives/waste/sludge/pdf/part_ii_report.pdf (accessed on 20 April 2018).
  45. Mininni, G.; Blanch, A.R.; Lucena, F.; Berselli, S. EU policy on sewage sludge utilization and perspectives on new approaches of sludge management. Environ. Sci. Pollut. Res. 2015, 22, 7361–7374. [Google Scholar] [CrossRef] [PubMed]
  46. Wilson, B.; Pyatt, F.B. Heavy metal dispersion, persistance, and bioccumulation around an ancient copper mine situated in Anglesey, UK. Ecotoxicol. Environ. Saf. 2007, 66, 224–231. [Google Scholar] [CrossRef] [PubMed]
  47. Chopin, E.I.B.; Alloway, B.J. Distribution and mobility of trace elements in soils and vegetation around the mining and smelting areas of Tharsis, Riotinto and Huelva, Iberian Pyrite Belt, SW Spain. Water. Air. Soil Pollut. 2007, 182, 245–261. [Google Scholar] [CrossRef]
  48. Davis, A.P.; Shokouhian, M.; Ni, S. Loading estimates of lead, copper, cadmium, and zinc in urban runoff from specific sources. Chemosphere 2001, 44, 997–1009. [Google Scholar] [CrossRef]
  49. Nriagu, J.O. A global assessment of natural sources of atmospheric trace metals. Nature 1989, 338, 47. [Google Scholar] [CrossRef]
  50. Creaser, C.S.; Wood, M.D.; Alcock, R.; Copplestone, D.; Crook, P.J.; Barraclough, D. UK Soil and Herbage Pollutant Survey: Environmental Concentrations of Polycyclic Aromatic Hydrocarbons in UK Soil and Herbage; Environment Agency: Bristol, UK, 2007.
  51. Oorts, K. Copper. In Heavy Metals in Soils; Springer: Dordrecht, The Netherlands, 2012; Volume 22, pp. 367–394. [Google Scholar]
  52. Alloway, B.J.; Zhang, P.; Mott, C.; Chambers, B.J.; Nicholson, F.A.; Smith, S.; Carlton-Smith, C.; Andrews, A.J. The Vulnerability of Soils to Pollution by Heavy Metals, Final Report for MAFF Contract SP0127; MAFF: London, UK, 2000.
  53. Copper Alliance European Copper Institute. Benefits of Copper. Available online: http://copperalliance.eu/industry (accessed on 1 May 2018).
  54. Pacyna, E.G.; Pacyna, J.M.; Fudala, J.; Strzelecka-Jastrzab, E.; Hlawiczka, S.; Panasiuk, D.; Nitter, S.; Pregger, T.; Pfeiffer, H.; Friedrich, R. Current and future emissions of selected heavy metals to the atmosphere from anthropogenic sources in Europe. Atmos. Environ. 2007, 41, 8557–8566. [Google Scholar] [CrossRef]
  55. Dierkes, C.; Geiger, W.F. Pollution retention capabilities of roadside soils. Water Sci. Technol. 1999, 39, 201–208. [Google Scholar] [CrossRef]
  56. Dafforn, K.A.; Lewis, J.A.; Johnston, E.L. Antifouling strategies: history and regulation, ecological impacts and mitigation. Mar. Pollut. Bull. 2011, 62, 453–465. [Google Scholar] [CrossRef] [PubMed]
  57. Dagostin, S.; Schärer, H.-J.; Pertot, I.; Tamm, L. Are there alternatives to copper for controlling grapevine downy mildew in organic viticulture? Crop Prot. 2011, 30, 776–788. [Google Scholar] [CrossRef]
  58. Kuehne, S.; Roßberg, D.; Röhrig, P.; von Mehring, F.; Weihrauch, F.; Kanthak, S.; Kienzle, J.; Patzwahl, W.; Reiners, E.; Gitzel, J. The Use of Copper Pesticides in Germany and the Search for Minimization and Replacement Strategies. Org. Farming 2017, 3, 66–75. [Google Scholar] [CrossRef]
  59. INRA. Peut-on se Passer du Cuivre en Protection des Cultures Biologigues? Available online: https://inra-dam-front-resources-cdn.brainsonic.com/ressources/afile/423215-51d65-resource-expertise-cuivre-en-ab-synthese-francais.pdf (accessed on 10 March 2018).
  60. Moolenaar, S.W. Heavy-Metal Balances, Part II: Management of Cadmium, Copper, Lead, and Zinc in European Agro-Ecosystems. J. Ind. Ecol. 1999, 3, 41–53. [Google Scholar] [CrossRef]
  61. EFSA Panel on Additives and Products or Substances used in Animal. Revision of the currently authorised maximum copper content in complete feed. EFSA J. 2016, 14, e04563. [Google Scholar]
Figure 1. The LUCAS Topsoil database and the links with other datasets (land use and administrative units).
Sustainability 10 02380 g001
Figure 2. Number of samples per Cu concentration category.
Sustainability 10 02380 g002
Figure 3. Statistics of Cu concentration (mg kg−1) by country. The right column shows the number of samples per country. The boxplot is the interquartile range (IQR) expressed as the difference between the 25th (Q1) and 75th percentiles (Q3); the left line is the result of the operation: Q1 − 1.5 * IQR and right line is the result of the operation: Q3 + 1.5 * IQR. Dots outside the lines are considered outliers.
Sustainability 10 02380 g003
Figure 4. Mean copper distribution (mg kg−1) by NUTS2 region in EU-27.
Sustainability 10 02380 g004
Figure 5. Copper concentration and proportion of samples by land use (arable lands, permanent crops, forests, and grasslands).
Sustainability 10 02380 g005
Figure 6. Mean copper distribution (mg kg−1) in EU croplands by NUTS2 region and distribution of soil samples taken from vineyards, olive groves and fruit trees.
Sustainability 10 02380 g006
Figure 7. Comparison of fungicide sales (Source: EUROSTAT) with estimated consumption based on agricultural land (arable + permanent crops).
Sustainability 10 02380 g007
Figure 8. Plot of marginal effects of the regression model including the distance from mines as an explanatory variable.
Sustainability 10 02380 g008
Table 1. Cu concentration in vineyards.
CountryNo of SamplesMean Cu Concentration (mg kg−1)No of Samples with Concentration >100 mg kg−1
France6591.2927
Italy8671.9017
Romania1664.873
Germany1154.691
Bulgaria931.38-
Greece624.94-
Portugal1823.761
Spain12016.501
Hungary48.09-
Cyprus239.07-
Czech Republic236.29-
Austria120.24-
Malta136.10-
Total34249.2650

