Article

The Model of Optimal Allocation of Maritime Oil Spill Combat Ships

1
Institute of Marine Navigation, Maritime University of Szczecin, 70-500 Szczecin, Poland
2
Institute of Marine Traffic Engineering, Maritime University of Szczecin, 70-500 Szczecin, Poland
3
Faculty of Maritime Studies and Transport, University of Ljubljana, 6320 Portoroz, Slovenia
*
Author to whom correspondence should be addressed.
Sustainability 2018, 10(7), 2321; https://doi.org/10.3390/su10072321
Submission received: 18 May 2018 / Revised: 29 June 2018 / Accepted: 30 June 2018 / Published: 4 July 2018
(This article belongs to the Section Energy Sustainability)

Abstract

:
The paper describes a two-stage method for optimizing the location of marine oil spill combat forces and assessing the costs related to this action at the sea. An optimization problem relates to positioning the oil pollution combat ships in ports in such a way that they are able combat the anticipated number of oil spills in certain positions in the Polish coast of the Baltic Sea area in the shortest possible time. The problem was classified as NP-hard; therefore, in the first stage, an evolutionary algorithm was applied. The main output of the model based on the evolutionary algorithm is the time of arrival of combat ships from the port to the oil spill area, as well as the costs of such operation; this is defined as the aim function. The first stage of the model does not simulate combat pollution action; therefore, the results obtained were treated as approximate. In the second stage, the several best allocations of oil spill response resources obtained in the first stage were used as input to a detailed simulation model of combat action. For each chosen allocation, a number of oil combat action simulations were carried out. The model can be used to create and verify oil pollution contingency plans, and finally increase the sustainability of sea and coastal areas.

1. Introduction

Increasing the exploration and transport of crude oil carries the risk of increasing the probability of oil spillage, especially on routes used by ships transporting crude oil and its products [1,2]. The countries of the Baltic Sea Region are focused on preventing oil spills, but attention should also be paid to the planning and coordination of oil pollution action, so that it can proceed as quickly and efficiently as possible when necessary. The main objective of the action to combat oil pollution on the sea surface is to collect all or as much oil as possible before it reaches the shore in order to protect the environment and human health [3]. This is directly related to the cost of oil spill combat action, because the amount of substance that has polluted the coast has the greatest impact on the costs. In order to ensure that the combat action is carried out quickly and efficiently, one must check whether the actual distribution of oil pollution combat ships allows effective action to be taken; if not, a new ship deployment should be sought to reach the spill site quickly, and take early action to combat pollution.

2. Problems of Combating Oil Spills

2.1. Behavior of Oil in the Sea Water

Oil is a general term for many different natural substances of plant, animal, or mineral origin, as well as a range of synthetic compounds. Each type of crude oil and its products have their own unique properties [4,5,6]. These properties influence the behavior of the oil product after a spill, and determine the effects of spillage on living organisms.
After an oil spill or any other event that releases crude oil or petroleum products into the marine environment, atmospheric processes begin to immediately transform the spilled product into physical and chemical substances that are different from the original source material [7].
The main random processes determining the oil’s behavior in seawater are spreading, evaporation, emulsification, dissolution, biodegradation, and photooxidation [5].

2.2. Problems of Optimizing the Allocation of Response Resources. Modeling of Spills

A review of the literature on resource allocation reveals that there are a limited number of publications on the optimal allocation of oil pollution combat resources. One of the most important developments in this area is the model that was designed for the northeast coast of the United States [8], which optimized the allocation of resources for combating spills in relation to a set of possible spillage points located at high risk positions. For each rescue base, there is a complete set of oil pollution combat equipment with known technical parameters such as capacity, pump capacity, boom length, etc. It also includes tactical planning elements such as spill response time, time to spillage, and cost of equipment operation, as well as costs related to oil pollution that failed to collect, delays, or equipment failure.
Iakovou et al. (1996) proposed a hybrid model in which strategic decisions for equipment allocation were solved simultaneously with an optimized tactical response. This model took into account the costs of building a storage facility, the storage and transport costs associated with relocating equipment, as well as the type of substance spilled. However, the spatial–temporal dynamics of real leakages were not taken into account here [9].
A model proposed by Lehikoinen et al. (2013) was built based on the Bayesian network, which is used for the probabilistic analysis of the effectiveness of oil pollution combat equipment in Finnish waters under various hydrometeorological conditions and the study of their optimal distribution [10]. The analysis takes into account the combination of environmental conditions and their impact on individual units, and ultimately on the entire fleet. The Bayesian network is used here to integrate various types of data and knowledge gathered from several sources, including expert knowledge, technical parameters of oil-collecting equipment, hydrometeorological conditions, etc. The authors used methods requiring knowledge of a large amount of input data and the cooperation of experts, which makes it difficult to use this model for solving real problems.
Spill modeling is only one of the elements of a wider oil spill assessment, plan, and response to spillage. There are two additional elements of particular importance for this process: strategic planning and tactical response [2,11]. Priority should be given to the strategic elements of the oil spill response, focusing primarily on where to locate adequate resources, including emergency bases, ships, and other equipment needed to respond effectively to oil spills. Such decisions are taken before a spill occurs, which means that decision-makers have to rely on probabilistic information about the location of the spill, including its frequency, size, and duration. The second element focuses on the tactical approach to a spill after it has occurred, and includes elements such as the selection of appropriate anti-pollution equipment and how to combat it [2].
An overview of the current generation of spillage models reveals that they are mostly based on Lagrange’s methods for transport processes (advection and dispersion), and individual random process algorithms [12]. Below, selected oil spill simulators are summarized:
Pisces II is a simulator designed to prepare and assist in the coordination of rescue operations in case of an oil spill. The program, based on the mathematical modeling of an oil spill and its interaction with geographical restrictions, environmental conditions, and approaches to combat the oil spill, makes it possible to predict oil spill behavior in water as well as in contact with the coastline. The simulator allows the planning of a rescue operation and oil combat it in real time. It provides the possibility of building one’s own base of response resources to combat oil pollution and graphically present their distribution along the coast [13].
OILMAP [14] is a computer system providing information about the trajectory of movement and behavior of an oil slick due to spillage with a database containing the history of hydrometeorological conditions and tools for their visualization.
GNOME (General NOAA (National Oceanic and Atmospheric Administration) Operational Modeling Environment) is a tool for the modeling and prediction of the possible route or trajectory of pollution both under water and on the water surface [15].
Seatrack Web [16] is a tool developed by the SMHI (Swedish Meteorological and Hydrological Institute) in close cooperation with the Danish Maritime Administration, the Federal Maritime Hydrographic Agency, and the Finnish Environmental Protection Institute.
A PISCES II simulator complying with the requirements of the Oil Pollution Act of 1990 (OPA 90) has been chosen to simulate the oil spills in these tests. The research conducted with the use of a simulator has been tested and confirmed by international research centers [17]. PISCES II distinguishes itself from other simulators by the possibility of conducting oil pollution action simulation, and monitoring the costs of such action.

3. Allocation Optimiation Methods; Solving Allocation Problems

Optimization is the search for the best solution to a given issue. The best solution—the optimal one—is the extreme of some quality indicator [18].
The problems related to the discussed topic are optimization issues, operational research, mathematical programming, and logistics. In order to solve the detailed problem of allocation of the resources, we can use linear programming methods that have been employed in transport problems: the so-called location-allocation issues (LA). Such a decision-making task is one of the NP-hard issues.
The problems of the NP class are called decision problems, in which checking the correctness of a specific solution requires multimode computing complexity. It follows from the above statement that finding a solution to NP problems requires at least polynomial complexity. The algorithm execution time depends on the size of the data used in the algorithm. We say that it is polynomial if there are such constants C and k that for data of the size n, the algorithm needs at most Cnk steps [19].
NP-hard class problems are called computational problems, for which it is not possible to solve them with polynomial complexity, and it is at least as difficult to find a solution as any other NP problem. NP-hard issues include both decision-making problems and search and optimization problems.
The problem discussed in this article belongs to the class of NP-hard problems. An analysis of particular optimization problems is presented below.
The location-allocation issue is a strategic problem in the process of making a decision on the best possible location of production centers and their connection to the transport network with customers [20].
The transport issue (transport task) is a very well-known logistic problem that consists of choosing the most economically efficient plan for transporting goods from m sources (production points) to n destinations (pick-up points) [21].
The backpack problem is another optimization issue, which was named after the practical situation of the backpack. The task is to pack the most valuable collection of items without exceeding the capacity of the luggage.
Since none of the above methods fully solves the problem of the optimal distribution of resources, a method of evolutionary algorithms has been proposed. In order to create a model for the optimal allocation of oil spill combat resources, it is necessary to combine the solutions of all of these issues into one algorithm. In addition, the model of oil spill behavior on the water surface under various hydrometeorological conditions should be taken into account.

Evolutionary Algorithms

Evolutionary Algorithms (EAs) are a set of methods of optimization inspired by natural evolution [22]. The evolutionary algorithm is an approximate stochastic algorithm that uses mechanisms modeled on the biological evolutionary process; i.e., selection, reproduction, and mutation. A given population of individuals is affected by natural selection forced by environmental pressure and controlled by means of a predetermined aim function. Only the best-adapted individuals have a chance to start a new, usually better, quality population.
The basic concepts of both natural and simulated evolution include [23,24]:
  • Individual—a basic unit of evolution, arriving in a certain environment, to which it should be more or less adapted (example solution of the task, one of the possible configurations of ship deployment in ports);
  • population—a pool of individuals living in the common environment and competing for its resources (collection of possible configurations for ship deployment in ports);
  • phenotype—external characteristics of the individual. In evolutionary algorithms, these are the parameters of the solution to be assessed (cost of pollution combat for a given ship allocation);
  • genotype—unambiguous description of an individual contained in its genes (assignment of ships to specific ports);
  • chromosome—a place where the genotype of an individual is stored;
  • encoding solutions—a way to save any acceptable solution of the problem in the form of an individual genotype; each solution must be able to be recorded in the form of a genotype.
The classic genetic algorithm was proposed by John Holland in 1975; its task was to model the evolutionary process [25]. The algorithm is processed by two populations: Pt (base population) and Ot (population of descendants) [25]. It also uses the Tt temporary population, in which copies of individuals from Pt are stored. These populations shall contain the same number of individuals.
The genetic algorithm consists of the following steps:
  • Initiation P0—the base population is filled with randomly generated individuals. A fitness value is calculated for each of them. After the basic population has been prepared, the main program loop takes place, in which an artificial evolutionary process is defined.
  • Reproduction—copying to temporary population Tt of randomly selected individuals from the basic population. Individuals with a higher adaptation function are more likely to reproduce.
  • Genetic operations—Tt temporary population individuals are subjected to genetic operations (cross and mutation).
    • Randomly selected individuals are selected in pairs, and a decision is made (randomly and with a certain probability) about crossbreeding (Figure 1). The resulting offspring replace their parents. The probability of crossing pc is an important parameter of the algorithm.
    • Then, with a certain probability of mutation, which is an algorithm parameter, mutations can be performed on individuals (Figure 2). A randomly selected gene is selected from the population, in which the perturbation of the genotype takes place, and a randomly selected gene is replaced by another.
  • In the next step, the resulting solution is assessed using a target function.
  • Selection procedure. On the basis of the calculated value of the target function, the adjustment value is determined (very often the same function). Then, N individuals of the temporary population are randomly selected from among the N individuals of the population of the progeny (with repetitions) by means of the algorithm “roulette circle”. Individuals with better fitness are given a higher weightage in the roulette wheel (Figure 3).
  • In the next loop cycle, the resulting population becomes the base population (return to reproduction).
The loop is made until the stop condition is met. This may be the execution of a certain number of generations (generation is one loop circuit) or the attainment of a certain value of the adaptation function by the offspring.

4. Model of Optimal Allocation of Oil Spill Response Resources

This section discusses the assumptions, objective function, and scope of the necessary input data for a model of optimal allocation of response resources. On this basis, the original method of optimal allocation of response resources for combating oil spills was built.

4.1. General Method for Optimizing the Allocation of Oil Pollution Response Resources

4.1.1. Assumptions and Problem Definition

The main assumptions of the problem of optimization are that I ships Si are available, and should be located in J ports Pj with coordinates (λpj, ϕpj). One ship only may be assigned to one port, but one port can store more than one ship. Port capacity limit is determined by the harbor capacity. Ships have the task of combating the K spills Rk in positions (λrk, ϕrk) along the shipping routes between the Tl. A graphical representation of the problem is shown in the Figure 4.

4.1.2. Input Data

The input data is divided into three groups: ports, ships, and spills.
There is J (j = 1 … J) ports marked as P1Pj and the ships can be stationed only there.
There is I (i = 1 … I) ships marked as S1Si.
There is K (k = 1 … K) spills marked as R1Rk. Spills can be arranged in a separate Poisson’s model, randomly on ships’ routes.

4.1.3. Formulation of Objective Functions

Indicators:
  • j—the index of ports (j = 1, 2, …, J);
  • i—the index of ships (i = 1, 2, …, I);
  • k—the index of spills (k = 1, 2, …, K).
Parameters:
  • J—total number of ports;
  • I—total number of ships;
  • K—total number of spills;
  • pj—capacity of the i-th port [ships];
  • cpj—the cost of berthing of the ship in port [PLN/day];
  • vj—speed of the ship [kn];
  • vrk—the size of the k-th spill [t];
  • tijk—the time of arrival of the ship to the spill [h];
  • tik—operating time of the ship at the action scene [h];
  • cik—the labor cost of the ship at the action site [PLN/h];
  • djk—distance between ports and spill sites.
Decision variables:
x i j = { 1 ,     i f   t h e   i t h   s h i p   i s   a s s i g n e d   t o   a   d o   j t h   p o r t 0 ,     o t h e r w i s e y i k = { 1 ,     i f   t h e   i t h   s h i p   i s   a s s i g n e d   t o   a   d o   j t h   s p i l l 0 ,     o t h e r w i s e
Objective function:
The main task is to deploy the vessels owned in such a way that the total costs are minimal. Costs taken into account during optimization include:
  • total (total) cost of arrival at spill from berth;
  • the total cost of oil slick clean-up by the vessels involved;
  • the cost of environmental damage;
  • the cost of maintaining ships in port:
  F ( x , y ) = M i n i = 1 I j = 1 J k = 1 K t i j k c i k x i j y i k + i = 1 I j = 1 J k = 1 K t i k c i k x i j y i k
where:
  t i k = d j k / v i j
  • tijk—the time of arrival of the ship to the spill [h];
  • cik—the labor cost of the ship at the action site [PLN/h];
  • xij—decision variable (if the i-th ship is assigned to a j-th port xij = 1, otherwise xij = 0);
  • yik—decision variable (if the i-th ship is assigned to a k-th spill yik = 1, otherwise yik = 0).
Constrains:
i = 1 I x i j = 1 ;   i ,   ( each   ship   must   be   assigned   to   a   port ) ; j = 1 J y i k = 1 ;   j ,   ( all   ships   participate   in   the   action ) .

4.2. Method for Optimal Allocation of Oil Spill Response Resources

The optimal allocation method refers to the strategic level of response, and is designed to adjust the deployment of rescue ships in maritime rescue bases [26] in such a way that the time of arrival of ships at the ship’s location, the cost of action, and the environment damages will be as low as possible.
The input data to the model are:
  • port positions (geographical coordinates);
  • the current distribution of ships in ports;
  • technical characteristics of the ships;
  • cost of using ships to combat oil spills [PLN/h];
  • geographical coordinates of spill locations;
  • type of spilled substance;
  • hydrometeorological conditions.
The optimization method (Figure 5) was divided into two stages.
In the first stage, input information is analyzed in an optimisation model based on EAs. The program, based on the distance between ships and spill locations, finds solutions characterized by the shortest time of the ships’ arrival at each spill location, and generates a list of best solutions. The best allocation goes to the second stage, where it is verified and analyzed again. For this allocation, the PISCES II simulator is used, taking into account the first spill location, selected hydrometeorological conditions, and the spill size. The next simulation is carried out again for the first spill site, subsequent hydrometeorological conditions, and spill size. After all of the simulations for the first spill site and all of the assumed variants of hydrometeorological conditions and spill size are determined, we can proceed to simulation for the second spill site, and again, all of the assumed hydrometeorological variants and spill size. The simulation procedure ends with simulation for all spill locations in all of the assumed hydrometeorological conditions. As a result of the simulations conducted, the costs of oil pollution combat actions are compiled from individual simulations.
The second stage can be carried out any number of times (as long as the solutions obtained in the first stage are exhausted) by selecting the next allocations obtained in the first stage of the model.

4.3. Optimizing Allocation Using Evolutionary Algorithms

The first stage of the optimized allocation model for combating oil spills is an original optimization model based on the mechanism of natural evolution, the so-called evolutionary algorithm. The model was built on a simple evolutionary algorithm.
The task was solved by the following method of chromosome coding (Table 1), which contains both information about the ship and its position in a given port:
It has been assumed that the ship must be assigned to a port. Therefore, the chromosomes are composed of natural numbers, in the range from one to the number of ports. The length of the chromosome shall be equal to the number of ships. The sequence of genes shall follow the order of the ships in the list.
A. Selection of the parental population
The decision to cross between two individuals was made on the basis of Bernoulli’s single attempt, with a probability of success equal to that of the P-Crossing. The roulette rule was applied; i.e., the more adapted were chosen for crossing. In practice, potential parents were first selected, and then randomly selected depending on whether crossing was to take place and the crossings were allowed; if not, the next two parents were selected.
B. Crossing
A simple one-point crossing operation was used. First, the crossing point was selected with a continuous probability (probability of crossing = 0.45) from one to the maximum length of the chromosome (number of ships). At this point, the chromosomes were fragmented as shown below. Assuming that two candidates for crossing (K1 and K2) were selected, and they have chromosomes in the form:
K1 = {1, 2, 3, 2, 3, 4, 1}
K2 = {2, 4, 5, 6, 7, 3, 2}
The point of crossinghas been chosen as three (the genes behind this point have been replaced), and the descendants have the following chromosomes:
P1 = {1, 2, 3, 6, 7, 3, 2}
P2 = {2, 4, 5, 2, 3, 4, 1}
C. Mutation
Mutation was performed with the probability of mutation on chromosomes (pmutation = 0.01) of offspring (the Bernoulli test was also used, with the probability of success equal to pmutation). Success was followed as follows:
  • An allele was selected by uniform distribution, in our case, a ship in the form of number from one to chromosome length (number of ships),
  • A value from one to the number of ports was randomized (also evenly distributed) and assigned to a given point of the chromosome.
D. Selection of EA parameters
The parameters were selected on the basis of the literature. During the verification, minor changes were made to the parameters to stabilize the results.

4.4. Application Interface

The original model and computer application were created using Delphi Pascal 7.0 without libraries and the code was written on the basis of J. H. Holland’s publication [25]. The application GeneAloc consists of three windows presenting the simulation results (Figure 6). The first window (1) shows a cost diagram of rescue operations for the next ship allocations in ports; the next window (2) shows the location of ports (squares) and spills (circles); the last window (3) is a table of simulation results in text form.

5. Experiment Planning

5.1. Hydrometeorological Conditions

Two variants of hydrometeorological conditions were chosen for the simulation: good and bad. Good hydrometeorological conditions are those that do not disturb the rescue operation (average conditions for sea state: 2), bad are boundary conditions in which it is still possible to use equipment to combat spills (average conditions for sea state: 3). Table 2 provides an overview of the hydrometeorological conditions for these regions.

5.2. Response Resources for Combat Oil Spill

Poland has at its disposal various means to combat oil spills. The equipment includes: 7000 m of various booms, 15 skimmers, seven different types of specialist sweeping nets for collecting heavy oil, one Mini Vac System, portable and floating tanks for collected pollution, and various types of pumps [27]. Polish anti-pollution units are stationed in Świnoujście, Gdynia, Gdańsk, and Hel.
Poland has nine ships to combat oil spills [27]. Three ships have a The Lamor Side Cassette Oil Recovery System (LSC) [28]. This is a system built into the hull of the ship that enables rapid readiness for work. The rest of the ships are designed to cooperate in combating oil spills, including the towing of booms and skimmers. An extensive analysis of ships and oil pollution combat equipment available in Europe is contained in the manual of the “Network of Stand-by Oil Spill Response Vessels and Equipment” [29], which is being updated by EMSA (European Maritime Safety Agency).

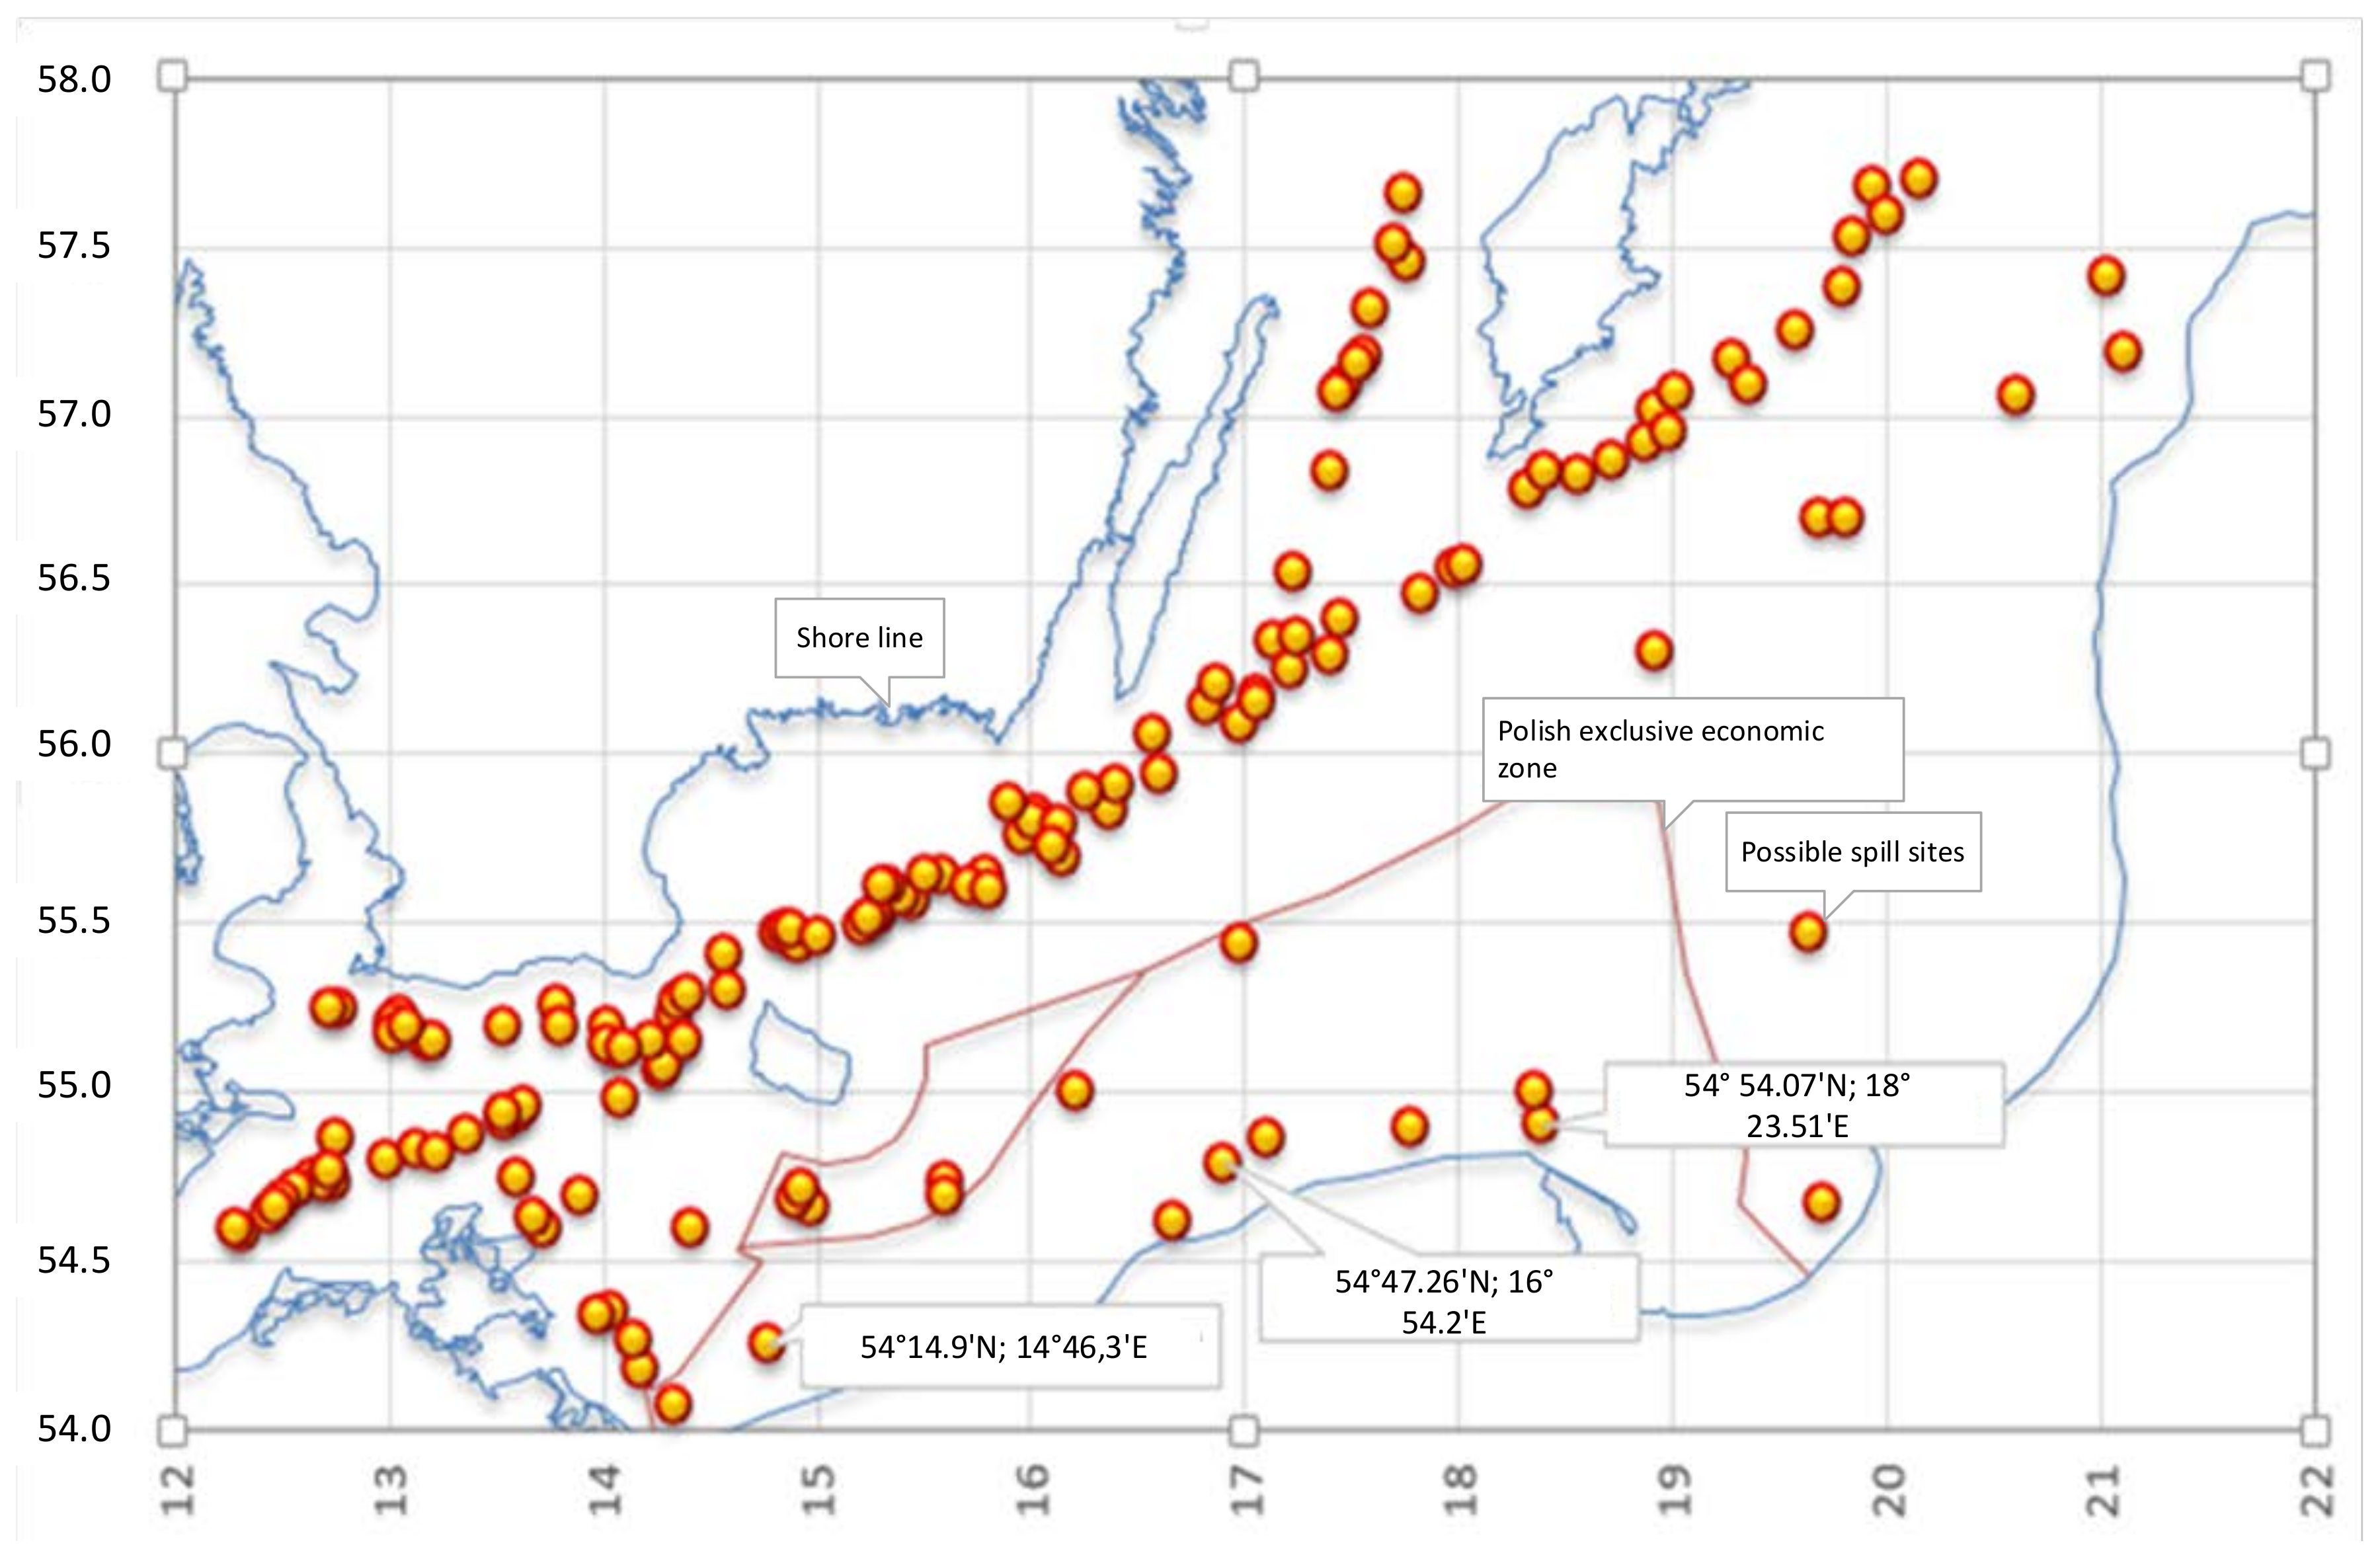
5.3. Estimated Probable Spill Locations for Simulations

In order to carry out the simulation, it was necessary to know the expected spill locations, which are closely related to ship traffic. These locations are based on the stochastic model of navigation safety assessment [30,31].
Three spill sites for the experiment were selected from the list generated by the location model (Figure 7). These places are located on the routes traveled by ships going to Polish ports; therefore, there is a risk of an accident, and an oil spill as a result of this accident. The national plan assumes the prevention of shore pollution, in the maximum quantity of 3500 cubic metres of crude oil [32]; therefore, such a size of the spill was assumed for calculation. In addition, simulations were also carried out for 7000 t and 14,000 t of oil.

6. Experiment and Analysis of the Results Obtained

6.1. Performing the Experiment

The experiment was divided into two stages (Figure 8):
Stage I (optimization by application based on evolutionary algorithms):
  • Input data:
    • number (p = 3) and port’s location (geographical coordinates);
    • number (r = 3) and spill’s location (geographical coordinates);
    • list of available ships for combating oil spill and their parameters;
    • the current allocation of ships in ports.
  • Analysis of input data:
    • determination of the total distance and time at which ships arrive at the spill site for subsequent allocations;
    • selection of allocation with the shortest total time of arrival of ships to the place of action;
  • Selection of the solution (allocation) with the lowest value of the aim function.
Stage II (simulation of the PISCES II simulator)
  • Copy the best (or selected) Stage I solution (allocation);
  • Performance of oil spill combat action simulation for selected allocation in the PISCES II simulator for spill locations 1, 2, and 3 (r = 1, 2, 3) and:
    • good hydrometeorological conditions;
      • spill size 3500 t;
      • spill size 7000 t;
      • spill size 14,000t;
    • bad hydrometeorological conditions;
      • spill size 3500 t;
      • spill size 7000 t;
      • spill size 14,000t;
  • Copy the next solution from the first step (return to stage II, first point); (the second stage can be carried out any number of times, as long as the solutions obtained in the first stage are exhausted, by selecting the subsequent allocations obtained in the first stage of the model).
  • Summary of results (costs) of oil pollution combat actions carried out for all analyzed allocations.
The optimal allocation of ships is calculated using the method of optimal allocation of response resources, based on evolutionary algorithms. The algorithm generates a list of possible allocations together with the cost of containment actions for each allocation. Figure 9 shows the search process for the best adapted individual.
The solution space amounts to a total of 19,683 possible allocations. The evolutionary algorithm has chosen the best of them, additionally retaining those with a higher value of the aim function. The result of the survey is 19,683 allocations, assuming that we have nine ships and deploy them in three ports. If the number of ships or ports is increased, there will be a significant increase in the number of possible allocations (e.g., for 15 ships deployed in six ports, the capacity of solutions is more than 93 million possible allocations), which means that it would be difficult to solve the problem with other methods.
To carry out stage II of the experiment, four allocations were selected—the best (allocation no. 1), average (allocation no. 10,000 and 15,000) and worst (allocation no. 19,683)—and then compared with the current allocation of ships (Table 3).
The best and other selected allocations from Stage I were copied to Stage II, where the analysis of these allocations took place. In order to carry out the simulation, four allocations were used: the best (allocation no. 1), average (allocations no. 10,000 and 15,000), and the worst (allocation No. 19,683), and they were compared with the current distribution of response resources for combating oil pollution.
Simulations were conducted in turn for the planned spill locations. The scenarios were designed to show the worst hydrometeorological conditions that can occur during an oil spill. Simulations were conducted for two types of weather (good and bad). Good is weather that does not cause any difficulties in the rescue operation (and assumes average conditions for the state of the sea, 2); bad are the boundary conditions in which it is still possible to use equipment to combat spills (average conditions for the state of the sea, 3). In both cases, the current remained unchanged, and was equal to 0.25 knots [34], the southeast (SE) direction for spill locations No. 1 and 2 and southwest (SW) for the spill near the Bay of Gdansk. The maximum wind was the average wind corresponding to sea level 3, as the ships of Polish services can only operate up to this level. In addition, for both variants of hydrometeorological conditions, oil spillage combat simulations of 3500 t, 7000 t, and 14,000 t were conducted.

6.2. Analysis of Costs of Combating Spills Generated by Simulation Scenarios

The number of factors influencing the cost of oil spill combating is very high. This cost is influenced by such factors as: hydrometeorological conditions, mainly wind and current parameters, size of spill, type of pollution, and the current allocation of oil pollution ships.
The main factor determining the cost of action to combat oil pollution is the amount of oil that has settled on the shore. Beach cleaning generates the highest costs, which were estimated at 582 USD per tonne of pollution [35]. The cost of combat actions for the analyzed scenarios for allocation 0 and 1 is shown in Figure 10.
During the experiment, 90 scenarios were analyzed. Scenario names were coded as follows: Spill site number—spill size_substance type—weather conditionsThe following example is encoded as 1-3500_IFO180-good (Table 4):
The average cost of carrying out rescue operations at the current location of ships (allocation 0) amounted to $1594 million USD, whereas the average cost for allocation no. 1 was $1606 million USD. On the 18 simulations carried out for allocation no. 1, 12 had a lower cost compared with the current state. Large differences in the costs of individual simulations are due to onshore pollution. The cost of removing pollution from the beach is so high that it causes a dramatic surge in the cost of spill combating operations. This situation occurred in the case of a simulation of 14,000 tonnes of oil spilled at point no. 1 in bad hydrometeorological conditions (1-14000_IFO180-bad), where the action to combat pollution in the case of allocation 0 failed, and 8456 tonnes of pollution entered the beach. For the identical spillage and allocation number 1 (the best allocation proposed by the EA), 1220 tonnes of oil entered the beach.

6.3. Statistical Analysis of Research Results

In this section, methods of statistical analysis of data were used to determine the influence of changed factors on the dependent variable; i.e., the cost of spillage removal (K) expressed in monetary units (PLN). The factors changed during the experiments were the following:
  • Allocation of resources taking values according to location of ships as: A = {0; 1; 2; 3}.
  • Spillage site with values M = {1; 2; 3}.
  • Spillage size taking the values W = {3; 5; 7; 14}.
  • Hydrometeorological conditions with two values of H = {bad, good}.

6.3.1. Application of a Multifactor Variance Analysis Model

The null hypothesis of H0 assumes that the average cost of spillage combat in each group is equal:
H0: mA = mW = mW = mH
to an alternative hypothesis of H1, assuming that at least two averages (i, j) are different:
H1: mimj
This assumption means that there are no differences in the individual costs of spillage disposal.
The assumptions for the analysis of variance are as follows:
  • samples shall be taken from independent observations,
  • normality of the distributions from which the samples come (the Shapiro–Wilk test was used),
  • homogeneity of variance between groups (the Levene test was used).
In the next step, the test materiality level was adopted, with the probability of making errors of the first type equal to a = 0.05.
The computer data analysis package used (here Statistica Statsoft’s software is used) calculates the so-called critical probability p, which is the smallest level of materiality at which the calculated value of statistics results in the rejection of H0. Further decisions are made as follows:
  • If a > p, then at the materiality level a, the zero hypothesis (H0) should be rejected.
  • Otherwise—i.e., when a < p—at importance level, there are no reasons to reject the zero hypothesis (H0).

6.3.2. Variation Analysis

In the first step, which aims to assess the impact of particular factors on the cost, the average costs of individual dependencies on allocation, locations, conditions, and spill sizes were determined.
Figure 11 shows the average spill costs determined by selected factor types. Its preliminary qualitative analysis leads to the following observations:
  • the conditions influence the cost of spills removal,
  • spillage size clearly influences the cost of disposal,
  • the allocation does not show a statistically significant impact on the cost of spill removal.
The influence of the allocation type can be observed in Figure 12, where average unweighted spill costs are presented depending on the allocation. It can be seen that there are small differences between the “0” (current) and “1” allocations (proposed by GenAloc), and the costs of other selected allocations that are significantly different from them.

6.3.3. Summary of Statistical Data Analysis

Summarizing the analysis, we can observe that:
  • The hypotheses about the equal average cost of spillage removal for all of the examined factors cannot be accepted.
  • The allocation does not have a statistically significant impact on the cost of the action.
  • The size, conditions, and location of the bottling operations have a significant impact on the cost of the combat action.
  • Costs rise significantly with any increase in the volume and deterioration of conditions.
  • There is no statistically significant difference between average costs for the five allocations tested, including the current and suboptimal ones based on the EA.
  • In spite of this, the lowest average cost of spillage combat action was observed for the 0 and 1 allocations, which were significantly different from the other allocations.

7. Conclusions

The created model and its application to optimize the deployment of oil pollution response resources confirms the achievement of the work’s main objective.
During the verification of this hypothesis, it was noted that the process of verifying the results obtained by means of the evolutionary algorithm requires a considerable effort, mainly in terms of carrying out pollution combat actions on the PISCES II simulator, as it is not possible to carry out such actions at an acceleration rate greater than five times.
Evolutionary algorithms can be used to solve many real problems in various areas, such as for example for modeling ship trajectory in a collision situation [36], selecting and scheduling waterway projects [23], or planning airline service networks [24]. In a short space of time, they have solved the problem of ship deployment in ports, which was difficult to solve by classical methods in the case of a large number of ships and ports. The program searches for the most appropriate allocation while allowing access to other solutions. In principle, it does not take into account action to combat pollution and obstacles from the port to the spill site, so its solution should be treated as approximate.
The use of a detailed oil spill combat action model allows an increase in the accuracy of research. However, the use of this type of simulator is not without drawbacks, because the simulations are time-consuming, and when operated with a large number of ships, it is a challenge for the user.
Looking at the single costs for a given allocation, it turns out that the sum of costs for all of the shares conducted for the current allocation is lower than the sum of costs of the best allocation proposed by the evolutionary algorithm. The average cost of carrying out rescue operations at the current location (allocation 0) of ships amounted to $1599 million USD, whereas for allocation no. 1, the figure was $1611 million USD. The difference between these costs is really small, even insignificant. The simulations carried out show that the highest costs correspond to oil spills occurring in difficult hydrometeorological conditions. The location of the spill is also important here.
The main observation after the analysis of the results is that allocation has not shown statistical importance in terms of the cost of combating the oil spill. This cost is statistically influenced by its size, the prevailing hydrometeorological conditions, and the location of the spill. Costs rise significantly as the size and deterioration of the hydrometeorological conditions increases. The study did not reveal statistically significant differences between the average costs for the five studied allocation schemes, including the current and suboptimal allocation schemes based on the evolutionary algorithm. Despite this, the lowest average costs of spill removal were observed for allocation numbers 0 and 1, which differ significantly from the other allocations. It should be added that there are very large differences for the different locations and the size of the spillage between different allocations. As a result, it is difficult to propose an optimal allocation that will be effective in any conditions, spill sizes, etc.
The model is universal in character, and has great application potential, as it enables:
  • application of any base of resources;
  • optimizing the distribution of any number of ships in any number of ports at any number of spill locations;
  • an assessment of the costs arising from any allocation of ships;
  • support for the establishment of contingency plans.
Moreover, the program can be used for any—even very diversified—coastlines, or even for restricted waters and after adding a module to avoid navigation obstacles.

Author Contributions

Conceptualization, K.Ł. and L.G.; Methodology, L.G.; Software, M.P.; Validation, K.Ł., L.G. and M.P.; Formal Analysis, L.G..; Investigation, K.Ł.; Resources, K.Ł.; Data Curation, M.P.; Writing-Original Draft Preparation, K.Ł.; Writing-Review & Editing, M.P.; Visualization, K.Ł.; Supervision, M.P..; Project Administration, L.G.

Funding

This research received no external funding.

Conflicts of Interest

The authors declare no conflict of interest.

References

  1. Cai, L.; Yan, L.; Ni, J.; Wang, I.C. Assessment of Ecological Vulnerability under Oil Spill Stress. Sustainability 2015, 10, 13073–13084. [Google Scholar] [CrossRef]
  2. Kang, J.; Zhang, J.; Bai, Y. Modeling and evaluation of the oil-spill emergency response capability based on linguistic variables. Mar. Pollut. Bull. 2016, 113, 293–301. [Google Scholar] [CrossRef] [PubMed]
  3. Cocârţă, D.; Stoian, M.; Karademir, A. Crude Oil Contaminated Sites: Evaluation by Using Risk Assessment Approach. Sustainability 2017, 9, 1365. [Google Scholar]
  4. Fingas, M. The Basics of Oil Spill Cleanup, 2rd ed.; Lewis Publishers: Boca Raton, FL, USA, 2001. [Google Scholar]
  5. Fingas, M.F. Oil Spill Science and Technology Prevention, Response, and Clean up; Gulf Professional Publishing: Burlington, MA, USA, 2011. [Google Scholar]
  6. Ornitz, B.; Champ, M. Oil Spills First Principles Prevention and Best Response; Elsevier: Amsterdam, The Netherlands; New York, NY, USA, 2002. [Google Scholar]
  7. National Research Council (U.S.), Red. Oil in the Sea III: Inputs, Fates, and Effects; National Academy Press: Washington, DC, USA, 2003. [Google Scholar]
  8. Psaraftis, H.N.; Tharakan, G.G.; Ceder, A. Optimal response to oil spills. Oper. Res. 1986, 34, 203–217. [Google Scholar] [CrossRef]
  9. Iakovou, E.; Ip, C.M.; Douligeris, C.; Korde, A. Optimal location and capacity of emergency cleanup equipment for oil spill response. Eur. J. Oper. Res. 1996, 96, 72–80. [Google Scholar] [CrossRef]
  10. Lehikoinen, A.; Luoma, E.; Mäntyniemi, S.; Kuikka, S. Optimizing the Recovery Efficiency of Finnish Oil Combating Vessels in the Gulf of Finland Using Bayesian Networks. Environ. Sci. Technol. 2013, 47, 1792–1799. [Google Scholar] [CrossRef] [PubMed]
  11. Verma, M.; Gendreau, M.; Laporte, G. Optimal location and capability of oil-spill response facilities for the south coast of Newfoundland. Omega 2013, 41, 856–867. [Google Scholar] [CrossRef]
  12. Spaulding, M.L. State of the art review and future directions in oil spill modeling. Mar. Pollut. Bull. 2017, 115, 7–19. [Google Scholar] [CrossRef] [PubMed]
  13. Transas. PISCES II Potential Incidents, Control and Evaluation System. 2008. Available online: http://www.transas.com/about/press/news/16531 (accessed on 29 June 2018).
  14. ASA. OILMAP: Oil Spill Model and Response System Overview. Available online: http://asascience.com/software/PDF/OILMAP_Suite.pdf (accessed on 29 June 2018).
  15. Marta-Almeida, M. Efficient tools for marine operational forecast and oil spill tracking. Mar. Pollut. Bull. 2013, 71, 139–151. [Google Scholar] [CrossRef] [PubMed]
  16. SMHI’s Contingency Centre. Seatrack Web Manual. 2012. Available online: https://www.smhi.se/polopoly_fs/1.15599!/Seatrack%20Web%20manual.pdf (accessed on 29 June 2018).
  17. Łazuga, K.; Gucma, L.; Perkovic, M. M/t “Baltic Carrier” accident. The reconstruction of oil spill with PISCES II simulator application. Zesz. Nauk. Akad. Morska W Szczecinie 2013, 36, 110–115. [Google Scholar]
  18. Amborski, K. Podstawy Metod Optymalizacji; Oficyna Wydawnicza Politechniki Warszawskiej: Warszawa, Poland, 2009. [Google Scholar]
  19. Dąbrowski, A. Demokracja I NP-Trudne Problemy; Instytut Matematyczny, Uniwersytet Wrocławski: Wroclaw, Poland, 2015. [Google Scholar]
  20. Rabbani, M.; Yousefnejad, H. A novel approach for solving a capacitated location allocation problem. Int. J. Ind. Eng. Comput. 2013, 4, 203–214. [Google Scholar] [CrossRef]
  21. Stachurski, A.; Wierzbicki, A. Podstawy Optymalizacji; Oficyna Wydawnicza Politechniki Warszawskiej: Warszawa, Poland, 2001. [Google Scholar]
  22. Goldberg, D.E. Algorytmy Genetyczne I ich Zastosowania; Wydawnictwa Naukowo-Techniczne: Warszawa, Poland, 1995. [Google Scholar]
  23. Wang, S.; Schonfeld, P. Genetic Alghorithms for Selecting and Scheduling Waterway Proje; University of Meryland: College Park, MD, USA, 2006. [Google Scholar]
  24. Gen, M.; Cheng, R.; Lin, L. Network Models and Optimization; Springer: London, UK, 2008. [Google Scholar]
  25. Holland, J.H. Adaptation in Natural and Artificial Systems, 1992 ed.; MIT Press: Cambridge, MA, USA, 1992. [Google Scholar]
  26. Łazuga, K.; Gucma, L.; Juszkiewicz, W. Optimal Planning of Pollution Emergency Response with Application of Navigational Risk Management. Annu. Navig. 2012, 19, 67–77. [Google Scholar] [Green Version]
  27. EMSA. Inventory of EU Member States Oil Pollution Response Vessels. 2012. Available online: http://www.emsa.europa.eu/emsa-documents/latest/download/2292/487/23.html (accessed on 29 June 2018).
  28. LAMOR. Lamor Product Reel. Solutions for Selected Scenarios; Lamor Co.: Porvoo, Finland, 2012. [Google Scholar]
  29. EMSA. Network of Stand­by Oil Spill Response Vessels and Equipment. Available online: http://www.emsa.europa.eu/news-a-press-centre/external-news/item/1439-network-of-stand-by-oil-spill-response-vessels-and-equipment-handbook-2014.html (accessed on 29 June 2018).
  30. BRISK. Additional Study. Polish Marine Areas; HELCOM: Helsinki, Finland, 2011. [Google Scholar]
  31. Gucma, L.; Przywarty, M.; Gralak, R. Evaluation of failure probability of ships on the baltic sea by means of simulation model and statistical data. J. KONBiN 2008, 5, 5–23. [Google Scholar]
  32. Netka, K. Rozlewy olejowe- jak je ujarzmiać? Środowisko 2010, 13–14, 34–36. [Google Scholar]
  33. Gucma, L.; Przywarty, M. The Model of Oil Spills Due to Ships Collisions in Southern Baltic area. Available online: http://www.transnav.eu/Article_The_Model_of_Oil_Spills_Due_Gucma,8,124.html (accessed on 29 June 2018).
  34. Admiralty Sailing Directions: Baltic Pilot Vol. II—NP19. Available online: https://www.amnautical.com/products/ba-sailing-directions-np19-baltic-pilot-vol-2#.WzyEtKsRWUl (accessed on 29 June 2018).
  35. Hasselström, L.; Consultancy, E.E.E. Costs associated with a major oil spill in the Baltic Sea; Baltic Master II 2011. Available online: https://docplayer.net/6337753-Costs-associated-with-a-major-oil-spill-in-the-baltic-sea.html (accessed on 29 June 2018).
  36. Śmierzchalski, R.; Michalewicz, Z. Modeling of ship trajectory in collision situations by an evolutionary algorithm. IEEE Trans. Evolut. Comput. 2000, 4, 227–241. [Google Scholar] [CrossRef]
Figure 1. Crossing operation between individuals.
Sustainability 10 02321 g001
Figure 2. Single individual mutation operation.
Sustainability 10 02321 g002
Figure 3. A reproduction operation using a roulette wheel, the sectors of which are proportional to the adaptation function. The red line shows a possible solution.
Sustainability 10 02321 g003
Figure 4. Graphical presentation of the problem of optimal allocation of response resources (S: ships, P: ports, R: spills, O: obstacles).
Sustainability 10 02321 g004
Figure 5. Diagram of a model of optimal allocation of response resources for combating oil spills.
Sustainability 10 02321 g005
Figure 6. ‘GeneAloc’ application interface for determining the optimal allocation of ships.
Sustainability 10 02321 g006
Figure 7. Positions of simulated oil spill [33].
Sustainability 10 02321 g007
Figure 8. Steps to optimize the allocation of oil spill response resources.
Sustainability 10 02321 g008
Figure 9. Searching for the best allocation of ships through the GenAloc application.
Sustainability 10 02321 g009
Figure 10. Comparison of costs of oil spill combating actions for allocation numbers 0 and 1.
Sustainability 10 02321 g010
Figure 11. Average unweighted spill costs under the influence of various factors.
Sustainability 10 02321 g011
Figure 12. Average unweighted spill costs for the allocation option.
Sustainability 10 02321 g012
Table 1. Coding of Chromosome.
Ship12345I
Port11333
Table 2. Hydrometeorological conditions selected for simulation.
Spill SiteWeatherCurrentWindWater Temp. (°C)Air Temp. (°C)Significant Wave Heights (m)Density (kg/m3)
V (kn)K (°)V (m/s)K (°)
ŚwinoujścieGood0.25SE2.0N1712–200.31006
ŚwinoujścieBad0.25SE5.7N1712–201.01006
KołobrzegGood0.25SE2.0N1712–200.31006
KołobrzegBad0.25SE5.7N1712–201.01006
ŁebaGood0.25SW2.0N1712–200.31006
ŁebaBad0.25SW5.7N1712–201.01006
Table 3. Results of stage I of optimal allocation of response resources.
No.Ship’s nameAllocation 0 (Actual)Allocation 1 (the Best)Allocation 2 (Middle)Allocation 3 (Middle)Allocation 4 (Worst)
1Kapitan PoincGdyniaKołobrzegŚwinoujścieŚwinoujścieŚwinoujście
2Czeslaw IIŚwinoujścieKołobrzegKołobrzegGdyniaŚwinoujście
3ZodiakGdyniaKołobrzegKołobrzegGdyniaŚwinoujście
4OrkanGdyniaKołobrzegKołobrzegKołobrzegŚwinoujście
5PassatŚwinoujścieKołobrzegKołobrzegŚwinoujścieŚwinoujście
6Santa BarbaraGdyniaKołobrzegŚwinoujścieŚwinoujścieŚwinoujście
7KambrGdyniaKołobrzegŚwinoujścieŚwinoujścieŚwinoujście
8BazaltGdyniaKołobrzegGdyniaGdyniaŚwinoujście
9AphroditeGdyniaKołobrzegGdyniaKołobrzegŚwinoujście
Table 4. Encoding the name of simulation.
1spill site number (location)
3500_IFO180spill size_substance type
dobraweather conditions

