The paper is a companion to other recent analyses of President Trump’s tweets on the topic of climate change and his State of the Union Address 2018 [
1,
2]. It features the use of an R library package called ‘sentiment’. The ‘sentiment’ package was written by De Vries (2012), is now archived from the current release of R, and can be loaded from ‘Github.com’. The details of the seniment package are available in De Vries (2012) [
3]. It is a dictionary-based method which calculates sentiment scores using affinity dictionaries. The program splits strings into words (by default at space), calculates an affinity score for each word, and returns the average, using a scale from +5 to −5.
The paper uses this package because it is more finely grained, categorizes five different sentiment emotions, namely joy, sadness, anger, fear and surprise, and reveals greater information about the emotional tenor of the text or string that is analysed.
The process of performing sentiment analysis requires textual input in a machine-readable format. Pre-processing is required to transform the text into single words, followed by what are common pre-processing steps: stopword removal, stemming, removal of punctuation, and conversion to lower case.
The limitations of the analysis should be borne in mind. The context of ‘natural language processing’, of which sentiment analysis is a component, is important. The use of sarcasm and other types of ironic language, including puns and backhanded compliments, are inherently problematic for machines to detect, when viewed in isolation. This is a potential issue, in particular, in the analysis of President Trump’s tweets. Nevertheless, current methods are revealing, as will be seen in the next section which presents the results.
2.1. Results of the Analysis
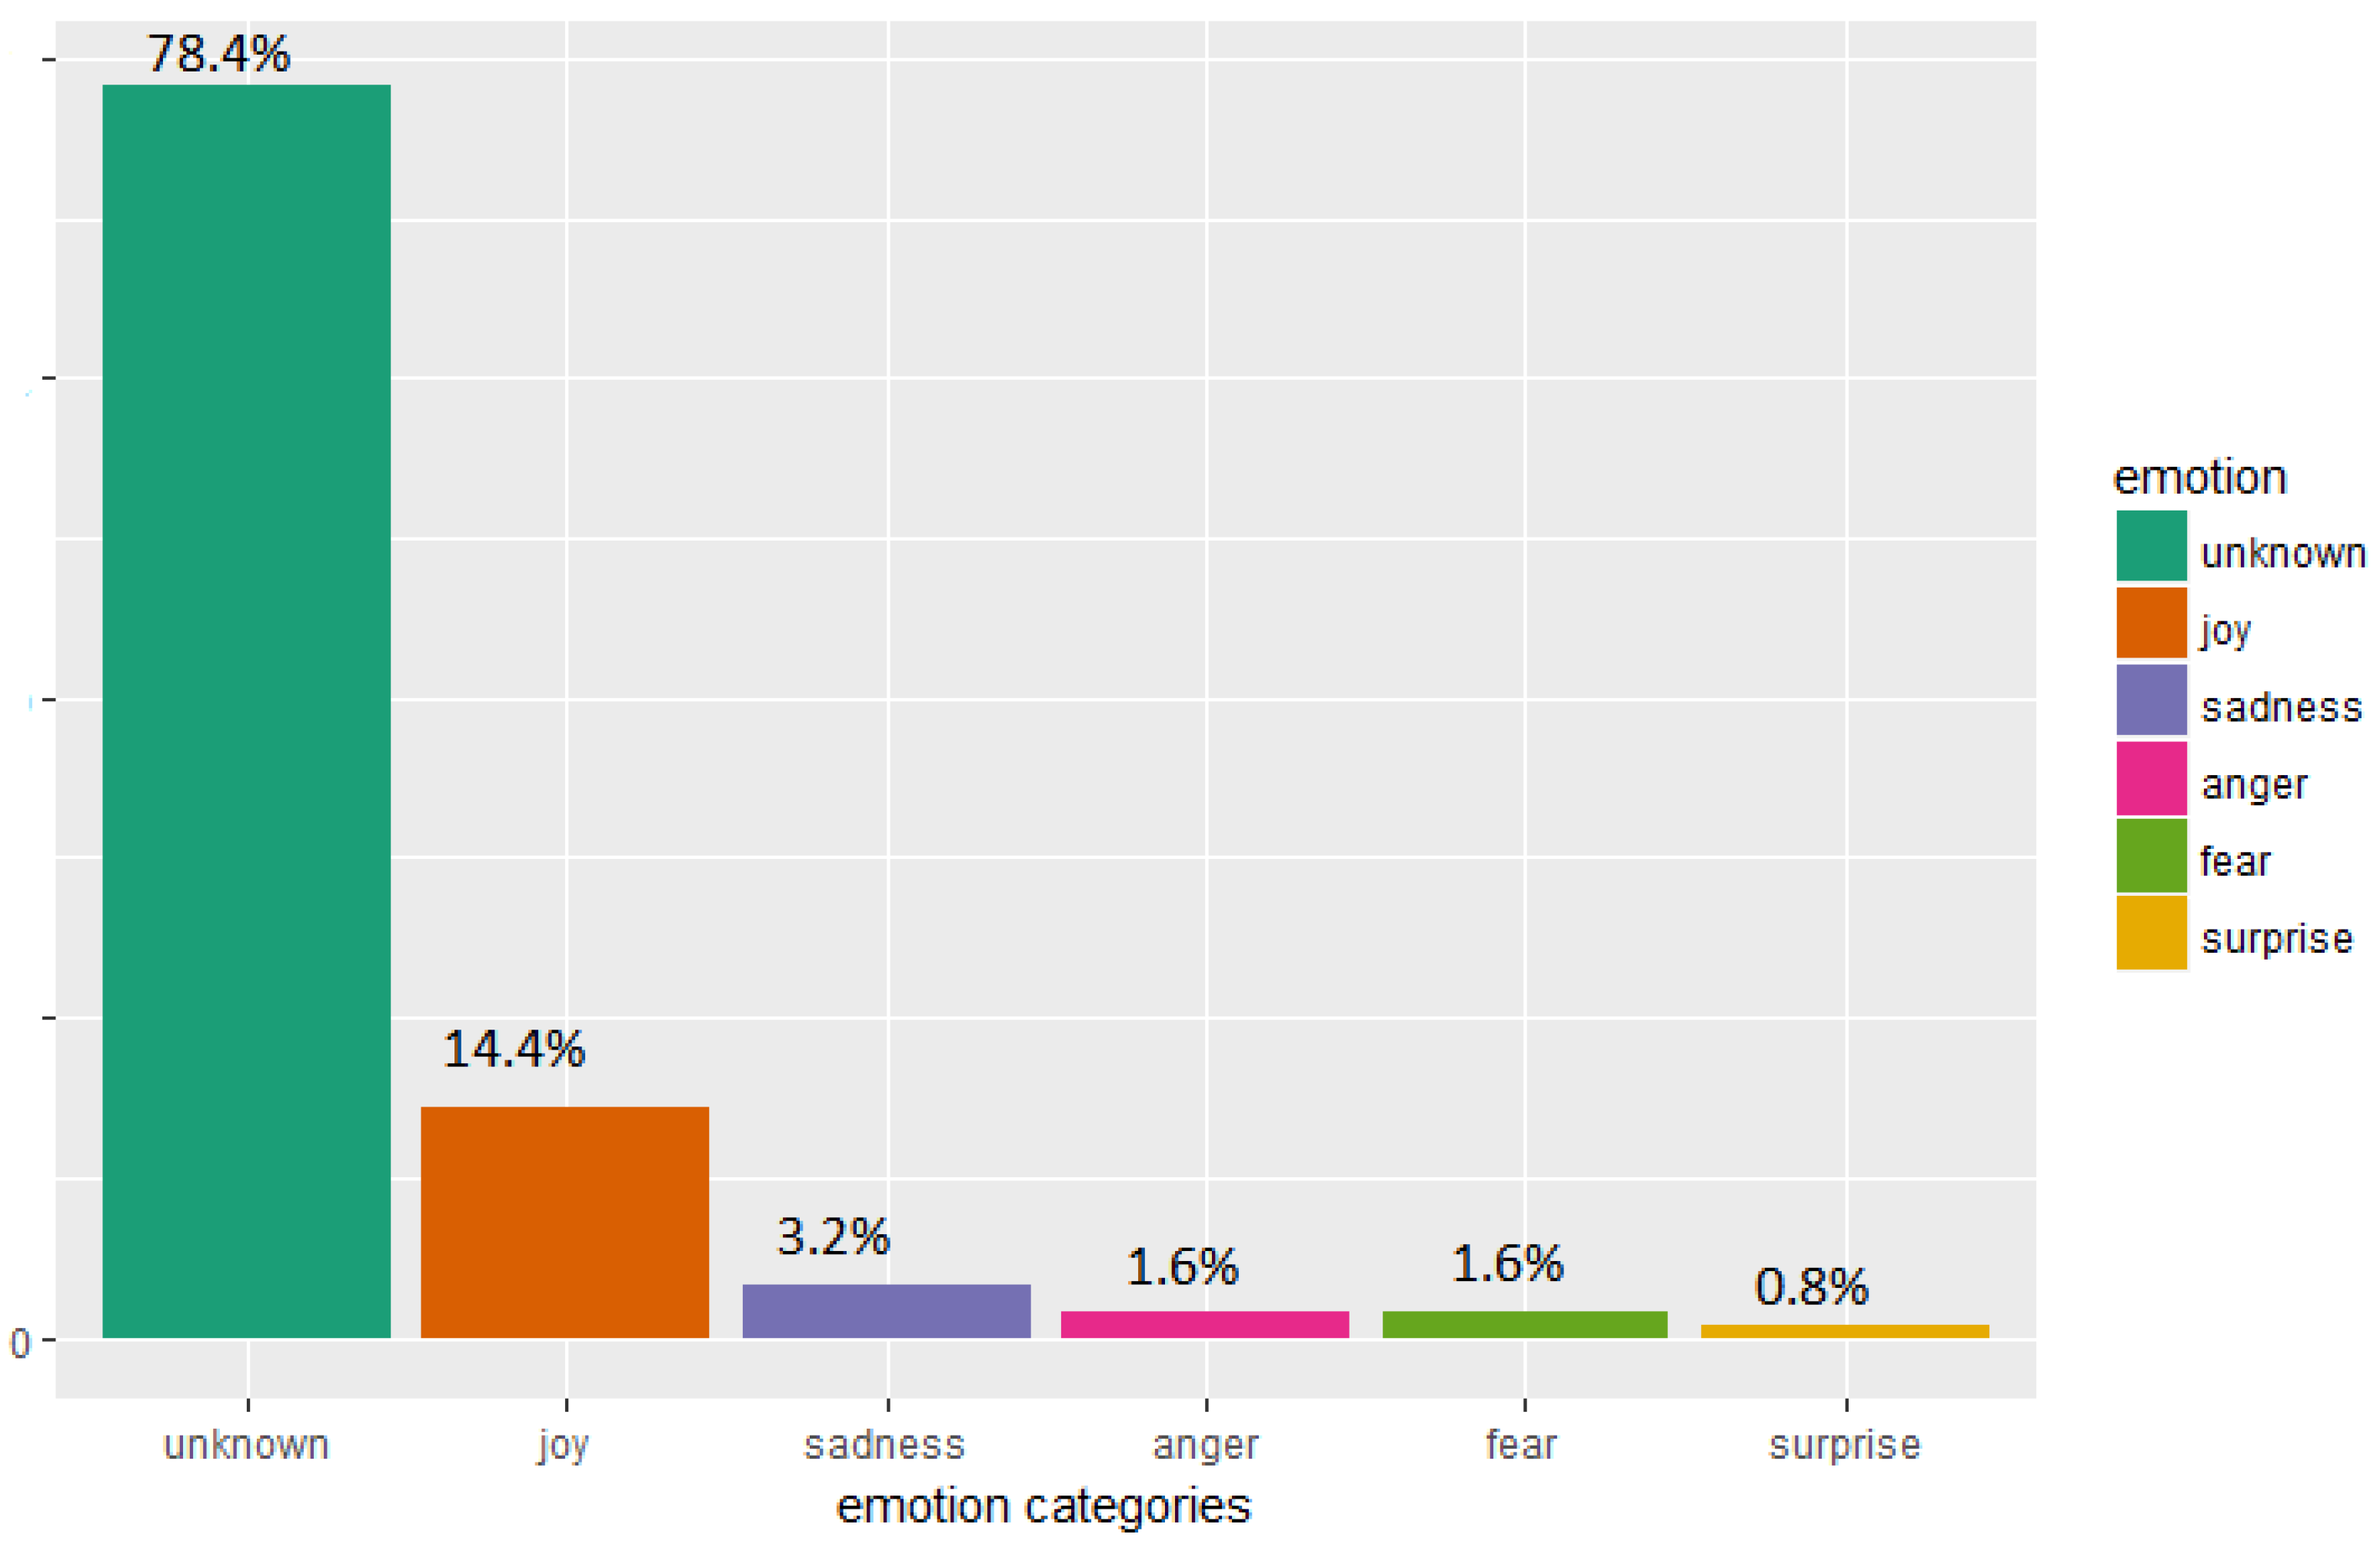
The process commences with the results of the application of the sentiment package to President Trump’s 125 tweets. The emotional content of these is shown in
Figure 1 . Ignoring the ‘unknown’ category, the predominant emotion recognised in
Figure 1 is ‘joy’, which accounts for 14.4 per cent of the total, followed by ‘sadness’ at 3.2 percent. ‘Anger’ and ‘fear’ both account for 1.6 percent, and ‘surprise’ accounts for 0.8 per cent. 78.4 per cent of the tweets are not classified, but 14.4 per cent is classified as being ‘joy’, which is a positive emotion.
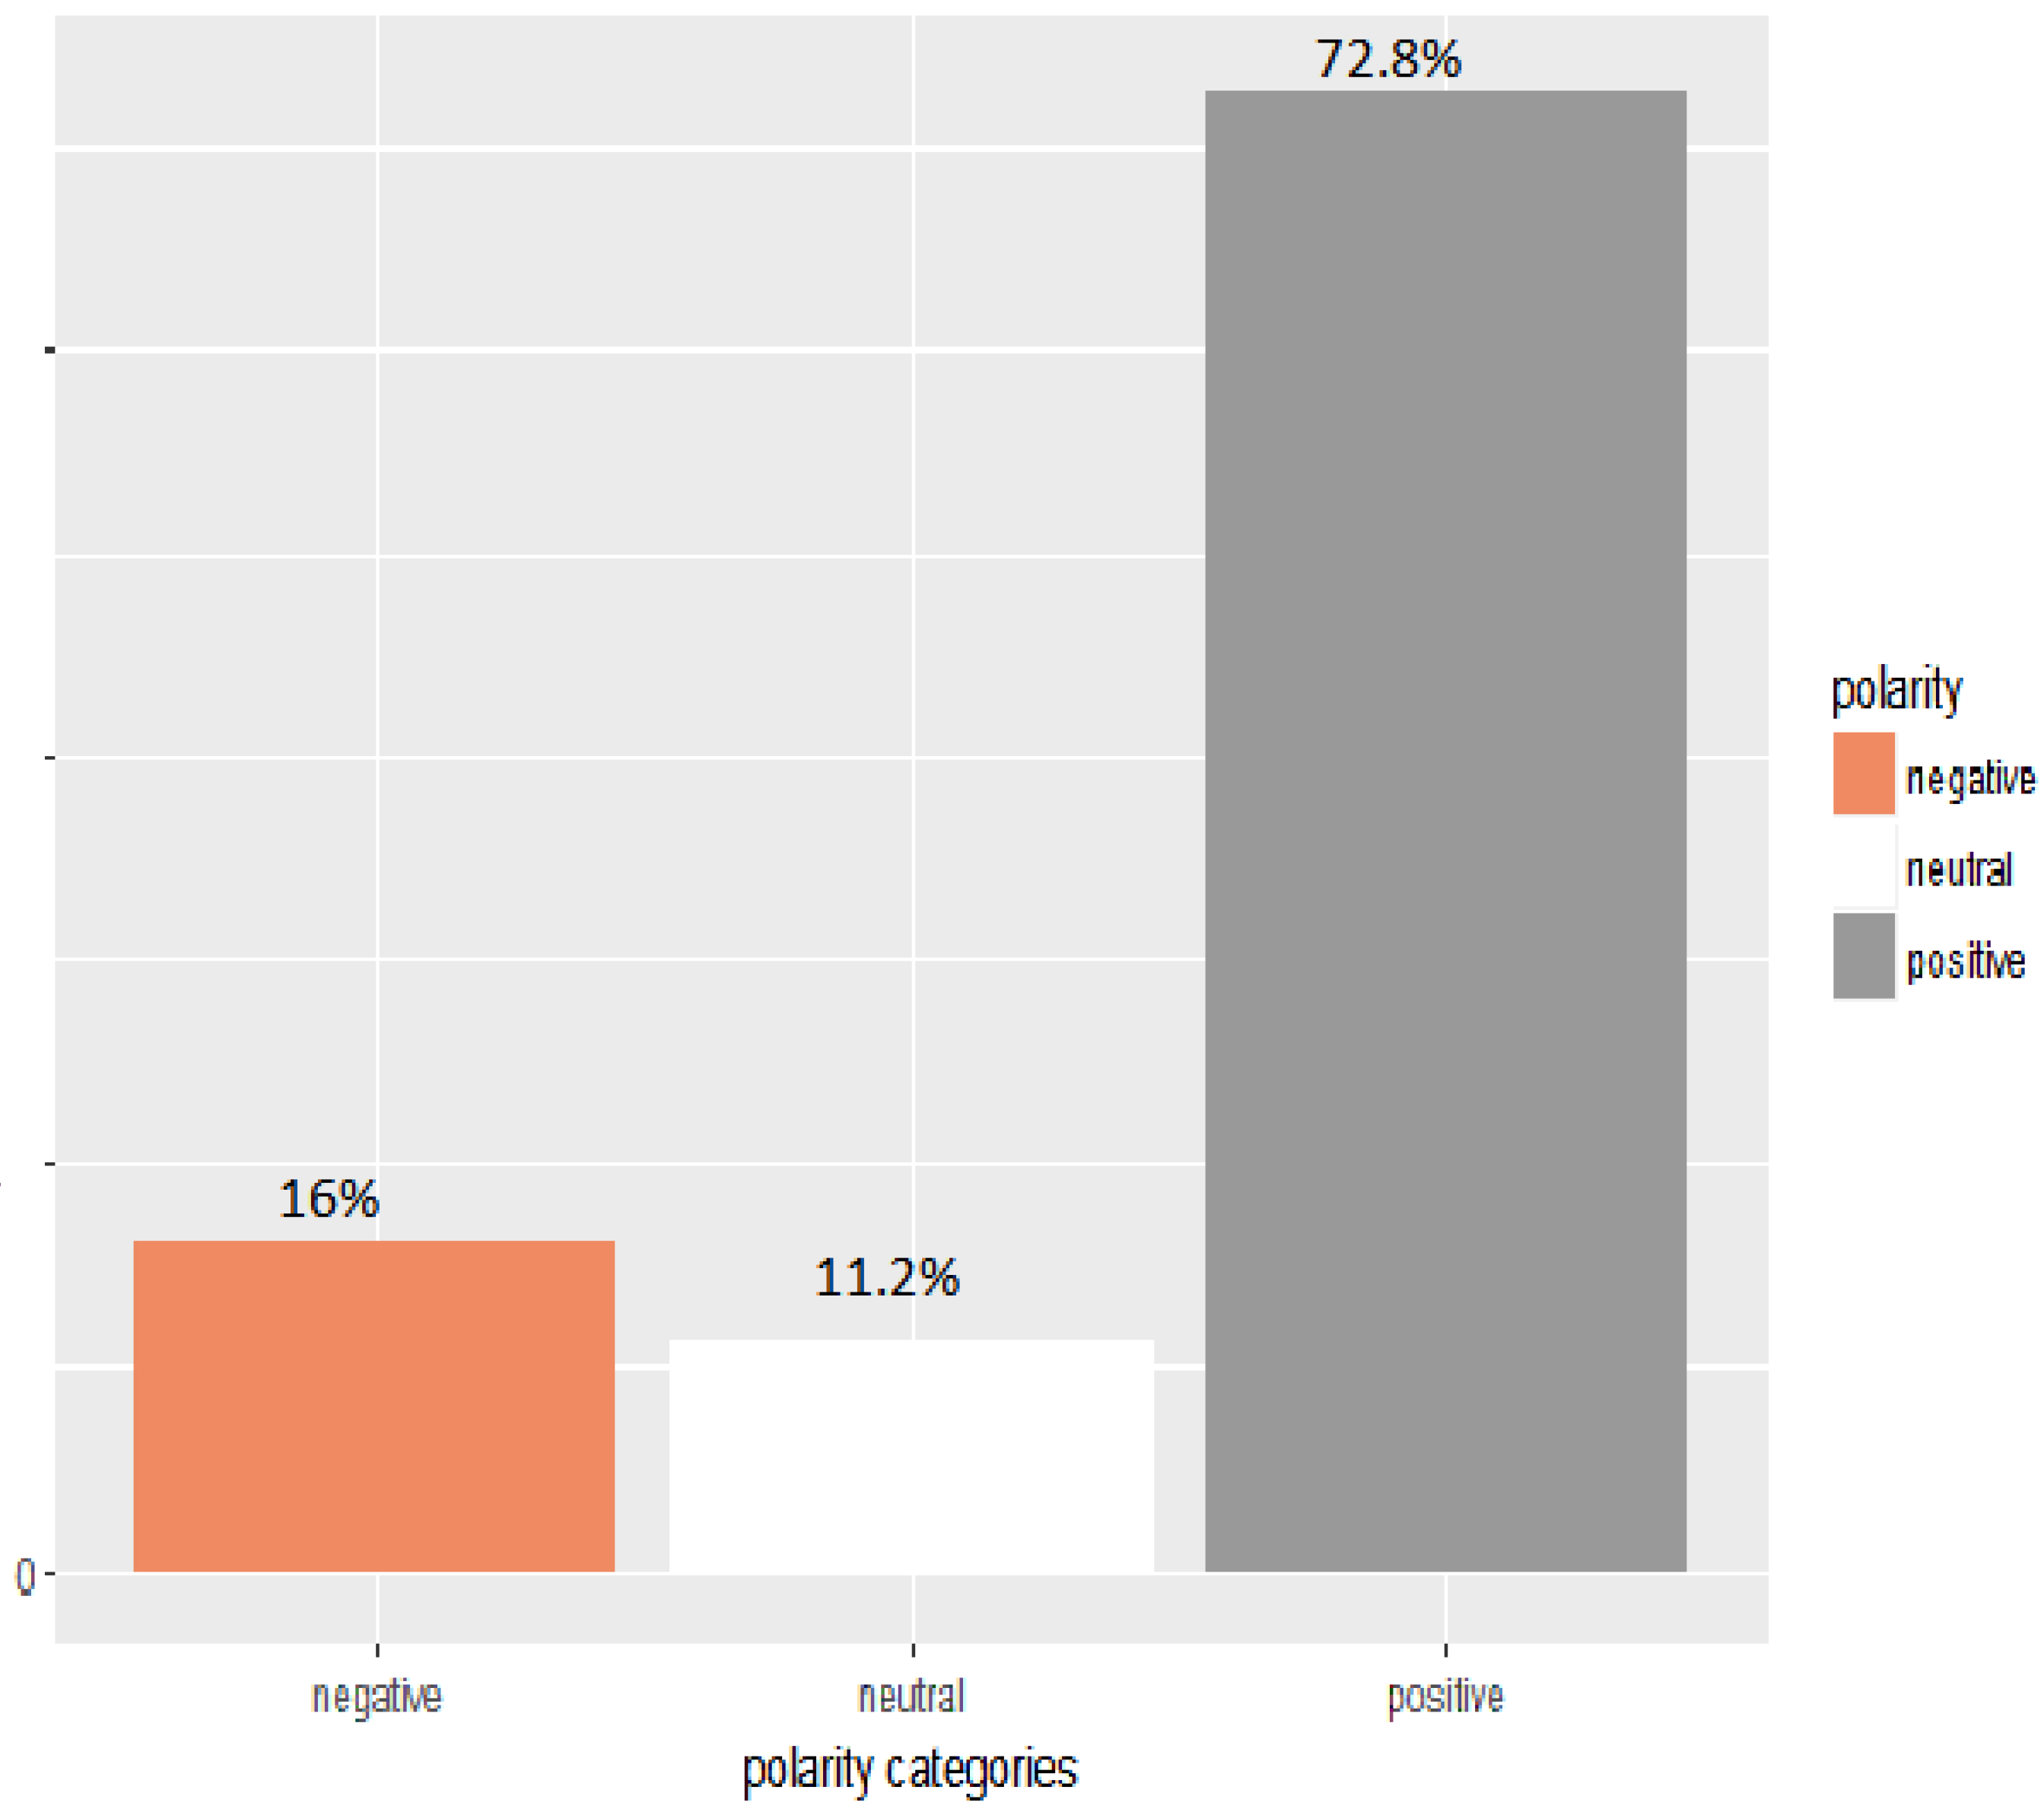
Figure 2 classifies the tweets by President Trump according to whether they are negative, neutral or positive. The majority of the classifications in
Figure 2 is positive, accounting for 72.8 per cent, while 16 per cent is negative.
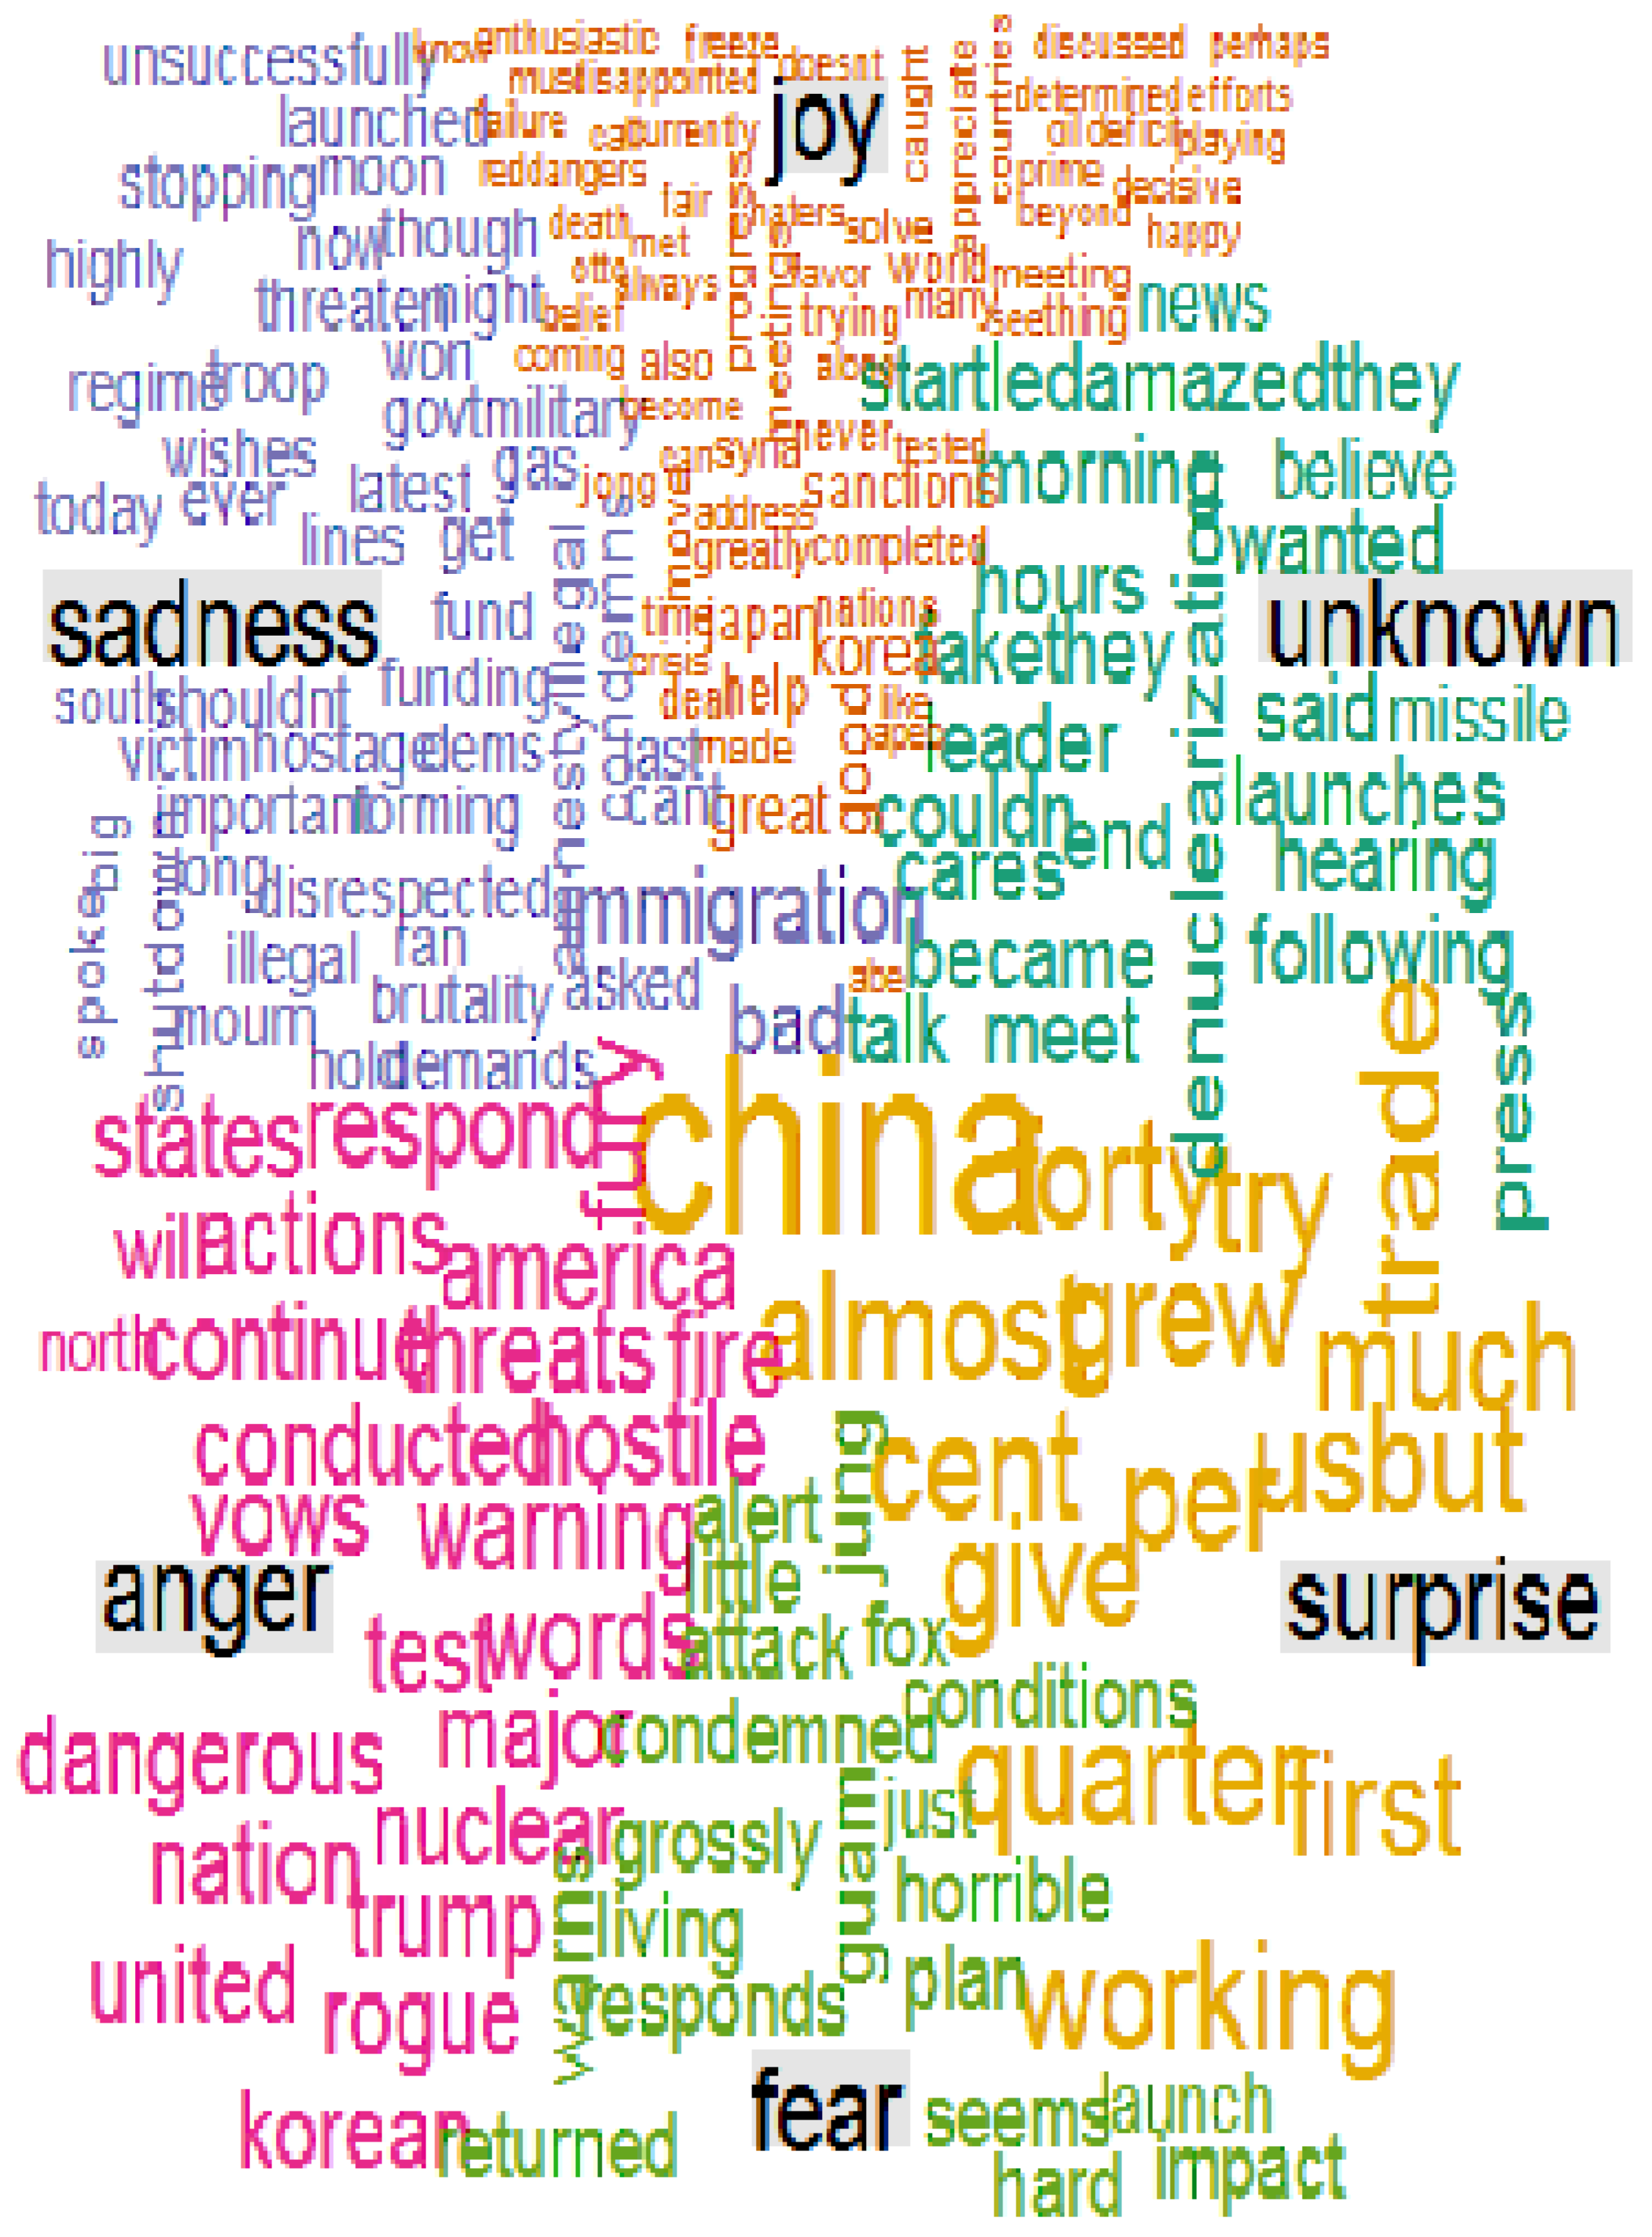
Figure 3 shows a word cloud analysis of Trump’s tweets. A word cloud is another form of visual representation of text data in which tags are single words, and their relative sizes and colours represent their weighting or importance in the context of the text considered.
The most prominent words in the word cloud in
Figure 3 are ‘China’, ‘trade’, ‘US’, ‘working’ and ‘percent’. If we move around the cloud in an anti-clockwise manner, words in the ‘joy’ section include ‘enthusiastic’, ‘freeze’, ‘fair’, ‘Syria’, ‘sanctions’, ‘korea’, ‘discussed’, ‘completed’, ‘deal’, and so forth. In the ‘sadness’ section, we have ‘unsuccessful’, ‘launched’, ‘moon’, ‘threaten’, ‘regime; ‘military’, ‘gas’, ‘victim’, ‘hostage’, ‘immigration’, ‘brutality’, and so on.
In the ‘anger’ section below, we have ‘America’, ‘threats’, ‘respond’, ‘hostile’, ‘conducted’, ‘nuclear’, ‘test’, ‘dangerous’,‘rogue’, ‘korean’, and so on. In the ‘fear’ section, we see ‘alert’, ‘attack’, ‘condemned’, ‘grossly’, ‘launch’, ‘impact’, and so on. In the ‘surprise’ section, we have ‘China’, ‘working’, ‘grew’, ‘US’, ‘per cent’, ‘trade’, and so forth. The ‘unknown’ section has a diverse grouping of words, with ‘news’ and ‘sadness’, ‘launches’, ‘talk’, ‘meet’, ‘press’, and ‘working’, given prominence.
2.2. Bootstrapped t Tests
In a companion paper, Allen et al. [
1] use sentiment analysis to analyse some of President Trump’s tweets on the topic of climate change, takn from 2011 to 2015. On a global issues scale, it is worth comparing the sentiment scores of his tweets on North Korea and Supreme Leader Kim Jong-Un, with his tweets on climate change. We use bootstrapped
t tests because the number of tweets analysed are different, namely 125 in the North Korean sample and 115 in the climate change sample.
The results presented in
Table 1 show that there is no significant difference in the bootstrapped
t tests, using 1000 samples with replacement.
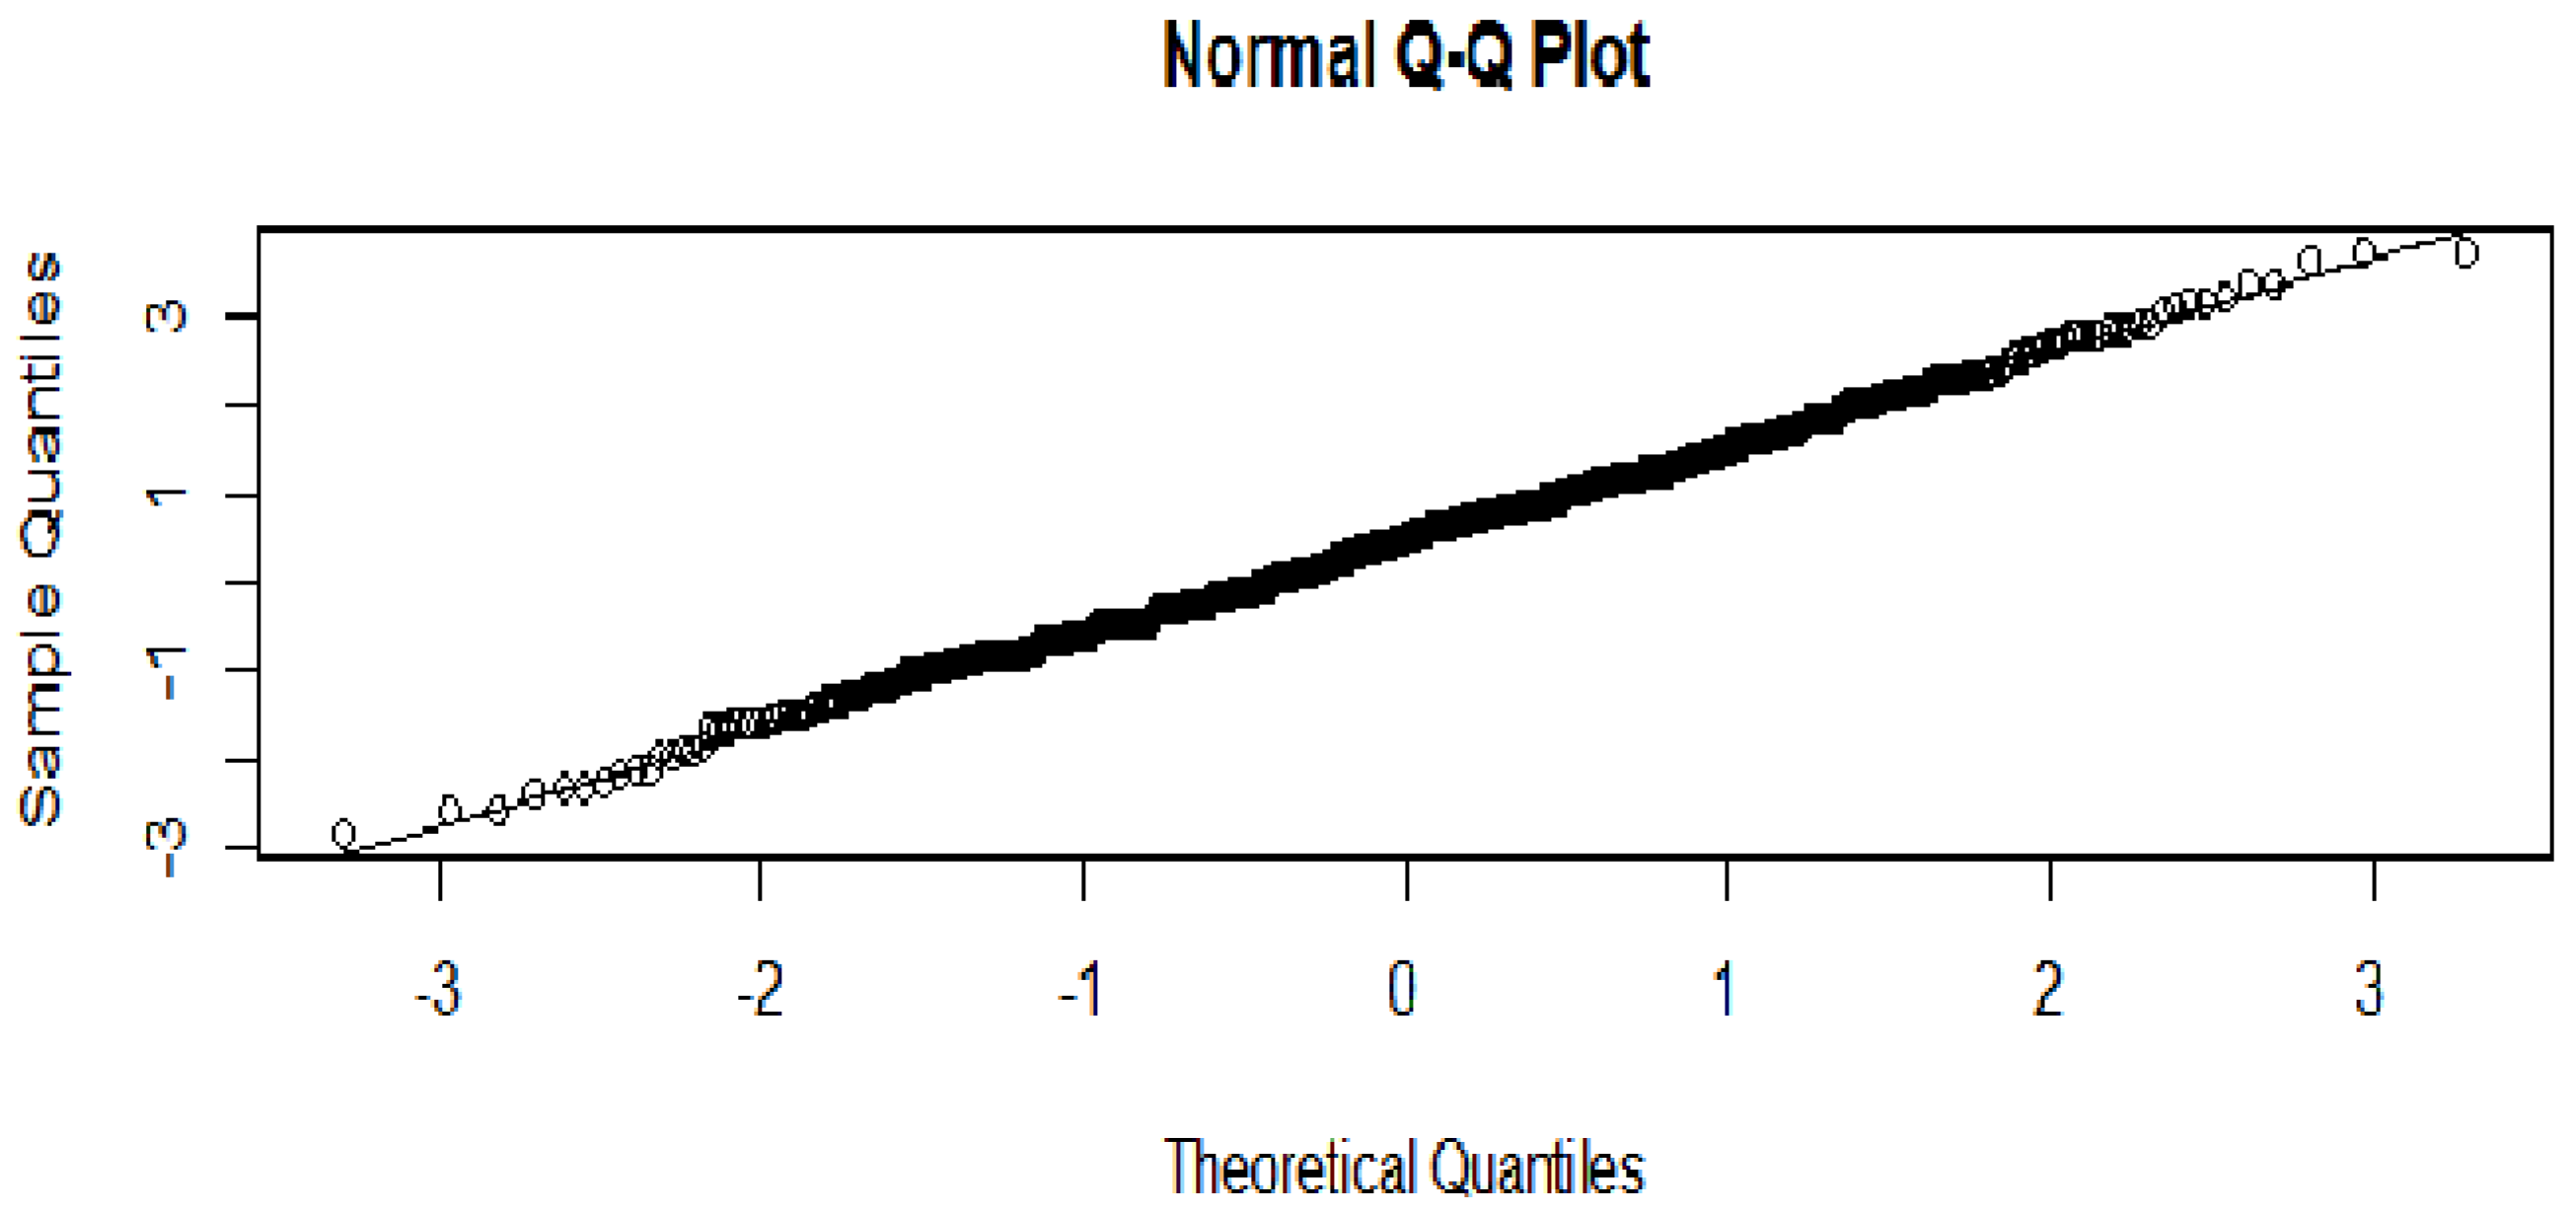
Figure 4 shows that the bootstrapped
t test vector QQ plot is consistent with a Gaussian distribution.
A comparison was also made of the ‘polarity’ scores for President Trump’s North Korean and Supreme Leader Kim Jong-Un tweets and his climate tweets. The mean polarity score for his North Korean Supreme Leader Kim Jong-Un tweets is 13.59, and 9.46 for his climate change tweets. The results are shown in
Table 2. In terms of the results of the bootstrapped
t tests, his tweets on North Korea have significantly higher positive polarity scores than his tweets on climate change.


