Article

Does Migrant Status and Household Registration Matter? Examining the Effects of City Size on Self-Rated Health

Guangdong Provincial Key Laboratory of Urbanization and Geo-Simulation, School of Geography and Planning, Sun Yat-Sen University, Guangzhou 510275, China
*
Author to whom correspondence should be addressed.
These authors contribute equally to this work.
Sustainability 2018, 10(7), 2204; https://doi.org/10.3390/su10072204
Submission received: 11 June 2018 / Revised: 23 June 2018 / Accepted: 26 June 2018 / Published: 27 June 2018
(This article belongs to the Section Sustainable Urban and Rural Development)

Abstract

:
Rapid urban population growth, especially in the last three decades, has begun to present a serious threat to living conditions, and posing increased risks to human health. Investigating the relationship between population size of city areas and self-rated health (SRH) can, we argue, provide insights for the management of population growth and improving SRH. This study employed a multilevel analysis to reveal the effects of city size on SRH both from migrant status and household registration perspectives, using data from the Chinese General Social Survey (CGSS) for 2013. The results indicate that an inverted U-shaped relationship exists between city size and SRH. Income and population density were shown to constitute significant positive impact drivers in relation to SRH. In contrast, migrant status and household registration exerted a significant negative effect on SRH. While the SRH status of migrants was not influenced by city size, city size was found to influence the SRH of individuals differently in different regions (i.e., eastern, central, and western parts of China). The results will be helpful in understanding the effect of the dynamics of city size on SRH in China, and will assist the Chinese government in employing effective strategies to improve SRH status.

1. Introduction

Rapid population growth has been witnessed around the world in the last three decades, not least in China [1]. China’s urbanization level, which is calculated as the ratio of urban population to total population, increased from 17.9% in 1978 to 56.1% in 2015, and continues to grow. This growth reflects the migration of a vast number of people to urban regions, as urbanization has promoted economic growth which, in turn, has resulted in increases in urban populations. Previous studies have argued that international airports, and the large cultural facilities and sports facilities that produce high-level social welfare, can be established when cities become “big enough”, a development which benefits the health status of individuals [2]. Greater city sizes can also promote economic growth by increasing labor efficiency through the agglomeration of economic activities [3,4]. For example, scholars have argued that larger cities increase employment opportunities for individual laborers and labor efficiency [5,6]. Previous analyses have further suggested that, if characterized by a high level of environmental awareness, large and highly-concentrated populations are able to benefit from economic growth in ways that improve the environment and enhance the living situation [7]. Moreover, some researchers have suggested that the process of urban agglomeration, wherein cities with a population of several million inhabitants are linked to a much larger central city, is a good spatial structure for the development of smaller cities. The scaling relationships between population and supercreative employment per MSA (Metropolitan Statistical Area) in 2003 for the US is superlinear (in which the exponent β = 1.15 > 1), and the scaling relationships between population and total wages per MSA in 2004 for US is superlinear (in which the exponent β = 1.12 > 1), too. It means that increasing population size will be returned by innovation, information, or wealth [8]. Dwellers’ needs would impact on urban planning. For example, the city will plan parks, cycle paths, and squares due to citizens enjoying walking or using bikes than using cars. Therefore, more people may need more infrastructure [9]. However, the expansion of cities does not only result in benefits, it also has effects that include, among other things, increased consumption of resources, greater variation in living conditions, environmental pollution, car congestion, scarcity of public services, and a close proximity of living spaces that can lead to increased risks to human health [10,11,12,13,14,15]. For example, a study demonstrated that city size has a negative relation to individual happiness, exacerbating mental problems and reducing human health, and the pollution peaks always occur in large cities [2,16]. Researchers use the US as an empirical case to identify the difference of happiness status between urban and rural areas. The results show that the happiness increases outward from large central cities to small-town or rural areas due to the difference of size, density, and heterogeneity between urban and rural areas [17]. The findings of other studies also confirm this statement. For example, researchers utilized population size, xnorcsiz, and srcbelt to define city size and to calculate its influence of happiness in the US, and the results also show that larger cities are less happy than smaller places [18]. Evidence from the 27 member states of the European Union also found that the coefficient for cities to happiness is −0.2185, while small towns have a coefficient 0.0120. Moreover, these results further argued that the highest level of expected happiness is 1.7% lower for urban dwellers than small-town dwellers [19]. The high population level may make the Systemic Retroactive game into a negative effect both for urban planning and citizens’ behavior, such as pollution, daily wasting of time for commuting, low quality of life, urban sprawl or density, etc. [9]. Previous studies have also found the existence of an inverted U-shaped relationship between city size and economic growth, whereby an urban economy first improves, and then declines in response to increasing city sizes due to overcrowding effects [20,21]. Especially when the services sector is the dominant industrial sector, the influence of city size on urban productivity by scale impact in China will be larger [21]. Drawing on this previous literature, the hypothesis that is tested in the present study holds that an inverted U-shaped curve exists between city size and self-rated health (SRH). This means that human SRH status is expected to first increase along with the growth of a given city, then show a downwards trend as the city increases in size and sprawls. A better understanding of the impact of city size on SRH will be of benefit in the task of improving human health.
Due to the insight that SRH functions as a more accurate predictor of mortality than medical records, a growing body of literature has explored the potential drivers of SRH [22]. These previous researchers found that the determination of SRH includes both physical factors and psychosocial factors. For example, scholar examined the effect of socioeconomic factors and material deprivation on SRH, found that education and material deprivation maintained a strong relation to SRH [23]. Some scholars employed provincial-level data to explore the relationship between income inequality and SRH [24]. Their findings show a notable disparity among provinces with different income levels. Similar results can be found in other recent studies, which have shown that income inequality impacts on SRH through the influence criteria of temporality, biological plausibility, and consistency [25]. Further, it has been found that employment, income, and the healthcare system will be negatively influenced during periods of economic recession, a development which results in deteriorating SRH [12]. Using the data from the 2014 China Labor-force Dynamics, researchers found that a positive linear relationship between individual’s SRH and economic development and an inverted U-shaped relationship between individual’s SRH and urbanization rates [26]. Other scholars also reveal that urbanization raises the probability of reporting poor health [27]. Some scholars, however, have argued the contrary: rapid accelerated urbanization improves health [28]. Similar findings were also demonstrated by other researchers, which argued that living in more advanced communities increases the risk of chronic disease and unhealthy lifestyles, creating a pathway through which urbanization impacts individual’s health in China [29]. Environmental pollution has become a stigmatic issue in the face of China’s achievements in urban and economic development. It poses a serious health risk for Chinese citizens, especially when taking the form of air pollution, which increases the risk of cardiopulmonary, lung cancer, stroke, ischemic disease, hypertension, heart rate variability and, ultimately, mortality [30,31,32,33]. Jaana et al. (2014) utilized more than 15,600 samples in order to examine the association between traffic noise and SRH, finding that noise levels beyond 60 decibels (dB) resulted in poor SRH status in men (although no association was found between these factors in women) [11].
In addition to physical factors, impact assessments performed in relation to psychosocial factors have established an association between SRH and factors such as social capital, perceived control, and democratic conditions. Social integration can enhance the wellbeing of a population by providing people with a psychosocial network and increasing access to healthcare mechanisms [34,35]. At the same time, those living in a situation characterized by a lack of social trust are exposed to higher health risks [36]. Perceived control has been demonstrated to be associated with higher health and wellbeing, ameliorating the effects of material deprivation by increasing integration in the psychosocial and social environment [37,38]. Previous researchers have also suggested a relationship between democracy and SRH [39]. For example, researchers employed the multilevel World Health Survey (2002–2004) data referring to approximately 3000 individuals in 67 countries in order to explore the relationship between democratic governance and SRH, finding that the political organization of societies is an important determinant of population health [40]. In addition, we also note that variables affecting SRH also relate to individual attributes including age, gender, height, weight, and ethnicity. Literature that focused on migrants argued that migration decisions not only depend on employment conditions, but also other things, such as psychological costs of moving, education conditions, crime, and norms [41]. The studies that refer to self-rated health of migrant populations show that the health status of migrants tend to decline from the time of arrival, with a higher risk to transition to poor health than native-born residents [42,43,44].
Given that previous studies investigated the relationship between determination and SRH are mainly for all individuals, all regions, or groups with different incomes, researchers have focused on the impact on SRH disparities between groups with respect to migrant status and regions. More importantly, few studies have explored the impact of city size on SRH. Addressing this gap, the aim of present paper is to investigate how the health status of migrants is affected by city size, and whether regional disparities exists within the SRH status of individuals. Differences in how urbanization, economic growth, and city size affect SRH may, we believe, exist between migrants and non-migrants, or between individuals with different household registration locations (that is, between regions). Given that urbanization patterns differ sharply among the western, central, and eastern parts of China, previous studies have suggested that people living in provinces with greater income inequalities are at a higher risk of poor health, compared with provinces characterized by modest income inequalities [24]. In this research, migrant status was measured by means of data on whether residents of a given city live in rented housing or not. Household registration was confirmed by their hukou registration, and whether the registered city belongs to Western, Central, or Eastern China.
In short, this paper employed national survey data obtained from the Chinese General Social Survey (CGSS) for 2013. Then, we utilized a multilevel analysis to reveal the effect of city size on SRH from the perspectives of migrant status and regional disparity. The results of this analysis are beneficial to policy-makers in the task of formulating appropriate measures to enhance human health.

2. Methodology and Data

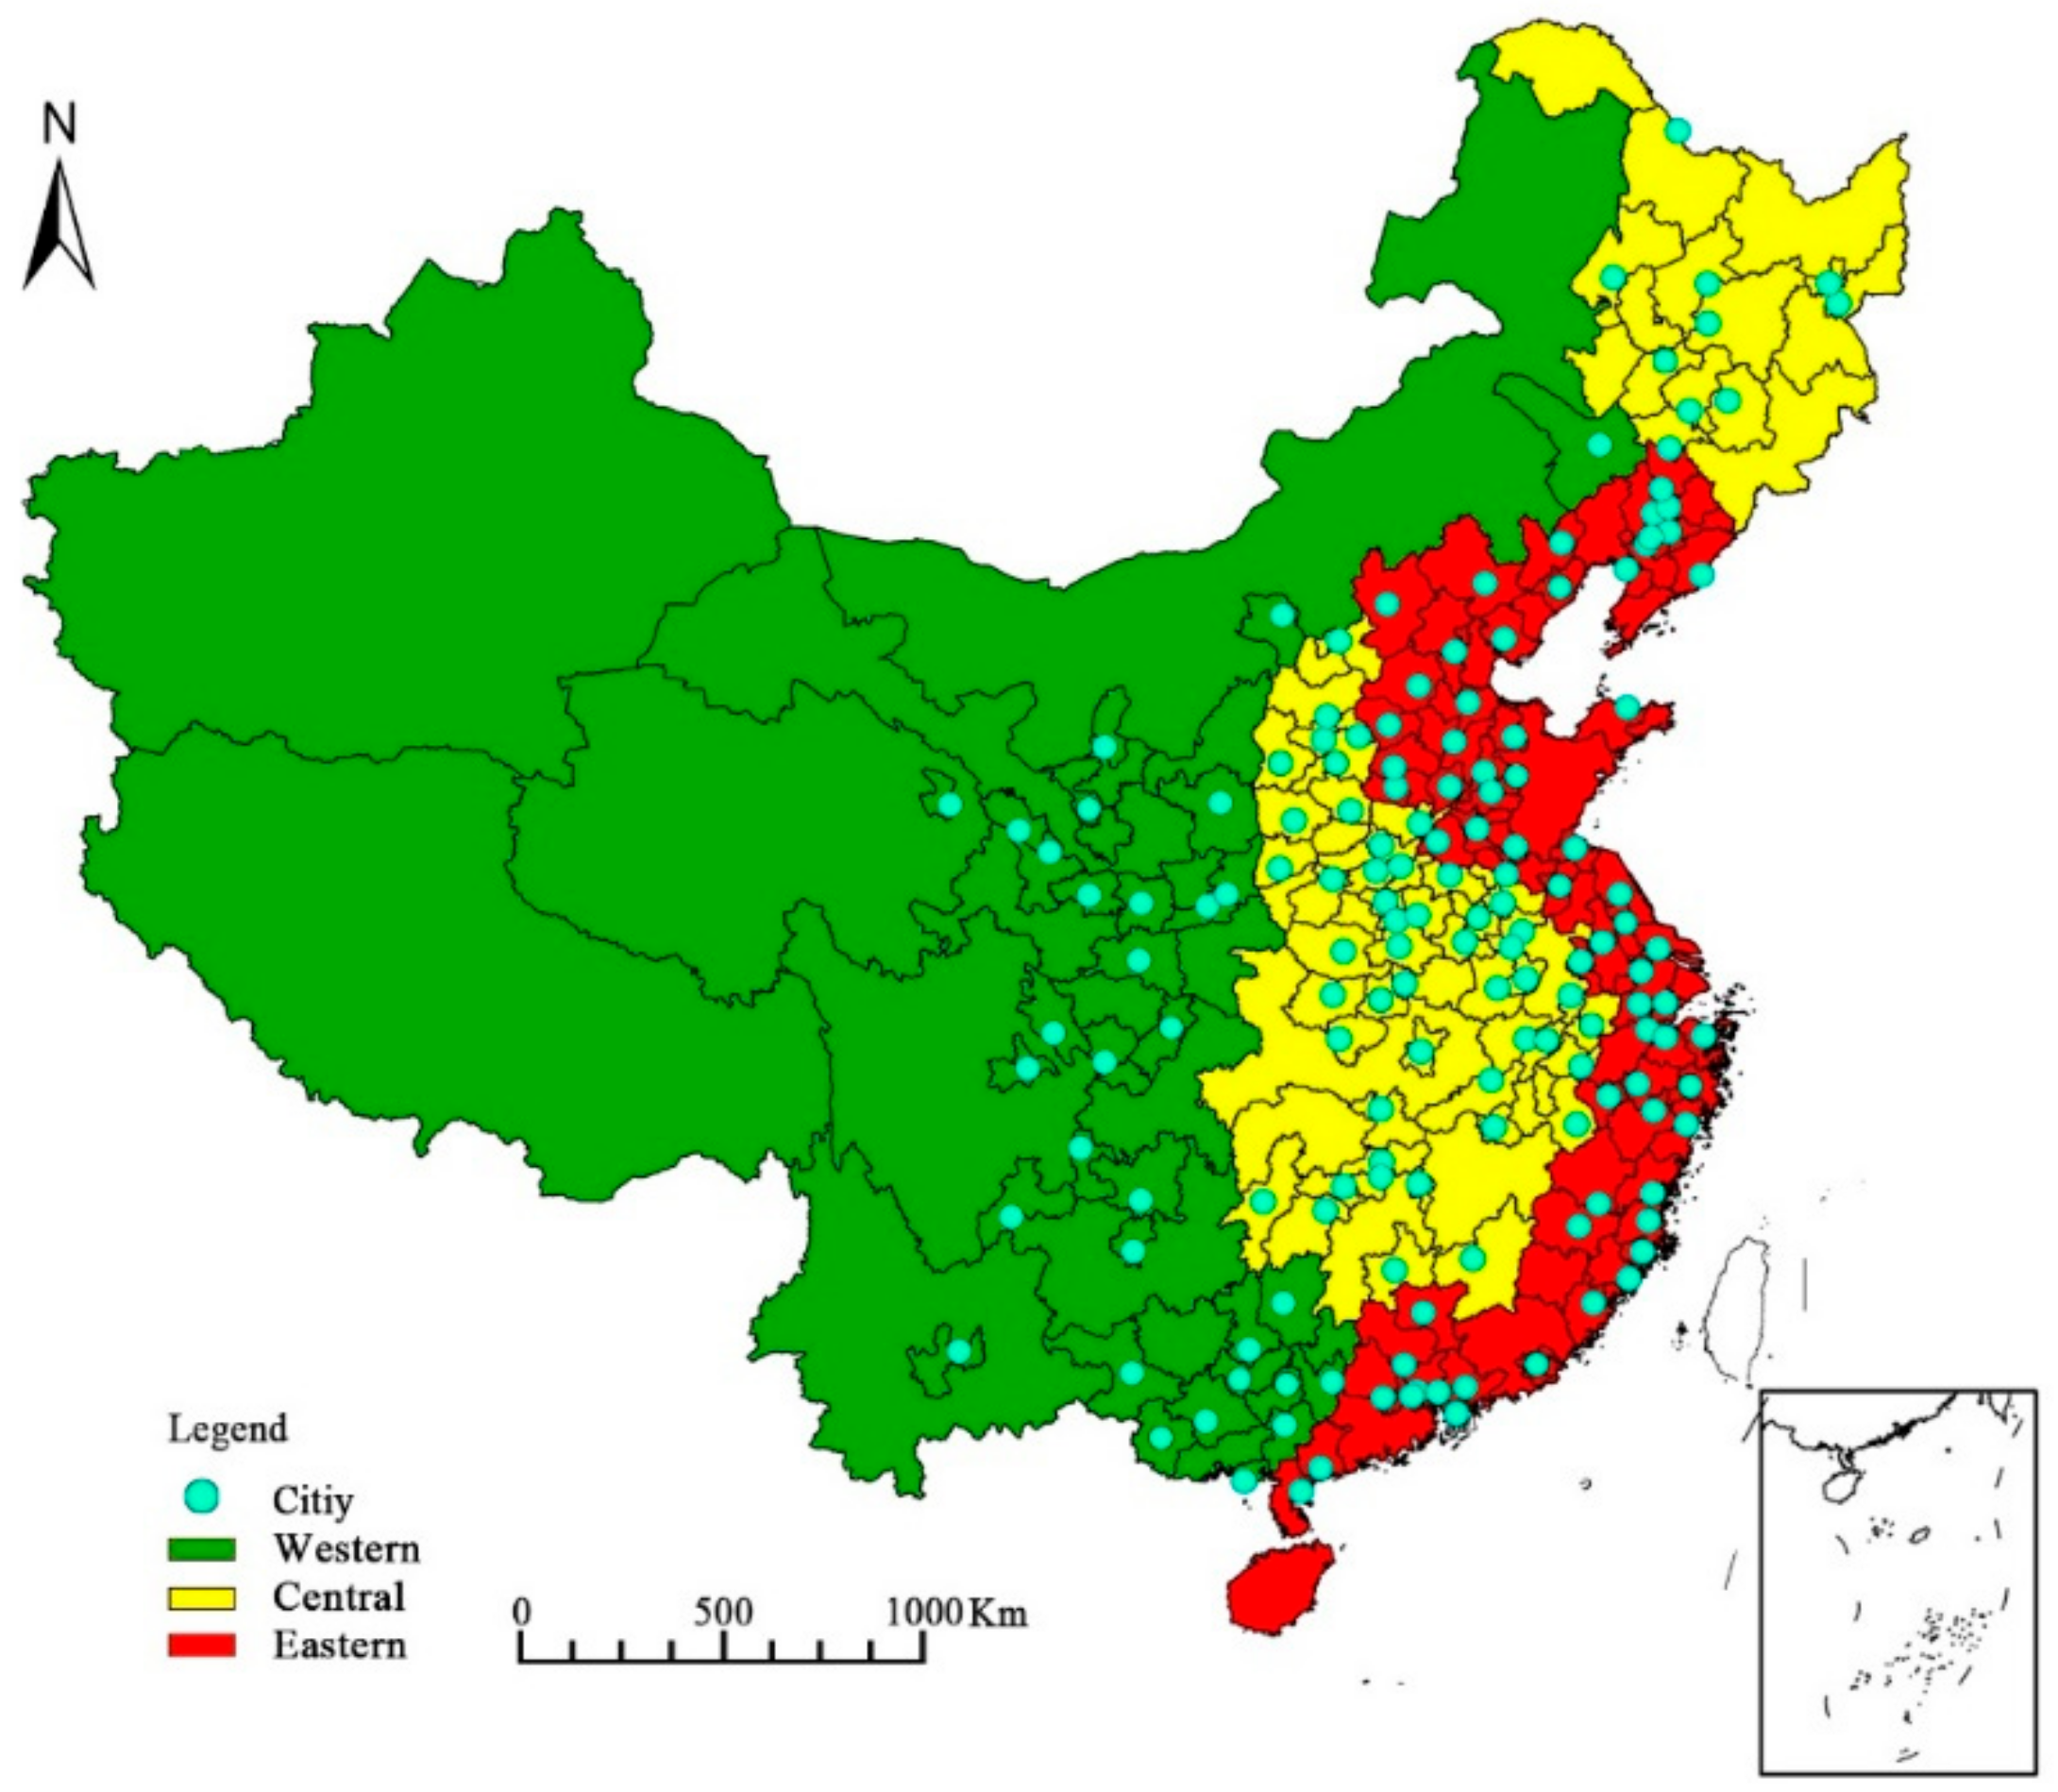
2.1. Data and Data Sources

The study used cross-sectional data taken from the CGSS for 2013 (CGSS 2013 employed four stages to collect data: first, the survey sampled 100 county-level administrative units in China; second, it sampled four neighborhood or village committees in each of the 100 units sampled; then 25 households were selected in each neighborhood or village committee; and, finally, one person in each of the 25 households was asked to respond to the survey. Finally, CGSS 2013 received information from 11,438 adults across 28 provinces by means of a face-to-face interview). The CGSS is a national, comprehensive survey, overseen by the National Survey Research Center (NSRH) of Renmin University of China, which gathers a great deal of information on societal, community, household, and individual characteristics. The dataset was collected using random sampling from 11,438 adults across 28 provinces that vary considerably in terms of their geographical locations, social status, economic conditions, environment, happiness, SRH, and many other indicators. The CGSS 2013 provided most of the variables in our model, with the exception of city size, per capita gross domestic product (GDP), population density, per capita green area, and hospital beds, which were derived for each city from the China City Statistical Yearbook, the China Urban Construction Statistical Yearbook, and the City Statistical Yearbook. Table 1 shows statistical information for each of the variables.
This study aimed to explore the relationship between city size and SRH from the perspectives of migrant status and household registration. The sample data was taken from respondents who live in urban neighborhoods, and did not include rural respondents. Data for the prefecture-level city where the county-level administrative unit was located was used. The size of the population in each district was used to represent city size, and whether the individuals were tenants of rental housing or not was used to determine their migrant status. Household registration was confirmed by their hukou registration, and whether the registered city belongs to Western, Central, or Eastern China. This left us with a dataset of 1349 individuals, in 156 prefecture-level cities in 24 provinces in Western, Central, and Eastern China. The spatial distribution of 156 prefecture-level cities is shown in Figure 1.

2.1.1. Dependent Variables

The dependent variable in this study was self-rated health (SRH). Previous studies have shown that SRH status performs accurately as an index of mortality [45]. Although not a direct measure, SRH is a good proxy for health status. The CGSS survey collected SRH data by means of a face-to-face interview by asking: “How would you describe your health, in general?”. Response options include very poor, bad, fair, good, and excellent. We recoded these five categories into five outcomes of SRH, where 1 stands for “very poor” and 5 stands for “excellent” health.

2.1.2. Key Variables

City size (CS): Following the research of Sun et al. (2014) this paper employs the district population as a proxy for city size [2]. Previous analyses have suggested that population sprawl makes local labor markets larger and more diverse, which might assist workers to find a job faster and acquire more knowledge through learning spillovers [46]. Larger populations also provide greater consumer demand and fund the supply of public services [2]. Greater city size is, however, also accompanied by a range of problems, including traffic jams, high commuting costs, environmental degradation, etc., as well as related issues, like road traffic noise, which affect specific populations [11]. Here, we also employed the square of city size (SCS) as a variable in order to explore if a “U-shaped” curve exists between city size and SRH.
Income (IN): Researchers have begun to explore the relation between income inequality and health [47]. The relationship between SRH and deprivation has been demonstrated in a rich existing literature, which has shown that material deprivation is important predictor of SRH [48,49]. This is explained by the fact that income inequality produces differences in social status for individuals, a factor which has been associated with negative impacts on SRH in western countries [50]. Here, the expected direction between income and SRH is, therefore, positive.
Population density (PD): Strong evidence points to the existence of a positive relationship between individual social capital and health. For example, previous studies have suggested that social participation is of benefit to individuals SRH, by providing them with opportunities to learn new skills and establish a sense of belonging [51,52,53]. Decreasing informal socializing over time has been related to poor SRH status for both women and men [54]. Given that higher population density can increase the vitality of public life and enhance individuals’ social capital, both of which are good for human health, here we used population density as a variable, which we expected to maintain a positive relation with SRH.
Per capita GDP (PCGDP): Previous studies have found that national wealth and public health expenditures can explain the variations in health level. However, the short-term health effects of these variables are not visible during economic recessions and in stable regions [12]. In this study, we employed per capita gross domestic product (GDP) to explore the effects of macroeconomic factors on SRH.

2.1.3. Control Variables

Based on previous studies we employed a series of control variables, including: gender, age, square of age, height, weight, and a psychosocial factor, in order to control individual heterogeneity. Age took the range 18 to 90 years old. The “psychosocial factor” has been widely addressed in previous studies by asking the question “How often did you feel depressed in last four weeks—always, frequently, sometimes, seldom, or never?” [37,38,55]. In addition, we also included per capita green area (PCGA) and hospital beds per ten thousand people (HB) to reflect cities’ heterogeneity.
Per capita green area (PCGA): A number of studies have been argued that greenhouse gases cause global warming, which, in turn, constitutes a significant influence on human health and the natural environment [56,57]. Lucky, scholars suggested that land use structure can influence carbon sinks [58]. For example, Xu et al. (2017) found that grassland has a better carbon fixation capacity than cultivated land, built-up, and water areas [59]. Therefore, this paper utilizes per capita green area as the proxy for describe the influence of environment on health.
Hospital beds (HB): Previous studies have been divulged that better health facilities would improve self-rated health status [60]. This means that individuals believe that more health facilities provide more opportunity to deal with their health problems. Thus, considering the availability of data, this paper employs hospital beds to represent health facility levels.

2.2. Methods

The multiple linear regression (MLR) model was used as a baseline model. Using this model allowed us to compare specifications more flexibly, and in ways that did not impose any assumption about city size, in order to assess the extent to which assumption biased the estimated health effects. In addition, variables reflecting individual attributes were taken into the model as control variables and their impact on SRH analyzed. A possible difference existed in the SRH of migrants or non-migrants due to city size, so an interaction term to address the relation between city size and migrant status was added to the model. The basic model can be written as follows:
S R H i j = α 0 + α 1 U j 2 + α 2 U j + α 3 D j + α 4 M i j + α 5 M i j × U j 2 + α 6 M i j × U j + X i j ' β + μ j + e i j
where S R H i j is the self-rated health (SRH) score of individual i in city j; U j is the district population of city j; U j 2 is the square of the district population of city j; D j is the population density of city j; M i j is the individual’s migrant status in city j; X i j ' are the control variables that reflect individual attributes, such as sex, age, the square of age, height, weight, and frequency of depression in the last four weeks; μ j is a dummy variable that stands for the impact of the variables, except city size of city j in the same province; M i j × U j 2 is an interaction term addressing migrant status and the square of city size; M i j × U j is an interaction term addressing migrant status and city size; α 0 is constant term; α n (n = 1,2, …,6) and β is the coefficients of the regression model.
We controlled the impact of other variables on SRH in order to estimate the relationship between migrant status and SRH. We then proposed M i as the dummy variable for migrant status, where 1 stands for migrant and 0 stands for non-migrant. There are two results in terms of SRH for migrated individual i: S R H 1 i and S R H 0 i , where S R H 1 i stands for SRH after migrating and S R H 0 i stands for SRH without migration. The true impact of migrating on SRH for the individual i can be expressed as S R H 1 i S R H 0 i , and due to each sample only one of the two results is possible, so the S R H i related to migration status is written as follows:
S R H i = M i × S R H 1 i + ( 1 M i ) × S R H 0 i = S R H 0 i + M i × ( S R H 1 i S R H 0 i )
Along the same line, W i denotes the dummy variable of individual household registration status, where 1 stands for registration in the western region and 0 stands for registration in central or eastern regions, in order to explore regional disparities in SRH; where S R H 1 i stands for the SRH of an individual with a hukou registration in the western region and S R H 0 i stands for the SRH of an individual with a hukou registration in the central or eastern region. The true impact of household registration status on SRH for the individual i can, therefore, be expressed as S R H 1 i S R H 0 i ; so the S R H i relation to registered residence can be written as follows:
S R H i = W i × S R H 1 i + ( 1 W i ) × S R H 0 i = S R H 0 i + W i × ( S R H 1 i S R H 0 i )
We also introduced an interaction term to deal with individual heterogeneity within migrant status and household registration status into the basic model to control individual heterogeneity and make the result closer to the “true” health status. The model was as follows:
S R H i j = α 0 + α 1 U j 2 + α 2 U j + α 3 D j + α 4 M i j + X i j ' β + M i × [ X i j X ¯ i j ] ' γ + μ j + e i j
S R H i j = α 0 + α 1 U j 2 + α 2 U j + α 3 D j + α 4 W i j + X i j ' β + W i × [ X i j X ¯ i j ] ' γ + μ j + e i j
where X ¯ i j   is the mean value of the control variable X i j .

2.3. Statistical Analysis

Self-rated health (SRH), the dependent variable in this model, was divided into five groups: 1 represented “very poor”; 2, “bad”; 3, “fair”’ 4, “good”; and 5, “excellent”. Approximately 70.7% of the sample respondents reported good and excellent health. The rest reported very poor, bad, or fair health. Demographic factors were included as control variables. At the individual level, demographic variables, including sex, age, square of age, height, weight, and depression frequency were analyzed. Females composed 56.3% of the sample. The average age of the sample group was 46. The average height and weight was 166 cm and 63 kg, respectively. We categorized frequency of depression into the categories of “always”, “frequently”, “sometimes”, “seldom”, and “never”. Almost 67.7% of the sample reported being depressed in the four weeks preceding the survey and 7.7% reported being always or frequently depressed. We employed the variables of per capita green area, and hospital beds to deal with the heterogeneity of different cities in the same province. The average of per capita green area was 11.5 m2, however, more than 50.0% of the cities studied were located below the mean value for this variable. The hospital beds average of this sample is 74.6, and only 37.7% cities in this sample above the mean value.
Migrant status was measured by rental tenancy status—when an individual lived in rental housing, this was taken to reveal migrating behavior. Migrant status was represented by 1 or 0, where 1 stood for “migrant”, and 0 for “non-migrant”. About 23.9% of the sample respondents were classed as migrants, with the remainder classed as non-migrants. The same approach was applied to household registration (hukou), where 1 stood for “registration in a western region”, and 0 stood for “registration in the central or eastern region”. In this sample, about 14.0% of the sample were registered in the western region and the rest were registered in Central or Eastern China.

3. Results and Discussion

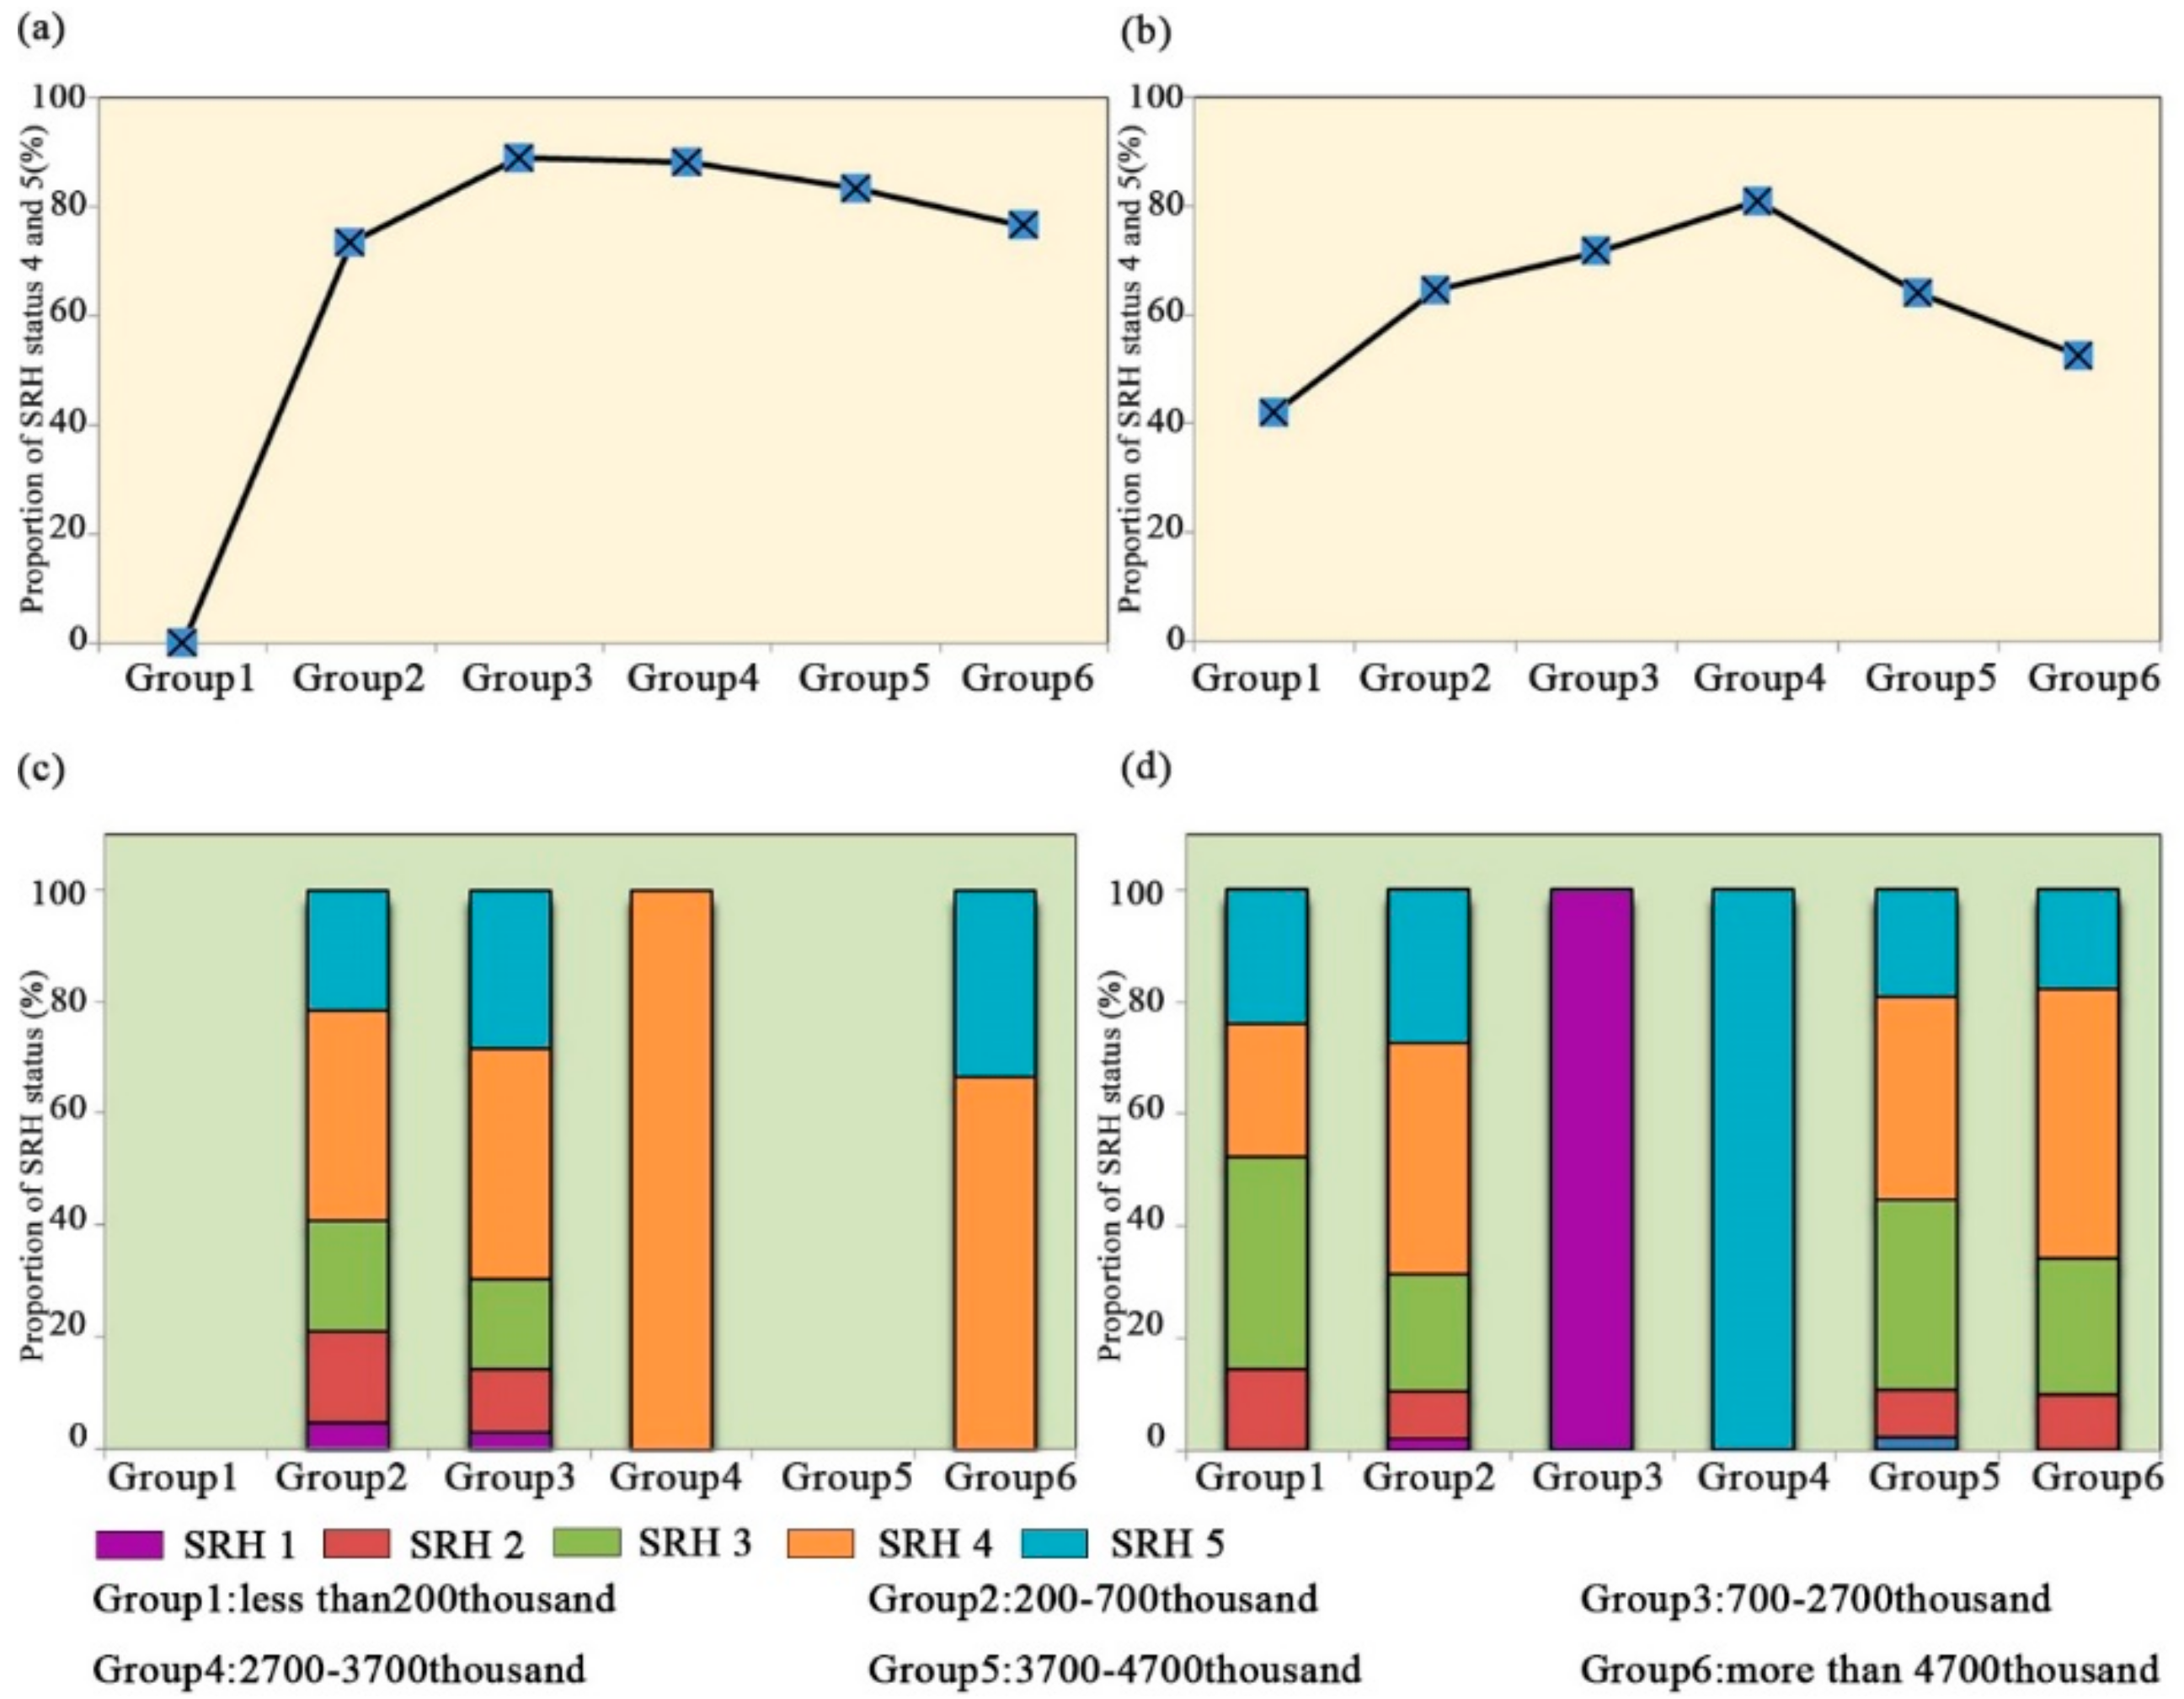
3.1. The Proportional Distribution of SRH

We performed statistical analyses in order to explore the proportional distribution of SRH in cities of different sizes, from the perspectives of migrant status and household registration. First, in order to examine the difference between migrants and non-migrants, and the difference between household registration in the western region and household registration in the central or eastern regions, the 1349 respondents were placed in categories of migrant and non-migrant, and western and central/eastern registration. Secondly, cities were divided into six groups based on the number of people—i.e., less than 200,000, 200,000–700,000, 700,000–2,700,000, 2,700,000–3,700,000, 3,700,000–4,700,000 and more than 4,700,000. Third, we calculated the distribution of individual SRH in the various city-size classifications. The results are displayed in Figure 2.
Figure 2a,b shows that the proportion of individuals with SRH status 4 and 5 increased in relation to increases in city size from the perspectives of migrant status, and after decreasing to an absolute low, SRH status trends follow increases in city size. As such, an inverted U-shape relation exists between city size and SRH. In addition, no notable differences were found in the proportional distribution of SRH status between migrant and non-migrant categories in different city size classifications. Compared with the insignificant difference seen in relation to migrant status, a clear disparity was seen in SRH status of cities with the same city size, but in different regions. For example, Figure 2c,d from the perspectives of household registration, show that, with the exception of the group of cities with populations between 200,000 and 700,000 had a similar proportional distribution, groups of population less than 200,000 and a population between 3,700,000 and 4,700,000 are disparity heavily in proportion of SRH status both in western and central or eastern regions.

3.2. Factors Influencing SRH Status

In order to understand the impact of each of the variables analyzed in relation to SRH, we ran ten regressions, from two perspectives, in order to test the coefficients of each model, generating the results shown in Table 2. Here, sex, age, the square of age, height, weight, the frequency of depression, per capita green areas, and hospital beds were utilized as control variables in order to control individual heterogeneity across provinces, and to minimize error due to omitted variables. Migrant status and household registration were taken as dummy variables. Models 1 to 5 analyzed the impact on SRH of migrant status, Models 6 to 10 were established to understand the effect of household registration.
Model 1 included the key variables “city size (CS)”, “square of city size (SCS)”, “migrant status (MS)”, “income (IN)”, and the control variables, testing the strength and direction of each variable. As shown by the results reported at Table 2, an inverted U-shaped relationship existed between city size and SHR, which supports our first hypothesis (the regression coefficient of SCS was −0.059). Further, migrant status was found to exert significant negative influence on SHR (the regression coefficient was −0.114) and income was found to exert a significant positive influence in relation to SRH in China. Additionally, the impact of city size (the regression coefficient was 0.862) was found to be stronger than that of income (0.066). The results reveal that individuals with migrant status had a lower SRH status than non-migrants. Previous studies show that larger cities are characterized by higher efficiency and better amenities, but also by greater frictions. In addition, previous studies have indicated that income inequality is an important issue for individual SRH [47,61]. Individuals with a higher income can be expected to have a better SRH status.
Model 2 extended the basic form of Model 1 by adding an interaction term between city size and migrant status, and the square of city size and migrant status. The results in Table 2 show no significance in the interaction term (p < 0.1), meaning that whether or not the individual was a migrant or non-migrant, their SRH status was not affected by city size. In other words, when other factors remained the same, moving to a city of a different size did not transform a migrant’s SRH status.
Model 3 extended Model 1 by adding the variable of population density. In general, because large cultural and service facilities or large comprehensive hospitals cannot be established until the consumer population exceeds the minimum threshold for these institutions, greater population density makes for more and better public service facilities. As expected, our estimation results indicate that population density exerts a significant positive influence in relation to SRH in China.
Model 4 enabled the examination of the impact of per capita GDP on SRH based on Model 1, with results revealing no significant relation between per capita GDP and SRH.
Through Model 5, we were able to consider the influence exerted by individual heterogeneity (the interaction term between individual characteristics and migrant status) on the SRH of migrants. The results indicate that migrant status had no effect in relation to SRH when taking into account individual heterogeneity. In contrast, the direction and strength of city size and income were similar to those generated by Model 1, and the inverted U-shape curve was again confirmed.
Model 6 was run with the same parameters as Model 1 except that migrant status was changed to household registration (HR). The results shown in Table 2 reveal that household registration maintained a significant negative relation with SRH. Individuals whose hukou registration was in China’s western region had a lower SRH status than those registered in Central or Eastern China. The reason for the lower SRH of those registered in the west may be inadequate public health service facilities in this region. Cities located in Western China, further, are often situated within harsh natural environment, such as deserts, that are prone to drought and to sandstorms during the spring [62]. In addition, city size was also identified as maintaining an inverted U-shaped curve in relation to SRH—when the number of residents exceeds a given threshold, city size decreased individuals’ SRH status. The reason for this may be that human activities requiring energy consumption increase PM2.5 concentrations and CO2 emissions, and thereby influence human health negatively [15,63,64]. Our results suggest that it is not always true that living in larger cities promotes SRH status.
Model 7 extended Model 6 by adding an interaction term between city size and household registration, the square of the city size and household registration. The results show that household registration had a negative impact on SRH. The interaction term between city size and household registration was found to be statistically significant and negative, which indicates that the effect of city size on SRH is characterized by regional disparity, especially for residents in western regions. This regional disparity in SRH may be due to efficiency differences in China’s community health service’s between the eastern, central, and western regions [65]. Moreover, the urbanization rates of the eastern (58.4%) and central (45.9%) parts of China were much higher than the country’s west (40.5%) in 2010, which is significant because higher urbanization leads to greater disparities in medical facilities, cultural and educational institutions, and other infrastructure that can strengthen an individual’s SRH [66].
Model 8 was created by inserting population density into Model 6. The results of Model 8, which are set out in Table 2, show that the impact of population density impact on SRH was not significant. This means that population density was found to have no effect on SRH in different regions. The most striking difference between the western and central/eastern regions is the inequality in infrastructure and public service, but not in population density.
The results of regression in Model 4 and Model 9 show that per capita GDP had no impact on SRH. In general, residents care more about disposable income than per capita GDP. At the same time, there are limitations to the calculation method of per capita GDP which divides the gross domestic product by the resident population, not the registered population. Therefore, per capital GDP may not be able to reach heterogeneity (an interaction term that addresses individual characteristics and household registration). These results are similar to those obtained using Model 5, which did not show a significant relation between migration status and SRH after considering individual heterogeneity. This means that your tenancy form and where you come from are both vulnerable factors in relation to your SRH status, which will be subject to variation due to individual heterogeneity.

4. Conclusions and Policy Implications

Larger cities generally enjoy the benefits of better infrastructure and richer social services, however, when city size is the result of unrestrained expansion, it can also be related to poor outcomes, such as higher resource consumption, variation in living conditions, environmental pollution, traffic congestion, and scarcity of public services, which, in turn, lead to lower SRH. Hence, a better understanding the effect of city size on SRH is beneficial to policy-makers in the task of planning urban systems and improving SRH status. Existing studies that have analyzed SRH status in relation to city size have been limited. In order to address this deficiency, this study employed a multilevel analysis in order to better understand the effect of city size on the dynamics present in SRH status from the perspectives of migrant status and regional disparity.
Multilevel analyses, such as ours, can assist in explaining the impact of city size on changes in SRH status in China. This study found city size, income, population density, migrant status, and household registration status to constitute the significant impact drivers in relation to SRH in China. Our results strongly support the hypothesis that an inverted U-shaped relationship exists between SRH and city size. We also found that income produced a positive impact in relation to SRH, both from a migrant status and a household registration perspective, while population density was positively related to SRH when linked to migrant status, but had no significance in relation to regional disparities as expressed through household registration status. Further, migrant status and household registration were both found to negatively influence SRH. These findings suggest that the government should pay more attention to the health of individuals who rent and to those with household registrations in the western region of China. Moreover, the interaction terms used in our analysis suggest that the SRH status of migrants is not impacted upon by city size. As such, both large cities and small cities need to be considered with relation to the SRH of migrants. City size will only influence SRH for individuals who come from different regional cities. For large cities, regional disparities in SRH will be more remarkable when an interaction term is used to take into account the relation between city size and household registration. Therefore, hospitals, education, and other public services should first be established in larger cities, especially in the western region of China. Importantly, the results show that when other factors remain the same, an individual’s SRH status will decrease when city size increases beyond the inflexion point, a result which we attribute to crowding effects, which can cause many problems.
The above findings, we argue, raise a number of theoretical and policy implications. Firstly, we found that the relation between rapid population growth and SRH status has an inverted U-shape. This indicates that China should continue to control population size and promote sustained urbanization of its population, for example, by increasing the urbanization level of household registration [15]. In addition, China should energetically develop megacities and small cities in line with planning better urban systems [2]. Second, China should improve its welfare policy for migrants in order to weaken the inequality of opportunity faced by migrants compared with native-born residents of a given city. Moreover, the government should also increase the amount of public rental housing. Thirdly, household registration is shown to have a negative effect on SRH. Hence, China should continue to implement the western development policy and expand public services coverage to narrow the gap in western, central, and eastern regions of the country. According to the construction guidelines of the punctiform city (an interconnected net of urban hyperdense ‘points’ throughout nature, parks, and lands), cities located in Western China could plan to build several unit points, which include thousands of residences, offices, services, and buildings, and the comfortable distance is a walking-biking distance. This means that concentrating the dispersed population in the west into multiple unit points would be better for centralizing the planned infrastructure to improve the living standards of local residents [9]. Fourth, income level is shown to exert a positive influence in relation to SRH. Thus, the government should expand income channels, encouraging workers to obtain employment by themselves and creating job opportunities in order to diversify individual income. Efforts oriented towards promoting stable urbanization, improving welfare policy, narrowing the regional gap, and diversifying incomes may improve SRH in China.
Our empirical analysis of the SRH of individuals at the city level also demonstrates that CGSS data, when subjected to multilevel analysis, constitutes an appropriate dataset and tool for analyzing differences in individuals’ SRH status in different cities, allowing scholars to address spatial disparities and underlying micro-factors behind such subjective evaluations (e.g., self-rated health and happiness). Clearly, beyond these findings, additional work remains to be done. For example, the impact of city size on other subjective assessments, such as happiness, should also be analyzed in order to explore appropriate urban system planning measures [2]. There is, further, a rich body of existing literature that argues that poor self-rated health is an independent predictor of reduced functioning [67,68]. A range of topics could be studied using similar approaches, thereby extending existing research—these include cross-cultural factors, language, and factors like smoking and drinking that present health risks [69]. Future studies of such issues can be expected to improve individual SRH status.

Author Contributions

C.Z. and J.C. developed the main ideas of the study, gathered the data, performed the model construction and estimation, and wrote the manuscript. S.W. contributed to the conceptual framework of this paper, played an important role in interpreting the results, and participated in revising the manuscript and proofreading the article. All authors read and approved the final manuscript.

Funding

This work was supported by the National Natural Science Foundation of China (41601151), the National Social Science Foundation of China (17BRK010), the Natural Science Foundation of Guangdong Province (2016A030310149) and Pearl River S&T Nova Program of Guangzhou.

Acknowledgments

Our deepest gratitude goes to the anonymous reviewers and editors for their careful work and thoughtful suggestions that have helped improve this paper substantially.

Conflicts of Interest

The authors declare no conflict of interest.

References

  1. Chen, M.; Zhang, H.; Liu, W.; Zhang, W. The global pattern of urbanization and economic growth: Evidence from the last three decades. PLoS ONE 2014, 9, e103799. [Google Scholar] [CrossRef] [PubMed]
  2. Sun, S.B.; Huang, W.; Hong, J.J.; Wang, C.H. City size, happiness and spatial optimization of migration. Econ. Res. J. 2014, 1, 97–110. (In Chinese) [Google Scholar]
  3. Miao, L.J.; Wang, Y.L. Analysis on effect of industry cluster from urbanization economy. Urban Stud. 2007, 4, 64–69. [Google Scholar]
  4. Gao, J.; Wu, P.L. The effect of urban population scale on urban economic growth. Urban Probl. 2016, 6, 4–13. (In Chinese) [Google Scholar]
  5. Lu, M.; Gao, H.; Zuo, T.H. On urban size and Inclusive Employment. Soc. Sci. China 2012, 10, 47–66. (In Chinese) [Google Scholar]
  6. Gao, H. On urban size and labor income. J. World Econ. 2014, 10, 145–163. (In Chinese) [Google Scholar]
  7. Stone, B. Urban sprawl and air quality in large US cities. J. Environ. Manag. 2008, 86, 688–698. [Google Scholar] [CrossRef] [PubMed]
  8. Bettencourt, L.M.A.; Lobo, J.; Helbing, D.; Kuhnert, C.; West, G.B. Growth, innovation, scaling, and the pace of life in cities. PNAS 2007, 104, 7301–7306. [Google Scholar] [Green Version]
  9. D’Acci, L. Simulating future societies in Isobenefit Cities: Social isobenefit scenarios. Futures 2013, 54, 3–18. [Google Scholar] [CrossRef] [Green Version]
  10. De Ridder, K.; Lefebre, F.; Adriaensen, S.; Arnold, U.; Beckroege, W.; Bronner, C.; IntPanis, L. Simulating the impact of urban sprawl on air quality and population exposure in the German Ruhr area. Part I: Reproducing the base state. Atmos. Environ. 2008, 42, 7059–7069. [Google Scholar] [CrossRef]
  11. Jaana, I.H.; Timo, L.; Tarja, Y.; Anu, W.T.; Jaana, P.; MSC Mika, K.; Jussi, V. Associations of traffic noise with self-rated health and psychotropic medication use. Scand. J. Work. Environ. Health 2014, 40, 235–243. [Google Scholar]
  12. Reile, R.; Helakorpi, S.; Klumbiene, J.; Tekkel, M.; Leinsalu, M. The recent economic recession and self-rated health in Estonia, Lithuania and Finland: A comparative cross-sectional study in 2004–2010. J. Epidemiol. Community Health 2014, 68, 1072–1079. [Google Scholar] [CrossRef] [PubMed]
  13. Narumasa, T.; Lzuru, S.; Masayuki, M.; Reiichiro, I. Addressing urban expansion using feature-oriented spatial data in a peripheral area of Ulaanbaatar, Mongolia. Habitat Int. 2015, 47, 196–204. [Google Scholar] [Green Version]
  14. Meng, W.; Aleksandra, K.; Hisako, K. Effects of urban planning on urban expansion control in Yinchuan City, Western China. Habitat Int. 2017, 64, 85–97. [Google Scholar]
  15. Wang, S.; Liu, X. China’s city-level energy-related CO2 emissions: Spatiotemporal patterns and driving forces. Appl. Energy 2017, 200, 204–214. [Google Scholar] [CrossRef]
  16. Louf, R.; Barthelemy, M. Scaling: Lost in the smog. Environ. Plan. B Plan. Des. 2014, 41, 767–769. [Google Scholar] [CrossRef] [Green Version]
  17. Brian, J.L.B.; Okulicz-Kozaryn, A. An Urban-Rural Happiness Gradient. Urban Geogr. 2011, 32, 871–883. [Google Scholar]
  18. Adam, O.-K. Unhappy Metropolis (when American city is too big). Cities 2015, 61, 144–155. [Google Scholar]
  19. Sørensen, J.F.L. Rural-Urban Differences in Life Satisfaction: Evidence from the European Union. Reg. Stud. 2014, 48, 1451–1466. [Google Scholar] [CrossRef]
  20. Ke, S.N.; Zhao, Y. Industrial Structure, City Size and Urban Productivity in China. Econ. Res. J. 2014, 4, 76–88. (In Chinese) [Google Scholar]
  21. Chen, J.; Zhou, Q. City size and urban labor productivity in China: New evidence from spatial city-level panel data analysis. Econ. Syst. 2017, 41, 165–178. [Google Scholar] [CrossRef]
  22. Mossey, J.M.; Shapiro, E. Self-rated health: A predictor of mortality among the elderly. Am. J. Public Health 1982, 72, 800–808. [Google Scholar] [CrossRef] [PubMed]
  23. Bobak, M.; Pikhart, H.; Rose, R.; Hertzman, C.; Marmot, M. Socioeconomic factors, material inequalities, and perceived control in self-rated health: Cross-sectional data from seven post-communist countries. Soc. Sci. Med. 2000, 51, 1343–1350. [Google Scholar] [CrossRef]
  24. Pei, X.; Rodriguez, E. Provincial income inequality and self-reported health status in China during 1991–1997. J. Epidemiol. Community Health 2006, 60, 1065–1069. [Google Scholar] [CrossRef] [PubMed]
  25. Pickett, K.E.; Wilkinson, R.G. Income inequality and health: A causal review. Soc. Sci. Med. 2015, 128, 316–326. [Google Scholar] [CrossRef] [PubMed]
  26. Chen, H.; Liu, Y.; Li, Z.; Xue, D. Urbanization, economic development and health: Evidence from China’s labor-force dynamic survey. Int. J. Equity Health 2017, 16, 1–8. [Google Scholar] [CrossRef] [PubMed]
  27. Van de Poel, E.; O’Donnell, O.; Van Doorslaer, E. Is there a health penalty of China’s rapid urbanization? Health Econ. 2012, 21, 367–385. [Google Scholar] [CrossRef] [PubMed]
  28. Chen, J.; Chen, S.; Landry, P.F.; Davis, D.S. How dynamics of urbanization affect physical and mental health in urban China. China Q. 2014, 220, 988–1011. [Google Scholar] [CrossRef]
  29. Miao, J.; Wu, X. Urbanization, socioeconomic status and health disparity in China. Health Place 2016, 42, 87–95. [Google Scholar] [CrossRef] [PubMed]
  30. Pope, C.A., III; Burnett, R.T.; Thun, M.J.; Calle, E.E.; Krewski, D.; Ito, K.; Thurston, G.D. Lung cancer, cardiopulmonary mortality, and long-term exposure to fine particulate air pollution. Jama 2002, 278, 1132–1141. [Google Scholar] [CrossRef]
  31. Guo, Y.; Jia, Y.; Pan, X.; Liu, L.; Wichmann, H.E. The association between fine particulate air pollution and hospital emergency room visits for cardiovascular diseases in Beijing, China. Sci. Total. Environ. 2009, 407, 4826–4830. [Google Scholar] [CrossRef] [PubMed]
  32. Wu, S.; Deng, F.; Niu, J.; Liu, Y.; Guo, A. Association of heart rate variability in taxi drivers with marked changes in particulate air pollution in Beijing in 2008. Environ. Health Perspect. 2010, 118, 87–91. [Google Scholar] [CrossRef] [PubMed]
  33. Liu, J.; Han, Y.Q.; Tang, X.; Zhu, J.; Zhu, T. Estimating adult mortality attributable to PM2.5 exposure in China with assimulated PM2.5 concentrations based on a ground monitoring network. Sci. Total. Environ. 2016, 568, 1253–1262. [Google Scholar] [CrossRef] [PubMed]
  34. Berkman, L.F.; Syme, S.L. Social network, host resistance and mortality: A nine-year follow-up study of Alameda County residents. Am. J. Epidemiol. 1979, 109, 186–204. [Google Scholar] [CrossRef] [PubMed]
  35. Kawachi, I.; Berkman, L.F. Social capital, social cohesion, and health. In Social Epidemiology; Berkman, I.F., Kaeachi, I., Glymour, M.M., Eds.; Oxford University Press: New York, NY, USA, 2014; pp. 290–291. [Google Scholar]
  36. Meng, T.; Chen, H. A multilevel analysis of social capital and self-rated health: Evidence from China. Health Place 2014, 27, 38–44. [Google Scholar] [CrossRef] [PubMed]
  37. Marmot, M.G.; Bosma, H.; Hemingway, H.; Brunner, E.; Stansfeld, S. Contribution of job control and other risk factors to social variations in coronary heart disease incidence. Lancet 1997, 350, 235–239. [Google Scholar] [CrossRef]
  38. Lachman, M.E.; Weaver, S.L. The sense of control as a moderator of social class differences in health and well-being. J. Pers. Soc. Psychol. 1998, 74, 763–773. [Google Scholar] [CrossRef] [PubMed]
  39. Ciccone, D.K.; Vian, T.; Maurer, L.; Bradley, E.H. Linking governance mechanisms to health outcomes: A review of the literature in low- and middle-income countries. Soc. Sci. Med. 2014, 117, 86–95. [Google Scholar] [CrossRef] [PubMed]
  40. Krueger, P.M.; Dovel, K.; Denney, J.T. Democracy and self-rated health across 67 countries: A multilevel analysis. Soc. Sci. Med. 2015, 143, 137–144. [Google Scholar] [CrossRef] [PubMed] [Green Version]
  41. Easterlin, R.A.; Angelescu, L.; Zweig, J.S. The Impact of Modern Economic Growth on Urban Rural Differences in Subjective Well-Being. World Dev. 2011, 39, 2187–2198. [Google Scholar] [CrossRef]
  42. Muenning, P.; Fahs, M.C. Health status and hospital utilization of recent immigrants to New York City. Prev. Med. 2002, 35, 225–231. [Google Scholar] [CrossRef]
  43. Newbold, K.B.; Danforth, J. Health status and Canada’s immigrant population. Soc. Sci. Med. 2003, 57, 1981–1995. [Google Scholar] [CrossRef]
  44. Newbold, K.B. Self-rated health within the Canadian immigrant population: Risk and the healthy immigrant effect. Soc. Sci. Med. 2005, 60, 1359–1370. [Google Scholar] [CrossRef] [PubMed]
  45. Krause, N.M.; Jay, G.M. What do global self-rated health items measure? Med. Care 1994, 32, 930–942. [Google Scholar] [CrossRef] [PubMed]
  46. Monica, A.; Guido, D.B.; Gilles, D.; Willam, G.S. Marshallian Labor Market Pooling: Evidence from Italy. Reg. Sci. Urban Econ. 2013, 43, 1008–1022. [Google Scholar]
  47. Wilkinson, R.G.; Pickett, K.E. Income inequality and population health: A review and explanation of the evidence. Soc. Sci. Med. 2006, 62, 1768–1784. [Google Scholar] [CrossRef] [PubMed]
  48. Diez Roux, A.V.; Mair, C. Neighborhoods and health. Ann. N. Y. Acad. Sci. 2010, 1186, 125–145. [Google Scholar] [CrossRef] [PubMed] [Green Version]
  49. O’Doherty, M.G.; French, D.; Steptoe, A.; Kee, F. Social capital, deprivation and self-rated health: Does reporting heterogeneity play a role? Results from the English Longitudinal Study of Ageing. Soc. Sci. Med. 2017, 179, 191–200. [Google Scholar] [CrossRef] [PubMed] [Green Version]
  50. Kennedy, B.P.; Kawachi, I.; Glass, R.; Prothrow-Stith, D. Income distribution, socioeconomic status, and self-rated health in the United States: Multilevel analyses. Br. Med. J. 1998, 317, 917–921. [Google Scholar] [CrossRef]
  51. Berkman, L.F.; Glass, T.; Brissette, I.; Seeman, T.E. From social integration to health: Durkheim in the new millennium. Soc. Sci. Med. 2000, 51, 843–857. [Google Scholar] [CrossRef]
  52. Eriksson, M. Social capital and health e implications for health promotion. Glob. Health Action 2011, 4, 5611. [Google Scholar] [CrossRef] [PubMed]
  53. Gilbert, K.L.; Quinn, S.C.; Goodman, R.M.; Butler, J.; Wallace, J. A meta-analysis of social capital and health: A case for needed research. J. Health Psychol. 2013, 18, 1385–1399. [Google Scholar] [CrossRef] [PubMed] [Green Version]
  54. Malin, E.; Nawi, N. Changes in access to structural social capital and its influence on self-rated health over time for middle-aged men and women: A longitudinal study from northern Sweden. Soc. Sci. Med. 2015, 130, 250–258. [Google Scholar]
  55. Bunker, S.J.; Colquhoun, D.M.; Esler, M.D.; Hickie, I.B.; Hunt, D.; Jelinek, V.M. “Stress” and coronary heart disease: Psychosocial risk factors. National Heart Foundation of Australia position statement update. Med. J. Aust. 2003, 178, 272–276. [Google Scholar] [PubMed]
  56. Pearson, P.N.; Palmer, M.R. Atmospheric carbon dioxide concentrations over the past 60 million years. Nature 2000, 406, 695–699. [Google Scholar] [CrossRef] [PubMed]
  57. Zhou, C.S.; Wang, S.J. Examining the determinants and the spatial nexus of city-level CO2 emissions in China: A dynamic spatial panel analysis of China’s cities. J. Clean. Prod. 2018, 171, 917–926. [Google Scholar] [CrossRef]
  58. Canadell, J.G. Land use effects on terrestrial carbon sources and sinks. Sci. China (Ser. C) 2002, 45, 1–9. [Google Scholar]
  59. Xu, Q.; Dong, Y.X.; Yang, R. Influence of different geographical factors on carbon sink functions in the Pearl River Delta. Sci. Rep. 2017, 7, 1–10. [Google Scholar] [CrossRef] [PubMed]
  60. Hooyman, N.R.; Kiyak, H.A. Social Gerontology: A Multidisciplinary Perspective; Allyn & Bacon: Boston, MA, USA, 2011. [Google Scholar]
  61. Subramanian, S.V.; Kawachi, I. Income inequality and health: What have we learned so far? Epidemiol. Rev. 2004, 26, 78–91. [Google Scholar] [CrossRef] [PubMed]
  62. Liang, C.S.; Duan, F.K.; He, K.B.; Ma, Y.L. Review on recent progress in observations, source identifications and countermeasures of PM2.5. Environ. Int. 2016, 86, 150–170. [Google Scholar] [CrossRef] [PubMed]
  63. Paatero, P.; Hopke, P.K.; Hoppenstock, J.; Eberly, S.L. Advanced factor analysis of spatial distributions of PM2.5 in the eastern United States. Environ. Sci. Technol. 2003, 37, 2460–2476. [Google Scholar] [CrossRef] [PubMed]
  64. Wang, Z.B.; Fang, C.L. Spatial-temporal characteristics and determinants of PM2.5 in the Bo Hai Rim urban agglomeration. Chemosphere 2016, 148, 148–162. [Google Scholar] [CrossRef] [PubMed]
  65. Liu, Q. Regional Decomposition Study on Efficiency Differences of Community Health Services in China. Chin. Health Econ. 2014, 33, 59–61. (In Chinese) [Google Scholar]
  66. Li, X.M.; Zhao, X.X.; Zhu, Y.Y. Comparing the Contribution of Urbanization to Economic Growth Among China’s Regions of East, Middle and West. Chongqing Technol. Bus. Univ. 2006, 10, 20. [Google Scholar]
  67. Mor, V.; Victoria, W.; William, R.; Jeffrey, H. Functional Transitions Among the Elderly: Patterns, Predictors and Related Hospital Use. Am. J. Public Health 1994, 84, 1274–1280. [Google Scholar] [CrossRef] [PubMed]
  68. Haga, H.; Hiroshi, S.; Yasuo, S.; Kazuo, S.; Kiyoshi, I.; Takao, S.; Seiji, Y. Self-Rated Health as a Predictor of Active Life in the Community Elderly. Jpn. J. Epidemiol. 1995, 5, 11–15. [Google Scholar] [CrossRef]
  69. Li, S.; Xie, X. A new look at the “Asian disease” problem: A choice between the best possible outcomes or between the worst possible outcomes? Think. Reason. 2006, 12, 129–143. [Google Scholar] [CrossRef]
Figure 1. The study area.
Sustainability 10 02204 g001
Figure 2. (a) Proportion of SRH status 4 and 5 of migrants at different city size groups; (b) Proportion of SRH 4 and 5 of non-migrants at different city size groups; (c) Proportion of SRH status of people whose hukou registered in the western of China at different city size groups; (d) Proportion of SRH status of people whose hukou registered in the central or eastern of China at different city size groups.
Sustainability 10 02204 g002
Table 1. Statistical summary of the variables.
VariablesSymbolExpected DirectionMin.Max.MeanStandard Deviation
City size (10,000 people)CS+3.8678.0194.4186.3
Square of city sizeSCS14.4459,684.072,438.2129,540.2
Income (Yuan)IN+200.0800,000.037,686.251,489.3
Population density (People/km2)PD+25.31440.0497.0327.7
Per capita GDP(Yuan)PCGDP+10,981132,08157,249.128,252.0
Per capita green area (m2)PCGA+213011.487.8
Hospital beds (per 10,000 people)HB+969774.6129.3
Notes: Data in the Table 1 were derived from the China City Statistical Yearbook, the China Urban Construction Statistical Yearbook, and the City Statistical Yearbook.
Table 2. The impact of city size on self-rated health.
VariableModel 1Model 2Model 3Model 4Model 5Model 6Model 7Model 8Model 9Model 10
CS0.862 ***0.985 ***0.708 ***0.880 ***0.862 ***0.087 ***0.796 ***0.770 ***0.883 ***0.839 ***
SCS−0.059 ***−0.068 ***−0.050 ***−0.059 ***−0.059 ***−0.060 ***−0.055 ***−0.54 ***−0.060 ***−0.058 ***
MS−0.114 **2.836−0.116 ***−0.115 **0.756
HR−0.236 ***−0.350−0.203 ***−0.234 ***0.556
IN0.066 ***0.068 ***0.060 ***0.068 ***0.066 ***0.064 ***0.065 ***0.060 ***0.065 ***0.064 ***
PD0.063 **0.038
PCGDP−0.031−0.022
CS × MS−0.882 *
SCS × MS0.064 *
CS × HR−0.110 **
SCS × HR0.019
Individual heterogeneity××××××××
Constant term−2.512 **−2.854 **−2.322 **−2.212 *−2.621 **−2.524 **−2.260−2.423 **−2.312 *−2.574 **
Samples1349134913491349134913491349134913491349
R20.3240.3250.3270.3240.3260.3280.3290.3290.3280.328
Notes: ***, **, and * indicate the 1%, 5%, and 10% levels of significance, respectively. The results of control variables were not listed in above Table 2 due to the findings being similar to previous studies.

