An Improved Two-Step Floating Catchment Area Method for Evaluating Spatial Accessibility to Urban Emergency Shelters

1
School of Environment, Northeast Normal University, Changchun 130117, China
2
Army Armor Academy, NCO Institute, Changchun 130117, China
*
Authors to whom correspondence should be addressed.
Sustainability 2018, 10(7), 2180; https://doi.org/10.3390/su10072180
Submission received: 29 May 2018
/
Revised: 22 June 2018
/
Accepted: 23 June 2018
/
Published: 26 June 2018
(This article belongs to the Section Sustainable Urban and Rural Development)
Abstract
:As an important component of urban disaster prevention and mitigation systems, the balance and equity of emergency shelter distribution can be measured based on spatial accessibility utilizing the two-step floating catchment area (2SFCA) method. However, there are some issues in previous studies on emergency shelter accessibility evaluated by the 2SFCA method: (1) the high discretization of population distribution data and the travel cost being measured base on Euclidean distance; (2) ignoring the difference between shelter and population catchment sizes. To address these issues, we propose an improved 2SFCA method that computes the shelter and population catchments respectively to evaluate the emergency shelter accessibility in Changchun, China. We compare the proposed improved 2SFCA method to the original 2SFCA method. The results indicate that the catchment size and shelter accessibility calculated by the proposed method are more realistic and objective. The improved 2SFCA method is applicable method for evaluating the shelter accessibility and can provide advice for the planning and management of emergency shelters in the future.
1. Introduction
When the sudden disasters occur in urban areas with high population and building density, a large number of evacuees are required to travel to the nearest emergency shelters immediately. In order to ensure the urban resilience, one of the fundamental parts of urban disaster prevention and mitigation systems is to construct a reasonable layout of emergency shelters [1,2,3,4]. An urban emergency shelter is a facility where residents can be evacuated rapidly and safely when a sudden disaster occurs, such as an earthquake or hurricane and so on, and the emergency shelters are often built as comprehensive evacuation sites in China [5,6,7]. Spatial accessibility is one of the most important indicators for measuring the equity and rationality of the spatial distribution of public facilities, such as primary healthcare facilities and urban parks [8,9]. It is defined by utilizing a specific method to represent the systematic relationship between the points of departure and destination with the consideration for travel cost [8,9,10,11]. The spatial accessibility of urban emergency shelters can be utilized to measure the balance and equity between the shelter service and population demand [12].
Over the past few decades, a considerable number of studies have been published on spatial accessibility of public facilities, especially in primary healthcare and public green space and most of the studies using the point-based accessibility measurements [8,9,13,14,15]. As shown in Table 1, there are many kinds of the point-based accessibility measurements based on the framework built by Talen, et al. [16], including the container, coverage, minimum distance, travel cost and gravity model [16,17]. The container and coverage methods measure the accessibility based on the number of facilities within a given unit and a given distance respectively [18,19,20] but it is difficult to describe the spatial variation of accessibility within these given areas. The minimal distance method [21] measures accessibility based on Euclidean distance without considering the relationships between facilities and the population. The travel cost methods include the cost-weighted distance method [22] and network analysis method [23]. The disadvantages of the cost-weighted distance method are the subjectivity and disregard for the impact of population distribution on spatial accessibility. The network analysis method is more realistic in terms of the travel process between facilities and the population [23,24] but it cannot describe the relationships between facility supplies and the demands of population. The gravity model is an accessibility measure based on the spatial interaction theory, and the spatial accessibility calculated by this model is proportional to the facility size and inversely proportional to the travel cost [16,17,25]. Two important variations of gravity model are the Huff model and the two-step floating catchment area (2SFCA) method but the Huff model considers the distance resistance and the supply capacity of facility while ignoring the impact of the demands of population [17,25,26]. The gravity model and 2SFCA method both evaluate accessibility by integrating the impact of the facility supplies, the population demands and the distance between the supply and demand points. The difference between the two methods is in their characterization of distance decay. The gravity model employs a continuous distance decay function without limiting the effective service radius of facility, which results in an overly smoothed accessibility distribution [25]. The 2SFCA method describes the distance decay effect in a dichotomous manner, namely, people outside the service radius area have no access to the supply facility [27]. In a word, the 2SFCA method is a comprehensive and flexible method for measuring the spatial accessibility and offers the potential for the various extensions in different studies [17,28].
The 2SFCA method has been widely applied in studies on the spatial accessibility of public service facilities and various extensions of the 2SFCA method have been proposed. These extensions can be divided into four classes [17]: the extensions improving the distance decay function [29,30,31], competition effect of supply and demand [32,33], measurement of travel cost [28,34] and calculation of catchment sizes [35,36]. However, there have been relatively fewer studies on shelter accessibility based on the 2SFCA method [37,38]. These studies have various problems and limitations. First, the visualization of census data based on the point features can lead to the discretization of population distribution and inaccurate results for accessibility. In previous studies, most of the census data considered were street or block scale data visualized into the point elements, so that the methods based on these data would ignore the shape properties of street/block units and result in large errors of accessibility [34,37,38,39]. Second, most studies on the shelter accessibility being calculated by the 2SFCA method measure the travel cost based on Euclidean distance instead of real path distance [39,40,41]. Although various modifications of the 2SFCA method focus on travel cost in studies on green space and primary health care [28,34,42], it is necessary to improve the travel cost measure for the 2SFCA method in evacuation scenario. Third, previous studies based on the 2SFCA method utilize a fixed catchment size, which is constant for all the demand populations and supply facilities [27]. To address this issue, some researchers have proposed various extensions of the 2SFCA method to optimize the calculation of catchment sizes, such as the variable 2SFCA (V2SFCA) method, nearest neighbor 2SFCA (NN2SFCA) method and so on [17,35,36,43,44]. Jamtsho, et al. [36] defined the demand population searching for health care services based on the recent hospitals in the nearest neighbor 2SFCA method. McGrail, et al. [43] introduced the five-level dynamic catchment sizes computed by the demand population in the dynamic 2SFCA method. Luo and Whippo [35] proposed a variable 2SFCA method to increase the catchment size until the population demand and supply-demand ratio reached their respective thresholds. The dynamic 2SFCA method and variable 2SFCA method are both somewhat subjective and ignore the effects of supply capacity on facility catchment size. The enhanced 2SFCA method proposed by the Ni, et al. [44] defined the catchment area by considering the influence of supply capacity and the intersection contradiction between supply and demand catchments. However, the extensions of the 2SFCA method focusing on catchment size mainly concentrated on primary health care, while relatively little research has been conducted on the optimization of catchment size for measuring the shelter accessibility. Zhou, et al. [41] computed shelter catchment size based on the theoretical service radius and population data but their hierarchical catchment sizes were relatively subjective. Additionally, the catchment sizes of the population and emergency shelter are often defined the same in the studies on shelter accessibility being evaluated by the 2SFCA method [37,38,41,45]. However, in reality, the evacuation distance of evacuee population is different from the service radius of shelters [41,45]. Therefore, ignoring the difference between shelter and population catchment sizes will lead to inaccurate accessibility results of emergency shelters. In summary, it is necessary to devote further attention to improving the calculation of catchment sizes in studies on emergency shelter accessibility.
This paper proposes an improved 2SFCA method for evaluating the accessibility of emergency shelters in Changchun, China. The proposed method not only addresses the problems of highly-discretized population data and travel cost measurement but also improves the calculation of catchment sizes in a practical manner by considering the differences between the supply shelter and demand population catchments. Section 2 details the optimization of the 2SFCA method, as well as the parameter settings and procedure of the improved 2SFCA method. Section 3 introduces the study area and data sources. Section 4 compares and analyzes the differences in the results computed by the original 2SFCA [25] and improved 2SFCA methods. Section 5 discusses the availability and contributions of the proposed method, as well as some problems that require further study. Finally, Section 6 summarizes our main conclusions and discusses the application significance of this paper.
2. An Improved 2SFCA Method Evaluating Shelter Accessibility
2.1. Optimizing the Assumptions in the Method
In order to implement a more appropriate model for evaluating shelter accessibility, we improve the original 2SFCA method [25] by optimizing the assumptions in the model. First, we assume that the population point is the geometric center of each grid of high-resolution population raster data, which can ameliorate the high discretization and low accuracy of the population data utilized in previous studies [37,38,39]. Second, we utilize the network analysis method [23] in the improved 2SFCA method for measuring travel cost based on the walking distance in the evacuation scenario, due to the other modes of transportation would be congested and destroyed [2,4]. Third, we define the catchment size of emergency shelter based on the facility capacity and nearby population, which solves the problem of fixed and subjective shelter catchment in previous studies [37,38]. We assume that the most reasonable catchment size for an emergency shelter can be identified as the point when the number of evacuees in the shelter catchment area matches the shelter capacity. Third, considering the differences between shelter and population catchments, we define the population catchment size as the walking distance from the population location to the second-nearest shelter [12,41]. Because McGrail, et al. [46] pointed that the population would not access all the service facilities, using a fixed catchment size for demand population points will lead to measurement bias [36]. Furthermore, the evacuees would prefer to travel to the nearest emergency shelters when a disaster suddenly occurs in actual situations but the nearest facility may already be occupied by other evacuees [36,45]. And in the case of a no-notice evacuation, where a disaster occurs without prior notice (e.g., explosion, terrorist attack), people may not be able to identify and move to the nearest shelter [47]. For this reason, we compute the catchment size of population as the walking distance from the second-nearest shelter.
2.2. Optimization of the Proposed Method
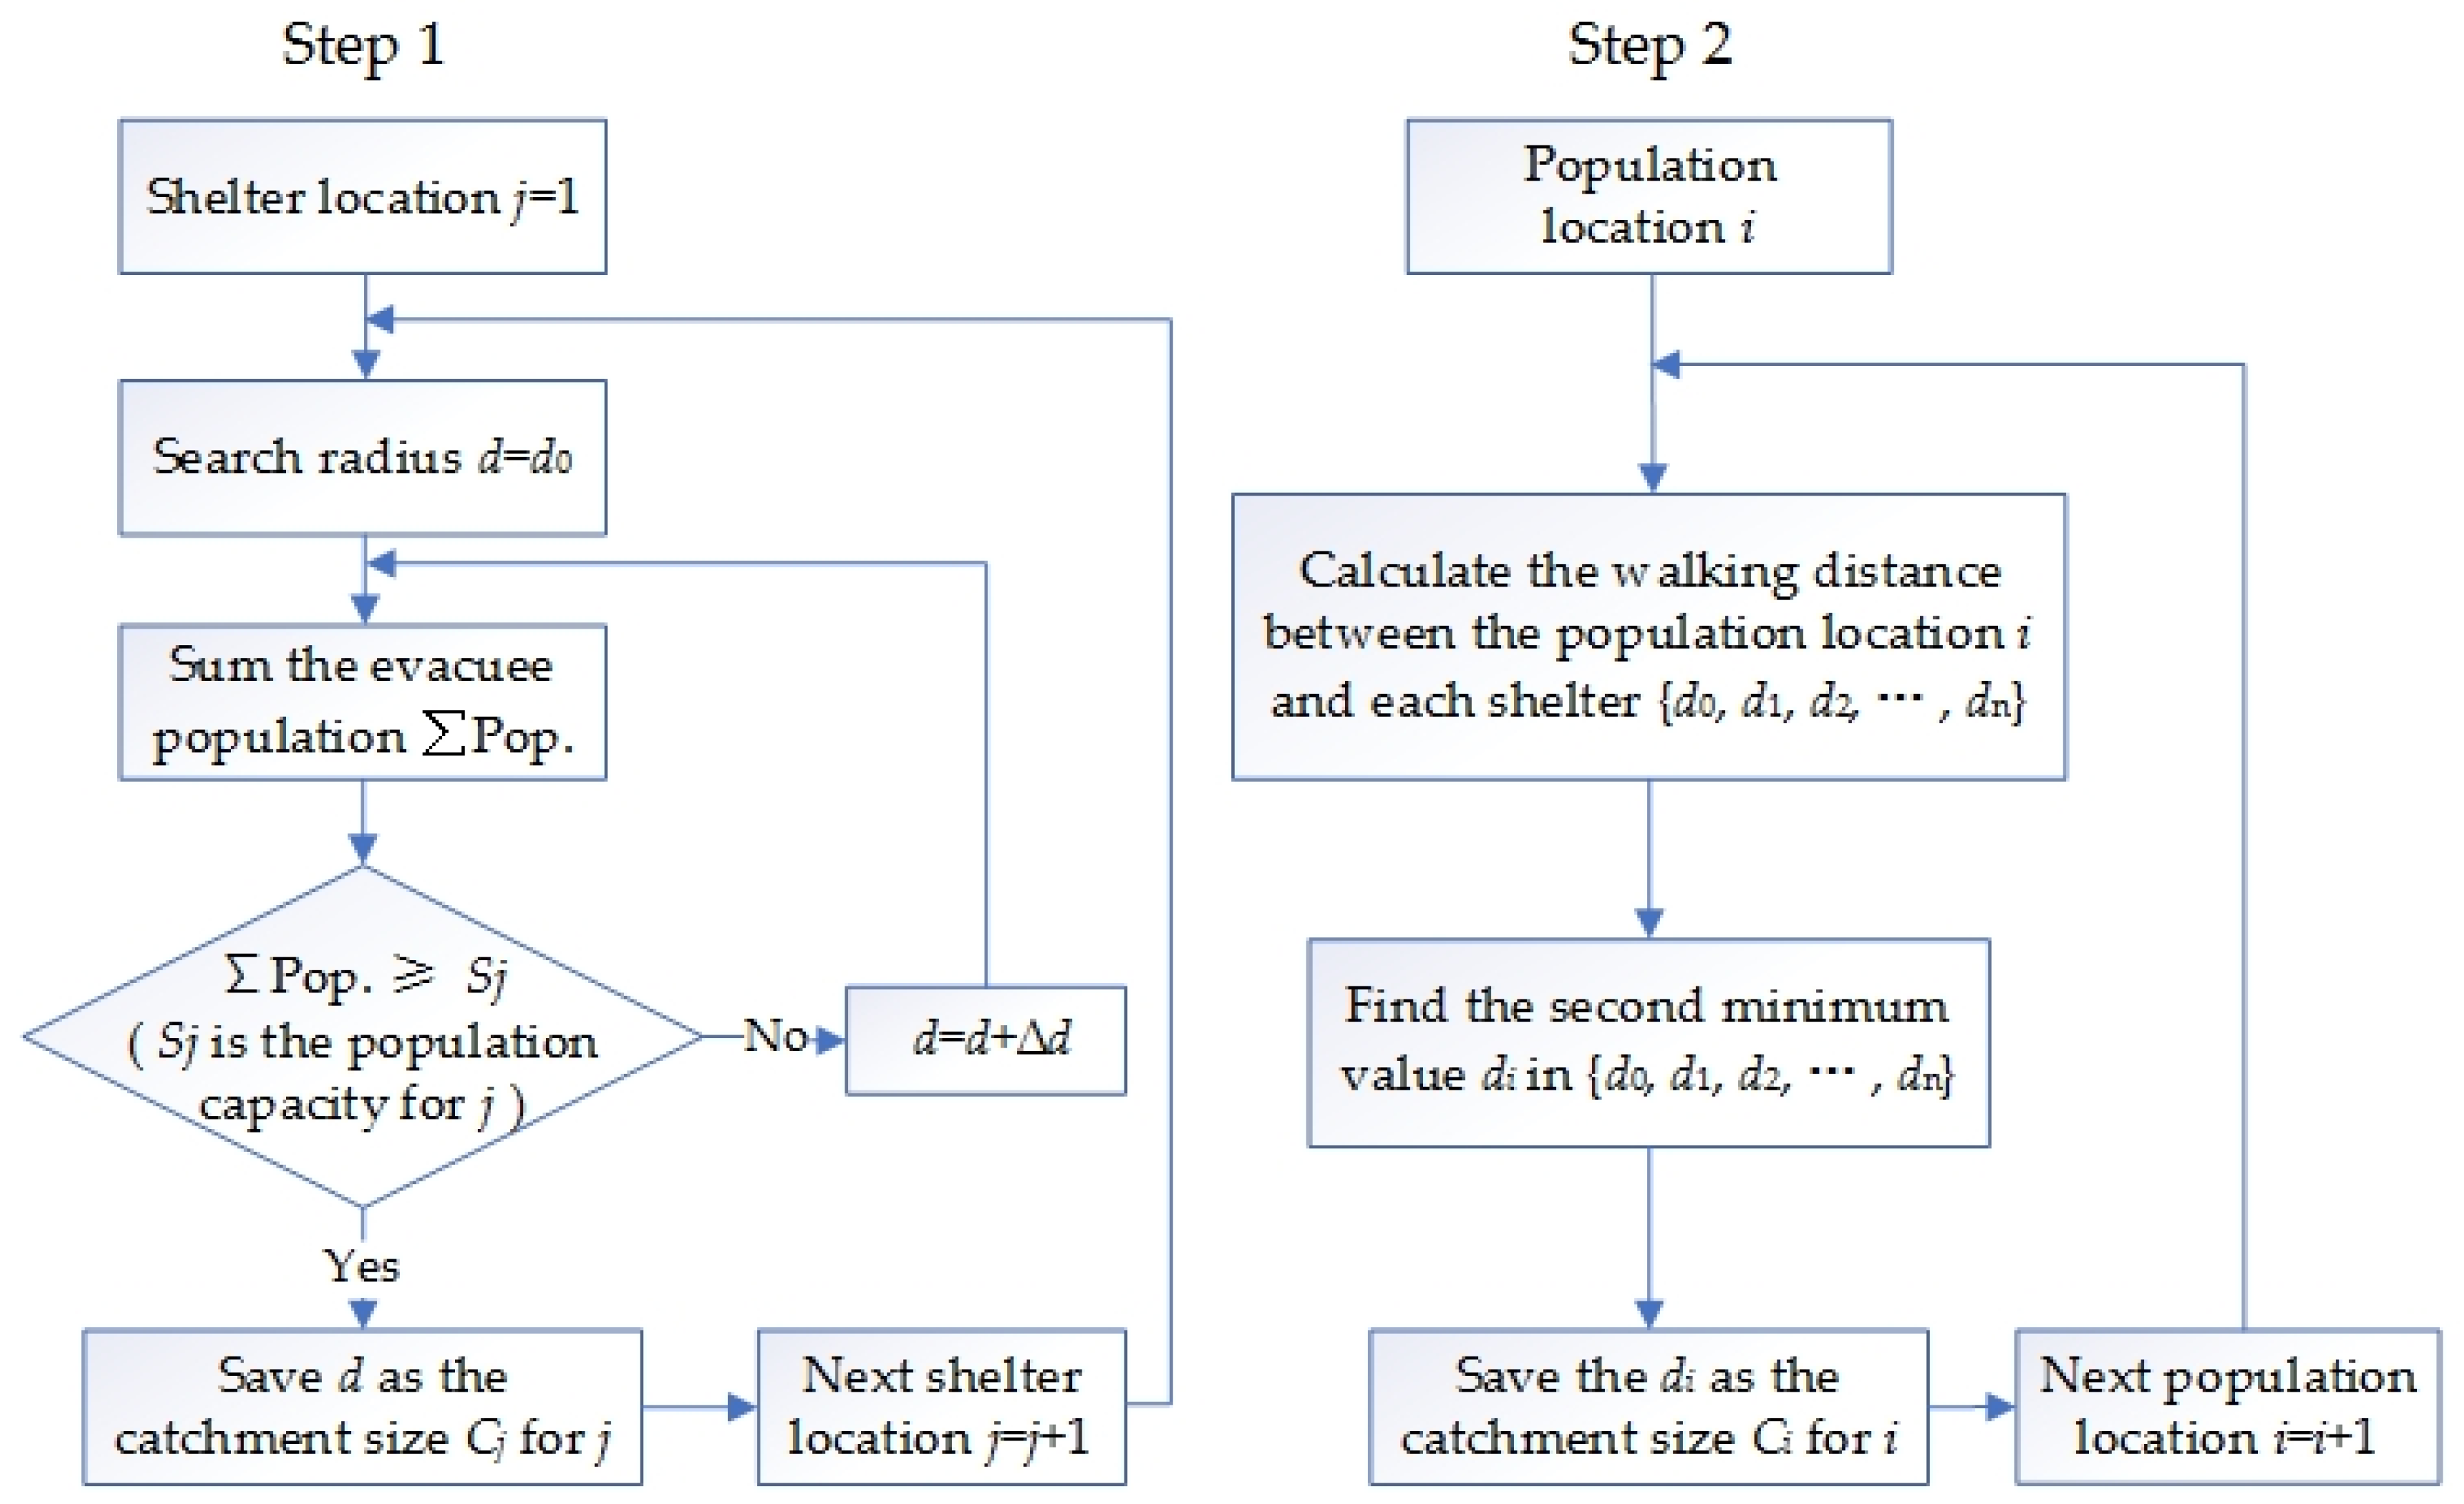
To address the problems in the 2SFCA method as applied to shelter accessibility, we present an improved 2SFCA method, that mainly focuses on improving the calculation of catchment sizes (Figure 1). The improved 2SFCA method is implemented in four main steps:
Step 1: The first step is to identify the service facility catchment. For each shelter location j, search all population location points within a predefined initial search radius d0 and count the total evacuee population. If the total evacuee population is greater than or equal to the population capacity of shelter location j, then the search radius d0 is the catchment size (Cj) of shelter point j. Otherwise, the search radius d0 is incremented by a small amount Δd and the process is repeated until the total evacuee population within the new catchment size reaches the population capacity of shelter location j. The new catchment size (Cj) is then saved for the shelter location j.
Step 2: The second step is to calculate the demand population catchment. For each population location i, find the second-nearest shelter and identify the minimum walking distance between the second-nearest shelter and population location i. Save the walking distance to the second-nearest shelter as the catchment size (Ci) for population location i.
Step 3: The third step is to calculate the supply-demand ratio of the shelters. For each shelter location j, search all population locations (k) within the shelter catchment area (Cj). Then, compute the supply-demand ratio (Rj) based on the shelter population capacity (Sj) and the sum of evacuee population (Pk) weighted by the distance decay function G(dkj, Cj).
where Rj is the supply-demand ratio of shelter location j, which represents the service ability of the shelter; dkj is the walking distance between shelter location j and population location k; G(dkj, Cj) is the Gaussian function, which is a continuous function with the advantages of having the smaller rates of decay in the near and far distance areas and the larger rates of decay in the middle-distance areas [17]. The Gaussian function has been widely applied in evaluating the shelter accessibility, because it is relatively practical for the spatial accessibility compared with other distance decay functions [14,17,31,44].
Step 4: The fourth step is to calculate the shelter accessibility. For each population location point i, search all shelter locations (l) within the population catchment area (Ci) calculated in Step 2. Then, compute the shelter accessibility (Ai) by summing the supply-demand ratios (Rl) derived in Step 3, which are weighted by the distance decay function G(dil, Ci).
where Ai is the shelter accessibility of population location i, which represents the effective number of shelter seats available for each evacuee; dil is the minimum walking distance between population location i and shelter location l; G(dil, Ci) is the aforementioned Gaussian function.
2.3. Parameters Settings and Calculations
According to the Code for Design of Disasters Mitigation Emergency Congregate Shelter (China), the minimum service radius (catchment size) for an emergency shelter is 500 meters (m) and the maximum catchment size is 10 kilometers (km) [7]. In Step 1, the initial value d0 and increment value Δd of the shelter catchment size are 500 m and 200 m respectively. According to the Standard for Urban Planning on Earthquake Resistance and Hazardous Prevention (China), the maximum of walking time for the evacuee is one hour and the walking speed is 50 m/min [48]. Therefore, the evacuation distance (catchment size) threshold for an evacuee is 3 km, which means the total number of the walking distance threshold for the evacuee population [45]. Besides, the catchment sizes of the shelter and population are both 2 km in the original 2SFCA method, which has been commonly defined in previous studies [41,45,48]. The walking distance and catchment area in this paper are calculated by the network analysis method in the ArcGIS 10.2 platform.
3. Case Study
3.1. Study Area
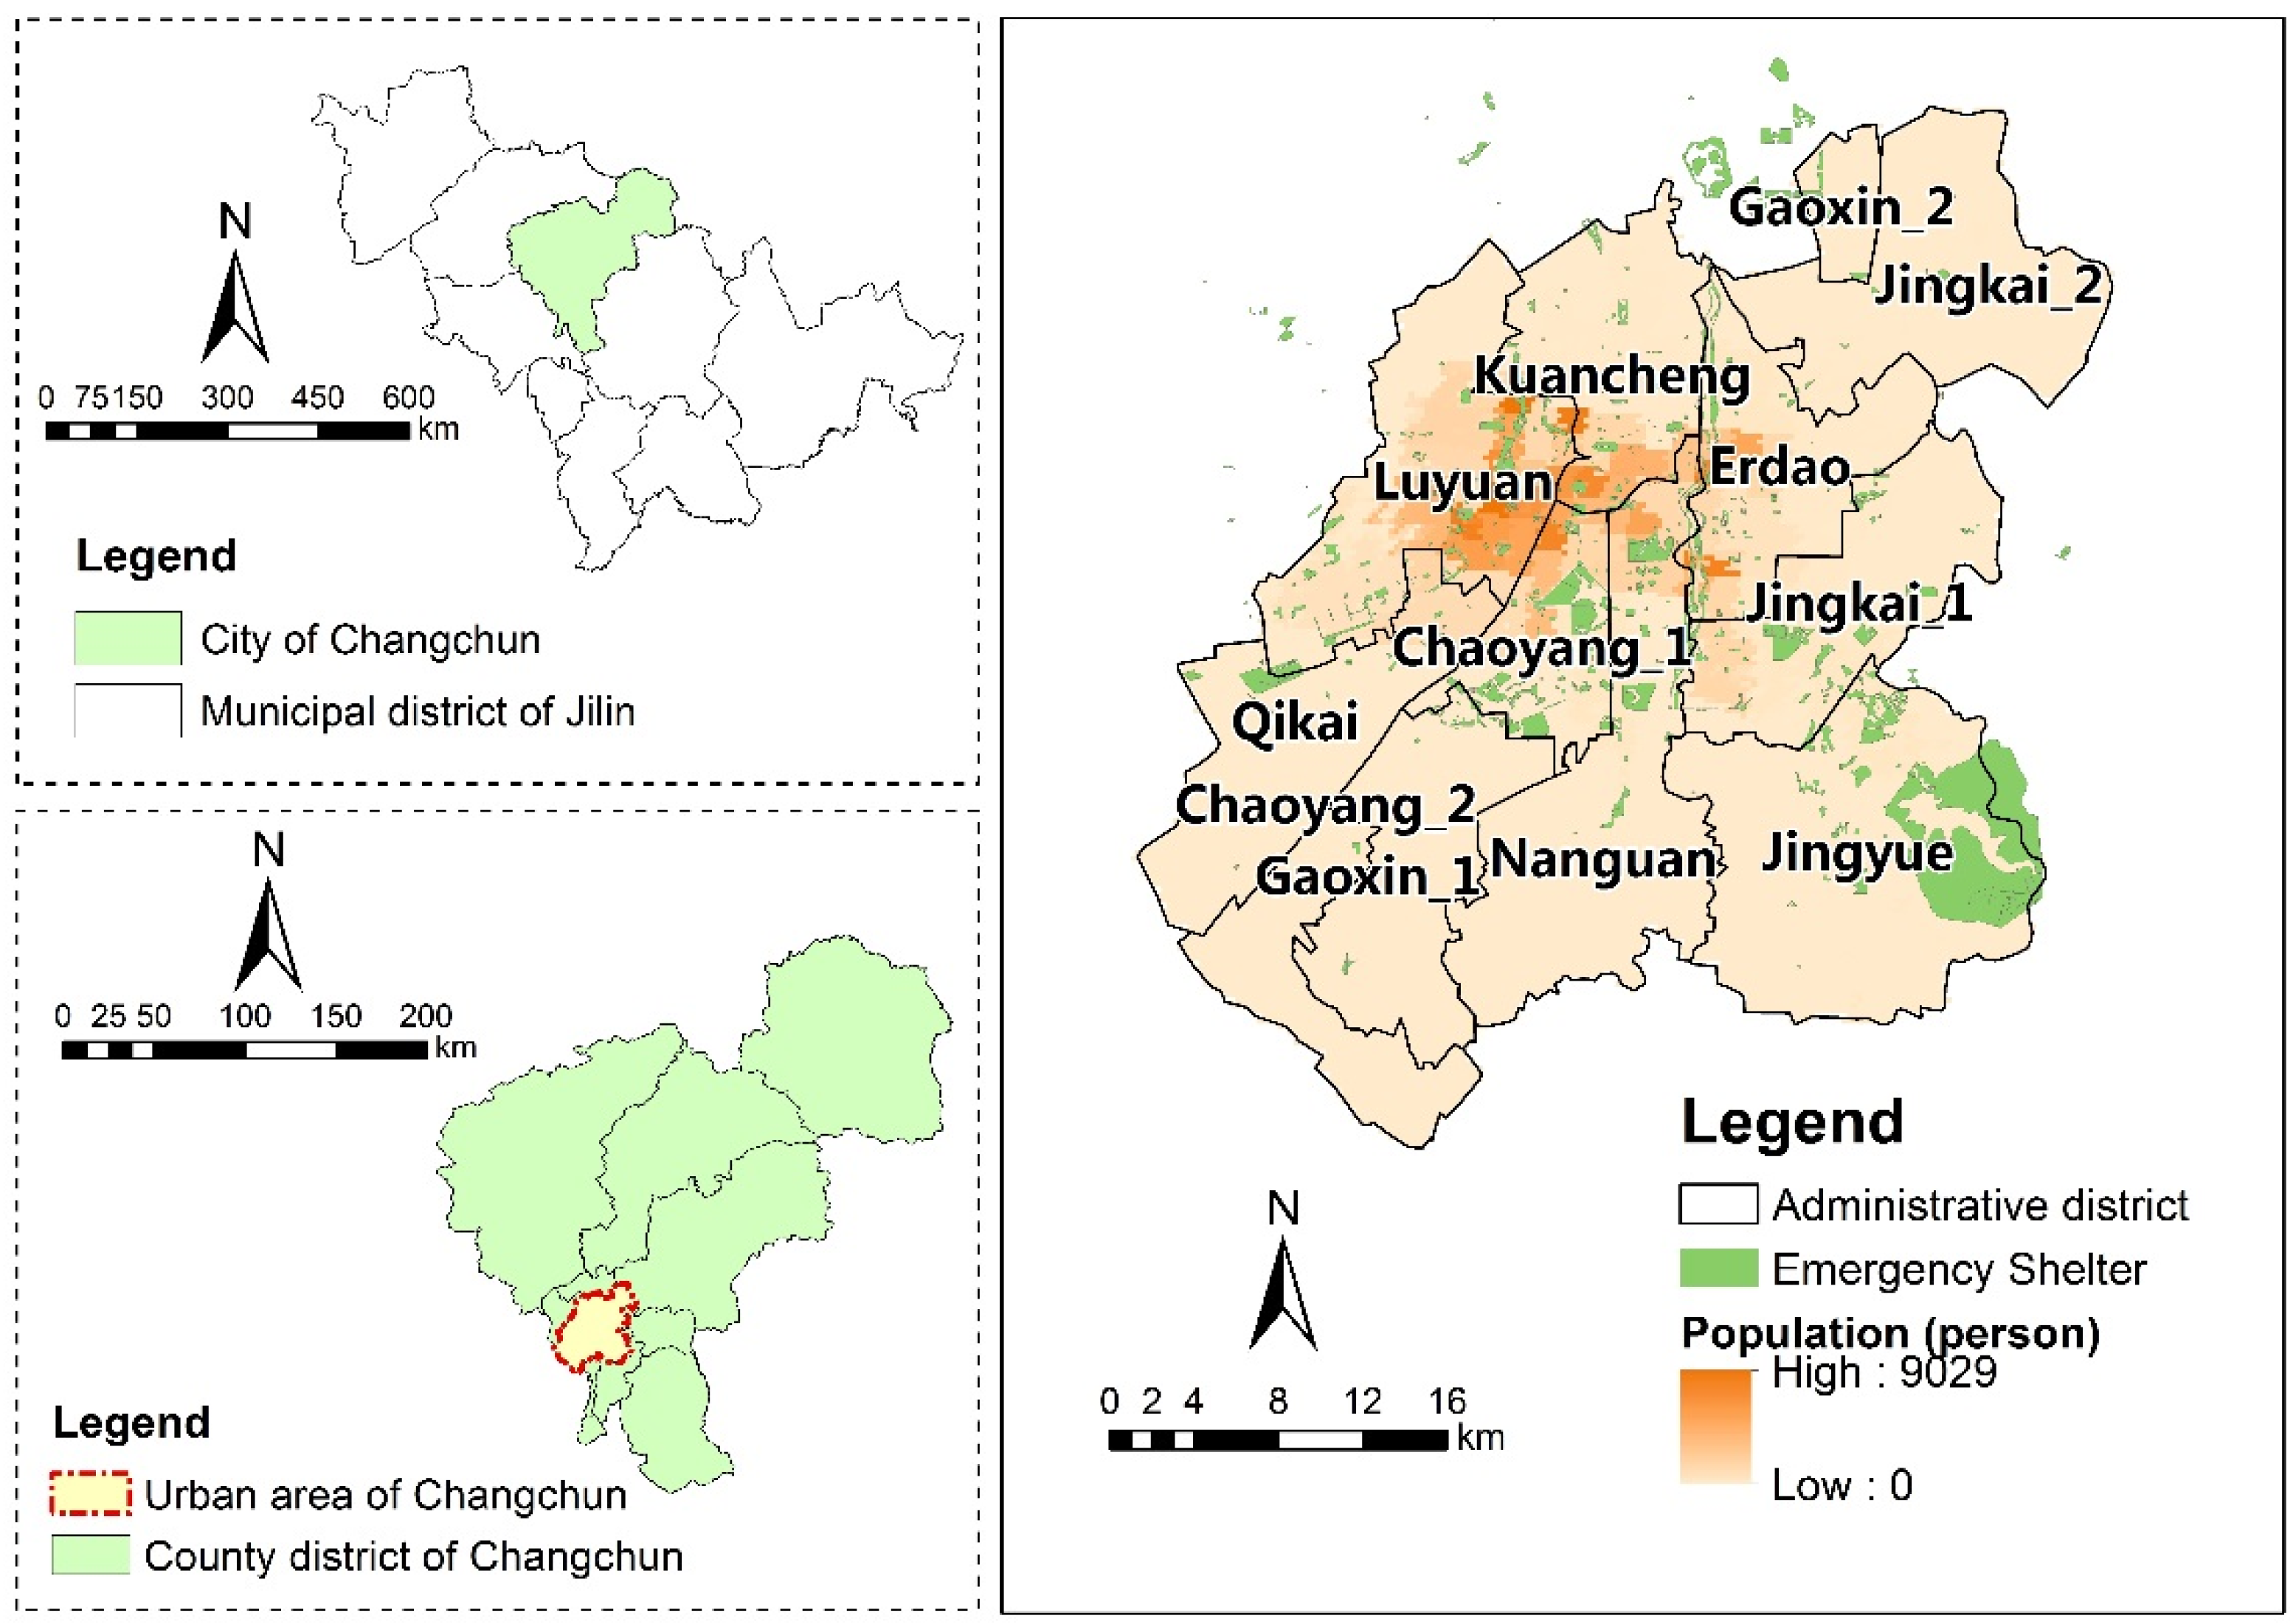
To demonstrate the advantages of the improved 2SFCA method, we applied it to measure the spatial accessibility of emergency shelters in Changchun, China. Changchun is the capital of Jilin Province. Because of the high-density populations in the urban area of Changchun, it was necessary to build a balanced and reasonable shelter layout to accommodate a large number of evacuees when the sudden disaster occurs. Therefore, we defined the study area as the urban area of Changchun with a total area of 1324.22 km2, including nine districts such as Chaoyang and Nanguan (Figure 2). Because the shelters outside the study area are likely to shelter a portion of the evacuee population, the emergency shelters surrounding the study area were also considered as the research targets.
3.2. Study Datasets
The distribution data of emergency shelters in Changchun (Figure 2) were visually interpreted by the Google Earth image in 2016, based on 47 public shelters announced by the Seismological Bureau of Changchun (http://ccdzj.changchun.gov.cn). The data include the shelters surrounding the study area, which would provide service for the evacuee. The shelter facilities include parks, public squares, large parking lots, large stadiums, school playgrounds and open green space in communities or streets, excluding the water areas. The population capacity of each shelter was calculated by the effective shelter area requirements in Table 2 with the consideration for the storage area required for emergency relief materials (30 m2 per thousand people) [7,49]. Finally, we converted the shelter polygon data into geometric center point data with the attributes of population capacity and area size, to apply those data to the evaluation of shelter accessibility.
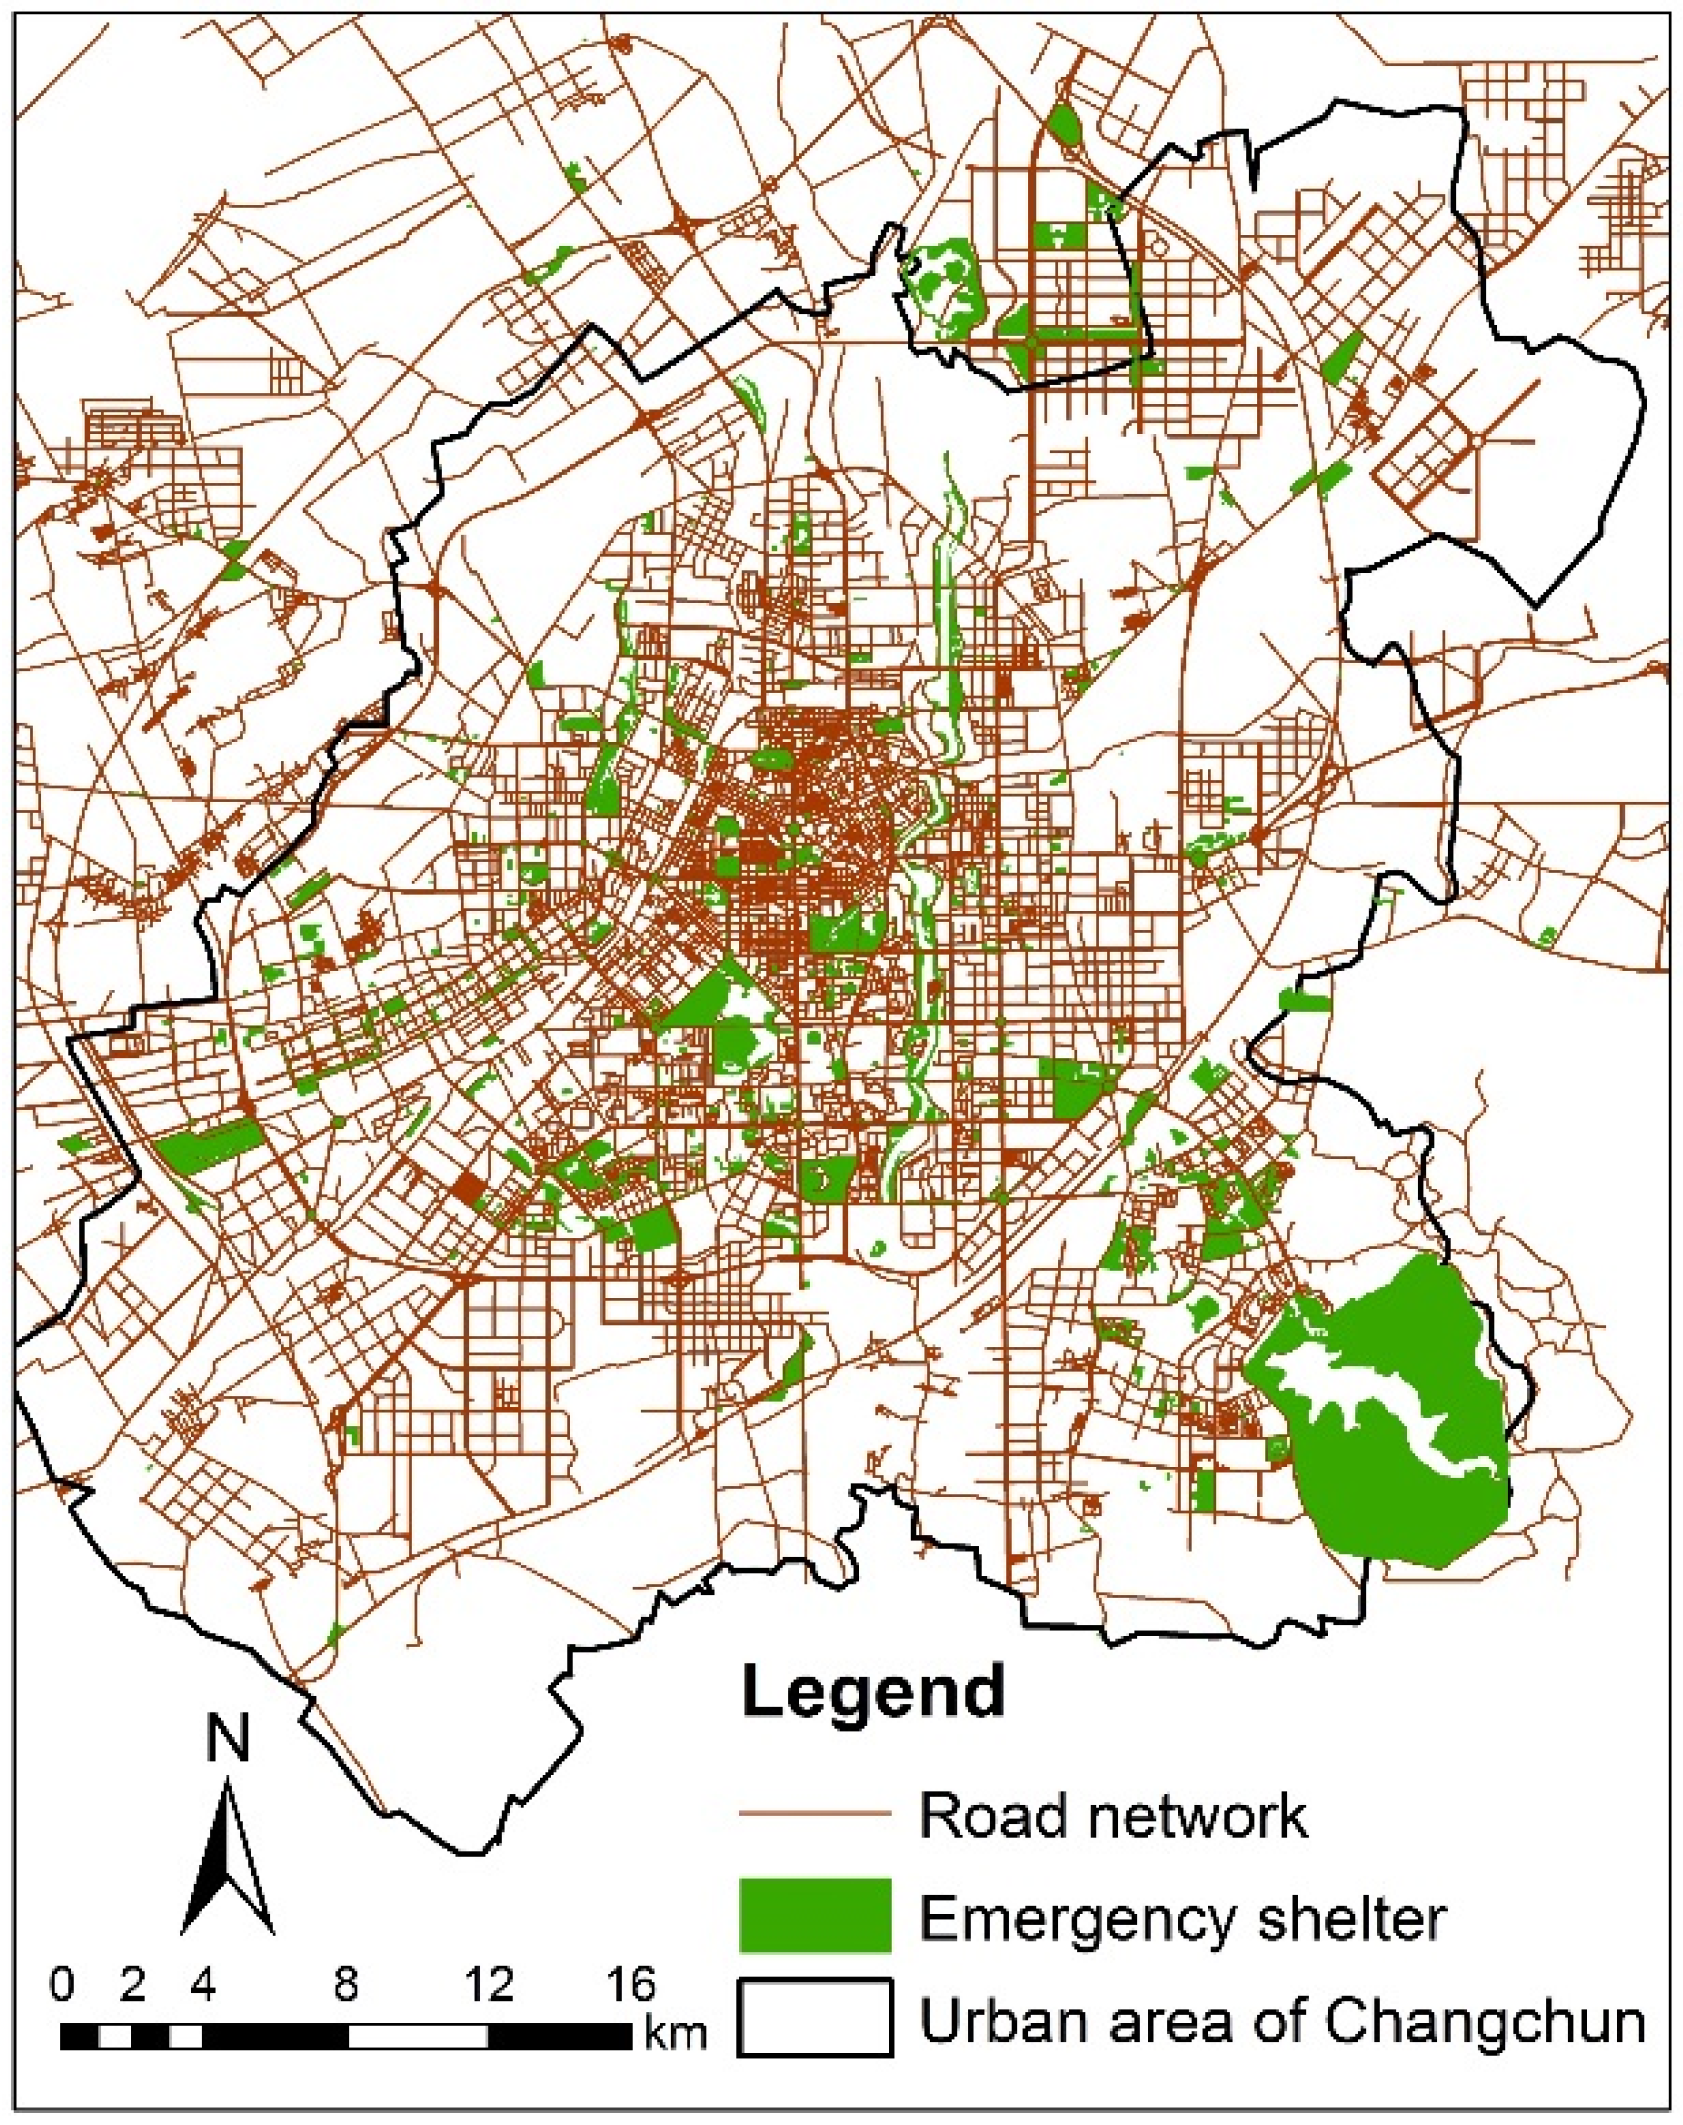
The data regarding administrative divisions in the urban area of Changchun came from “The overall urban planning of Changchun (2010–2020).” The population distribution data are spatial raster data from 2015 provided by the Global Human Settlement (EU) [50], expressed as the number of people per cell (Figure 2). The data are disaggregated from the census data into 250 m × 250 m grid cells based on the distribution and density of built-up as mapped in the Global Human Settlement Layer (GHSL) [50]. We assume that the population in each grid is uniformly distributed and set the geometric center of each grid as the demand population point. Depending on relevant policies and regulations [7,51], the emergency evacuation and embarkation shelter should accommodate all permanent resident population within the catchment area, and the resident emergency congregate shelter should accommodate 30% of the permanent resident population. We estimated the evacuee population around each shelter based on the above requirements. Finally, the road data were visually interpreted based on the Google Earth image from 2016 and then fixed their topology errors when building the network dataset in the network analysis method (Figure 3).
4. Results
We now compare the results of the improved 2SFCA method and original 2SFCA method [25] to identify which method is more objective and reasonable. The population data used in the original 2SFCA method were also 250 m × 250 m grid data. Because the improved 2SFCA method proposed in this paper mainly improves the calculation of catchment sizes, we first compared the shelter and population catchment size results in both methods and identified the differences in shelter supply-demand ratios and shelter accessibility results in those two methods. Finally, we confirmed that the improved 2SFCA method is more appropriate for evaluating shelter accessibility.
The results presented in Figure 4, Figure 5 and Figure 6 were classified by the geometrical interval classification method in the ArcGIS 10.2 platform, which is specifically designed for the continuous data. This classification method strikes a balance between highlighting changes in middle values and extreme values to produce classification results that are visually clear and attractive. Because there are small areas of maximal accessibility values in the original 2SFCA method, the shelter accessibility results in Figure 7 were classified by the quantile classification method in order to reveal more straightforward and clear classification result graphs.
4.1. Results of Catchment Sizes
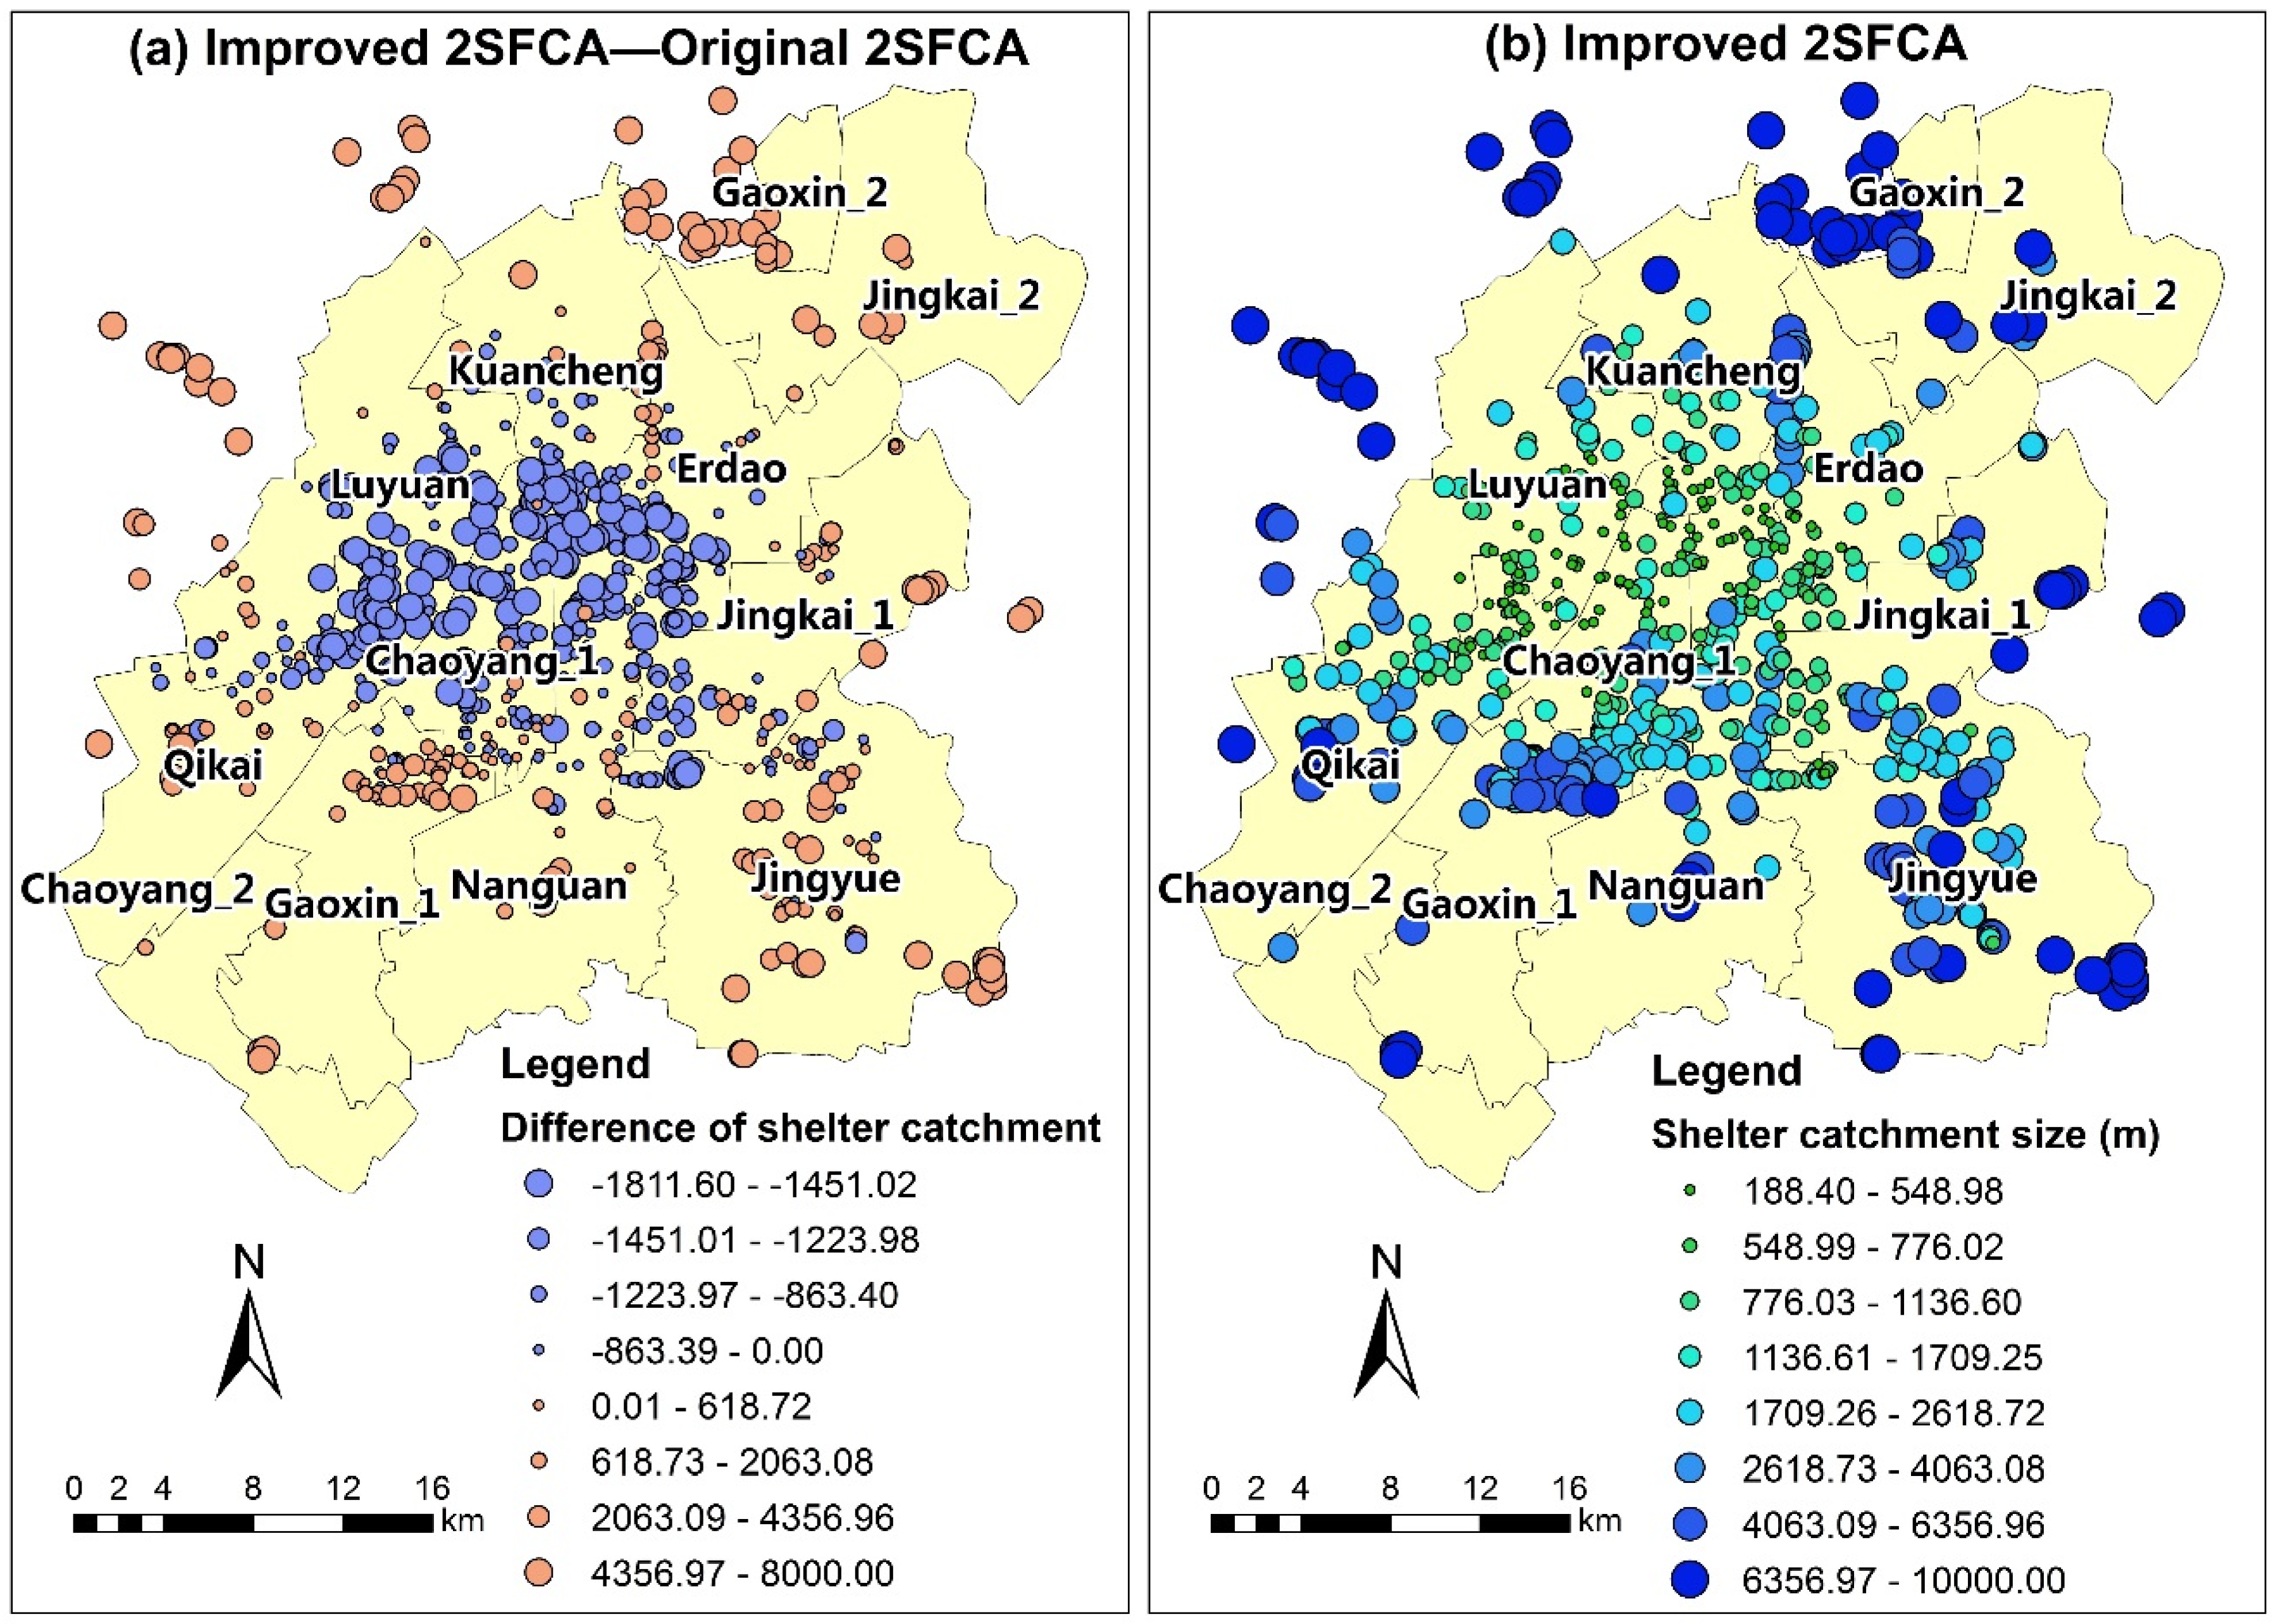
The original 2SFCA method with fixed catchment sizes would cause more errors of the catchment sizes of shelters in the thinly-populated suburb and densely-populated downtown areas. Figure 4a shows that the differences in the shelter catchment sizes between the two methods gradually increases from the downtown areas to suburbs. The catchment sizes of shelters in downtown calculated by the improved 2SFCA method are generally smaller than those calculated by the original 2SFCA method and this trend is reversed when shelters are located in suburbs. As shown in Figure 4b, for the improved 2SFCA method, the catchment sizes of shelters in downtown areas are smaller and those in suburbs are larger. This is because these values are calculated based on shelter capacity and surrounding evacuee populations. In the real world, a shelter would accommodate nearby evacuees first [38,45] and there is a larger evacuee population in downtown areas (Figure 1), meaning the catchment sizes of shelters in downtown areas should be smaller. Therefore, the results of shelter catchment sizes in the improved 2SFCA method are closer to reality compared to those in the original 2SFCA method, meaning the proposed method is more objective and accurate.
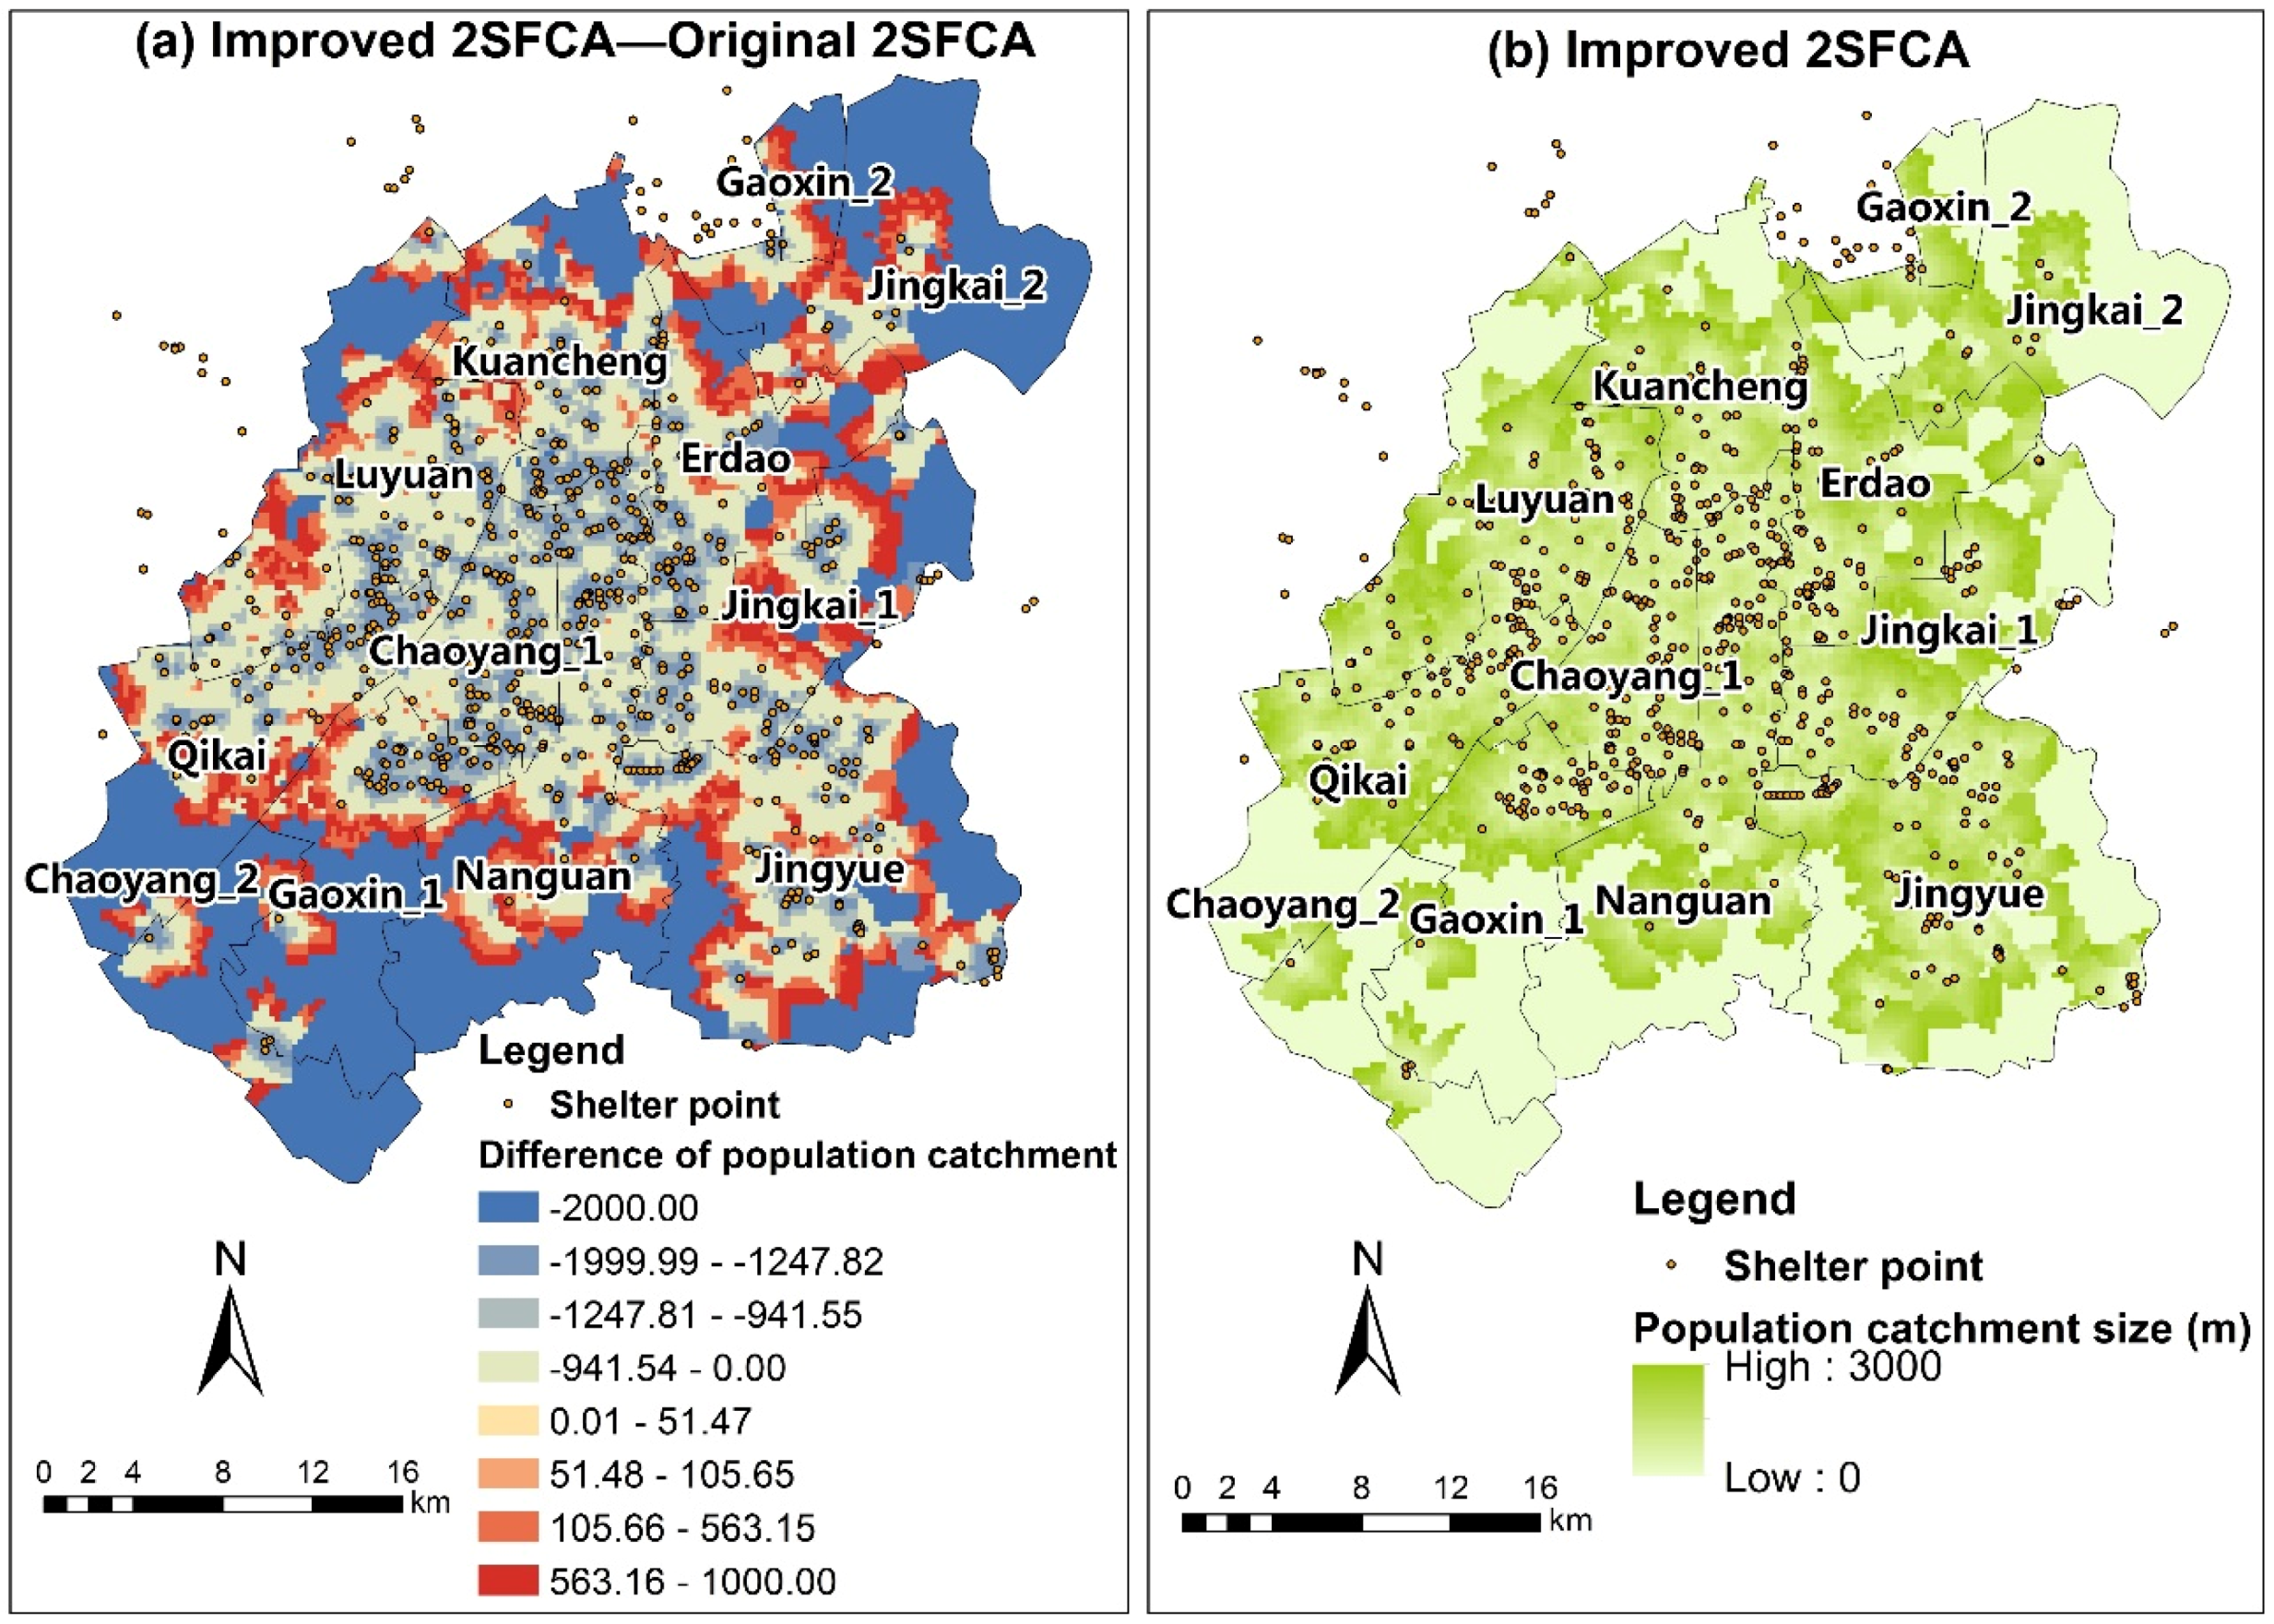
The original 2SFCA method would lead to the larger bias of catchment sizes of population locations in the areas near or far from the shelters. As apparent in Figure 5a, the catchment sizes of populations near shelters in the improved 2SFCA method are smaller than those in the original 2SFCA method and this trend is reversed for the catchment sizes of populations far from shelters. Besides, the differences in population catchment sizes between the two methods gradually increase with the distance from the shelter centers within the catchment thresholds, and the population catchment sizes in the improved 2SFCA method increase gradually with distance from the shelter centers (Figure 5b). In reality, there are more shelters in the downtown areas of Changchun, where evacuees would be provided with sufficient service from nearby shelters. Because the evacuees prefer to travel to the nearest shelter, the catchment sizes of populations near shelters should be smaller. Furthermore, there are values of zero in suburbs (Figure 5b) due to the population in suburbs with fewer shelters could be searched for shelter services. In the improved 2SFCA method, the population catchment size is proportional to the walking distance between the population location and its second-nearest shelter, which better represents the actual situation. In a word, the fixed catchment sizes in the original 2SFCA method are illogical and incorrect and those computed by the improved 2SFCA method are more realistic and objective.
4.2. Results of Shelter Supply-Demand Ratios
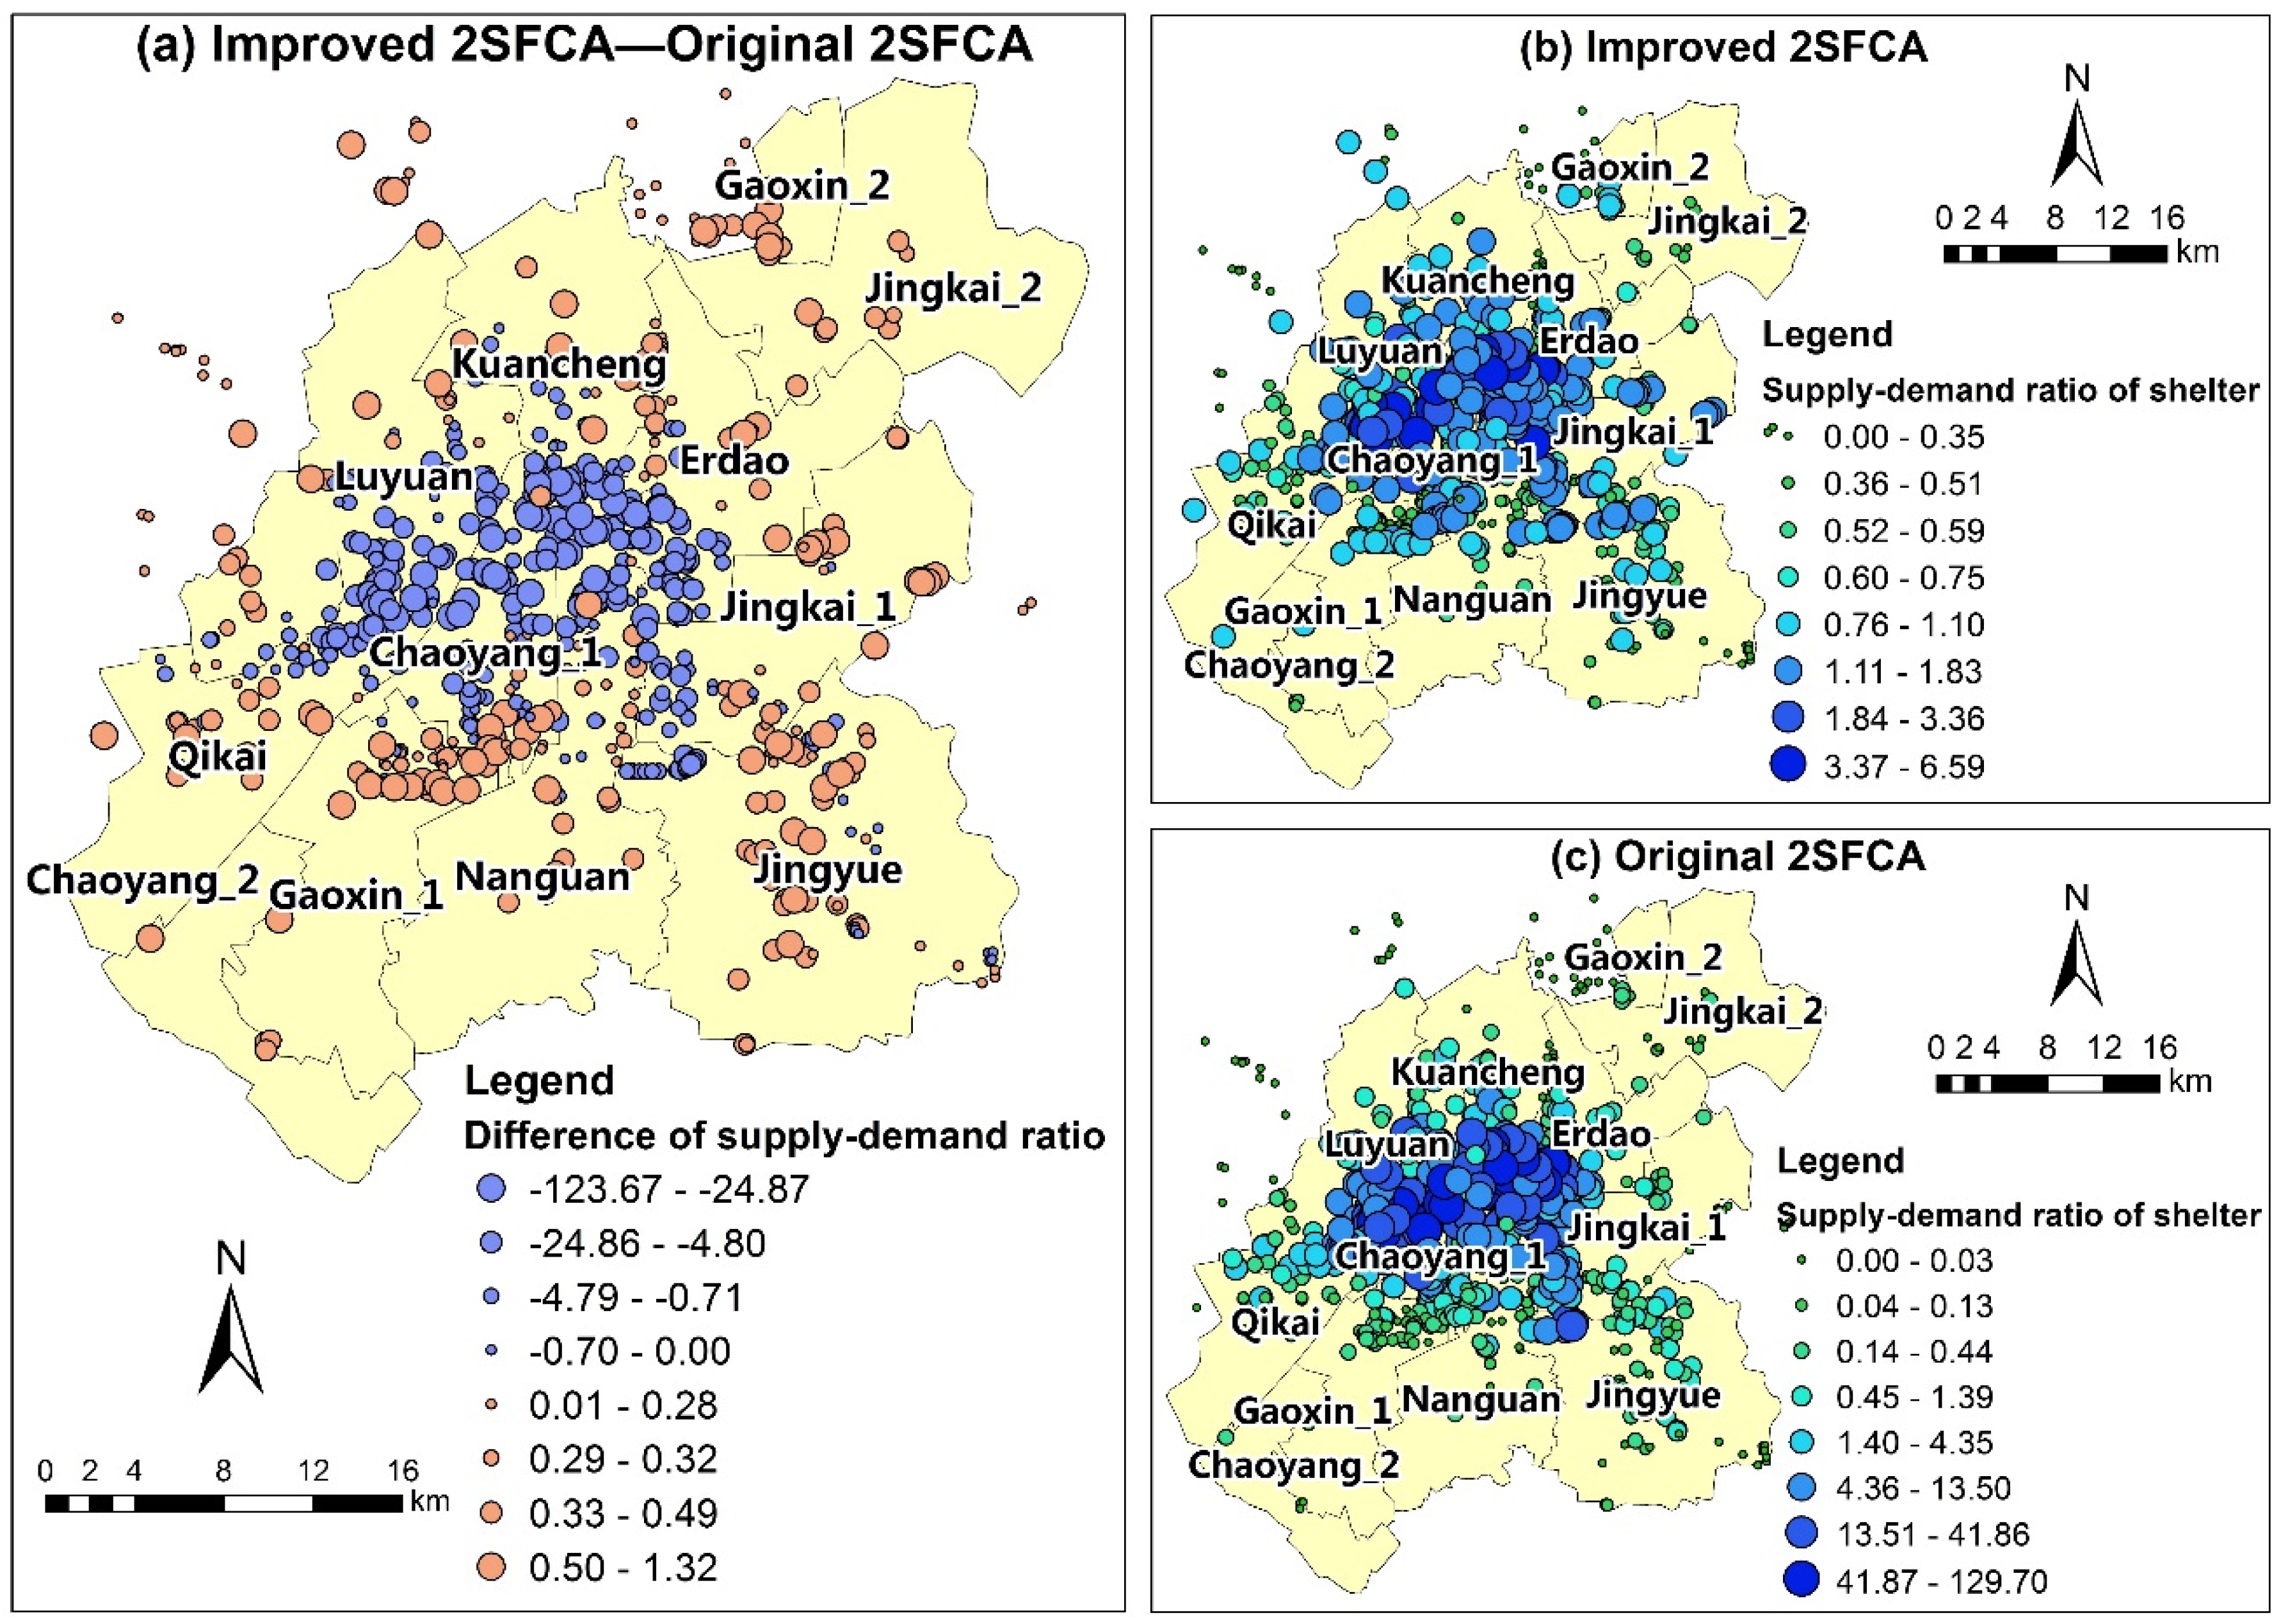
Figure 6a illustrates that the original 2SFCA method tends to overestimate the supply-demand ratios of shelters in downtown areas and underestimate those of shelters in suburbs. Most of the difference results are negative values for downtown areas and positive values for suburbs (Figure 6a). The supply-demand ratios of shelters in suburbs are smaller than those of shelters in downtown areas in both methods (Figure 6b,c). Additionally, the differences in supply-demand ratios increase gradually from downtown areas to suburbs and the absolute values of differences are larger in the city center and suburbs (Figure 6a). This indicates that the original 2SFCA method can produce large errors in supply-demand ratios for the areas with high-density or low-density populations. Because supply-demand ratios are influenced by shelter capacity and evacuee population in the real world, the shelter catchment sizes in the improved 2SFCA method are more realistic (Figure 4). Therefore, the supply-demand ratio results in the proposed method are more accurate and consistent with the actual situation.
4.3. Results of Shelter Accessibility
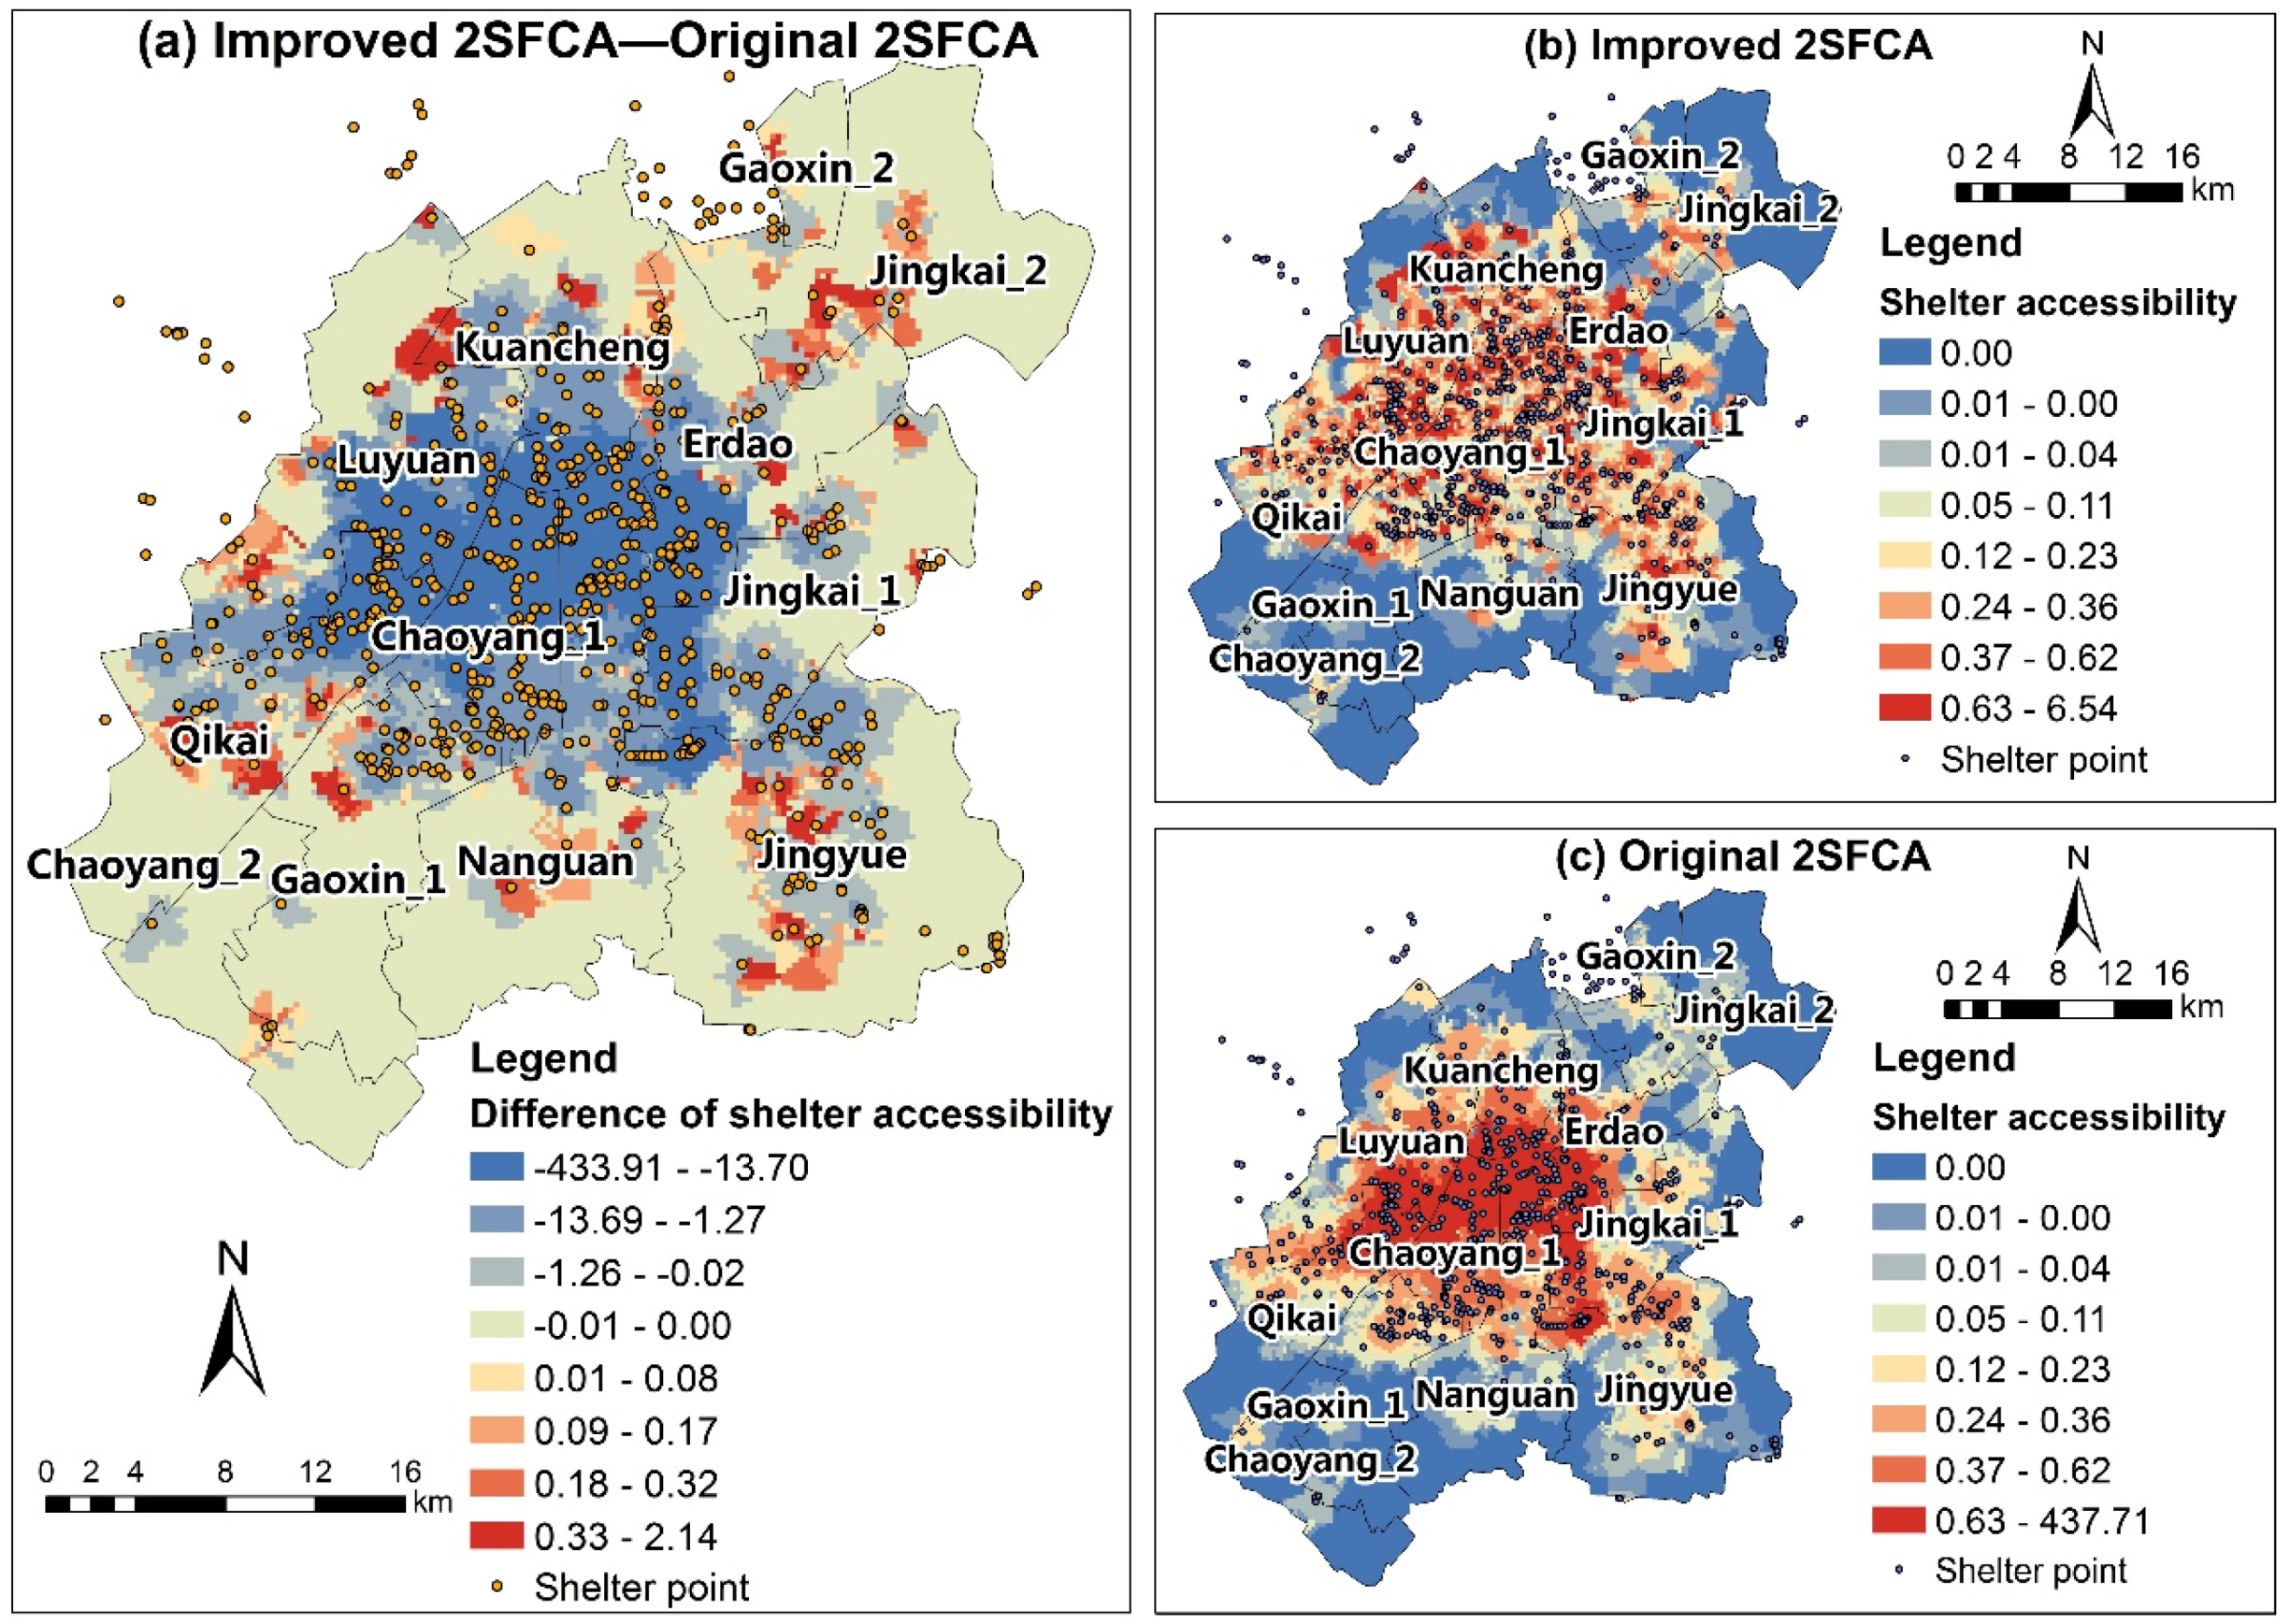
The original 2SFCA method tends to underestimate shelter accessibility at the junction between downtown areas and suburbs (Figure 7a). There are no obvious distribution characteristics for shelter accessibility in the improved 2SFCA method (Figure 7b), whereas the shelter accessibility computed by the original 2SFCA method decreases gradually from the downtown areas to the suburbs (Figure 7c). In reality, the shelter accessibility is proportional to shelter capacity and evacuee population. Therefore, the accessibility should be relatively large at the junction between downtown areas and suburbs (Figure 7a), where there are relatively fewer populations and sufficient shelters. Moreover, there should be large values for shelter accessibility in the Jingyuetan National Forest Park, which has a large capacity and is located in the southeast corner of the Jingyue District with a relatively small population. However, the low-density roads in this (Figure 3) would result in difficult access to the emergency shelter (Figure 7b). Therefore, the shelter accessibility measured by the improved 2SFCA method (Figure 7b) is closer to reality.
In addition, Figure 7a indicates that the original 2SFCA method overestimates the shelter accessibility of populations in downtown areas, especially in densely-populated downtown areas. As shown in Figure 7a, most of the accessibility differences in the downtown areas are negative values and are larger than the differences in suburbs. There are two main reasons for this phenomenon. First, the original 2SFCA method tends to overestimate the supply-demand ratios of shelters in downtown areas (Figure 6), which eventually leads to overestimating the shelter accessibility in downtown areas. Second, in downtown areas, the population catchment sizes in the improved 2SFCA method are smaller than those in the original 2SFCA method (Figure 5a), which results in fewer shelters providing service for population locations and smaller shelter accessibility values in downtown areas. Because the population catchment sizes in the improved 2SFCA method (Figure 5b) are more realistic and objective, the shelter accessibility values in the improved 2SFCA method are more realistic and accurate compared to those in the original 2SFCA method.
5. Discussion
5.1. Strengths of the Improved 2SFCA Method
In previous studies on the shelter accessibility as evaluated by the 2SFCA method, it has been found that the problems of the highly-discretized population data and the travel cost measurement, especially ignoring the differences between shelter and population catchments [27,37,39,41]. This paper proposed the improved 2SFCA method to address the above problems. In addition to applying the high-resolution population grid data and the network analysis method, the improved 2SFCA method also improves the calculation of shelter and population catchment sizes in a realistic manner. As shown in Table 3, the standard deviation of the shelter accessibility results in the original 2SFCA method is larger than that of the results in the improved 2SFCA method. However, a simple standard deviation cannot illustrate the dispersion degree of shelter accessibility results because the large difference in average values between the two methods. Therefore, we analyzed the variation coefficient to describe the dispersion degree of the shelter accessibility results. It is obvious that the variation coefficient of the shelter accessibility results in the improved 2SFCA method is greater than that of the results in the original 2SFCA method, which indicates that the shelter accessibility results calculated by the former method are more discrete and diverse than those calculated by the latter method. This confirms that the improved 2SFCA method can better separate and distinguish the accessibility data.
Another advantage of the improved 2SFCA method is the utilization of high-resolution population grid data, which decreases the errors caused by ignoring the geometry attributes of street census data [34,39] and improves visualization methods for evacuee populations. Unlike previous studies [41,45], this study applied the network analysis method to optimize the measurement of travel cost in evacuation scenarios. Above all, the most significant contribution of the improved 2SFCA method is the ability to identify different supply and demand catchment sizes in a realistic manner. Several previous studies on shelter accessibility have explored the calculation of catchment sizes in the 2SFCA method but these studies have not considered the differences between the shelter and population catchments [37,38,45,52]. The improved 2SFCA method calculates shelter catchments according to shelter capacities and surrounding evacuee populations and computes population catchments based on the walking distance from the second-nearest shelter, which fully considers the differences between shelter and population catchments. Compared to the fixed catchment sizes in the original 2SFCA method, the results of shelter and population catchments in the improved 2SFCA method are more realistic and objective, which lead to the more realistic and accurate results for shelter accessibility. Hence, the improved 2SFCA method is a reasonable and appropriate method for evaluating shelter accessibility in urban areas.
5.2. Possibilities for Prospective Research
It is worth emphasizing that the improved 2SFCA method constitutes a supplemental case study on optimizing the calculation of catchment sizes, which is appropriate for the evaluation of emergency accessibility in cities and urban areas. However, there are still some issues that could be studied further. First, there are various extensions of the 2SFCA method for calculating health care accessibility by optimizing the distance-decay function [29,30,31] or competition effect of supply and demand [32,33], such as the 2SFCA method based on distance-decay [29] and 3SFCA method [32]. Although the method proposed in this paper applies the Gaussian equation to describe distance decay, it needs to be further studied on how to identify the proper distance-decay function and the competition effect of supply and demand for shelter accessibility. Second, the travel cost could be determined based on the travel routes and walking speeds of various types of evacuees, meaning the travel cost computed based on a fixed speed is not optimal [39,44]. Third, ignoring the shape attributes of emergency shelters can lead to errors in accessibility results. If the entrances of shelter and their weight values were made available, the accessibility results could be evaluated more accurate [45]. Therefore, it is necessary to pay more attention to research on improving other aspects of the 2SFCA method for evaluating the shelter accessibility, such as the travel cost measurement and distance decay function. Additionally, future studies should obtain the data regarding shelter entrances and the walking speeds of various types of evacuees, such as the elderly or handicapped, in order to integrate the influence of various factors in evaluating the shelter accessibility.
6. Conclusions
In this paper, we reviewed studies on measuring emergency shelter accessibility and found advantages and limitations to evaluating shelter accessibility utilizing the 2SFCA method. In order to handle various issues in previous studies, we proposed an improved 2SFCA method that optimizes the catchment sizes of shelters and populations separately and integrates the network analysis method and high-resolution grid data of populations. Compared to the original 2SFCA method, the results of improved 2SFCA method confirmed the following four points: (1) It is relatively reasonable to calculating the shelter accessibility in densely-populated urban areas based on the high-resolution grid data of populations and computing the walking distance by the network analysis method; (2) Considering the differences between shelter and population catchment sizes, the improved 2SFCA method computes shelter catchment sizes based on shelter capacity and surrounding populations and calculates population catchment sizes based on the walking distance to the second-nearest shelter, which is more realistic and objective; (3) Because the shelter supply-demand ratio depends on shelter catchment sizes, the improved 2SFCA method utilizes a more realistic method to compute the shelter catchment sizes, meaning the supply-demand ratios of shelters in the proposed method are also more realistic and accurate; (4) The shelter accessibility results in the improved 2SFCA method are more discrete and realistic than those calculated by the original 2SFCA method, indicating that the proposed method can better separate and distinguish data. In conclusion, the improved 2SFCA method can address the limitations of the population data and travel cost measurements. More importantly, it overcomes the issue of ignoring the differences between shelter and population catchment sizes. The accessibility results in the improved 2SFCA method revealed that emergency shelters in the suburbs of Changchun cannot fully satisfy the demands of the current evacuee population. Therefore, it is worthwhile to evaluate the shelter accessibility in densely-populated urban areas utilizing the improved 2SFCA method, which can identify whether or not the spatial distribution of its shelters is balanced and reasonable and provide advice regarding the planning and management of emergency shelters in the future.
Author Contributions
X.Z. conducted the primary experiments and cartography and wrote the manuscript. Z.T. and X.L. (Xingpeng Liu) provided the original idea and the edition for this paper. X.L. (Xiangqian Li), P.L. and T.W. offered data support for this work.
Funding
This research was funded by the National Natural Science Foundation of China [41201549].
Acknowledgments
This project was supported by the National Natural Science Foundation of China [41201549].
Conflicts of Interest
The authors declare no conflict of interest.
References
- Park, S.J.; Kim, D.W.; Kim, J.H.; Chung, J.H.; Lee, J.S. Future disaster scenario using big data: A case study of extreme cold wave. Int. J. Des. Nat. Ecodyn. 2016, 11, 362–369. [Google Scholar] [CrossRef]
- Waugh, W.L. Shelter from the storm: Repairing the national emergency management system after hurricane Katrina. Ann. Am. Acad. Political Soc. Sci. 2006, 604, 288–332. [Google Scholar] [CrossRef]
- Nath, R.; Shannon, H.; Kabali, C.; Oremus, M. Investigating the key indicators for evaluating post-disaster shelter. Disasters 2016, 41, 606. [Google Scholar] [CrossRef] [PubMed]
- Zhao, L.; Li, H.; Sun, Y.; Huang, R.; Hu, Q.; Wang, J.; Gao, F. Planning emergency shelters for urban disaster resilience: An integrated location-allocation modeling approach. Sustainability 2017, 9, 2098. [Google Scholar] [CrossRef]
- Quarantelli, E.L. Patterns of sheltering and housing in US disasters. Disaster Prev. Manag. Int. J. 1995, 4, 43–53. [Google Scholar] [CrossRef]
- Soltani, A.; Ardalan, A.; Darvishi Boloorani, A.; Haghdoost, A.; Hosseinzadeh-Attar, M.J. Site selection criteria for sheltering after earthquakes: A systematic review. PLoS Curr. 2014, 6. [Google Scholar] [CrossRef] [PubMed]
- Ministry of Housing and Urban-Rural Development of the People’s Republic of China. Code for Design of Disasters Mitigation Emergency Congregate Shelter; Architecture & Building Press: Beijing, China, 2015. (In Chinese)
- Yang, N.; Chen, S.; Hu, W.; Wu, Z.; Yi, C. Spatial Distribution Balance Analysis of Hospitals in Wuhan. Int. J. Environ. Res. Public Health 2016, 13, 971. [Google Scholar] [CrossRef] [PubMed]
- Yang, X.; Wang, Z.; Li, Z.; Tang, Z. An assessment of urban park access in Shanghai: Implications for the social equity in urban China. Landsc. Urban Plan. 2017, 157, 383–393. [Google Scholar] [CrossRef]
- Zhang, M. Exploring the relationship between urban form and nonwork travel through time use analysis. Landsc. Urban Plan. 2005, 73, 244–261. [Google Scholar] [CrossRef]
- Gregory, D.; Johnston, R.; Pratt, G.; Watts, M.J.; Whatmore, S. The Dcitionary of Human Geography, 5th ed.; Wiley-Blackwell: Hoboken, NJ, USA, 2009; p. 152. ISBN 9781405132886. [Google Scholar]
- Unal, M.; Uslu, C. GIS-Based Accessibility Analysis of Urban Emergency Shelters: The Case of Adana City. ISPRS Int. Arch. Photogramm. Remote Sens. Spat. Inf. Sci. 2016, 95–101. [Google Scholar] [CrossRef]
- Rigolon, A. A complex landscape of inequity in access to urban parks: A literature review. Landsc. Urban Plan. 2016, 153, 160–169. [Google Scholar] [CrossRef]
- Wang, F.H. Measurement, optimization, and impact of health care accessibility: A methodological review. Ann. Assoc. Am. Geogr. 2012, 102, 1104–1112. [Google Scholar] [CrossRef] [PubMed]
- Kwan, M.P. Space-time and integral measures of individual accessibility: A comparative analysis using a point-based framework. Geogr. Anal. 1998, 30, 191–216. [Google Scholar] [CrossRef]
- Talen, E. Neighborhoods as service providers: A methodology for evaluating pedestrian access. Environ. Plan. B Plan. Des. 2003, 30, 181–200. [Google Scholar] [CrossRef]
- Tao, Z.; Cheng, Y. Research Progress of the Two-Step Floating Catchment Area Method and Extensions. Prog. Geogr. 2016, 35, 589–599. (In Chinese) [Google Scholar] [CrossRef]
- Nicholls, S. Measuring the accessibility and equity of public parks: A case study using GIS. Manag. Leis. 2001, 6, 201–219. [Google Scholar] [CrossRef]
- Vaughan, K.B.; Kaczynski, A.T.; Wilhelm, S.S.A.; Besenyi, G.M.; Bergstrom, R.; Heinrich, K.M. Exploring the distribution of park availability, features, and quality across Kansas city, Missouri by income and race/ethnicity: An environmental justice investigation. Ann. Behav. Med. 2013, 45 (Suppl. 1), S28–S38. [Google Scholar] [CrossRef] [PubMed] [Green Version]
- Li, X.; Xiu, C.; Cheng, L.; Wang, N. Evaluation on spatial structure and rationality of city parks based on goal of disaster prevention: An application of proximal area method in Changchun, China. Chin. J. Appl. Ecol. 2016, 27, 3641–3648. (In Chinese) [Google Scholar] [CrossRef]
- Smoyer-Tomic, K.E.; Hewko, J.N.; Hodgson, M.J. Spatial accessibility and equity of playgrounds in edmonton, canada. Can. Geogr. 2010, 48, 287–302. [Google Scholar] [CrossRef]
- Yu, K.; Duan, T.; Li, D.; Peng, J. Landscape accessibility as a measurement of the function of urban green system. Plan. Stud. 1999, 23, 8–11. (In Chinese) [Google Scholar]
- Gu, Z.; Xu, W.; Yuan, Y.; Zhou, H.; Ge, Y. Evaluation of Disaster Shelter Planning in Rural Areas: A Case Study of Xiaoyudong Town in Sichuan Province. J. Catastrophol. 2011, 26, 115–119. (In Chinese) [Google Scholar] [CrossRef]
- Miyake, K.K.; Maroko, A.R.; Grady, K.L.; Maantay, J.A.; Arno, P.S. Not Just a Walk in the Park: Methodological Improvements for Determining Environmental Justice Implications of Park Access in New York City for the Promotion of Physical Activity. Cities Environ. 2010, 3, 1–17. [Google Scholar] [CrossRef] [PubMed]
- Luo, W.; Wang, F. Measures of spatial accessibility to health care in a GIS environment: Synthesis and a case study in the Chicago region. Environ. Plan. B Urban Anal. City Sci. 2003, 30, 865–884. [Google Scholar] [CrossRef]
- Suárez-Vega, R.; Santos-Peñate, D.R.; Dorta-González, P.; Rodríguez-Díaz, M. A multi-criteria GIS based procedure to solve a network competitive location problem. Appl. Geogr. 2011, 31, 282–291. [Google Scholar] [CrossRef]
- McGrail, M.R.; Humphreys, J.S. Measuring spatial accessibility to primary care in rural areas: Improving the effectiveness of the two-step floating catchment area method. Appl. Geogr. 2009, 29, 533–541. [Google Scholar] [CrossRef]
- Dony, C.C.; Delmelle, E.M.; Delmelle, E.C. Re-conceptualizing accessibility to parks in multi-modal cities: A variable-width floating catchment area (VFCA) method. Landsc. Urban Plan. 2015, 143, 90–99. [Google Scholar] [CrossRef]
- Kocatepe, A.; Ulak, M.B.; Ozguven, E.E.; Horner, M.W.; Arghandeh, R. Socioeconomic characteristics and crash injury exposure: A case study in Florida using two-step floating catchment area method. Appl. Geogr. 2017, 87, 207–221. [Google Scholar] [CrossRef]
- Tao, Z.; Cheng, Y.; Dai, T.; Rosenberg, M.W. Spatial optimization of residential care facility locations in Beijing, china: Maximum equity in accessibility. Int. J. Health Geogr. 2014, 13, 33. [Google Scholar] [CrossRef] [PubMed]
- Dai, D. Racial/ethnic and socioeconomic disparities in urban green space accessibility: Where to intervene? Landsc. Urban Plan. 2011, 102, 234–244. [Google Scholar] [CrossRef]
- Wan, N.; Zou, B.; Sternberg, T. A three-step floating catchment area method for analyzing spatial access to health services. Int. J. Geogr. Inf. Sci. 2012, 26, 1073–1089. [Google Scholar] [CrossRef]
- Luo, J. Integrating the Huff Model and Floating Catchment Area Methods to Analyze Spatial Access to Healthcare Services. Trans. GIS 2014, 18, 436–448. [Google Scholar] [CrossRef]
- Fransen, K.; Neutens, T.; De Maeyer, P.; Deruyter, G. A commuter-based two-step floating catchment area method for measuring spatial accessibility of daycare centers. Health Place 2015, 32, 65–73. [Google Scholar] [CrossRef] [PubMed]
- Luo, W.; Whippo, T. Variable catchment sizes for the two-step floating catchment area (2SFCA) method. Health Place 2012, 18, 789–795. [Google Scholar] [CrossRef] [PubMed]
- Jamtsho, S.; Corner, R.; Dewan, A. Spatio-Temporal Analysis of Spatial Accessibility to Primary Health Care in Bhutan. ISPRS Int. J. Geo-Inf. 2015, 4, 1584–1604. [Google Scholar] [CrossRef] [Green Version]
- Zhou, A.; Zhang, J.; Zhang, Y.; Fu, X. Study on the Emergency Shelter Accessibility and Distribution in Beijing Based on the GIS. Bull. Surv. Mapp. 2016, 1, 111–114. (In Chinese) [Google Scholar] [CrossRef]
- Tang, B.; Wang, D.; Song, Y.; Qiu, J.; Yan, Y.; Zhang, Z. Research on the emergency shelter accessibility in urban communities. J. Risk Anal. Crisis Response 2017, 7, 230. [Google Scholar] [CrossRef]
- Li, M.; Yang, L.; Wei, Y. Improved Gaussian Based 2-Step Floating Catchment Area Method: A Case Study of Green Space Accessibility in Shanghai. Prog. Geogr. 2016, 35, 990–996. (In Chinese) [Google Scholar] [CrossRef]
- Wu, H.; Liu, L.; Yu, Y.; Peng, Z. Evaluation and Planning of Urban Green Space Distribution Based on Mobile Phone Data and Two-Step Floating Catchment Area Method. Sustainability 2018, 10, 214. [Google Scholar] [CrossRef]
- Zhou, A.; Zhang, J.; Fu, X. Research on the Spatial Distribution of the Urban-Emergency Shelter in Beijing Downtown Areas. J. Saf. Environ. 2014, 14, 151–156. (In Chinese) [Google Scholar] [CrossRef]
- Luo, W.; Qi, Y. An enhanced two-step floating catchment area (E2SFCA) method for measuring spatial accessibility to primary care physicians. Health Place 2009, 15, 1100–1107. [Google Scholar] [CrossRef] [PubMed]
- McGrail, M.R.; Humphreys, J.S. Measuring spatial accessibility to primary health care services: Utilising dynamic catchment sizes. Appl. Geogr. 2014, 54, 182–188. [Google Scholar] [CrossRef]
- Ni, J.; Wang, J.; Rui, Y.; Qian, T.; Wang, J. An Enhanced Variable Two-Step Floating Catchment Area Method for Measuring Spatial Accessibility to Residential Care Facilities in Nanjing. Int. J. Environ. Res. Public Health 2015, 12, 14490–14504. [Google Scholar] [CrossRef] [PubMed] [Green Version]
- Zhou, A.; Zhang, J.; Du, S.; He, D.; Fu, X. Spatial Accessibility of Emergency Shelters in Beijing Based on Improved Two-Step Floating Catchment Area Method. Sci. Surv. Mapp. 2017, 42, 88–92. (In Chinese) [Google Scholar] [CrossRef]
- McGrail, M.R. Spatial accessibility of primary health care utilising the two step floating catchment area method: An assessment of recent improvements. Int. J. Health Geogr. 2012, 25, 1–11. [Google Scholar] [CrossRef] [PubMed]
- Chen, X.; Li, Q. Modeling road network vulnerability for evacuees and first responders in no-notice evacuation. J. Adv. Transp. 2017, 2017, 1–12. [Google Scholar] [CrossRef]
- Ministry of Housing and Urban-Rural Development of the People’s Republic of China. Standard for Urban Planning on Earthquake Resistance and Hazardous Prevention; Architecture & Building Press: Beijing, China, 2015. (In Chinese)
- Chen, Z.; Chen, X.; Li, Q.; Chen, J. The temporal hierarchy of shelters: A hierarchical location model for earthquake-shelter planning. Int. J. Geogr. Inf. Sci. 2013, 27, 1612–1630. [Google Scholar] [CrossRef]
- European Commission, Joint Research Centre (JRC). Columbia University, Center for International Earth Science Information Network—CIESIN (2015): GHS Population Grid, Derived from GPW4, Multitemporal (1975, 1990, 2000, 2015); European Commission, Joint Research Centre (JRC): Brussels, Belgium, 2015. [Google Scholar]
- The Planning Outline of Earthquake and Emergency Shelter (Outdoor) in Beijing. Available online: http://www.bjghw.gov.cn/web/static/articles/catalog_30000/article_ff80808122dedb360122eeb648c50046/ff80808122dedb360122eeb648c50046.html (accessed on 20 December 2017). (In Chinese)
- Allan, D.P. Catchments of general practice in different countries—A literature review. Int. J. Health Geogr. 2014, 13, 32. [Google Scholar] [CrossRef] [PubMed]
Figure 1.
Flow diagram of steps of calculating catchment sizes in the improved 2SFCA method.

Figure 2.
Location of the study area and the spatial distribution of population and emergency shelters in Changchun.
Figure 2.
Location of the study area and the spatial distribution of population and emergency shelters in Changchun.

Figure 3.
The spatial distributions of the road network and emergency shelter in Changchun.

Figure 4.
(a) Differences in shelter catchment sizes between the improved 2SFCA method and original 2SFCA method; (b) Catchment sizes of the emergency shelters in the improved 2SFCA method.
Figure 4.
(a) Differences in shelter catchment sizes between the improved 2SFCA method and original 2SFCA method; (b) Catchment sizes of the emergency shelters in the improved 2SFCA method.

Figure 5.
(a) Differences in population catchment sizes between the improved 2SFCA method and original 2SFCA method; (b) Catchment sizes of populations by the improved 2SFCA method.
Figure 5.
(a) Differences in population catchment sizes between the improved 2SFCA method and original 2SFCA method; (b) Catchment sizes of populations by the improved 2SFCA method.

Figure 6.
(a) Differences in shelter supply-demand ratios between the improved 2SFCA method and original 2SFCA method; (b) Supply-demand ratios of shelters in the improved 2SFCA method; (c) Supply-demand ratios of shelters in the original 2SFCA method.
Figure 6.
(a) Differences in shelter supply-demand ratios between the improved 2SFCA method and original 2SFCA method; (b) Supply-demand ratios of shelters in the improved 2SFCA method; (c) Supply-demand ratios of shelters in the original 2SFCA method.

Figure 7.
(a) Differences in emergency shelter accessibility in the improved 2SFCA and original 2SFCA method; (b) Emergency shelter accessibility in the improved 2SFCA method; (c) Emergency shelter accessibility in the original 2SFCA method.
Figure 7.
(a) Differences in emergency shelter accessibility in the improved 2SFCA and original 2SFCA method; (b) Emergency shelter accessibility in the improved 2SFCA method; (c) Emergency shelter accessibility in the original 2SFCA method.


Table 1.
The categories of the accessibility measurements.1
| Accessibility Measurement | Definition |
|---|---|
| Container | The number of facilities within a given spatial unit (e.g., census tract, political district, or municipal boundary) [18]. |
| Coverage | The number of facilities within a certain distance from a demand point (it is sometimes described as the cumulative opportunity method) [19,20]. |
| Minimum distance | The distance between a demand point and the nearest facility [21]. |
| Travel cost | The average distance (cost) between a demand point and all related facilities [22,23]. |
| Gravity Model | An index computed by sum of facilities (weighted by their size or other properties) and adjusted by the effect of distance decay [16,25]. |
Table 2.
Classification and statistics of hierarchical emergency shelters [7].
Table 2.
Classification and statistics of hierarchical emergency shelters [7].
| Level of Emergency Shelter | Effective Shelter Area 1 (hm2) | Per-Capita Effective Shelter Area (m2/person) |
|---|---|---|
| Emergency Evacuation and Embarkation Shelter | <0.2 | 0.5 |
| Resident Emergency Congregate Shelter (short-term) | 0.2~1.0 | 2.0 |
| Resident Emergency Congregate Shelter (mid-term) | 1.0~5.0 | 3.0 |
| Resident Emergency Congregate Shelter (long-term) | 5.0~20.0 | 4.5 |
| Central Emergency Congregate Shelter | ≥20.0 | ≥5.0 |
1 Excluding the area occupied by emergency functions, such as emergency command post, medical and health care facilities, material storage and professional disaster relief workers, the area for sheltering evacuees and setting up emergency facilities within emergency shelters is the effective shelter area. The emergency shelters are classified by their effective shelter area [49].
Table 3.
Statistics of shelter accessibility in the improved 2SFCA method and original 2SFCA method.
Table 3.
Statistics of shelter accessibility in the improved 2SFCA method and original 2SFCA method.
| Method | Minimum | Maximum | Average | Standard Deviation | Variable Coefficient |
|---|---|---|---|---|---|
| Improved 2SFCA | 0 | 6.545 | 0.195 | 0.361 | 185.128% |
| Original 2SFCA | 0 | 437.713 | 14.282 | 15.197 | 106.407% |
© 2018 by the authors. Licensee MDPI, Basel, Switzerland. This article is an open access article distributed under the terms and conditions of the Creative Commons Attribution (CC BY) license (http://creativecommons.org/licenses/by/4.0/).
Share and Cite
MDPI and ACS Style
Zhu, X.; Tong, Z.; Liu, X.; Li, X.; Lin, P.; Wang, T. An Improved Two-Step Floating Catchment Area Method for Evaluating Spatial Accessibility to Urban Emergency Shelters. Sustainability 2018, 10, 2180. https://doi.org/10.3390/su10072180
AMA Style
Zhu X, Tong Z, Liu X, Li X, Lin P, Wang T. An Improved Two-Step Floating Catchment Area Method for Evaluating Spatial Accessibility to Urban Emergency Shelters. Sustainability. 2018; 10(7):2180. https://doi.org/10.3390/su10072180
Chicago/Turabian StyleZhu, Xiaomeng, Zhijun Tong, Xingpeng Liu, Xiangqian Li, Pengda Lin, and Tong Wang. 2018. "An Improved Two-Step Floating Catchment Area Method for Evaluating Spatial Accessibility to Urban Emergency Shelters" Sustainability 10, no. 7: 2180. https://doi.org/10.3390/su10072180
Note that from the first issue of 2016, this journal uses article numbers instead of page numbers. See further details here.