1. Introduction
Urban industrial land use in China is characterised by large increments, a high proportion of stock, and inefficient use. The total area of urban industrial land increased twelvefold from 841.9 km
2 in 1990 to 10,298.7 km
2 in 2015 [
1]. Among newly added urban construction lands, industrial lands account for 60% to 80%, representing the largest incremental quantity of urban construction lands. The area of urban industrial lands accounted for 20% of the total area of urban construction lands in 2015, far higher than the average level in other countries (10% to 15%) [
2]. Over the years, industrial lands have expanded dramatically and haphazardly for various reasons (for example, land allocation by administrative orders, agreement-based land grants, and low-price land grant by bid, auction, and listing); this has resulted in severe inefficiency in industrial land use [
3]. Compared with developed countries and regions, China experiences very low urban industrial land use efficiency (UILUE). Even in Shanghai and Shenzhen, which lead in the intensive use of industrial land, the output intensity of industrial land was only 7.1 × 10
8 US
$/km
2 and 9.1 × 10
8 US
$/km
2, respectively, in 2014, far lower than that of developed cities such as Singapore (23.3 × 10
8 US
$/km
2 in 2007), London (38.6 × 10
8 US
$/km
2 in 2005), and Tokyo (24.2 × 10
8 US
$/km
2 in 2007) [
4].
To strengthen the supervision of urban industrial land use and promote the intensive and efficient use of urban industrial lands, the State Council promulgated the
Notice on Promoting the Economical and Intensive Use of Lands in 2008, and the Ministry of Land and Resources promulgated the
Provisions on the Economical and Intensive Use of Lands in 2015, which sets forth the provisions regarding industrial land use, including input/output evaluation, idle land disposal, underground space development, and standards for construction projects. In recent years, a series of new concepts, including Smart Growth [
5,
6], Multiple Intensive Land Use [
7,
8], Compact City [
9], and Urban Boundary [
10], have been developed to improve UILUE. Several provinces and municipalities of China have adopted various measures, such as reduction in urban construction lands in Shanghai, transformation of old towns, factories and villages in Guangdong, and “Double Improvement” (e.g., improve land use intensity and benefits) in Jiangsu, to improve UILUE. Thus, it is important to analyse China’s UILUE and provide suggestions for urban industrial land use policies.
Extant studies focus on evaluating UILUE, its spatiotemporal variation, and the driving forces behind it. So far, there have been studies that evaluate UILUE; at most, UILUE has been quantitatively measured in terms of economic, social, and ecological benefits by an evaluation index system [
11]. The commonly used evaluation methods include the analytic hierarchy process (AHP) [
12] and data envelopment analysis (DEA) [
13]. Studies of spatiotemporal variation mainly focus on a comparison between provinces, typical economic zones, and specific cities. At the provincial level, the UILUE in China’s eastern region is far higher than that in the central and western regions. The UILUE differs between the eastern and western regions more significantly than it does between the central and northeast regions [
14]. In recent years, however, the UILUE difference between provinces is gradually diminishing in the west of China [
15]. Studies on China’s six main economic regions show an obvious spatial agglomeration in the Yangtze River Delta in terms of UILUE [
16]. Given that the provincial analytical unit is too large scale to depict the spatial characteristics pertinent to policy making, more serious attention must be paid to the meso level based on prefectural level units. In specific cities, the use efficiency of heavy industry lands is higher than that of light industry lands [
17].
Therefore, this study aims to examine the spatial pattern of UILUE on the prefectural level in China from 2000 to 2014, and then explore the influence of spatial effect on UILUE. The Chinese government can use the findings of this study for reference when it formulates differentiated industrial land supply policies. The paper is organized as follows. The data and methods employed in this study are discussed in
Section 2. The findings on the evolution of the spatiotemporal pattern of UILUE are presented in
Section 3. The influential mechanisms and policy implications are discussed in the concluding
Section 4.
2. Data and Methods
2.1. Data
The basic spatial analysis units in this study are China’s 345 administrative units under the provinces (namely, four state-administered municipalities, 268 prefecture-level cities, and 58 centrally administered counties). The study period is from 2000 to 2014. In China, there were no administrative division adjustments for prefecture-level cities from 2004 to 2010, but there were a few administrative division adjustments in other years. The data for other years are merged or split according to the administrative division of 2010 to ensure comparability of spatial units and data. Due to lack of data on Taiwan, Hong Kong, Macau, and Hainan, the spatial analysis does not incorporate these cities/regions.
In this study, UILUE is measured in terms of industrial land output intensity (namely, industrial output per unit area of industrial land). According to the existing studies, UILUE at the provincial level is primarily influenced by capital input, industrial agglomeration, technological improvement, and means of transportation [
18,
19,
20,
21,
22]. To explore the influence of urbanisation on the spatial pattern of UILUE, this paper uses per-capita GDP (PGDP) and proportion of industrial output (ID) to indicate the degree of capital agglomeration. Specifically, PGDP is equal to the ratio of GDP to total population in a region, and ID is equal to the ratio of total industrial output to GDP in a region. Urbanisation rate (UR) and proportion of industrial employees (IEP) are selected to indicate the degree of labour agglomeration. Specifically, UR is equal to the ratio of permanent urban population to total population in a region, and IEP is equal to the ratio of total industrial employee population to total employee population in a region. Industrial property right structure (IPRS) and foreign direct investment (FDI) are selected to indicate the degree of technology agglomeration. Specifically, IPRS is equal to the ratio of total output from state-owned and state holding industrial enterprises to total output from all industrial enterprises, and FDI refers to the actually used foreign capitals in the current year in a region. External traffic land area (TL) is used as a control variable to indicate traffic accessibility to a city.
Data sources for this study are the China Urban Construction Statistical Yearbook (for land use data) and the China City Statistical Yearbook, as well as the statistical yearbooks of the related provinces, municipalities, and autonomous regions (for data on economic and social development).
2.2. Methods
(1) Global spatial autocorrelation. Global spatial autocorrelation describes the spatial characteristics of the entire region with an attribute value, reflects the degree of dependence of the attribute value on the whole space, and can be measured in terms of Moran’s
I [
23,
24]. The value of global Moran’s
I statistic is usually in the range of −1 to 1. A global Moran’s
I greater than 0 indicates positive correlation, and a value approximately equal to 1 indicates that similar attributes are agglomerated together. If the statistic is smaller than 0, it indicates negative correlation; if it is approximately equal to −1, it indicates that alien attributes are agglomerated. A global Moran’s
I approximately equal to 0 indicates that the attributes are randomly distributed or there is no spatial autocorrelation [
25]. Neighbour relationships in spatial autocorrelation analysis are typically expressed in row-standardised spatial weight matrix “
W” [
26].
represents the spatial weights assigned to pairs of unites
i and
j. In this paper, neighbours were defined using rooks contiguity, which considers that all cities with common borders are neighbours. Global Moran’s
I can be calculated by Equation (1):
where
n is the number of spatial units,
is the weight matrix of proximity space which indicates the proximity relationship between different spaces,
and
represent the attribute values of spatial units
I and
j, respectively,
is the average attribute value, and
is the attribute variance.
Before calculating Moran’s
I, standardisation is performed on UILUE data. Standard deviation (
z-score) and probability (
p-value) returned by Moran’s
Iglobal are used to judge whether the null hypothesis is true or not [
27]. The
Z test was used to test the statistical significance of the observed Moran’s
I (Equation (2)):
where Z(I) represents the significance level of Moran’s I, E(I) is the mathematical expectation of Moran’s I, and VAR(I) is variation.
(2) Local spatial autocorrelation. Local Moran’s
I is used to identify whether there are observed similar or alien values agglomerated in a local area [
23]. It can be used to measure the degree of correlation between area
i and other areas, which is calculated with Equation (3):
A local Moran’s
I greater than 0 indicates that a high value is surrounded by high values or a low value is surrounded by low values. A value smaller than 0 indicates that a low value is surrounded by high values or a high value is surrounded by low values. Local spatial autocorrelation can be spatially represented by the Moran scatter plot and local indicator of spatial autocorrelation (LISA). The LISA significance map incorporates information about the significance of local spatial patterns. The mapping results of a spatial pattern are represented in five categories [
23]: (i) “High-High” indicates higher values surrounded by with higher values neighboured with
z-score larger than 1.96 (
p < 0.05), and represents positive spatial autocorrelation; (ii) “Low-High” indicates low values located nearby units with higher values with
z-score smaller than −1.96 (
p < 0.05), and indicates negative spatial autocorrelation; (iii) “Low-Low” indicates lower values surrounded by lower values nearby with
z-score larger than 1.96 (
p < 0.05), and means positive spatial autocorrelation; (iv) “High-Low” indicates higher values adjacent to neighboring units with lower values with
z-score smaller than −1.96 (
p < 0.05), and means negative spatial autocorrelation; and (v) “Not Significant” means that no statistically significant spatial autocorrelation observed. The High-High and Low-Low locations (positive local spatial autocorrelation) are typically referred to spatial clusters or spatial agglomerations, while the High-Low and Low-High locations (negative local spatial autocorrelation) are termed as spatial outliers. It should be noted that the spatial clusters or agglomerations shown on LISA cluster maps only refer to the core of the clusters [
28].
(3) Spatial regression model. The spatial regression models herein mainly include the spatial lag model (SLM) and spatial error model (SEM). The SLM and SEM can be respectively formulated as follows:
where Y is a dependent variable vector of n × 1, X is an independent variable matrix of n × k, C is a constant, and β is the variable coefficient, which indicates the influence of the independent variable X on the dependent variable Y. p and λ respectively indicate the parameters of regression result in the SLM and SEM, and are used to measure the spatial dependence of observed values, namely, the direction and degree of influence on the observed value Y in the current area from the observed value Y in the proximal area. ε is the random error term, μ is a random error that follows a normal distribution, and WN is an n × n spatial weight matrix. In a binary adjacency matrix of (0,1), Wij is equal to 1 when areas i and j are adjacent to each other; Wij is equal to 0 in other circumstances.
3. Results and Findings
3.1. Spatiotemporal Variation of UILUE
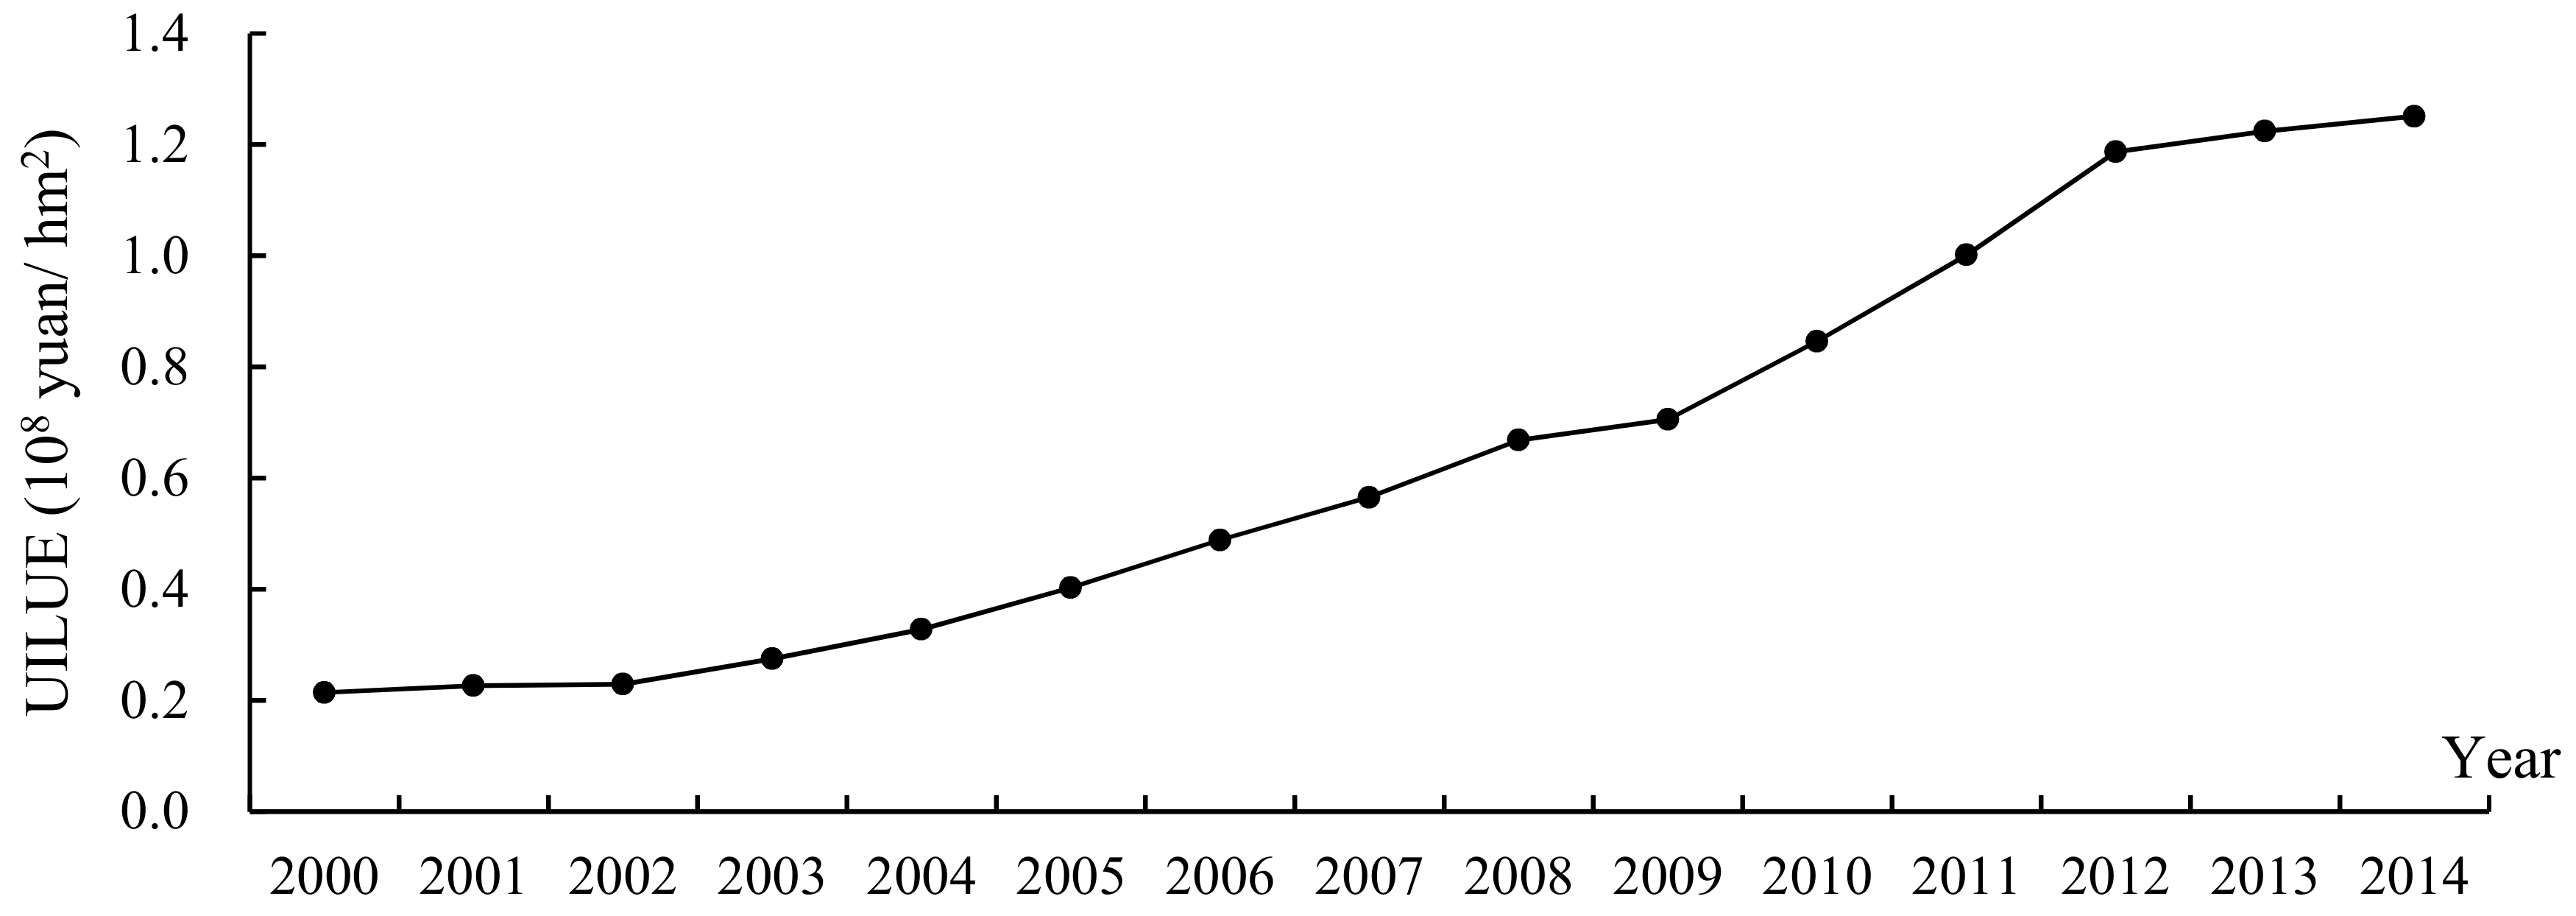
During the years 2000 to 2014, China experienced rapid continuous improvement in UILUE. Specifically, UILUE increased by 495.2%, from 0.2 × 10
8 yuan/hm
2 in 2000 to 1.3 × 10
8 yuan/hm
2 in 2014 (
Figure 1). Since 2003, China’s GDP has kept growing at an average annual rate of 10%, thus producing a larger demand for industrial land. In 2003, the General Office of the State Council promulgated the
Notice on Readjusting Various Development Zones and Strengthening Construction Land Management (GBF (2003) No. 70). The intent was to prohibit agreement-based land grants at low prices, place strict restrictions on the founding of development zones based on large-scale land development, and hold down the expansion trend of various industrial development zones. Therefore, UILUE has maintained a rapidly improving trend after 2003. During the years 2000 to 2012, UILUE has shown an average annual growth rate of 17.6%. In 2013, China’s GDP growth rate declined to 7.7%; UILUE increased very slightly, and at an obviously lower rate. Evidently, the variation in UILUE is closely correlated with China’s economic development and industrial land management policies.
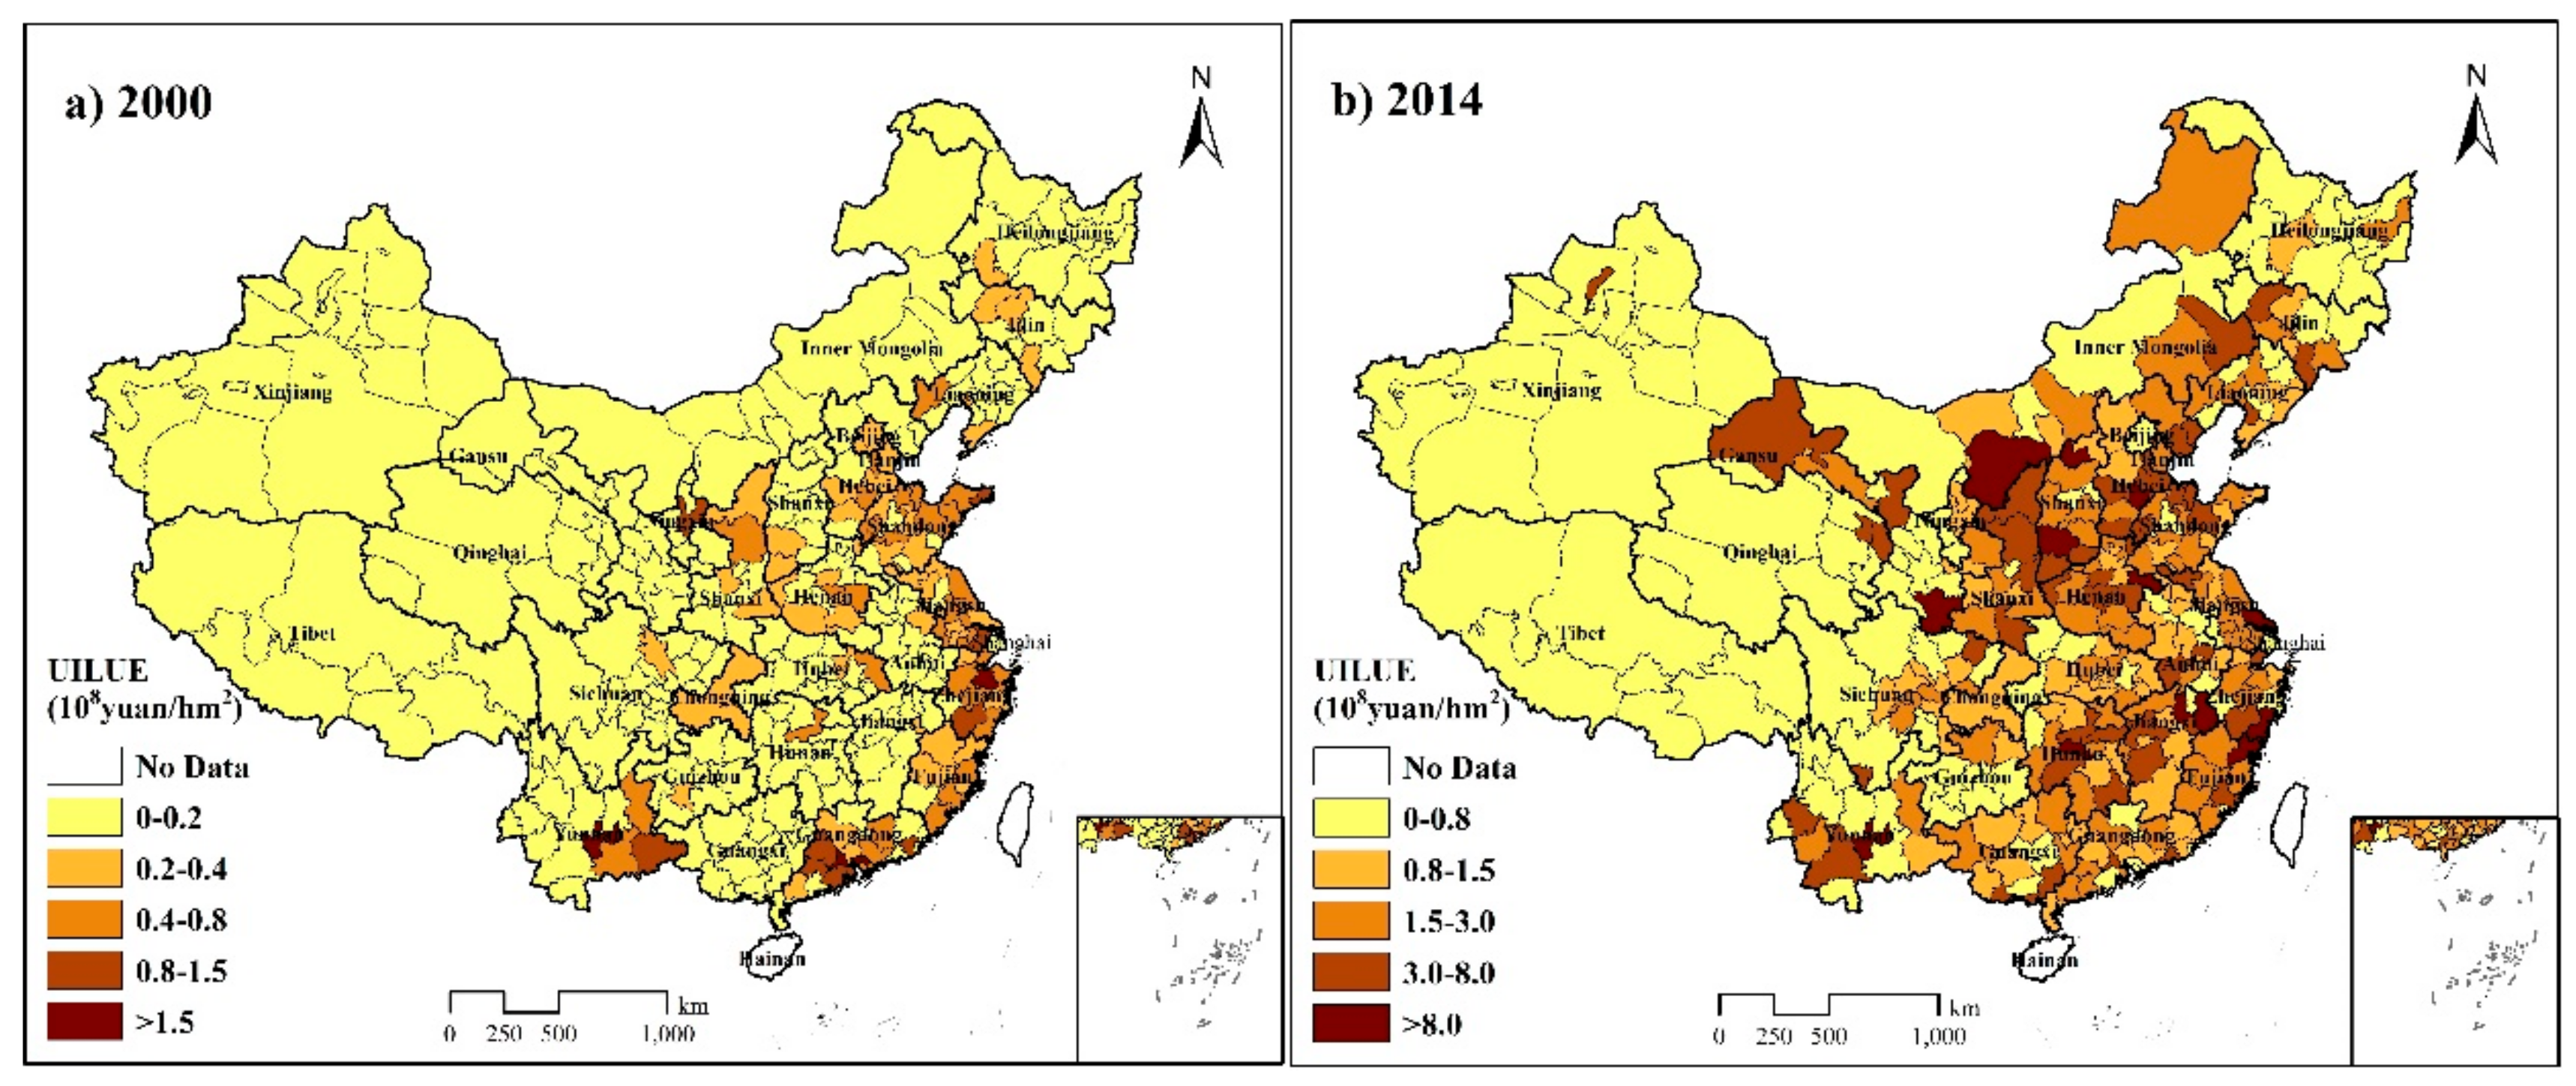
UILUE is characterized by great spatiotemporal variation at the city level. In 2000, UILUE was low in China overall, but it was high in eastern regions and low in central and western regions (
Figure 2a). UILUE is greater than 1.5 × 10
8 yuan/hm
2 in four cities. Among the cities of China, the UILUE of Shaoxing City is the highest (1.9 × 10
8 yuan/hm
2). It ranges between 0.8 × 10
8 and 1.5 × 10
8 yuan/hm
2 in 10 cities, between 0.4 × 10
8 and 0.8 × 10
8 yuan/hm
2 in 35 cities, mainly along the eastern coastal region, and between 0.2 × 10
8 and 0.4 × 10
8 yuan/hm
2 in 48 cities, mostly in the eastern coastal regions with a few in the central regions (e.g., Shaanxi, Shanxi, Henan, and Chongqing). In 249 cities (mainly distributed in the central, western and northeast regions), UILUE is below 0.2 × 10
8 yuan/hm
2 (
Figure 2a). The spatial pattern of UILUE witnessed great change from 2000 to 2014. UILUE is greater than 1.5 × 10
8 yuan/hm
2 in 147 cities (
Figure 2b). Specifically, UILUE is greater than 8.0 × 10
8 yuan/hm
2 in 12 cities, while it ranges between 3.0 × 10
8 and 8.0 × 10
8 yuan/hm
2 in 54 cities and between 1.5 × 10
8 and 3.0 × 10
8 yuan/hm
2 in 12 cities. It is below 0.8 × 10
8 yuan/hm
2 in 121 cities, mainly distributed in the remote western regions (e.g., Xizang, Xinjiang, and Qinghai). The spatiotemporal variation in UILUE assumes two characteristics: (1) UILUE has improved significantly in most cities of China over the 14 years; and (2) the high-UILUE belt, mainly located in the eastern coastal regions in 2000, expanded towards the central and other eastern regions over the period, whereas the UILUE of the western regions increased very slowly.
3.2. Spatial Pattern Variation of in UILUE
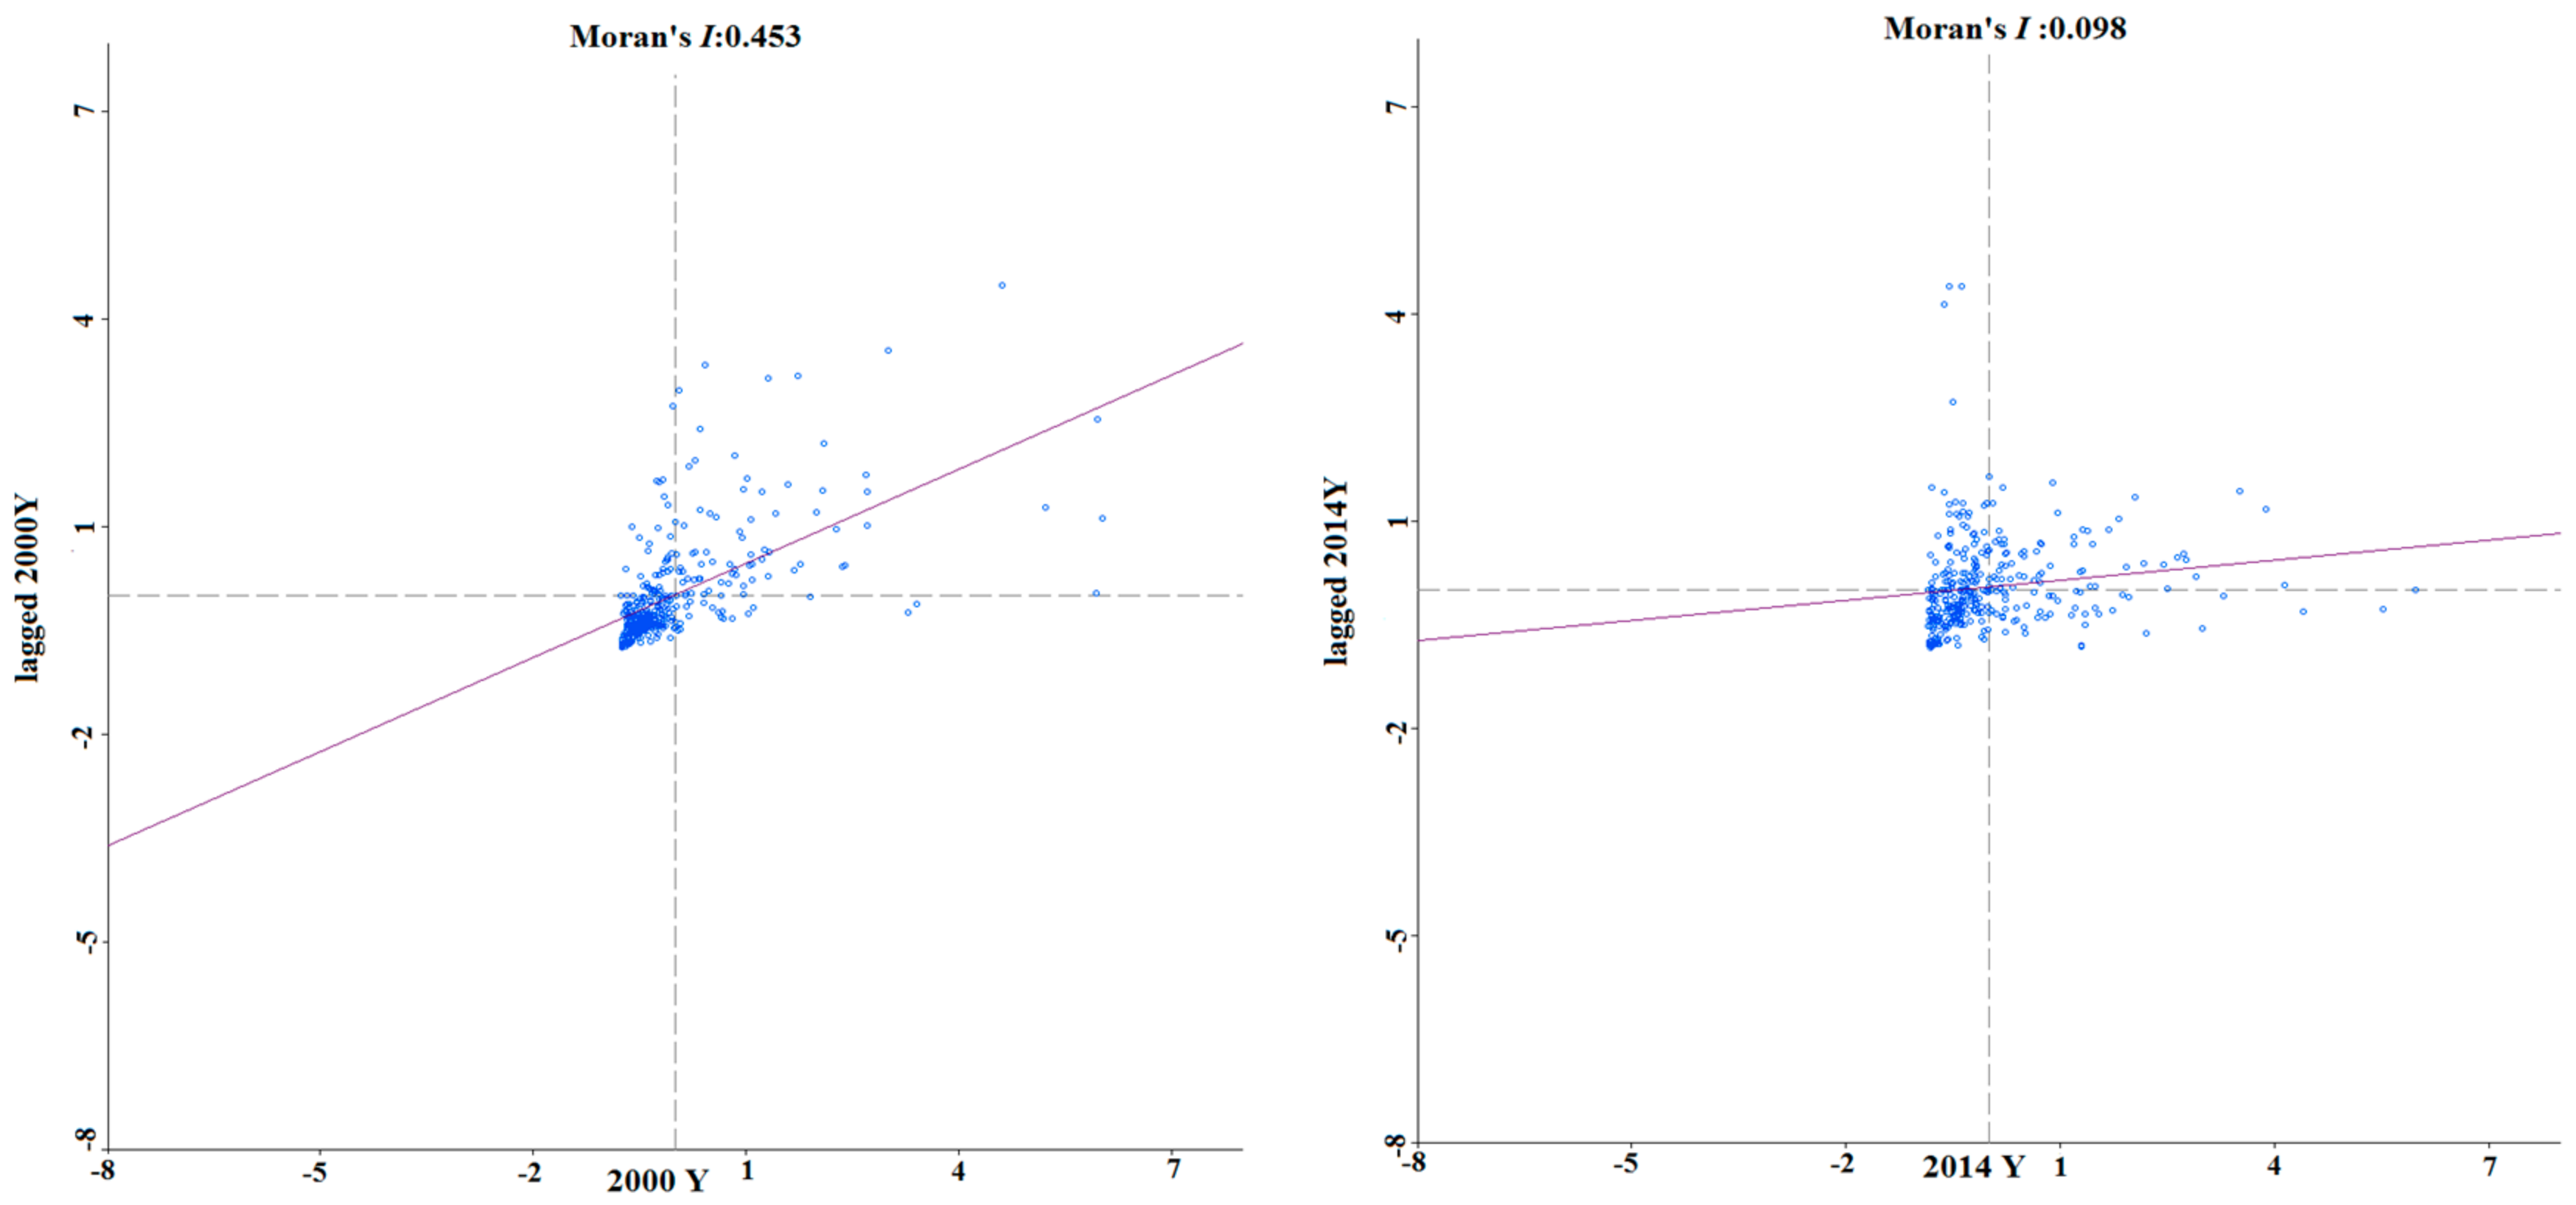
Figure 3 shows the Moran scatter plot of UILUE in 2000 and 2014. The Moran scatter plot reflects the spatial variation pattern in UILUE. Overall, the global Moran’s
I for UILUE tends to decrease, specifically, from 0.453 (
p = 0.001) in 2000 to 0.098 (
p = 0.001) in 2014; all global Moran’s
I values have passed the significance test at 1%. Specifically, the figure shows a shift from a strong to a weak positive spatial correlation and from an agglomerated to a random spatial pattern.
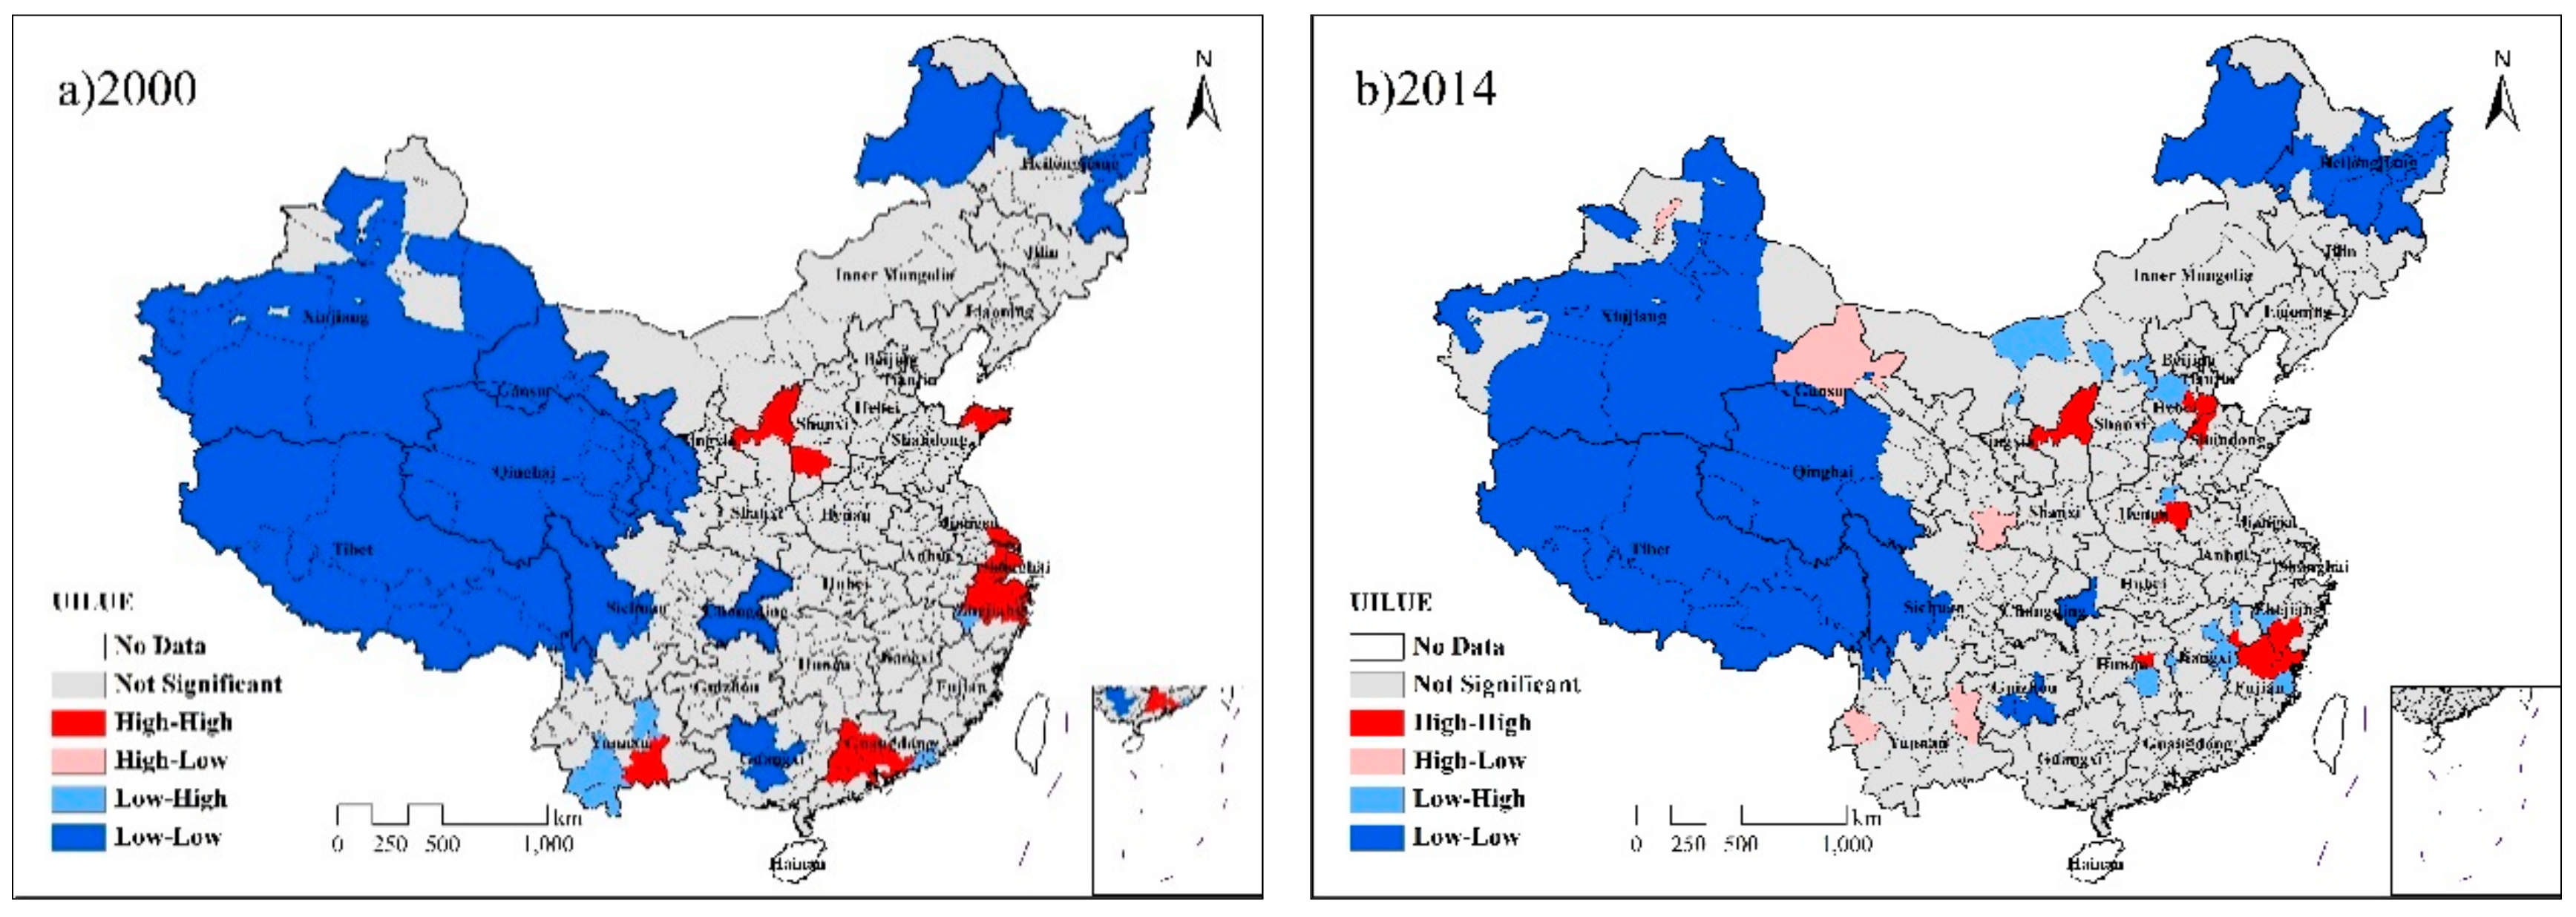
Figure 4 shows the spatial agglomeration pattern of China’s UILUE in 2000 and 2014. Over the 14 years, the spatial pattern of UILUE underwent a great change, particularly in the high-high and low-low regions (
Figure 4a). In 2000, the high-high regions comprised 22 cities, mainly distributed in the Yangtze River Delta, Pearl River Delta, Shandong Peninsula, and the north of Shaanxi. In 2014, the high-high regions comprised only 7 cities, mainly distributed in the Fujian-Zhejiang and Hebei-Shandong border areas, and the north of Shaanxi, rather than in the Yangtze River Delta and Pearl River Delta (
Figure 4b). Evidently, the UILUE of the Yangtze River Delta and Pearl River Delta has decreased overall, implying that the manufacturing industries of the two regions face a sustainability challenge and that the industrial land use in the two regions needs to be transformed.
In 2000, the low-low regions comprised 47 cities, mainly distributed in Xizang, Xinjiang, Qinghai, Gansu, Chongqing, west of Sichuan, the Inner Mongolia-Heilongjiang border areas, and Guangxi (
Figure 4a). In 2014, the low-low regions comprised only 33 cities, and the spatial variation pattern is primarily a shrinkage of western regions and expansion of the northeast regions. Specifically, certain cities in Chongqing, Gansu, and Qinghai no longer fall within the low-low regions, whereas most cities in Heilongjiang do so (
Figure 4b). The low-high and high-low regions are spatially scattered and no clear pattern can be observed. Overall, UILUE has a significant agglomeration pattern, but the spatial agglomeration tends to weaken; in particular, the Yangtze River Delta and Pearl River Delta no longer fall within the high-high regions.
3.3. Influencing Factor Analysis for UILUE
Table 1 presents the Ordinary Least Square (OLS) estimation results for UILUE for 2000 and 2014. In light of the discrimination rules for spatial dependence [
23], all the Lagrange Multiplier Lag (LM-LAG) and Lagrange Multiplier Error (LM-ERR) estimation results for UILUE for 2000 are significant. This shows that UILUE is not randomly distributed spatially, so spatial dependence should be introduced for correction. However, the Robust LM-ERR is not significant, but the Robust LM-LAG is significant. Therefore, the SLM is more suitable. The LM-LAG and LM-ERR estimation results on UILUE for 2014 are not significant. This shows that the OLS model can account for spatial correlation.
Table 2 presents the SLM and OLS estimation results with respect to UILUE for 2000 and 2014, respectively. In 2000, the SLM R
2 value of UILUE is 0.516, which is higher than the OLS result for UILUE (0.476). This shows that the SLM estimation results are preferable to the OLS. Therefore, it is impossible that UILUE for 2000 could be independent among spatial units. The linear regression model based on OLS estimation omits spatial correlation, so spatial dependence should be introduced to address this. In the SLM of UILUE, the spatial lag coefficient (ρ) is 0.246, which passes the test of 1% significance. This shows an obvious spatial diffusion effect for UILUE between different regions.
PGDP had a significant influence on UILUE in both 2000 and 2014. Specifically, an increase in PGDP by 10,000 yuan increased UILUE by 0.055 × 10⁸ yuan/hm2 in 2000 and by 0.205 × 108 yuan/hm2 in 2014. PGDP reflects the degree of urban economic agglomeration, and an increase in economic agglomeration would have a significant positive influence on UILUE.
ID had a significant influence on UILUE in both 2000 and 2014. Specifically, a 1% increase in ID improved UILUE by 0.009 × 10⁸ yuan/hm2 in 2000 and by 0.057 × 108 yuan/hm2 in 2014.
UR had a significant influence on UILUE in both 2000 and 2014. Specifically, a 1% increase in UR decreased UILUE by 0.220 × 10
8 yuan/hm
2 in 2000 and by 4.545 × 10
8 yuan/hm
2 in 2014. This corroborates Li and Luo’s analysis results regarding the influence of urbanisation on urban land use efficiency. Specifically, a 1% increase in UR will result in a decrease of urban land use efficiency by 0.57% when UR is below 0.68; while the urban land use efficiency will decrease by 3.84% with 1% increase in UR when UR is above 0.86 [
29]. A rise in UR increases the negative influence of urbanisation on urban land use efficiency.
IEP had a significant influence on UILUE in 2000, but not in 2014. Specifically, a 1% increase in IEP decreased UILUE by 1.623 × 10⁸ yuan/hm2 in 2000. China’s industrialisation was still in its initial stage in 2000, and most Chinese enterprises were resource consuming and labour intensive. The higher the IEP, the more labour-intensive enterprises in a region, and lower the UILUE.
IPRS had a significant influence on UILUE in 2000, but not in 2014. Specifically, a 1% increase in IPRS decreased UILUE by 0.310 × 10⁸ yuan/hm2 in 2000.
The influence of FDI on UILUE passed the significance test for both 2000 and 2014, although the influence in 2000 was very slight. Specifically, an increase in FDI by 100,000,000 yuan raised UILUE by 0.006 × 10⁸ yuan/hm2 in 2014.
TL had a significant influence on UILUE in 2000, but not in 2014. Specifically, an increase in TL by 1 hm2 decreased UILUE by 0.005 × 10⁸ yuan/hm2 in 2000. Usually, the higher the road density in a region, the higher the degree of intensive land use. China was undergoing a rapid growth stage in 2000. The transportation industry developed rapidly, and land for transportation was mainly allocated free of charge. Therefore, this land could be acquired easily, and economic considerations were not a constraint in the transportation industry. This may explain why TL has a significant negative influence on UILUE.
4. Discussions and Conclusions
This paper analyses the variation in the spatial pattern of UILUE in China during the years 2000 to 2014. The 14 years period witnessed continuous and rapid UILUE improvement in China. Despite great spatiotemporal variation in UILUE at the city level, the high-UILUE belt, which in 2009 fell within the eastern coastal regions, expanded towards the central and other eastern regions over the period.
Furthermore, UILUE is undergoing a spatial transformation from an agglomerated to a random pattern. In particular, the Yangtze River Delta and Pearl River Delta no longer have high UILUE. These regions have reached the highest level of economic vigour and competitiveness in China as a result of reforms and opening-up. In 2000, the Yangtze River Delta and Pearl River Delta—with respectively 17.6% and 6.7% of industrial lands—accounted for 29.2% and 14.7% of China’s total industrial output, respectively. Meanwhile, their UILUE scores were, respectively, 1.7 and 2.2 times China’s average UILUE. With further development of the agglomeration economy in the two regions, the labour-intensive manufacturing enterprises were forced to move to China’s central and eastern regions, because of the increase in land acquisition and labour costs and stricter environmental regulation [
30]. In the process of industrial transfer, the manufacturing industries in the economically developed regions (including the Yangtze River Delta and Pearl River Delta) have not been transformed and upgraded successfully. Meanwhile, the absence of secondary markets for industrial lands has hindered an effective exit of industrial lands. Therefore, in 2014, the Yangtze River Delta and Pearl River Delta respectively accounted for only 29.6% and 7.3% of China’s total industrial output, although their share of industrial land increased to 23.2% and 11.2%, respectively. Meanwhile, their UILUE respectively fell to 1.3 times and 0.7 times China’s average UILUE level. This may primarily explain why the Yangtze River Delta and Pearl River Delta no longer fall within the high-high regions.
In addition, the low-UILUE area is decreasing in China’s western regions but increasing in the northeast regions. To support the Western Development Strategy of China, the Ministry of Finance promulgated the
Notice on Preferential Tax Policy Issues Regarding Western Development in 2001, stipulating that if the domestic and foreign-funded enterprises registered in China’s western regions engage in the promoted industries, they could be entitled to a preferential corporate income tax rate of 15%. Due to this policy, the proportion of foreign capital invested in the central and western regions continues to increase, specifically from an average of 14.6% (1996 to 1999) to an average of 31.5% (2010 to 2012) [
31]. Due to their low factor costs and great market potential, Chongqing, Gansu, and Qinghai provide a unique advantage to industries relocating from the eastern regions. Consequently, they receive huge investments from the Yangtze River Delta and Pearl River Delta. In addition, the advanced technologies accompanying the backflow of labour has improved labour productivity by as much as 16.0% in the western regions, compared to 10.1% in the central regions and only 2.5% in the eastern regions [
32]. In recent years, the three northeastern provinces of China, especially Heilongjiang, have had to cope with an aging population, as well as a severe outflow of population, technology, and capital [
33], thus slowing down any UILUE increase.
In the process of urbanisation, the spatial pattern of UILUE is influenced by the agglomeration of labour, capital, and technology. Economic agglomeration serves to optimise a city’s economic structure and industrial layout, promote the upgrade of its technological level, strengthen the industrial scale effect, and improve the technical efficiency of urban land use [
34]. Akihiro et al. (2010) argue that enhancement of economic agglomeration and a rise in the market access threshold will increase total factor productivity. Li and Fang (2014) also argue that a high degree of industrial concentration and high level of industrialisation serve to increase industrial profitability and total factor productivity, thus improving land use efficiency [
35].
With the rise in the urbanisation rate, there seems to be an increase in the negative influence of population agglomeration on urban land use efficiency. This is because economic agglomeration has led to population agglomeration and, in turn, to quota allocation of construction land by governments. This is likely to cause a quantitative expansion of urban construction land, undermining improvement in urban land use efficiency. Moreover, China’s manufacturing industry is undergoing a transformation from a resource consumption and labour-intensive mode to labour and technology-intensive production; therefore, the influence of labour agglomeration on UILUE has significantly decreased.
Traditionally, state-owned enterprises obtain industrial lands through free allocation or agreement-based land grants. Thus, they are not influenced by considerations of economical and intensive land use, resulting in inefficient use of industrial lands. Sun and Wang (2011) also find an obvious negative correlation between industry performance and the proportion of state-owned enterprises among manufacturing industries [
36]. However, with the implementation of land bidding, auctioning, and the listing system, the market mechanism has gradually become an important part in the supply of industrial lands. Consequently, economical and intensive land use has received increasing attention from local governments. In manufacturing industries, therefore, the influence ownership structure on UILUE is gradually diminishing. Foreign-funded enterprises possess relatively advanced production technologies and can help improve enterprise productivity, so they have a positive influence on UILUE [
37]. Liu and Liu (2017) also contend that FDI can promote technical efficiency and raise the technical level in domestic enterprises, thus improving total factor productivity [
38]. However, foreign-funded enterprises accounted for only 0.6% of China’s total social fixed asset investment in 2014. This shows that China has not opened its market adequately and foreign investment agglomeration plays only a limited role in improving UILUE.
Drawing on the above findings, it is found that technology has some fundamental impacts upon UILUE, which then have multiplied effects upon other influential factors, such as capital input, industrial agglomeration, and transportation. It is henceforth suggested for policy makers that government policy interventions should be placed predominantly upon technology regulation, i.e., setting admittance for FDI and industrial investment. For the advanced economic regions such as Yangtze River Delta and Pearl River Delta, industrial restructuring and upgrading is necessary if to enhance UILUE. For relatively underdeveloped regions in middle, north eastern and west China, setting criterion for industries and investment in advance is essential for achieving the goal of UILUE. Lessons from the Yangtze River Delta and Pearl River Delta such as attracting low end industries first and then upgrading the industries overall again should be avoided.
Enhancing industrial land use efficiency is crucial to environmental and economic sustainability and has therefore been keenly advocated by the Chinese government as well as global organizations, such as the UN Commission on Human Settlements. This study on the spatial temporal pattern of urban industrial land use efficiency, based on the experiences of China, could induce further policy measures on spatial differences and changes in influential factors in different areas and periods. Policy intervention will be more effective only if land use efficiency practices are informed by more detailed knowledge of local roots and characteristics.


