The Concept of Sustainable Development in the Functioning of Municipalities Belonging to Special Economic Zones in Poland


1
The Management Faculty, Czestochowa University of Technology, Armii Krajowej 19B, 42-201 Częstochowa, Poland and Faculty of Economic Sciences and IT, North-West University, Vaal Triangle Campus, PO Box 1174, Vanderbijlpark 1900, South Africa
2
The Management Faculty, Czestochowa University of Technology, Armii Krajowej 19B, 42-201 Częstochowa, Poland, [email protected]
*
Author to whom correspondence should be addressed.
Sustainability 2018, 10(7), 2169; https://doi.org/10.3390/su10072169
Submission received: 23 May 2018
/
Revised: 21 June 2018
/
Accepted: 21 June 2018
/
Published: 25 June 2018
Abstract
:Special economic zones (SEZs) differ in terms of the scope and principles of functioning, they have the same objective: to attract investments and create jobs and simultaneously generate benefits for municipalities and their residents. However, in order to make the activity of SEZs and their further development possible and acceptable, activities undertaken in these areas should be consistent with the concept of sustainable development. Therefore, in addition to the leading economic benefits in the development of municipalities social and environmental ones should also be expected. The activity of the entities investing in SEZs certainly arouses some doubts as to their involvement in the search for balance between three pillars of sustainable development. The objective of the research was to assess the concept of special economic zones taking into account measurable economic, social and environmental criteria accompanying the idea of sustainable development. The research included the analysis of selected results of the activity of Polish municipalities. Analysis of variance (ANOVA) applied to independent groups indicated that the municipalities functioning in the area of SEZs differ in a positive way from other municipalities in terms of the analyzed scope.
1. Introduction
The World Bank defines special economic zones (SEZs) as ‘geographically delimited areas administered by a single body, offering certain incentives… to businesses which physically locate within the zone [1]’. Another definition says that ‘an economic zone is the type of community system with a comprehensive development of economy, environment and technology’ [2], which performs its role by affecting the environment interactively. The popularity of economic zones all over the world is such that although they differ in terms of the scope and principles of functioning [3,4], they are assigned the same objective associated with generating economic benefits and accelerating the economic development of regions [5,6].
Enterprises operating in the area of special economic zones benefit from government support in the form of public aid, which is more favorable than what is offered in the open market, is selective, and affects international trade [7]. Therefore, the task of public entities is to provide the best conditions for conducting a business activity and the related acquisition of certain economic benefits that are not available to enterprises located outside the zone [8]. The zones particularly affect an increase in employment and export, inflow of foreign direct investment, development of human capital and knowledge transfer, new technologies and know how, in the long term contributing to a faster growth rate [9].
In Poland, special economic zones (SSE) have been operating since 1994 and they constitute “an administratively isolated part of the territory of Poland where entrepreneurs implementing new investments can benefit from regional aid in the form of exemption of the income coming from the activity specified in the permit from the corporation tax” [10]. Nowadays, in the country there are 14 special economic zones, i.e., Katowicka, Kamiennogórska, Legnicka, Kostrzyńsko-Słubicka, Krakowska, Wałbrzyska, Łódzka, Warmińsko-Mazurska, Mielecka, Pomorska, Słupska, Starachowicka, Tarnobrzeska and Suwalska. In total, SEZs cover areas located in 189 cities and 287 municipalities.
In the process of development of SEZs, a very important role is also played by European Union (EU) cohesion policy, the task of which is to reduce disparities and differences between the level of development of individual EU regions [11,12]. Regional policy in Poland must be therefore consistent with the guidelines of the policy of the EU. As a result, the SEZ development process takes into account [13]:
- “Boosting the competitiveness of the regions;
- building territorial cohesion and preventing marginalization processes in problem areas;
- creating conditions for the effective, efficient and partner implementation of development activities directed territorially”.
An important aspect of the support for investments in SEZ is regional state aid. The Polish legislation, amended in 2015, adjusts the principles for granting regional investment aid in SEZs in years 2014–2020 to the EU regulations included in the Commission Regulation (EU) No. 651/2014 of 17 June 2014. (‘Regulation No. 651/2014) and the Guidelines of the European Commission on regional State aid for 2014–2020 [14].
In accordance with the latest Regulation of the Council of Ministers of 10 December 2008 on state aid granted to entrepreneurs operating on the basis of a permit for conducting business activity in special economic zones [15], the maximum intensity of regional investment aid for entrepreneurs operating in zones in the area of four least developed voivodeships (the unit of administrative division) in Poland amounts to 50%. The intensity of aid for the other regions ranges from 10% to 35%.
In its current form, Polish special economic zones are included in the aid program by the end of 2010. After that time, some changes in their functioning are planned. The whole of Poland will be covered by zones and thus the principles of public aid, depending on the conditions of the activity of entities, will change. In addition to many formal principles, an important part will also be activities for the benefit of sustainable development of municipalities, which will include [16]:
- tax exemption dependent on the size of the company and the unemployment rate in the region;
- investments tailored to the financial capacities of companies;
- the analysis of the socio-economic situation in the specific area.
Among numerous grants of financial aid within the framework of the implementation of activities in SEZs, in the context of the conducted research, there is financial aid offered to entrepreneurs who implement projects positively affecting the environment, i.e., [17]:
- protection of water resources and their sustainable management;
- rational waste management and protection of the Earth’s surface;
- protection of the atmosphere;
- conservation of biodiversity and ecosystem services.
According to the research by Ernst & Young [18], the benefits from the functioning of SEZs affect growth in employment and exports, an increase in foreign direct investment, and transfer of knowledge and new technologies, resulting in the acceleration of economic growth of the region.
In the ranking, “Destination countries by FDI (Foreign Direct Investment) projects” [19], in 2016 Poland occupied the 5th position with a 21% increase in the level of foreign investment. In terms of the ability to create new jobs, Poland took the 2nd position in Europe. According to the report by United Nations Conference on Trade and Development (UNCTAD)—“World Investment Prospect Survey (2013–2015)” [20], for international companies, Poland is the third country in the EU and the first in Central and Eastern Europe selected as a place of implementation of future investment. Moreover, Poland is the only EU member that, during the last international economic crisis, registered economic growth [21]. Its advantage is also the location in the center of Europe, at the intersection of transcontinental transport corridors. At the same time, Poland is a profitable location for foreign investments against the background of the other European countries and this justifies the reasonableness of the functioning of economic zones. SEZs are also treated as a tool of the economic policy of the country stimulating the activity, modernization and economic development of the regions of the country [22,23,24].
The implementation of the principles of sustainable development in municipalities is aimed at positive qualitative and quantitative changes in the area while respecting environmental values and the principles of social equality [25,26,27]. Sustainable development is, therefore, a category of socio-economic development that forms part of ideas concerning the development of the region. At the same time, balancing economic development and environmental protection is a serious problem on a global scale, which requires the involvement of many entities [28,29].
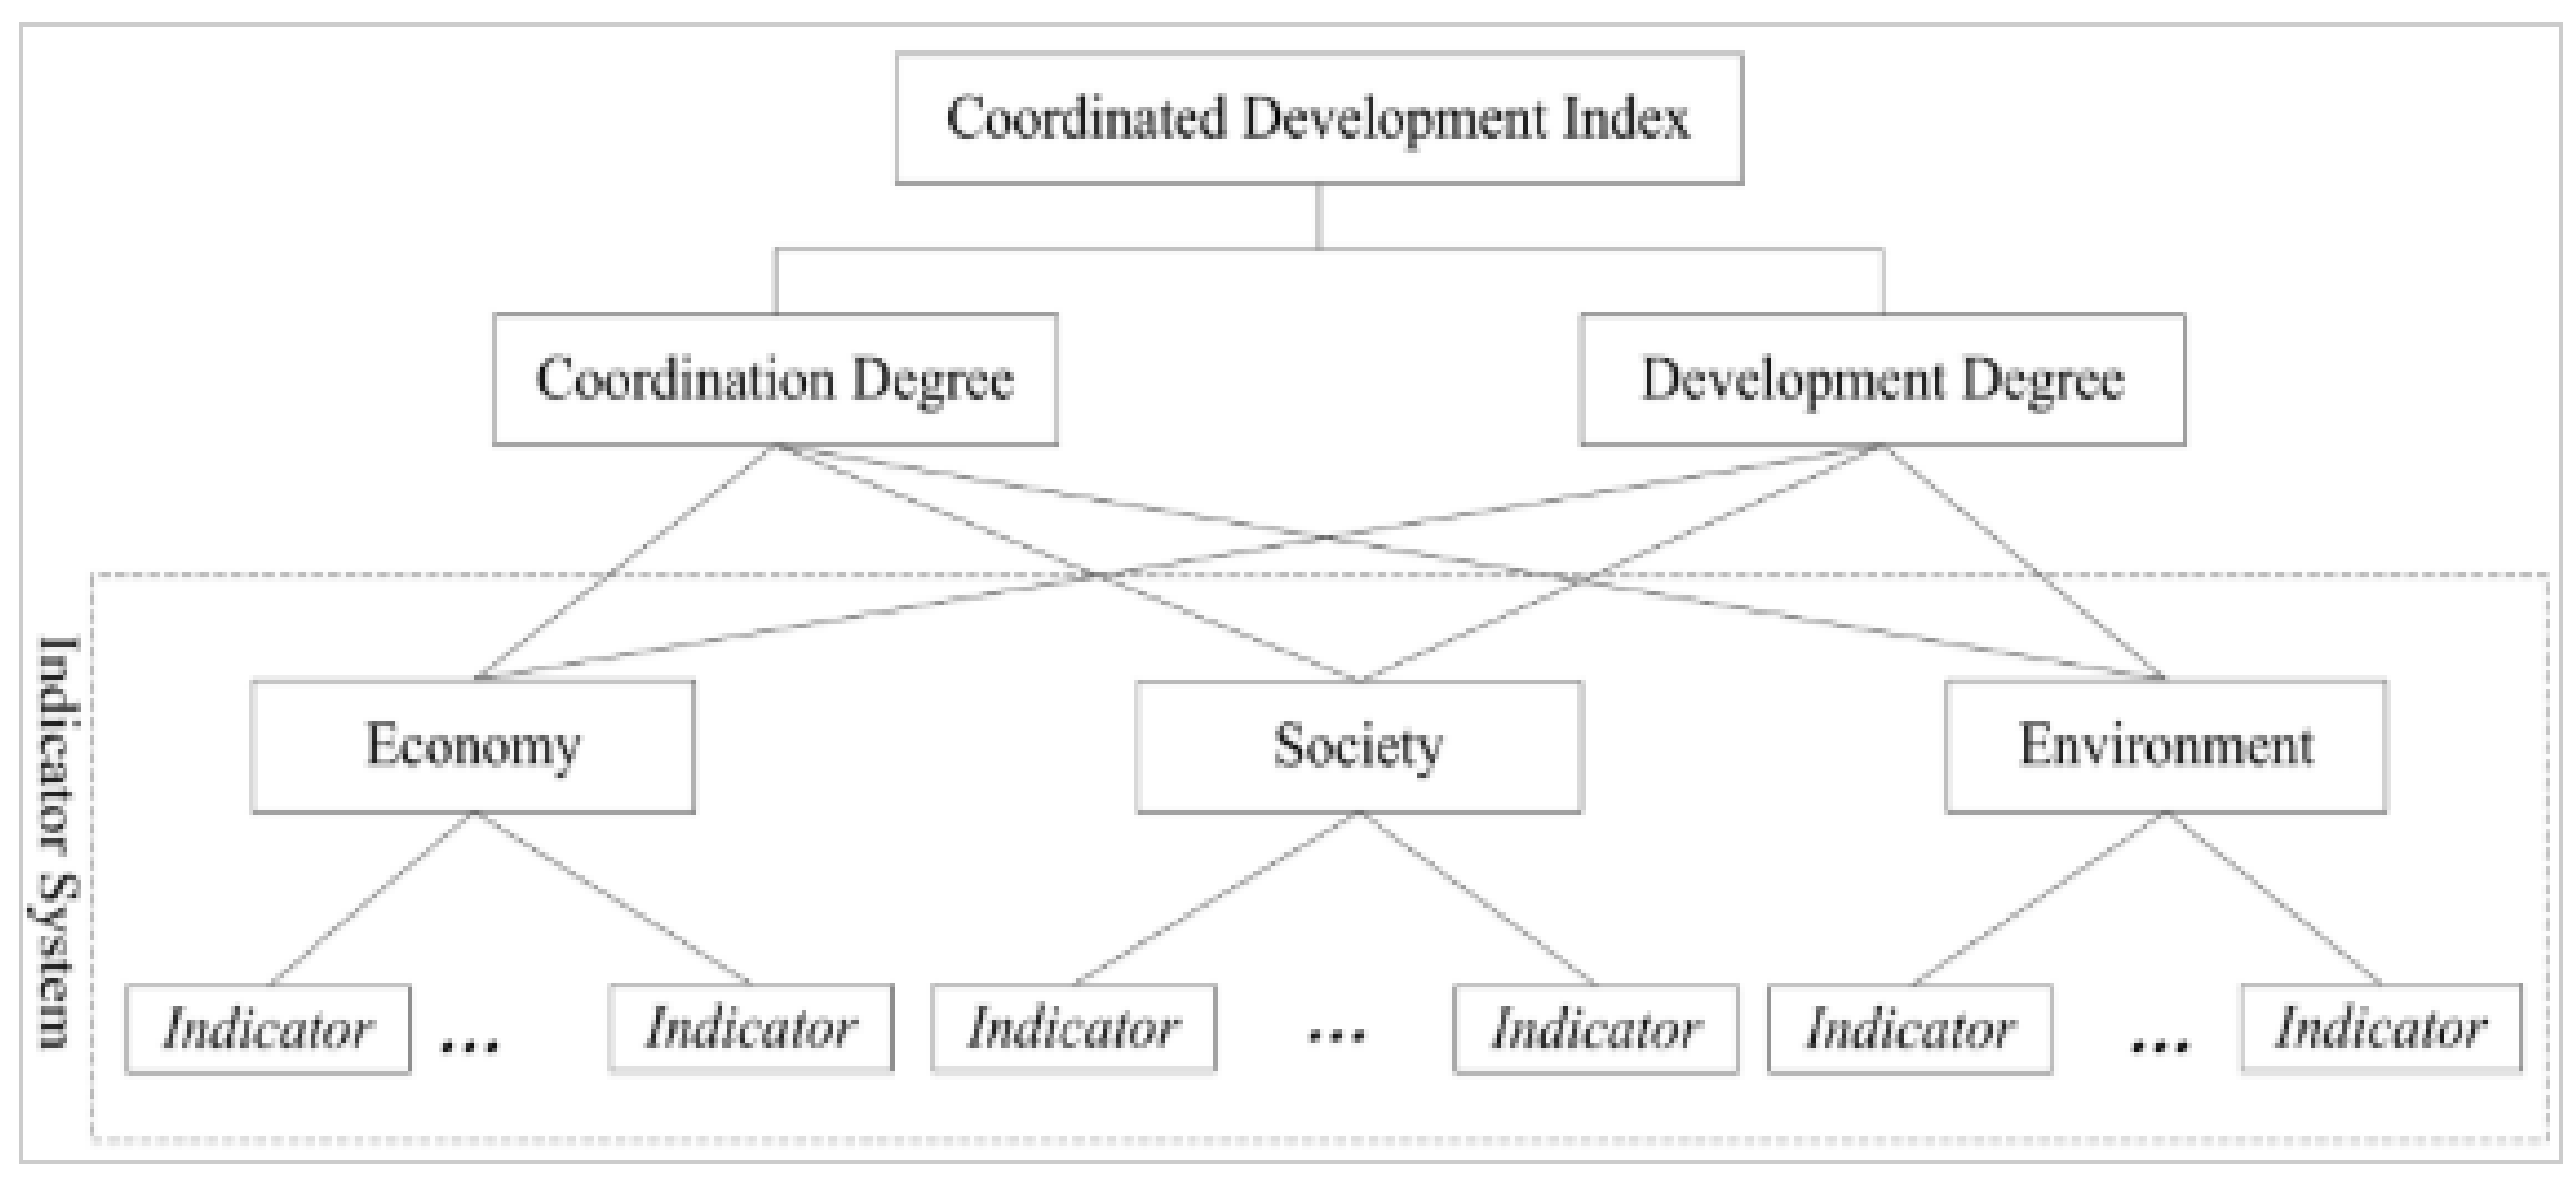
According to Sekuła [30], the key issue of the concept of sustainability of development is a continuous improvement in the quality of life of local communities in terms of social, economic and environmental indicators [31]. In the assessment of sustainable development, these indicators create a coordinated model (Figure 1), which should focus not only on changes in each element separately but also on intensive interactions and correlations between them.
The estimation of sustainable development of a region consists of two levels: coordination and development, which are determined by the indicators of the economic, social and environmental sub-system. All decisions concerning the development of the region should, therefore, be economically efficient, socially accepted and environmentally friendly.
In this context, particular attention should be drawn to the economic growth of regions, stimulated by support in the form of public aid within the framework of the functioning of SEZs, which plays an important role already at the level of local communities living in municipalities. It is municipalities that should begin the implementation of the principles of sustainable development due to direct contact with local community, knowledge of their needs, and of the natural environment. In turn, the eco-friendly development of municipalities requires companies to operate simultaneously taking into account economic and environmental aspects [33].
2. Literature Review
The existing studies concerning the assessment of the functioning of special economic zones to a rather large extent refer to the assessment of their efficiency and are based on different criteria, mainly economic ones. Taking into account the range of the research, which includes the consideration of economic, social and environmental dimensions of the functioning of SEZs, a literature review in this area was conducted.
Błachut, on the example of urban municipalities [34], Wałbrzych and Mielec, analyzes the economic benefits occurring due to the impact of special economic zones on the development of these municipalities. The assessment of the zones through the lens of financial performance is also considered by Lichota [35] whose research based on financial data gave rise to the statement that the benefits coming from the functioning of the zones considerably outweigh the costs of their operation. Also Ślusarczyk [36], in her studies, refers to the issue of the public aid used to attract foreign direct investment to SEZs. Jasiniak and Keller indicated the beneficial impact of the zones on the development of entrepreneurship broken by poviats (counties) [37]. Szymańska and Wajer pay attention to an increase in competitiveness of the regions and an improvement in the effectiveness of resource management in the area of the zones [38,39,40]. Guagliano and Riela [41], on the example of selected countries of Central and Eastern Europe, emphasize a positive relationship between the functioning of SEZs and the inflow of foreign capital, level of GDP and level of remuneration.
Lizińska and Marks-Bielska observed that SEZs fulfilled their tasks best in the area of stimulating an increase in jobs created in problem areas, and perceive the subject matter similarly [42]. Golik and Kątnik-Prokop [43] conduct the analysis of the functioning of special economic zones in terms of the capital invested in the zones and the potential for creating new jobs. On the other hand, Herlevi [44], on the example of Chinese SEZs, considers the economic development of the country based on urbanization whose element is the physical expansion of the zones.
A lot of studies also take into account the legal basis and regulations conditioning the success of the zones among entrepreneurs [45,46]. Numerous analyses concerning the principles and conditions for investment in the area of SEZs were characterized in terms of legal regulations [47,48,49]. It was observed that the regional aid of the state in the form of tax exemption was more important for the poorest regions; moreover, the intensity of the public aid granted to entrepreneurs had a positive impact on social and economic development [50,51,52].
Some authors [53,54], discuss environmental problems related to urbanization and industrialization as a result of the activity of industrial zones that violate the principles of sustainable development. Farole and Akinci [55] pay attention to the fact that, in spite of many critical opinions on the impact of the zones on the social and environmental dimension, it is important to treat them along with the economic dimension since these results are interdependent.
Many studies include negative assessment of the functioning of the zones. An interesting look at SEZs is presented by Augustyński [56], according to whom the view that without the zones investment in the specific area would not be implemented should be rejected. The authors even emphasize the phenomenon of illusion associated with excessive expectations in relation to the benefits from the functioning of SEZs. In turn, according to Trzciński et al. [57], the zones, treated as tools stimulating job growth and reducing the level of unemployment in municipalities, do not fulfill their function properly. On the other hand, Jauch [58], in his analyses referring to the impact of the zones on the economy of South Africa, notices that, due to the benefits achieved by investors in the zones, new investment in the region is significantly restricted, causing marginalization of socio-economic problems of the specific region. The existing research and the related dilemmas give grounds for further research in the field of the impact of SEZs on the economic, social and environmental level of Polish municipalities.
3. Research Methodology
The research conducted so far indicates the positive impact of the functioning of the zones on selected areas of the activity of municipalities, primarily in economic terms. At the same time, SEZs, as investment areas and industrially active, arouse negative connotations associated with changes in the natural environment and the existence of the local community. Therefore, it can be assumed that the recognized economic benefits do not balance the anticipated social and environmental losses. Therefore, the concept of sustainable development in the area of municipalities occupied by SEZs may not ultimately fulfill its role. On the other hand, the assumption of the functioning of SEZs takes into account equaling opportunities between the regions of a different level of economic development, which is consistent with the idea of sustainable development in economic terms [59]. Although the objectives and principles of sustainable development are relatively well defined at the level of different research areas, its analysis in terms of the development of municipalities and the related functioning of SEZs requires further analysis. On the basis of the above, the research proposed in the paper consisted in the assessment to what extent the functioning of municipalities in SEZs differs from those outside the zones in relation to the implementation of the concept of sustainable development.
The structure of the empirical research consists of a few parts. The first one was to define the objective and scope of the research. At that level, there was also generally characterized the research sample, which was divided into two groups: the municipalities belonging to SEZs and the others. The division is applicable until the end of the conducted research in order to compare selected aspects of sustainable development of the functioning of municipalities. The second part of the research was developed on the basis of statistical data by Central Statistical Office (GUS), which served to identify factors determining the results of the activity of Polish municipalities in the economic, social and environmental dimensions. Some trends in changes in these factors were also indicated according to the analyzed groups, which were subsequently used to formulate research hypotheses, whose main assumption was based on the identification of differences in the results between the groups. In order to verify the assumed hypotheses, in the last, key part of the research, the univariate analysis of variance (ANOVA) method is used for independent groups and the research results presented.
4. The Empirical Research
4.1. The Objective and Scope of the Research
The research objective was the assessment of social, environmental and economic effects of the activity of municipalities and cities in Poland covered by the functioning of SEZs. For this purpose, Polish municipalities and cities were divided into two groups where the grouping factor was belonging to the SEZ or lack of it. The quantitative structure of municipalities by grouping factor is presented in Table 1.
In Poland, there are 14 SEZs at present, which include a total of 397 municipalities, which amounts to 16% of all the municipalities in Poland. Among them, the majority of municipalities belongs to Wałbrzyska Specjalna Strefa Ekonomiczna “INVEST-PARK” (2.1% of all the municipalities in Poland and simultaneously 13% among the municipalities belonging to the zones). It is followed by Kostrzyńsko-Słubicka Specjalna Strefa Ekonomiczna (46 municipalities, i.e., 1.9% of all the municipalities in Poland and 12% of a total number of municipalities in the zone). Three zones, i.e., Kamiennogórska Specjalna Strefa Ekonomiczna Małej Przedsiębiorczości S.A., Słupska Specjalna Strefa Ekonomiczna and Specjalna Strefa Ekonomiczna “Starachowice” S.A. include 14 municipalities each (0.6% of a total number of municipalities in Poland and 4% of a total number of municipalities in the zones).
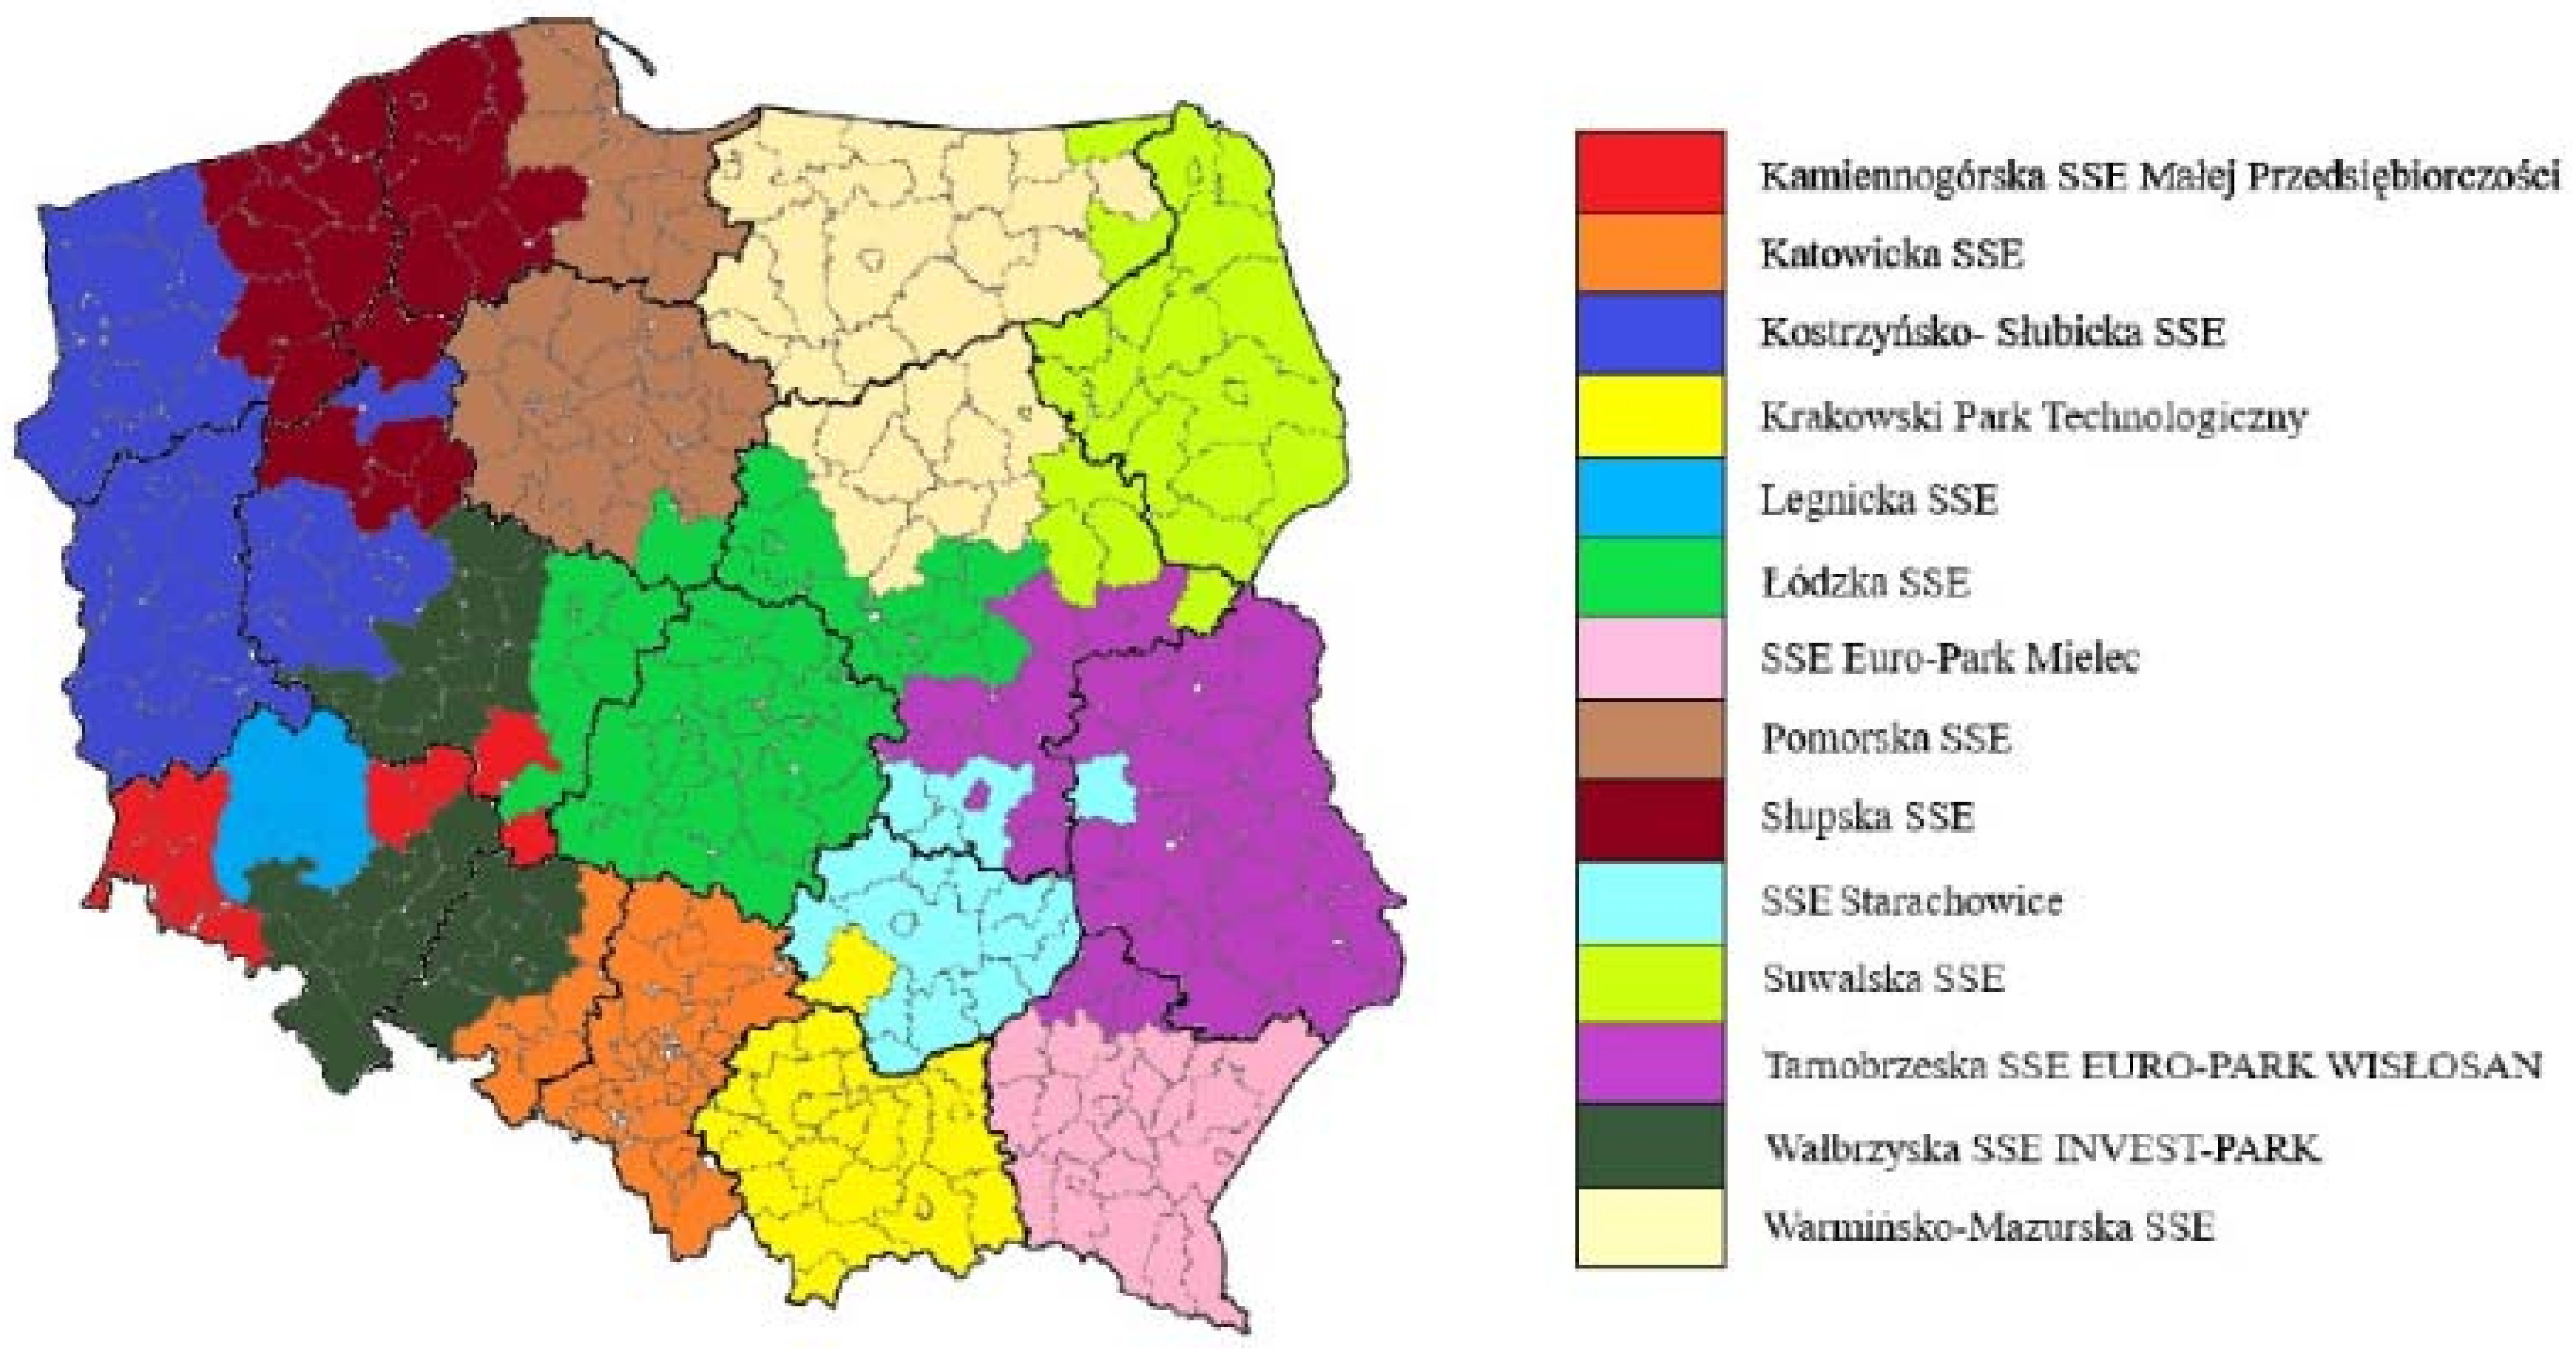
Figure 2 presents the location of Polish SEZs, the areas of which are different from the areas of voivodeships demarcated in the course of the administrative division. The selected, more detailed information concerning the functioning of the zones is listed in Table 2.
According the data for 2016, the largest area is occupied by Wałbrzyska SEZ “INVEST-PARK”, which consists of the largest number of municipalities and takes a high position in creating new jobs. The second most significant zone in this regard is Katowicka SEZ (over 45 thousand jobs) which, at the same time, generates the largest investments.
4.2. Factors Determining the Results of the Activity of Polish Municipalities
Analysis of the results of the activity of municipalities and cities was possible due to the analysis of economic indicators at the microeconomic level as the factors characterizing the results of the activity of municipalities in the period 2012–2016.
In order to identify and select the social, economic and environmental factors, the available statistical GUS (Central Statistical Office) database on the performance of municipalities was used. From among 21 areas characterizing the functioning of municipalities (among others, construction, power industry, population, labor market), distinguished and selected for further research were those that refer to the concept of sustainable development [32]. As a result, 11 different economic indicators (Table 3) were identified which quantitatively characterized all the surveyed municipalities in the period 2012–2016.
Budget expenditure of municipalities and cities depends on revenues, among others, coming from the activity of economic entities paying taxes. In this context, expenditure can be understood in two ways. On the one hand, its increase may indicate an increase in revenues and is associated with the development of the municipality. On the other hand, its significant growth, in accordance with the principles of economy, must be reasonable and cost-effective.
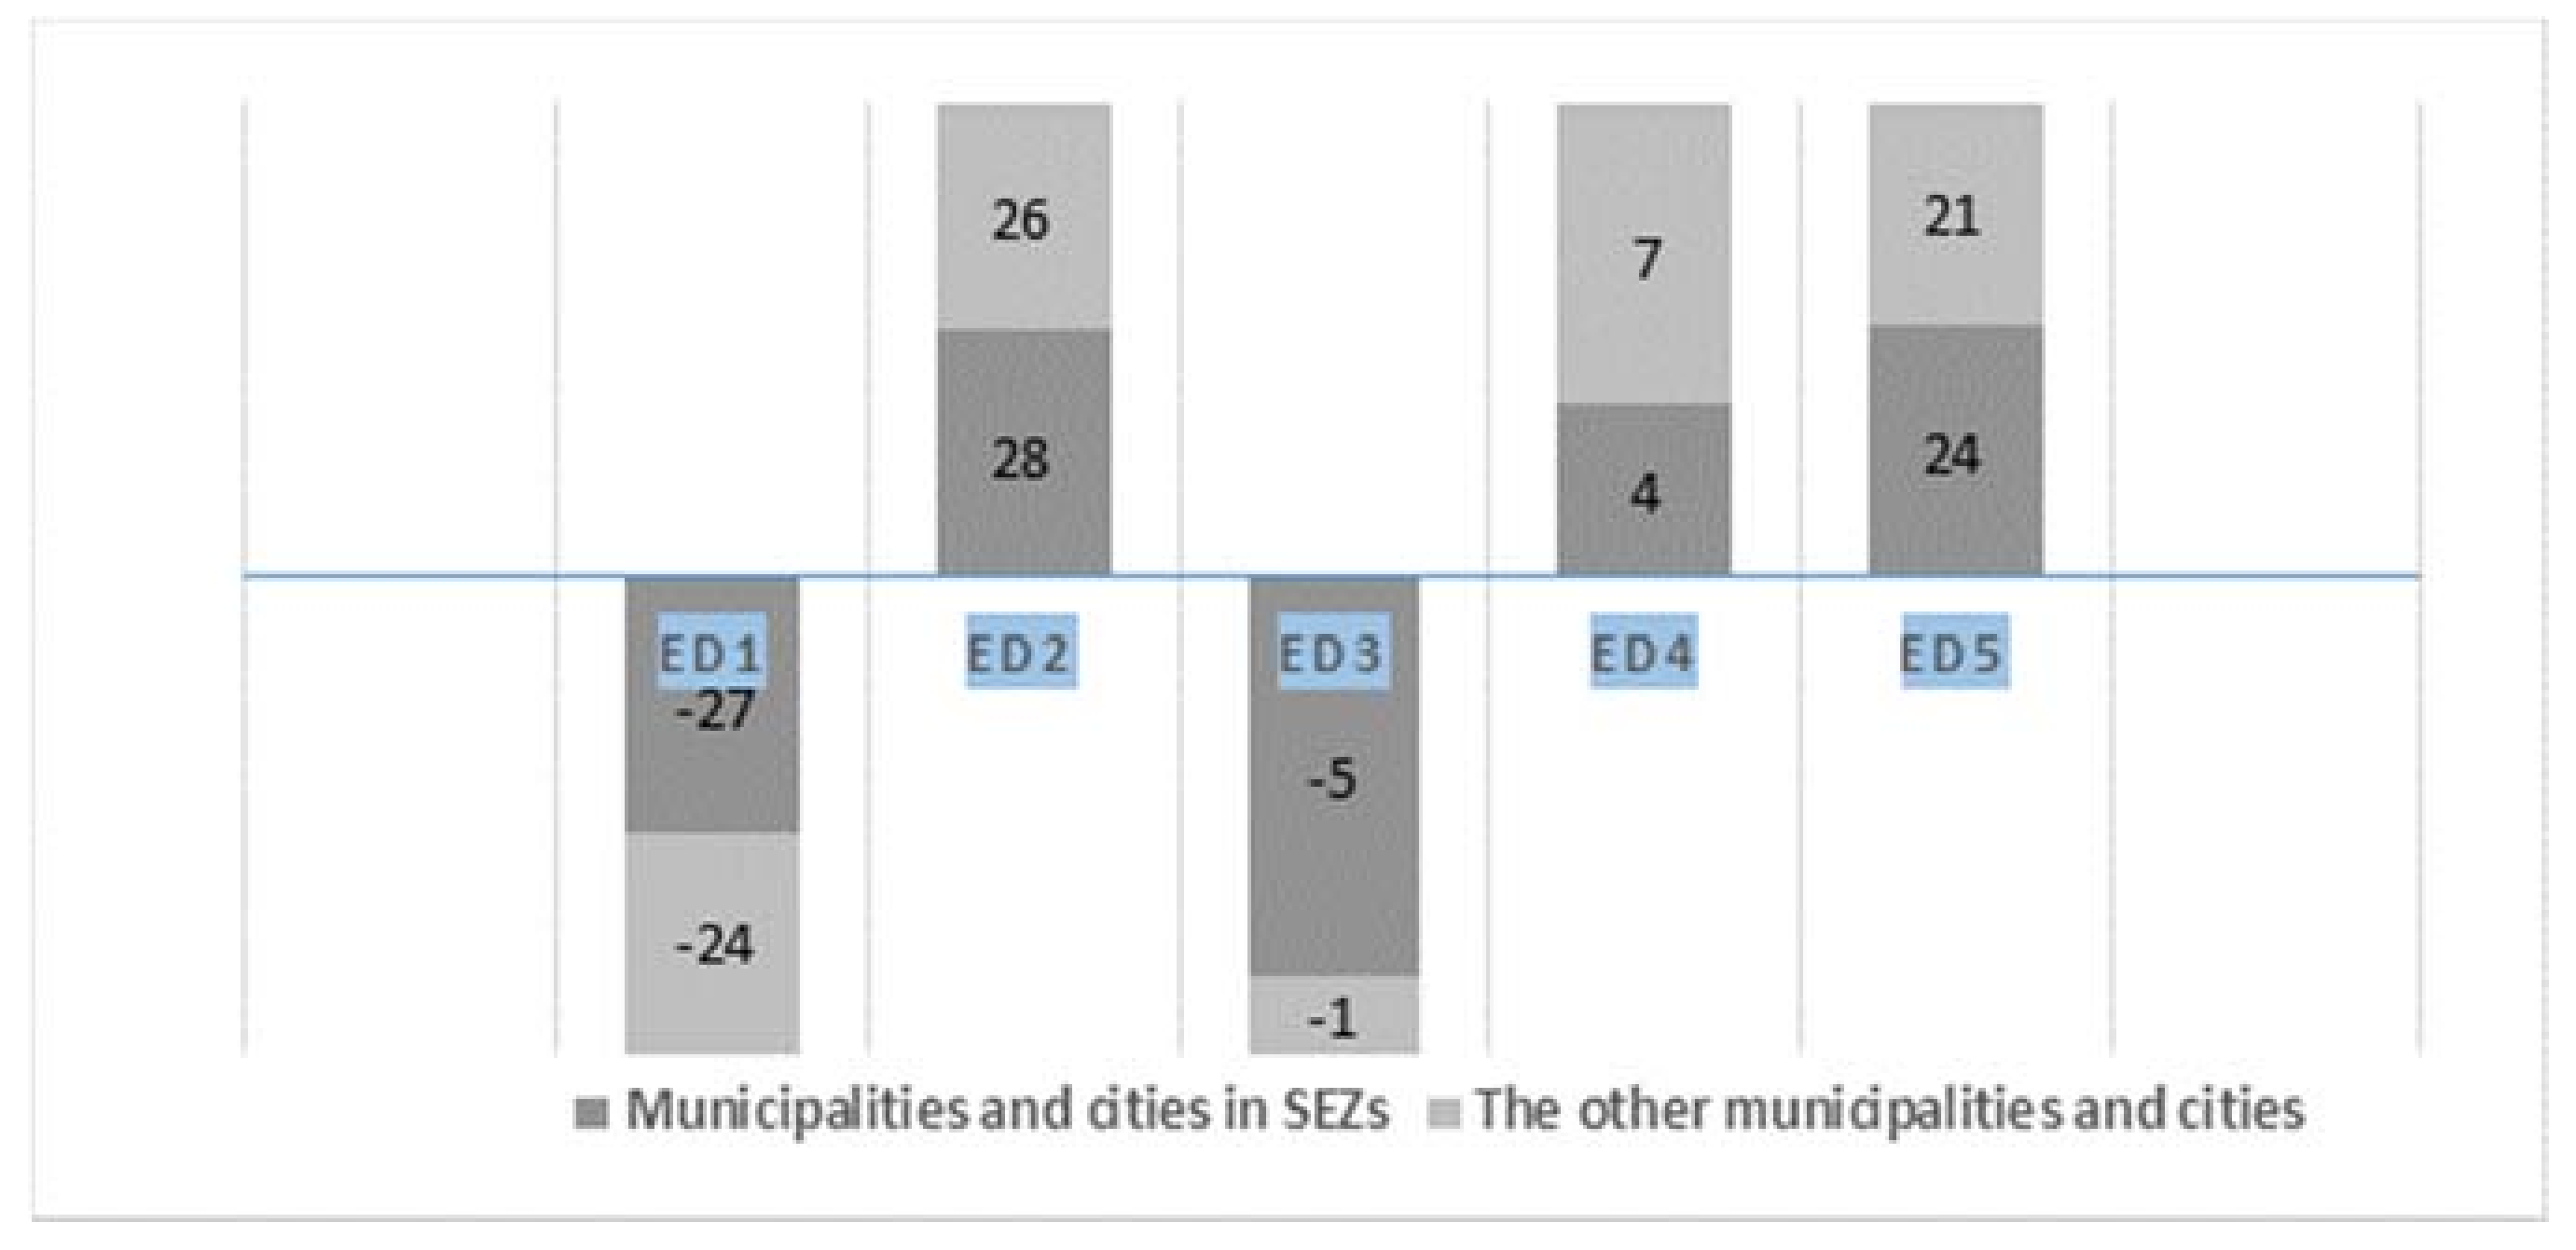
At first, the changes in the individual indicators taking place in each of the analyzed groups were analyzed. Due to a large quantitative disproportion of the groups, the values of the indicators were averaged for each year (Figure 3).
The values in Figure 3 show the level of changes in the individual indicators broken down by the analyzed groups. Therefore, in the economic dimension, there can be observed larger deviations in the case of as many as four indicators (ED1, ED2, ED3, ED5). This means that the municipalities covered by SEZs, in relation to the base year, recorded a greater decline in unemployment that the other Polish municipalities. At the same time, they recorded a larger increase in revenues. On the other hand, the municipalities outside SEZs do better in terms of development of entrepreneurship. They recorded a larger increase in the number of entities registered in REGON (7-percentage-point increase compared to 2012) and also almost the same level of the number of newly registered entities as five years before (1-percentage-point decline compared to 2012). Moreover, budget expenditure is higher than in the case of the municipalities in SEZs (24-percentage-point increase compared to 21-percentage-point-increase in the other municipalities).
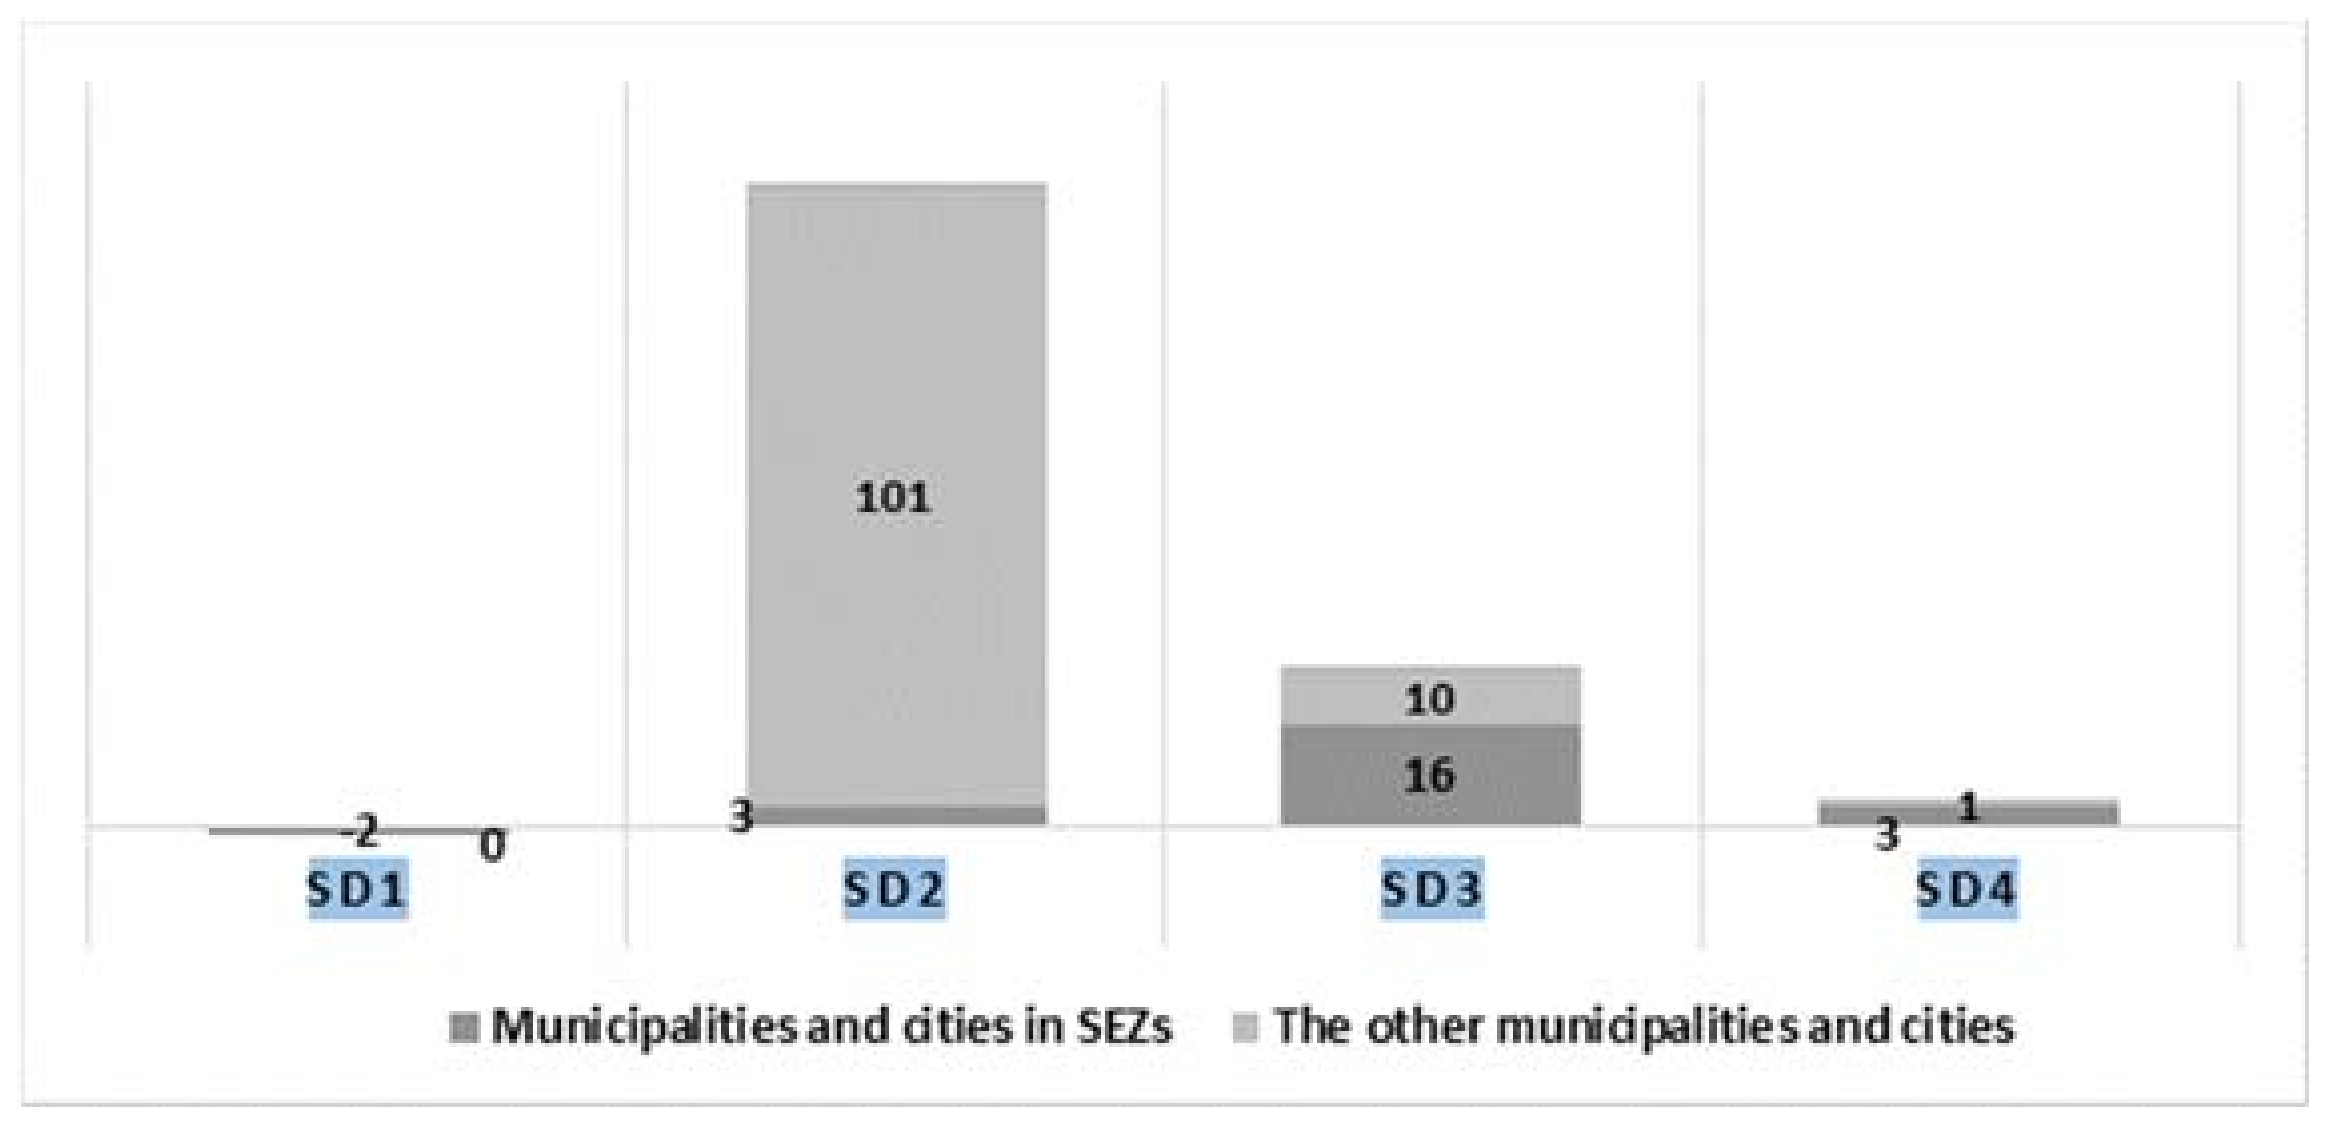
In the social dimension (Figure 4), in both groups, there can be observed completely different values of the indicators than those expected (see Table 3). In the group of the other municipalities, results that are not much better in relation to population density can be observed. At the same time, the same municipalities record three times greater migration of the population than the municipalities in the zones, which may be labor migration. This means that the population of the municipalities not belonging to economic zones more often move in search of work. The share of the post-working age population is increasing faster in the municipalities belonging to economic zones (16-percentage-point increase compared to 10-percentage-point increase in the other municipalities), which means that there is a larger share of aging population in these municipalities. Moreover, in the other municipalities, the level of the working-age population actually did not change (1-percentage-point decline) whereas, in the municipalities belonging to the zones, it slightly decreased (3-percentage-point decline). The municipalities in the zones perform worse against the other units in terms of a more rapid growth in the number of the post-working age population and simultaneously a greater decline in the working-age population. There is almost no difference for population density. The largest difference between the analyzed groups is human migration.
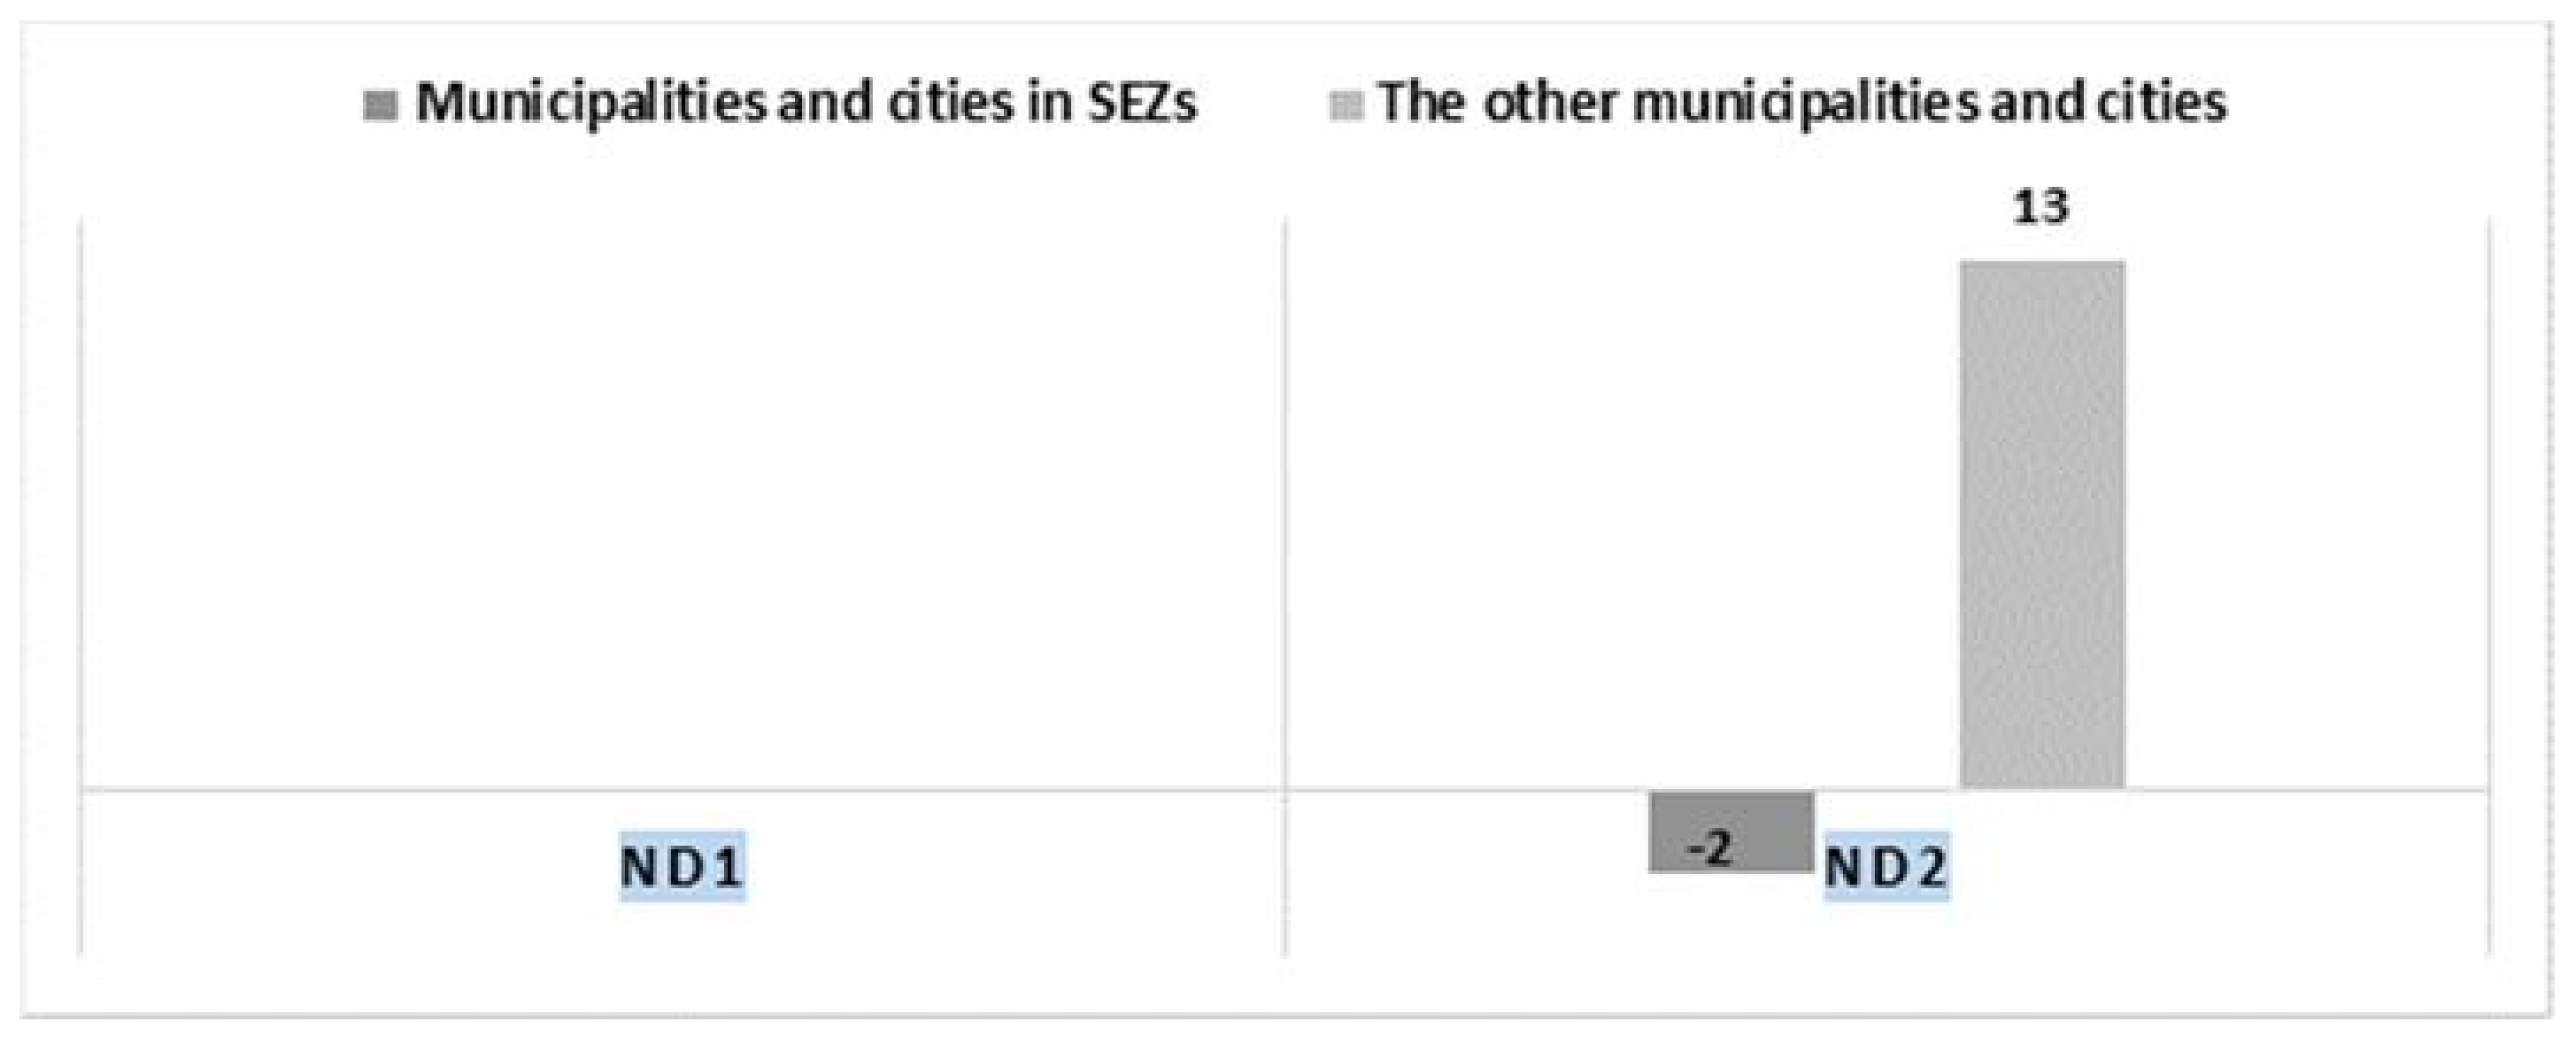
In the environmental dimension, small changes in the analyzed indicators (Figure 5) can be observed. In both cases, the municipalities outside the zones, which record a small 1-percentage-point increase in forestation of the areas and a 13-percentage-point increase in green areas, perform better. In the case of the municipalities in the zones, the trends are, rather, the opposite.
It should be noted that the direction of changes in the individual indicators is the same regardless of whether the municipalities belong to special economic zones or not. Therefore, the trends of both groups are almost the same and often different from the desired values, whereas they differ in the pace of changes in the individual phenomena.
4.3. Formulating the Research Hypotheses
The analysis of the pace of changes allows for the assumption that the economic, social and environmental results for the individual groups differ from each other. To supplement the assumptions, the average values of the indicators for the economic, social and environmental dimensions (Table 4) were also calculated.
On the basis of the table, it can be observed that the average indicators differ from each other. Therefore, the following research alternative hypotheses, concerning the differences in the average values between the analyzed groups, can be formulated:
Hypothesis 1.
Municipalities, due to belonging to the zone, differ from each other in the economic dimension, for which the record of the hypothesis will be the following:
M1 ≠ M2 → {M1(ED1), M1(ED2), M1(ED3), M1(ED4), M1(ED5)} ≠ {M2(ED1), M2(ED2), M2(ED3), M2(ED4), M2(ED5)}.
Hypothesis 2.
Municipalities, due to belonging to the zone, differ from each other in the social dimension, for which the record of the hypothesis will be the following:
M1 ≠ M2 → {M1(SD1), M1(SD2),M1(SD3), M1(SD4)} ≠{M2(SD1), M2(SD2), M2(SD3), M2(SD4)}.
Hypothesis 3.
Municipalities, due to belonging to the zone, differ from each other in the environmental dimension, for which the record of the hypothesis will be the following:
where: M1 is the average in the group of the municipalities functioning in the zones; M2 is the average in the group of the other municipalities.
M1 ≠ M2 → {M1(ND1), M1(ND2)} ≠ {M2(ND1), M2(ND2)}.
4.4. Examining the Assumptions for the Univariate Analysis of Variance (ANOVA)
In order to verify the assumed hypotheses the univariate analysis of variance (ANOVA) for independent groups was used. A municipality belonging to the zone is the independent variable whereas the individual indicators are the dependent variables. The ANOVA test refers to the research into the relationship between the variables in order to compare the averages from two groups of dependent variables [64]. The use of ANOVA required the division of the surveyed municipalities in accordance with the criterion of belonging to SEZ, i.e.: the municipalities belonging to the zones and those outside the zones. After dividing the surveyed population one-way ANOVA was conducted in order to examine the difference between the average performance of the municipalities belonging to the zones and those outside the zones.
All the municipalities belonging to the economic zones (a total of 397 units) were subjected to the research. At the same time, there are still 2083 municipalities outside SEZs. Due to the fact that ANOVA works for equipotent groups, for the further stage of the research 397 of the remaining municipalities in Poland were accepted, which amounts to 19% of their whole population with the level of distrust of 97% and the maximum error of 5%. Due to numerous parameters characterizing individual municipalities, the selection of municipalities outside the zones was random.
First, the conformity of the assumptions of the method for the analyzed sample was examined:
- 1.
- The assumptions concerning the dependent variables:
- a.
- measured on a quantitative scale—fulfilled;
- b.
- distribution of results is close to normal distribution—testing required.
- 2.
- The assumptions concerning the independent variables:
- a.
- at least two levels are assumed—fulfilled: municipalities were divided into two groups according to the criterion of the belonging to the special economic zone.
- 3.
- The collected measurements are independent of each other—fulfilled.
- 4.
- Homogeneity of variance of the results for the groups: testing required.
At the same time, the condition of equipotence of both groups was also taken into account. For this purpose, a group of municipalities was selected corresponding to the number of municipalities functioning in the zones.
First, the assumption on normality of distribution of the results in the groups (point 1b) was verified using the Kolmogorov–Smirnov normality test with the Lilliefors modification [65], a non-parametric test which, for the given sample size, allows the assessment whether the distribution of results in subgroups significantly differs from normal distribution.
The Kolmogorov–Smirnov test (Table 5, Table 6 and Table 7) for the indicators of the economic, social and environmental dimensions indicated that all the dependent variables are characterized by distribution close to normal distribution for p > 0.05. At the same time, homogeneity of variance verified with the Levene test was statistically insignificant in all the cases; therefore, it can be assumed that variances in the groups are equal. This means that the other assumptions necessary to conduct ANOVA analyses were fulfilled [66].
4.5. The Conduct of the ANOVA
Another stage was to examine the data set in terms of the identification of differences between the average values of the individual indicators for two analyzed groups, i.e., the municipalities and cities in SEZs and the others. The results of the final analyses are presented in Table 8, Table 9 and Table 10.
The values of the F test are statistically significant in the case of most of the indicators in the economic dimension. Therefore, it can be recorded that:
- 1.
- For F(1.792) = 5.228; p < 0.05 the ED1 indicator, i.e., the average level of unemployment differs significantly between the analyzed groups;
- 2.
- For F(1.792) = 3.077; p > 0.05 the ED2 indicator, i.e., the average level of budget revenues of municipalities and cities does not differ significantly between the analyzed groups;
- 3.
- For F(1.792) = 61.770; p < 0.001 the ED3 indicator, i.e., the average number of entities newly registered in REGON differs significantly between the analyzed groups;
- 4.
- For F(1.792) = 120.049; p < 0.001 the ED4 indicator, i.e., the average number of entities entered into the REGON register differs significantly between the analyzed groups;
- 5.
- For F(1.792) = 4.084; p < 0.05 the ED5 indicator, i.e., the average level of expenditure of municipalities and cities differs significantly between the analyzed groups.
The conducted univariate intergroup analysis allowed for rejecting the first null hypothesis and accepting the alternative hypothesis. Municipalities, due to their belonging to the zones, differ from each other in terms of the economic dimension in relation to the level of unemployment, number of entities in the REGON register and budget expenditure of municipalities and cities. In the municipalities belonging to special economic zones, there can be observed a higher average level of economic entities and a higher average level of budget expenditure and also a lower average level of unemployment in the research years (in relation to Table 4).
The values of the F test are statistically significant in the case of most of the indicators in the social dimension. Therefore, it can be recorded that:
- 1.
- For F(1.792) = 145.08; p < 0.001 the SD1 indicator, i.e., the average level of population density differs significantly between the analyzed groups;
- 2.
- For F(1.792) = 30.21; p < 0.001 the SD2 indicator, i.e., the average balance of internal migrations differs significantly between the analyzed groups
- 3.
- For F(1.792) = 0.80; p > 0.05 the SD3 indicator, i.e., the average share of the post-working age population does not differ significantly between the analyzed groups;
- 4.
- For F(1.792) = 333.33; p < 0.001 the SD4 indicator, i.e., the share of the working-age population differs significantly between the analyzed groups.
The conducted univariate intergroup analysis allowed for rejecting the second null hypothesis and accepting the alternative hypothesis. Municipalities, due to their belonging to the zones, differ from each other in terms of the social dimension in relation to population density, internal migration balance and the share of the working-age population. In the municipalities belonging to special economic zones, there can be observed a higher average level of population density and working age population and a lower level of internal migration in the research years (in relation to Table 4).
The values of the F test are statistically significant in the case of most of the indicators in the environmental dimension. Therefore, it can be recorded that:
- 1.
- For F(1.792) = 0.06; p > 0.05, the ND1 indicator, i.e., the average level of forestation does not differ significantly between the analyzed groups;
- 2.
- For F(1,792) = 128.86; p < 0.001, the ND2 indicator, i.e., the average share of green areas differs significantly between the analyzed groups.
The conducted univariate intergroup analysis did not allow ultimately for rejecting the third null hypothesis. At the same time, the results allow for the observation that municipalities, due to their belonging to the zone, differ from each other in the environmental dimension in relation to the share of green areas. In the municipalities belonging to special economic zones, there can be observed a higher average share of green areas than in the other municipalities in the research years (in relation to Table 4).
5. The Assessment of the Impact of Special Economic Zones (SEZs) on the Environment Broken Down by the Most Polluted Cities
Due to the quantitatively limited factors of the assessment of the environmental dimension, an additional univariate analysis was conducted. This allowed for verifying the third null hypothesis concerning the assessment of the impact of SEZs on the environment more accurately. For this purpose, the list of the most polluted cities in Poland was used.
According to the World health Organization (WHO), 113 Polish cities are in the list of the most polluted places in which the recommendations for PM2.5 emission standards were exceeded at least twice (at least 20 μg/m3 PM2.5). From the point of view of the present paper, an essential fact is that 82 cities from this list are in special economic zones (73%), which amounts to more than half of all the most polluted cities in Poland. The source of such a level of pollution can be the industrial activity in these cities. This allows for accepting the assumption that economic zones negatively affect the natural environment in Polish cities and their neighborhood.
In order to check the difference between the average of pollution for the group of cities in the zones and outside the zones, ANOVA analysis (Table 11) was conducted, for which the assumptions were fulfilled, including normality of distribution of the level of contamination with solid particles—PM2.5 and PM10.
The values of the F test are statistically significant in the case of both variables. Therefore, it can be recorded that:
- 1.
- For F(1.111) = 4.70; p < 0.05: the average level of contamination with solid particles—PM2.5 differs significantly between the analyzed groups;
- 2.
- For F(1.111) = 4.38; p < 0.05: the average level of contamination with solid particles—PM10 differs significantly between the analyzed groups.
The univariate intergroup analysis conducted allowed for rejecting the third null hypothesis and accepting the alternative hypothesis. Cities, due to belonging to the zone, differ from each other in the environmental dimension in relation to the level of solid particle emissions. At the same time, on the basis of Figure 6, it can be seen that, in the cities belonging to special economic zones, the average level of emissions of PM2.5 and PM10 is lower than in the other most polluted cities in Poland.
The results presented allowed the assessment of the activity of the municipalities in SEZs in three dimensions of sustainable development: economic, social and environmental. There is a lack of this type of analyses in literature, and therefore the unique nature of this research ought to be emphasized. At the same time, this constitutes the constraint on comparing the obtained results with the results of the research by other authors. It can be only pinpointed that the positive impact of SEZs on municipalities in the economic dimension was confirmed, which was also indicated in other numerous studies referred to in the literature review.
6. Results and Discussions
The results presented allowed the assessment of the activity of the municipalities belonging to SEZs in three dimensions of sustainable development: economic, social and environmental. At the same time, it is difficult to identify other studies which comprehensively examine the problem of sustainable development in SEZs. Moreover, although it is not difficult to refer to similar studies in terms of the economic and social impact of SEZs on the development of the regions, but in the case of the environmental dimension these studies are severely limited.
The data obtained concerning the beneficial impact of the zones on the economy are confirmed by the research results of Sinenko and I. Mayburov [67], who analyzed the impact of tax incentives in SEZs in relation to the incurred operating costs in their area. The results obtained by them indicated that the creation of economic zones has brought about positive effects for the development of the surveyed regions. In turn, Jarosiński and Maśloch [68] pointed out a significant impact of capital expenditures on the level of employment in the zones. According to the authors, increasing employment resulting from increasing capital expenditures in the zones efficiently contributes to the socio-economic development of the Polish regions.
In turn, the studies by Pastusiak, Jasiniak and Kaźmierska [69] relate to the assessment of the impact of SEZs on the level of revenues of municipalities. The authors indicated that the available tax incentives for entrepreneurs simultaneously contribute to an increase in revenues of municipalities and, therefore, economic zones have a positive impact on the regional development of Poland. Yiannakou, Eppas and Zeka made [70] an analysis of spatial interactions between the settlement network, the natural landscape and dynamic zones of economic activity. The authors showed that environmental and social changes in the country diversify SEZs in relation to the localization, size, classification and level of urbanization. It is necessary to consider the changes in the settlement system of people and the natural environment in the process sustainable development. Józefowski and Młodak [71] draw conclusions on the significance of individual zones for the development of local communities, at the same time referring to the social dimension discussed in the present paper. In the opinion of the authors, special economic zones have a significant impact on the socio-economic development of municipalities only when the zone includes a sufficiently large area and is characterized by the specific level of business activity.
Taking into account the environmental aspect of SEZs, it is necessary to refer to the studies by Davies and Edwards [72] who compared energy intensity of the companies in the zones and outside the zones. The research results of the authors are different from those included in the present paper. They pointed out that the companies from SEZs have higher intensity of electric power as opposed to the companies from outside SEZs, and therefore it should be assumed that the functioning of the zones negatively affects the natural environment.
Soytong and Perera [53] focused on environmental conflict in the industrial zones in Thailand, which was created as a result of extending the zones to areas of local communities. Enlargement of zones caused negative social and environmental effects. The government, as a regulatory body, was guided by industrial expansion, at the expense of balancing social and environmental interests.
In turn, the case of Indian SEZs, developed by Rawat, Bhushan and Surepally [73] shows the negative impact of the zones on the local communities, visible in the forced resettlement from the areas of business activity and significant water pollution. The latter phenomenon was observed by Chen et al. [74], in the opinion of whom economic development, including the creation of SEZs, is the key factor in deterioration in the quality of surface waters in China. The problem of water pollution in the area of Polish economic zones has not been investigated and constitutes a potential research area for further analyses.
Zimm, Sperling and Busch [75] examined the requirements for a comprehensive assessment of the sustainability objectives in order to create synergies between economic, social and environmental objectives. According to them, existing tools and methods for assessing the sustainable development are not suitable. Shaping the new solution space for sustainable development can strengthen the foundations of strategic policy decisions that integrate sustainable development issues on a spatial and temporal scale at the regional and national levels.
7. Summary
The research conducted indicated the prevailing importance of the municipalities and cities belonging to SEZs in the economic development of the country. The analyses pointed out significant differences between the surveyed groups for the economic, social and environmental dimensions. In the economic dimension, the municipalities belonging to special economic zones are characterized by a higher level of entrepreneurship and a lower level of unemployment. At the same time, they incur higher expenditure from the budget. The largest differences between the surveyed groups relate to the social dimension. In the municipalities belonging to SEZs, there is observed a higher level of population density and working-age population and a lower level of internal migrations. In turn, in the environmental dimension, the share of green areas is larger than in the other municipalities. An additional analysis indicated that the cities belonging to SEZs have a lower level of emissions of PM2.5 and PM10 than the other most polluted cities. At the same time, the limited environmental data typical of special economic zones do not fully reflect the environmental impact of the zones. This area requires further research.
At the same time, there are observed no differences between the surveyed groups of municipalities. Regardless of the belonging criterion, they generate a similar level of revenues and have a similar level of forestation.
The results obtained allow the observation of the beneficial impact of SEZs on the sustainable development of municipalities in Poland. At the same time, the research is not without drawbacks. Due to the availability of data concerning individual zones as well as municipalities and cities, the thorough analysis of all aspects of sustainable development is not possible. Therefore, it should be assumed that the municipalities belonging to the zones are developing in accordance with the concept of sustainable development exclusively in the area of the economic, social and environmental indicators investigated. The formulation of more extensive conclusions requires further research in this field. In spite of this, at this stage of the considerations it can be concluded that the further functioning of SEZs which, according to the government plan, is to cover the whole territory of Poland, is justified. The research methodology presented can be also used for the assessment of the activity of SEZs in other countries. Future research should be extended to further analyses associated with the implementation of sustainable development, this time in relation to the activity of enterprises operating in the area of special economic zones.
Authors Contributions
This paper is the result of the joint work by all the authors.
Funding
This research received no external funding.
Conflicts of Interest
The authors declare no conflict of interest.
References
- Holden, C. Graduated sovereignty and global governance gaps: Special economic zones and the illicit trade in tobacco products. Political Geogr. 2017, 59, 72–81. [Google Scholar] [CrossRef] [PubMed]
- Liu, W.; Shi, H.; Zhang, Z.; Tsai, S.; Zhai, Y.; Chen, Q.; Wang, J. The Development Evaluation of Economic Zones in China. Int. J. Environ. Res. Public Health 2018, 15, 56. [Google Scholar] [CrossRef] [PubMed]
- Fu, Q.; Li, B.; Yang, L.; Wu, Z.; Zhang, X. Ecosystem Services Evaluation and Its Spatial Characteristics in Central Asia’s Arid Regions: A Case Study in Altay Prefecture, China. Sustainabiility 2015, 7, 8335–8353. [Google Scholar] [CrossRef] [Green Version]
- Zheng, J.; Sheng, P. The Impact of Foreign Direct Investment (FDI) on the Environment: Market Perspectives and Evidence from China. Economies 2017, 5, 8. [Google Scholar] [CrossRef]
- Rustidja, E.S.; Purnamawati, A.; Setiawati, R. Investment Promotion for Community Economic Development of Special Economic Zone: Study of Sez Mandalika and Bitung in Indonesia. Eur. J. Econ. Bus. Stud. 2017, 8, 138. [Google Scholar] [CrossRef] [Green Version]
- Meyer, N.; Meyer, D.F. Best practice management principles for business chambers to facilitate economic development: Evidence from South Africa. Pol. J. Manag. Stud. 2017, 15, 144–153. [Google Scholar] [CrossRef]
- Krzemiński, P. Specjalne strefy ekonomiczne jako stymulator przedsiębiorczości, Przedsiębiorczość—Edukacja, Rola przedsiębiorczości w kształtowaniu społeczeństwa informacyjnego. Przedsiębiorczość Edukacja 2009, 5, 218–227. [Google Scholar]
- Moberg, L. The political economy of special economic zones. J. Inst. Econ. 2015, 11, 167–190. [Google Scholar] [CrossRef]
- Anwar, M.A. Pádraig Carmody, Bringing globalization to the countryside: Special Economic Zones in India. Singap. J. Trop. Geogr. 2016, 37, 121–138. [Google Scholar] [CrossRef]
- Ministerstwo Rozwoju. Informacja o Realizacji Ustawy o Specjalnych Strefach Ekonomicznych, Stan na 31 Grudnia 2016 r.; Ministerstwo Rozwoju: Warszawa, Poland, 2017; pp. 5–7.
- Regional Policy, Making Europe’s Regions and Cities More Competitive, Fostering Growth and Creating Jobs, Luxembourg 2014. Available online: https://europa.eu/european-union/file/1401/download_en?token=PYjCF8r4 (accessed on 14 April 2018).
- Lizińska, W.; Kisiel, R.; Szczebiot-Knoblauch, L. Uwarunkowania Rozwoju Specjalnych Stref Ekonomicznych w Polsce i Jego Perspektywy; Pancer-Cybulska, E., Szostak, E., Eds.; Polityka spójności w okresie 2014–2020 a rozwój regionów Europy Research Papers of Wrocław University of Economics No. 227; Wrocław University of Economics: Wrocław, Poland, 2011. [Google Scholar]
- Rynio, D. Polityka Spójności a Nowy Paradygmat Polityki Regionalnej w Polsce; Pancer-Cybulska, E., Szostak, E., Eds.; Polityka spójności w okresie 2014–2020 a rozwój regionów Europy Research Papers of Wrocław University of Economics No. 227; Wrocław University of Economics: Wrocław, Poland, 2011. [Google Scholar]
- Jania, M.A.; Smagowicz-Tokarz, A. Pomoc Publiczna dla Specjalnych Stref Ekonomicznych. Available online: http://www.rp.pl/Firma/301169967-Pomoc-publiczna-dla-specjalnych-stref-ekonomicznych.html (accessed on 11 March 2018).
- Kancelaria Sejmu RP. Rozporządzenie Rady Ministrów z Dnia 10.12.2008 r. W Sprawie Pomocy publicznej Udzielanej Przedsiębiorcom Działającym na Podstawie Zezwolenia na Prowadzenie Działalności Gospodarczej na Terenach Specjalnych Stref Ekonomicznych, dz. U. Z 2015 r. Poz. 465; Kancelaria Sejmu RP: Warsaw, Poland, 2008.
- Kubicka-Żach, K. Zmiany w Zasadach Funkcjonowania Specjalnych Stref Ekonomicznych. Available online: http://www.samorzad.lex.pl/czytaj/-/artykul/zmiany-w-zasadach-funkcjonowania-specjalnych-stref-ekonomicznych (accessed on 12 May 2018).
- Przewodnik po Specjalnych Strefach Ekonomicznych w Polsce, KPMG w Polsce. Available online: https://www.paih.gov.pl/files/?id_plik=10589 (accessed on 1 March 2018).
- 20 Lat Specjalnych Stref Ekonomicznych w Polsce Przewodnik po SSE. Available online: https://www.paih.gov.pl/files/?id_plik=24348 (accessed on 11 March 2018).
- Investors Vote “Remain” in Europe EY’s Attractiveness Survey Europe May 2017. Available online: http://www.ey.com/Publication/vwLUAssets/ey-attractiveness-europe-2017/$FILE/ey-attractiveness-europe-2017.pdf (accessed on 12 April 2018).
- UNCTAD. World Investment Prospects Survey 2013–2015. In Proceedings of the United Nations Conference on Trade and Development, New York, NY, USA; Geneva, Switzerland, 29 October 2013. [Google Scholar]
- Białek, J.; Oleksiuk, A. The socio-economic effects of Poland’s membership in the European Union and the challenges of the middle-income trap. J. Int. Stud. 2016, 9, 130–143. [Google Scholar] [CrossRef] [PubMed] [Green Version]
- Miłaszewicz, D. Specjalne Strefy Ekonomiczne jako Narzędzie modernizacji Gospodarki; Studia i Prace Wydziału Nauk Ekonomicznych i Zarządzanie No. 22/2011; Uniwersytet Szczeciński: Szczecin, Poland, 2011. [Google Scholar]
- Pastusiak, R. Dochody Gmin a Przedsiębiorstwa w Specjalnych Strefach Ekonomicznych. Przykład Województwa Łódzkiego. Acta Univ. Lodz. Folia Oecon. 2013, 284, 155–164. [Google Scholar]
- Ciżkowicz, P.; Rzońca, A.; Ciżkowicz-Pękała, M.; Pękała, P. Efektywność Specjalnych Stref Ekonomicznych w Polsce jako narzędzia polityki gospodarczej: Analiza empiryczna z wykorzystaniem modeli panelowych. Acta Univ. Lodz. Folia Oecon. 2014, 6, 308. [Google Scholar]
- Reiljan, J. Regional Development Sustainability Analysis Concept. Available online: https://bib.irb.hr/datoteka/833076.SUSTAINABLE_DEVELOPMENT_AS_A_STRATEGIC_GUIDING_PRINCIPLES.pdf (accessed on 22 April 2018).
- Dobrovolskienė, N.; Tvaronavičienė, M.; Tamošiūnienė, R. Tackling projects on sustainability: A lithuanian case study. Entrep. Sustain. Issues 2017, 4, 477–488. [Google Scholar] [CrossRef]
- Kot, S. Sustainable supply chain management in small and medium enterprises. Sustainability 2018, 10, 1143. [Google Scholar] [CrossRef]
- Lin, C.S.; Chang, R.Y.; Dang, V.T. An integrated model to explain how corporate social responsibility affects corporate financial performance. Sustainability 2015, 7, 8292–8311. [Google Scholar] [CrossRef]
- Androniceanu, M.; Comǎnescu, I.V. Dragulanescu, The impact of globalization on unemployment in Europe. In Proceedings of the 29th International Business Information Management Association Conference—Education Excellence and Innovation Management through Vision 2020: From Regional Development Sustainability to Global Economic Growth, Vienna, Austria, 3–4 May 2017; pp. 716–724. [Google Scholar]
- Sekuła, A. Rozwój Równoważony w Skali Gmin; Europa bez Granic—Polska a Unia Europejska; Bałabana, A., Ed.; Państwowa Wyższa Szkoła Zawodowa: Gorzów Wielkopolski, Poland, 2002; p. 330. [Google Scholar]
- Wojtyra, B. Strefy aktywności gospodarczej w teoriach rozwoju lokalnego. Stud. Ind. Geogr. Comm. Pol. Geogr. Soc. 2016, 30. [Google Scholar] [CrossRef]
- Yang, Q.; Ding, Y.; de Vries, B.; Han, Q.; Ma, H. Assessing Regional Sustainability Using a Model of Coordinated Development Index: A Case Study of Mainland China. Sustainability 2014, 6, 9282–9304. [Google Scholar] [CrossRef] [Green Version]
- Ge, B.; Jiang, D.; Gao, Y.; Tsai, S. The Influence of Legitimacy on a Proactive Green Orientation and Green Performance: A Study Based on Transitional Economy Scenarios in China. Sustainability 2016, 8, 1344. [Google Scholar] [CrossRef]
- Błachut, J. Wpływ Obszarów Specjalnych Stref Ekonomicznych na rozwój gmin. Prace Naukowe Wałbrzyskiej Wyższej Szkoły Zarządzania i Przedsiębiorczości 2015, 33, 253–266. [Google Scholar]
- Lichota, W. Efektywność finansowa Specjalnych Stref Ekonomicznych w Polsce. Gospod. Nar. 2016, 281, 99–130. [Google Scholar]
- Ślusarczyk, B. Public Aid as an Investment Incentive to Realize Foreign Direct Investments (FDI) in Poland. In Innovation Management and Education Excellence through Vision 2020, Proceedings of the 31st International Business Information Management Association Conference (IBIMA), Milan, Italy, 25–26 April 2018; Khalid, S., Ed.; International Business Information Management Association: Madrid, Spain, 2018; pp. 1062–1072. ISBN 978-0-9998551-0-2. [Google Scholar]
- Jasiniak, M.; Keller, J. Znaczenie specjalnych stref ekonomicznych w rozwoju polskich regionów—Na przykładzie województwa łódzkiego. Acta Univ. Lodz. Folia Oecon. 2016, 4, 323. [Google Scholar] [CrossRef]
- Szymańska, J.; Wajer, W. Specjalne Strefy Ekonomiczne Jako Narzędzie Pomocy Państwa Zwiększające Konkurencyjność Regionów I Efektywność Zagospodarowania Istniejącego Majątku Przemysłowego; Tom 1, Studia z Zakresu Prawa, Administracji i Zarządzania UKW; Biblioteka Uniwersytetu Kazimierza Wielkiego: Bydgoszcz, Poland, 2012. [Google Scholar]
- Radosław, P.; Magdalena, J.; Jakub, K.; Bartłomiej, K. (Eds.) Specjalne Strefy Ekonomiczne w Polsce w oczach przedsiębiorców i pracowników samorządów. J. Financ. Financ. Law 2016, 1, 20385. [Google Scholar]
- Cieślewicz, W. Regionalna pomoc publiczna jako instrument aktywizacji gospodarczej—Przypadek specjalnych stref ekonomicznych w Polsce. Nierówności Społeczne a Wzrost Gospodarczy 2009, 15, 318–330. [Google Scholar]
- Guagliano, C.; Riela, S. Do special economics areas matter in attracting FDI? Evidence from Poland, Hungary and Czech Republic; ISLA: Milano, Italy, 2005. [Google Scholar]
- Lizińska, W.; Marks-Bielska, R. Efekty funkcjonowania Specjalnych Stref Ekonomicznych w Polsce w kontekście realizacji celów ich tworzenia oraz wykorzystanej pomocy publicznej, OPTIMUM. Stud. Ekon. 2013, 62, 92–105. [Google Scholar]
- Golik, J. Kątnik-Prokop, J. Funkcjonowanie Specjalnych Stref Ekonomicznych w Polsce. Stud. Ekon. 2014, 166, 180–193. [Google Scholar]
- Herlevi, A. Economic Growth or Sowing the Seeds of Destruction? The Role of Economic Development Zones in China. J. Chin. Polit. Sci. 2017, 22, 675–689. [Google Scholar] [CrossRef]
- Ambroziak, A.A. Efekty funkcjonowania specjalnych stref ekonomicznych w Polsce. Zeszyty Naukowe Szkoła Główna Handlowa 2009, 24, 111–141. [Google Scholar]
- Specjalne Strefy Ekonomiczne po 2020 roku, Analiza Dotychczasowej Działalności Oraz Perspektywy Funkcjonowania; Ernst & Young: Warszawa, Poland, 2011.
- Khandelwal, K.; Teachout, M. IGC Policy Note: Special Economic Zones for Myanmar. Available online: https://www.theigc.org/wp-content/uploads/2016/03/SEZs-in-Myanmar.pdf (accessed on 9 April 2018).
- Sancewicz, P. Wygaśnięcie Zezwolenia na Prowadzenie Działalności Gospodarczej w Specjalnej Strefie Ekonomicznej—Uwagi na tle Nowelizacji Ustawy o Specjalnych Strefach Ekonomicznych; Praktyka Podatkowa 1/2017. Available online: http://praktykapodatkowa.pl (accessed on 7 March 2018).
- Kitowska, M. Prawne uwarunkowania prowadzenia działalności gospodarczej w specjalnych strefach ekonomicznych. J. Manag. Financ. 2015, 13, 209–221. [Google Scholar]
- Ambroziak, A.A. Income Tax Exemption as a Regional State Aid in Special Economic Zones and Its Impact upon Development of Polish Districts. Oecon. Copernic. 2016, 7, 245–267. [Google Scholar] [CrossRef]
- Shpak, N.; Satalkina, L.; Sroka, W.; Hittmar, S. The social direction of enterprises’ innovation activity. Pol. J. Manag. Stud. 2017, 16, 187–201. [Google Scholar] [CrossRef]
- Oláh, J.; Karmazin, G.; Máté, D.; Grabara, J.K.; Popp, J. The effect of acquisition moves on income, pre-tax profits and future strategy of logistics firms. J. Int. Stud. 2017, 10, 233–245. [Google Scholar] [CrossRef] [Green Version]
- Soytong, P.; Perera, R. Use of GIS Tools for Environmental Conflict Resolution at Map Ta Phut Industrial Zone in Thailand. Sustainability 2014, 6, 2435–2458. [Google Scholar] [CrossRef] [Green Version]
- Susanto, F.; Arafah, W.; Husin, Z. Ambidextrous sustainability and manufacturing industry performance: The role of potential non-economic benefits as mediation pathways. Pol. J. Manag. Stud. 2017, 16, 278–289. [Google Scholar] [CrossRef]
- Farole, T.; Akinci, G. (Eds.) Special Economic Zones Progress, Emerging Challenges, and Future Directions; The World Bank: Washington, DC, USA, 2011; p. 17. [Google Scholar]
- Augustyński, I. Iluzje Specjalnych Stref Ekonomicznych; Research Papers of Wroclaw University of Economics No. 466/2017; Wroclaw University of Economics: Wrocław, Poland, 2018. [Google Scholar]
- Trzciński, R.; Stasiowski, J.; Konieczna-Sałamatin, J.; Skórska, P.; Bienias, S.; Weremiuk, A. Wpływ Specjalnych Stref Ekonomicznych Na Zatrudnienie; Ocena Skutków Regulacji ex Post Ustawy o Specjalnych Strefach Ekonomicznych z Dnia 20 Października 1994 Roku Raport Końcowy; Kozminski University: Warsaw, Poland, 2016. [Google Scholar]
- Jauch, H. Export processing zones and the quests for sustainable development: A Southern African perspective. Environ. Urban. 2002, 14, 101–113. [Google Scholar] [CrossRef]
- Bolívar, M.P.R.; Galera, A.N.; Muñoz, L.A.; Subires, M.D.L. Analyzing Forces to the Financial Contribution of Local Governments to Sustainable Development. Sustainability 2016, 8, 925. [Google Scholar] [Green Version]
- A Guide to Special Economic Zones in Poland, KPMG in Poland. Available online: KPMG_Guide_to_SEZ_in_Poland_2009 (1).pdf (accessed on 12 April 2018).
- Nowe przepisy o Specjalnych Strefach Ekonomicznych—AKTUALIZACJA. Available online: https://skslegal.pl/pl/publikacje/planned-changes-the-sez-regime-update/ (accessed on 22 June 2018).
- Potencjał inwestycyjny, Specjalne Strefy Ekonomiczne w Polsce 2016. Available online: http://www.colliers.com/pl-pl/-/media/files/emea/poland/reports/2016/Colliers_Raport_Specjalne_Strefy_Ekonomiczne_PL.pdf (accessed on 1 April 2018).
- Statistical Data. Available online: http://swaid.stat.gov.pl/ (accessed on 7 March 2018).
- Available online:. Available online: http://jibe-net.com/journals/jibe/Vol_2_No_4_December_2014/6.pdf (accessed on 23 May 2018).
- Razali, N.M.; Wah, Y.B. Power comparisons of Shapiro-Wilk, Kolmogorov-Smirnov, Lilliefors and Anderson-Darling tests. J. Stat. Model. Anal. 2011, 2, 21–33. [Google Scholar]
- Paraušić, V.; Domazet, I.; Simeunović, I. Analysis of the relationship between the stage of economic development and the state of cluster development. Argum. Oecon. 2017, 39, 286. [Google Scholar]
- Sinenko, O.; Mayburov, I. Comparative Analysis of the Effectiveness of Special Economic Zones and Their Influence on the Development of Territories. Int. J. Econ. Financ. Issues 2017, 7, 115–122. [Google Scholar]
- Jarosiński, K.; Maśloch, G. The Impact of Special Economic Zones on the Level of Socio-Economic Changes of Polish Regions. Warsaw Forum Econ. Sociol. 2016, 7, 115–137. [Google Scholar]
- Pastusiak, R.; Jasiniak, M.; Kaźmierska, A. Should Local Governments Expect Benefits from Special Economic Zones? The Case of Poland, World Academy of Science. Eng. Technol. Int. J. Econ. Manag. Eng. 2015, 9. [Google Scholar] [CrossRef]
- Yiannakou, A.; Eppas, D.; Zeka, D. Spatial Interactions between the Settlement Network, Natural Landscape and Zones of Economic Activities: A Case Study in a Greek Region. Sustainability 2017, 9, 1715. [Google Scholar] [CrossRef]
- Józefowski, T.; Młodak, A. Special Economic Zones in the context of reginal development. EUROPA XXI 2017, 33, 33–47. [Google Scholar] [CrossRef]
- Davies, R.B.; Edwards, T.H.; Mazhikeyev, A. The Impact of Special Economic Zones on Electricity Intensity of Firms; UCD School of Economics University College: Dublin, Ireland, 2016; pp. 2–8. [Google Scholar]
- Bhushan, V.; Mamidi, R.; Bhushan, B.; Surepally, S. The impact of Special Economic Zones in India: A case study of Polepally SEZ; International Land Coalition: Rome, Italy, 2011; pp. 41–45. [Google Scholar]
- Chen, Y.; Zhang, Z.; Shi, S.D.P.; Tao, F.; Doyle, M. Water quality changes in the world's first special economic zone, Shenzhen, China. J. Water Resour. Res. 2011, 47, 1–9. [Google Scholar] [CrossRef]
- Zimm, F.S.; Busch, S. Identifying Sustainability and Knowledge Gaps in Socio-Economic Pathways Vis-à-Vis the Sustainable Development Goals. Economies 2018, 6, 20. [Google Scholar] [CrossRef]
Figure 1.
The structure of the assessment of sustainable development [32].
Figure 1.
The structure of the assessment of sustainable development [32].

Figure 2.
Areas of SEZs in Poland [61].
Figure 2.
Areas of SEZs in Poland [61].

Figure 3.
The dynamics and pace of change in the economic dimension for 2016 (the base year = 2012) (%).
Figure 3.
The dynamics and pace of change in the economic dimension for 2016 (the base year = 2012) (%).

Figure 4.
The dynamics and pace of changes in the social dimension for 2016 (the base year = 2012) (%).
Figure 4.
The dynamics and pace of changes in the social dimension for 2016 (the base year = 2012) (%).

Figure 5.
The dynamics and pace of changes in the environmental dimension for 2016 (the base year = 2012) (%).
Figure 5.
The dynamics and pace of changes in the environmental dimension for 2016 (the base year = 2012) (%).

Figure 6.
The average levels of PM2.5 and PM10 particles (μg/m³).


Table 1.
The structure of the population of municipalities in terms of belonging to special economic zones (SEZs) [60].
Table 1.
The structure of the population of municipalities in terms of belonging to special economic zones (SEZs) [60].
| Listing | Frequency | % of Total Number of Municipalities in Poland | % of Total Number of Municipalities Belonging to SEZs |
|---|---|---|---|
| Municipalities outside the zone | 2083 | 84.0 | - |
| Municipalities in the zone: | 397 | 16 | |
| Kamiennogórska | 14 | 0.6 | 4 |
| Katowicka | 42 | 1.7 | 11 |
| Kostrzyńsko-Słubicka | 46 | 1.9 | 12 |
| Krakowska | 31 | 1.3 | 8 |
| Legnicka | 17 | 0.7 | 4 |
| Łódzka | 42 | 1.7 | 11 |
| Mielecka | 26 | 1.0 | 7 |
| Pomorska | 32 | 1.3 | 8 |
| Słupska | 14 | 0.6 | 4 |
| Starachowicka | 14 | 0.6 | 4 |
| Suwalska | 19 | 0.8 | 5 |
| Tarnobrzeska | 18 | 0.7 | 5 |
| Wałbrzyska | 51 | 2.1 | 13 |
| Warmińsko-Mazurska | 31 | 1.3 | 8 |
| Total | 2480 | 100.0 | 100.0 |
Table 2.
Characteristics of SEZs in Poland [62].
Table 2.
Characteristics of SEZs in Poland [62].
| SEZ | Total SEZ Area (ha) | Number of Cities/Municipalities | Leading Industry in the Zone | Value of Investment (Billion PLN) | Active Permits | New Jobs | |
|---|---|---|---|---|---|---|---|
| Kamiennogórska SEZMP | 367 | 7 | 8 | Automotive | 2.3 | 63 | 6274 |
| Katowicka SEZ | 2348 | 21 | 18 | Automotive | 25 | 346 | 45,994 |
| Kostrzyńsko- Słubicka SEZ | 1868 | 7 | 27 | Automotive | 5.6 | 296 | 19,247 |
| Krakowski Park Technologiczny | 866 | 8 | 13 | Automotive | 4 | 4 | 12,191 |
| Legnicka SEZ | 1341 | 5 | 8 | Automotive | 7.7 | 145 | 12,840 |
| Łódzka SEZ | 1339 | 22 | 25 | Household appliances | 14 | 286 | 26,629 |
| EURO-PARK MIELEC | 1495.7 | 14 | 9 | Aviation | 8.6 | 208 | 18,365 |
| Pomorska SEZ | 2040 | 12 | 11 | Stationary products | 10.8 | 157 | 15,326 |
| Słupska SEZ | 910.2 | 5 | 8 | Wood processing | 1.6 | 90 | 5900 |
| SEZ “Starachowice” | 664.5 | 5 | 10 | Metal products and machinery | 2.2 | 166 | 4192 |
| Suwalska SEZ | 635 | 4 | 3 | Wood processing | 3 | 226 | 7949 |
| “EURO-PARK WISŁOSAN | 1743 | 10 | 26 | Metal products | 8.6 | 314 | 18,300 |
| Wałbrzyska SEZ “INVEST-PARK” | 3502 | 16 | 31 | Automotive | 22 | 297 | 37,180 |
| Warmińsko-Mazurska SEZ | 1057 | 11 | 15 | Rubber products | 4.2 | 97 | 9400 |
Table 3.
The indicators to assess the results of the activity of municipalities and cities in Poland [63].
Table 3.
The indicators to assess the results of the activity of municipalities and cities in Poland [63].
| Symbol | Economic Dimension | A Desired Direction of Changes |
|---|---|---|
| ED1 | The share of the total registered unemployed in the working-age population (%) | Decline |
| ED2 | Budget revenues of municipalities and cities with county (poviat) rights per capita (PLN) | Growth |
| ED3 | Entities newly registered in the REGON register per 10,000 working-age population (item) | Growth |
| ED4 | Entities entered into the REGON register per 10,000 population (item) | Growth |
| ED5 | Budget expenditure of municipalities and cities with country rights per capita (PLN) | Decline |
| Social Dimension | ||
| SD1 | Population per 1 km2—population density (item) | Growth |
| SD2 | Internal migration balance per 1000 population (the difference between inflow (immigration) and outflow (emigration) of the population of the specific area at specific time) | Decline |
| SD3 | The share of the post-working age population in total population (%) | Decline |
| SD4 | The share of the working-age population in total population (%) | Growth |
| Environmental Dimension | ||
| ND1 | Forestation as % of a total amount (% of the municipality area) | Growth |
| ND2 | The share of green areas in a total area (%) | Growth |
Table 4.
The average values of the indicators for the economic, social and environmental dimensions.
Table 4.
The average values of the indicators for the economic, social and environmental dimensions.
| Economic Dimension | Social Dimension | Environmental Dimension | ||||||
|---|---|---|---|---|---|---|---|---|
| Indicators | Average | Indicators | Average | Indicators | Average | |||
| Municipalities in the Zone | Other Municip. | Municipalities in the Zone | Other Municip. | Municipalities in the Zone | Other Municip. | |||
| ED1 | 8.22 | 8.76 | SD1 | 689.99 | 153.36 | ND1 | 21.59 | 21.33 |
| ED2 | 3665.86 | 3443.84 | SD2 | −1.18 | 0.81 | |||
| ED3 | 130.29 | 107.42 | SD3 | 18.55 | 18.39 | ND2 | 1.35 | 0.15 |
| ED4 | 976.66 | 733.18 | SD4 | 63.40 | 62.11 | |||
| ED5 | 3614.84 | 3399.44 | ||||||
Table 5.
Normality test of distribution for the dependent variables of the economic dimension.
| Indicators | Group | Kołmogorov–Smirnow | ||
|---|---|---|---|---|
| Statistics | df | Significance | ||
| ED1 | municip. in the zone | 0.063 | 397 | 0.001 |
| m. outside the zone | 0.105 | 397 | 0.054 | |
| ED2 | municip. in the zone | 0.332 | 397 | 0.123 |
| m. outside the zone | 0.176 | 397 | 0.234 | |
| ED3 | municip. in the zone | 0.100 | 397 | 0.344 |
| m. outside the zone | 0.147 | 397 | 0.076 | |
| ED4 | municip. in the zone | 0.078 | 397 | 0.088 |
| m. outside the zone | 0.196 | 397 | 0.076 | |
| ED5 | municip. in the zone | 0.302 | 397 | 0.230 |
| m. outside the zone | 0.174 | 397 | 0.125 | |
Table 6.
Normality test of distribution for the dependent variables of the social dimension.
| Indicators | Group | Kołmogorov–Smirnow | ||
|---|---|---|---|---|
| Statistics | df | Significance | ||
| SD1 | municip. in the zone | 0.243 | 397 | 0.070 |
| m. outside the zone | 0.378 | 397 | 0.123 | |
| SD2 | municip. in the zone | 0.141 | 397 | 0.065 |
| m. outside the zone | 0.153 | 397 | 0.055 | |
| SD3 | municip. in the zone | 0.024 | 397 | 0.200 |
| m. outside the zone | 0.040 | 397 | 0.134 | |
| SD4 | municip. in the zone | 0.051 | 397 | 0.084 |
| m. outside the zone | 0.037 | 397 | 0.200 | |
Table 7.
Normality test of distribution for the dependent variables of the environmental dimension.
| Indicators | Group | Kołmogorov–Smirnow | ||
|---|---|---|---|---|
| Statistics | df | Significance | ||
| ND1 | municip. in the zone | 0.101 | 397 | 0.082 |
| m. outside the zone | 0.079 | 397 | 0.053 | |
| ND2 | municip. in the zone | 0.253 | 397 | 0.132 |
| m. outside the zone | 0.389 | 397 | 0.210 | |
Table 8.
The univariate analysis of variance (ANOVA) for the economic dimension.
| Symbol | Specification | Sum of Squares | df | Mean Square | F | Significance |
|---|---|---|---|---|---|---|
| ED1 | between the groups | 60.42 | 1 | 60.42 | 5.228 | 0.022 |
| inside the groups | 9153.97 | 792 | 11.55 | |||
| ED2 | between the groups | 9,783,977.37 | 1 | 9,783,977.37 | 3.077 | 0.080 |
| inside the groups | 2,518,654,954.44 | 792 | 3,180,119.89 | |||
| ED3 | between the groups | 103,804.75 | 1 | 103,804.75 | 61.770 | 0.000 |
| inside the groups | 1,330,949.34 | 792 | 1680.49 | |||
| ED4 | between the groups | 11,767,490.66 | 1 | 11,767,490.62 | 120.049 | 0.000 |
| inside the groups | 77,633,729.55 | 792 | 98,022.38 | |||
| ED5 | between the groups | 9,209,878.90 | 1 | 9,209,878.90 | 4.084 | 0.044 |
| inside the groups | 1,785,928,623.02 | 792 | 2,254,960.38 |
Table 9.
The univariate ANOVA for the social dimension.
| Symbol | Specification | Sum of Squares | df | Mean Square | F | Significance |
|---|---|---|---|---|---|---|
| SD1 | between the groups | 57,161,690.76 | 1 | 57,161,690.76 | 145.08 | 0.000 |
| inside the groups | 312,028,697.39 | 792 | 393,975.62 | |||
| SD2 | between the groups | 794.76 | 1 | 794.76 | 30.21 | 0.000 |
| inside the groups | 20,832.42 | 792 | 26.30 | |||
| SD3 | between the groups | 4.86 | 1 | 4.86 | 0.80 | 0.370 |
| inside the groups | 4785.54 | 792 | 6.04 | |||
| SD4 | between the groups | 333.33 | 1 | 333.33 | 184.21 | 0.000 |
| inside the groups | 1433.14 | 792 | 1.81 |
Table 10.
The univariate ANOVA for the environmental dimension.
| Symbol | Specification | Sum of Squares | df | Mean Square | F | Significance |
|---|---|---|---|---|---|---|
| ND1 | between the groups | 13.77 | 1 | 13.77 | 0.06 | 0.810 |
| inside the groups | 191,506.49 | 792 | 241.80 | |||
| ND2 | between the groups | 289.04 | 1 | 289.04 | 128.86 | 0.000 |
| inside the groups | 1776.40 | 792 | 2.24 |
Table 11.
The univariate ANOVA for the environmental dimension.
| Pollution Type | Specification | Sum of Squares | df | Mean Square | F | Significance |
|---|---|---|---|---|---|---|
| PM2.5 | between the groups | 142.04 | 1 | 142.04 | 4.70 | 0.032 |
| inside the groups | 3350.52 | 111 | 30.18 | |||
| PM10 | between the groups | 244.75 | 1 | 244.75 | 4.38 | 0.039 |
| inside the groups | 6198.80 | 111 | 55.84 |
© 2018 by the authors. Licensee MDPI, Basel, Switzerland. This article is an open access article distributed under the terms and conditions of the Creative Commons Attribution (CC BY) license (http://creativecommons.org/licenses/by/4.0/).
Share and Cite
MDPI and ACS Style
Ślusarczyk, B.; Grondys, K. The Concept of Sustainable Development in the Functioning of Municipalities Belonging to Special Economic Zones in Poland. Sustainability 2018, 10, 2169. https://doi.org/10.3390/su10072169
AMA Style
Ślusarczyk B, Grondys K. The Concept of Sustainable Development in the Functioning of Municipalities Belonging to Special Economic Zones in Poland. Sustainability. 2018; 10(7):2169. https://doi.org/10.3390/su10072169
Chicago/Turabian StyleŚlusarczyk, Beata, and Katarzyna Grondys. 2018. "The Concept of Sustainable Development in the Functioning of Municipalities Belonging to Special Economic Zones in Poland" Sustainability 10, no. 7: 2169. https://doi.org/10.3390/su10072169
Note that from the first issue of 2016, this journal uses article numbers instead of page numbers. See further details here.