Article

Assessing the Sustainable Development of Bioenergy from Cassava within “Water-Energy-Food” Nexus Framework in China

1
State Key Laboratory of Resources and Environmental Information Systems, Institute of Geographical Sciences and Natural Resources Research, Chinese Academy of Sciences, Beijing 100101, China
2
College of Resource and Environment, University of Chinese Academy of Sciences, Beijing 100049, China
3
Key Laboratory of Carrying Capacity Assessment for Resource and Environment, Ministry of Land & Resources, Beijing 100101, China
*
Author to whom correspondence should be addressed.
Sustainability 2018, 10(7), 2153; https://doi.org/10.3390/su10072153
Submission received: 8 May 2018 / Revised: 19 June 2018 / Accepted: 22 June 2018 / Published: 25 June 2018

Abstract

:
Bioenergy from cassava is a promising alternative energy source for both energy supply and the mitigation of greenhouse gases. However, major global trends, such as climate change and competing landuse patterns, pose substantial risks to the sustainable development of bioenergy. The main purpose of this study was to assess the sustainable development of bioenergy from cassava, considering landuse change and climate change with a biogeochemical process model within the “water-energy-food” nexus framework. The results showed that the land resources that were suitable for the development of cassava bioenergy have continuously decreased in China since 1990. At the same time, the climate has also undergone significant changes, with temperature showing an increasing trend, and precipitation showing a decreasing trend. With the influences of both landuse change and climate change, the total bioenergy of cassava showed a downward trend. In China, the potential bioenergy production for the year 1990, 2000, and 2010 was 6075 PJ, 5974 PJ, and 4399 PJ, respectively. Compared to 1990, the bioenergy production in 2010 decreased by 1676.40 million GJ, which equals 57 million tons of standard coal. In addition, the water footprint of bioenergy from cassava was discussed. After considering changes to landuse, climate, and water footprint, it was concluded that Guangxi was the most suitable place to develop cassava bioenergy, followed by Fujian, Guangdong, and Yunnan.

1. Introduction

The increasing global fuel prices, the growing demand for energy, and concerns about global warming are the key factors driving the increased interest in renewable energy sources such as bioenergy [1]. Globally, the share of renewable energy is limited to 19.3% of total energy consumption. Of this, 9.1% is shared by traditional bioenergy [2], which contains wood fuels (firewood and charcoal), agriculture residues, and dung burned in open fires or rustic stoves used primarily for cooking, water heating, and space heating in developing countr ies [3]. Modern bioenergy, e.g., biofuel and biodiesel were also developing rapidly [4,5]. Bioenergy is expected to play an important role in future energy systems [6]. However, there are many limitations for the future development of bioenergy. Energy, water, and food systems are closely interlinked. Almost every conceivable human activity and technology requires either water, energy, food, or some combination of the three. For example, in the process of bioenergy production, water was used to grow crops and turn the turbines that produce our electricity. Energy is required to convey and purify water, and is also needed to produce fertilizer, harvest crops, and cook our food. In turn, energy can be produced from crops like corn and sugarcane in the form of biofuels. Clearly, all three sectors are dependent on each other, and all are highly interconnected; a phenomenon that is termed the “water-energy-food” nexus [7]. These connections intensify as the demand for resources increases with population growth and changing consumption patterns [8,9]. Meanwhile, major global trends, such as climate change and competing landuse patterns, restrict the ability of existing systems to meet growing demands in a reliable and affordable manner. These dynamics pose substantial risks to the sustainable development of bioenergy [10,11]. Therefore, the development of bioenergy must be sustainable, and thus, must comprehensively consider both climate change and landuse change within the “water-energy-food” nexus.
China is the largest renewable energy producer in the world [12]. In China, the development of bioenergy is supported by policies [13]. In 2016, China’s “13th Five-Year Plan for Renewable Energy Development” stated that it was necessary to accelerate the development of bioenergy and promote the development of biological liquid fuels. According to resource conditions, China should develop fuel ethanol projects that include materials like cassava and sweet sorghum [14]. Cassava is one of the most promising plants in terms of bioenergy in China because it is drought tolerant and resistant to diseases [15,16]. Therefore, the cassava was selected as raw material to explore the sustainable development of bioenergy in this study.
Few studies have evaluated the potential bioenergy that can be produced from cassava. By considering the constraints of land resources, Jiang et al. evaluated the potential bioenergy of cassava grown on marginal land resources in Guangxi, China [15]. Ozoegwu et al. estimated the bioenergy potential of cassava waste in Nigeria to ensure food security [17]. Wang et al. evaluated the suitability of the development of bioenergy from cassava grown on marginal land in Guangdong Province [18]. Chandra analyzed biomass production, utilization, and losses from 1993 to 2012 in Fiji, using statistical analyses that used data on cassava biomass production, utilization and losses to calculate the potential bioenergy that could be gained from cassava at a national scale [19]. Ziska et al. evaluated the potential bioethanol production from cassava in Alabama and Maryland using field planting data [20]. However, these studies only focused on the potential bioenergy without considering the sustainable development of bioenergies. Some scholars have explored the sustainable development of biomass energy from the perspective of energy conservation and emission reduction. Wu et al. added the corn stover-to-ethanol pathway in the GREET model with the data available on the collection and transportation of corn stover and on the production of cellulosic ethanol, then they analyzed the life-cycle energy use and emission impacts of corn over derived fuel ethanol for use as E85 (a blend of 85% ethanol and 15% gasoline by volume) in flexible fuel vehicles (FFVs). The results showed that FFVs fueled with corn stover ethanol blends offer substantial energy savings (94–95%) relative to those fuelled with RFG. The cellulosic ethanol pathway avoids 86–89% of greenhouse gas emissions [21]. Le et al. investigated energy efficiency and GHG emission saving of cassava-based ethanol as energy for transportation. Energy and GHG balances are calculated for a functional unit of 1 km of road transportation using life-cycle assessment and considering effects of land use change (LUC) in Vietnam. The results showed that the use of E5 (a blend of 5% ethanol and 95% gasoline by volume) and E10 (a blend of 10% ethanol and 90% gasoline by volume) as a substitute for gasoline results in energy savings, provided that fuel consumption in terms of liter per kilometer of transportation does not exceed the consumption of gasoline per kilometer by more than 2.4% and 4.5% respectively. It will reduce GHG emissions, provided that the fuel consumption of E5 and E10 does not exceed the consumption of gasoline per kilometer by more than 3.8% and 7.8% respectively [22]. Jiang et al. estimated the potential of energy saving and carbon emission mitigation of cassava-based fuel ethanol using life cycle assessment coupled with a biogeochemical process model. The results show that there were significant spatial differences in net energy and emissions reductions. Guangxi, with higher net energy and a better emission reduction effect, was regarded as the most suitable area for the development of cassava-based fuel ethanol [23]. The “water-energy-food” nexus has received a great deal of attention internationally since 2011, when the World Economic Forum identified it as one of the three largest threats to the global economy [24]. Some researchers tried to solve the problem of sustainable development of bioenergy from the perspective of the “water-energy-food” nexus. López-Díaz et al. proposed an optimization framework for the design of a biorefining system while accounting for the interactions with the surrounding watershed using a material flow analysis technique through the design of an efficient supply chain for the production and distribution of feedstocks, grains, and biofuels, considering water and land requirements [10]. Hao et al. focused on whether biofuel development would stress China’s water resources. The spatial distribution of the total water requirement of fuel ethanol over its life cycle process was simulated using a biophysical, biogeochemical model and marginal land as one of the types of input data to avoid having an impact on food security. The total water requirement of fuel ethanol was then compared with the spatial distribution of water resources, and the influence of the development of fuel ethanol on water resources at the pixel and river basin region scales was analyzed [25]. Yan et al. presented an integrated method of assessing sweet sorghum-based ethanol potential in China, in compliance with the “water-energy-food” nexus principles. The spatial distribution of water consumption, net energy gain, and greenhouse gas emission reduction potentials of developing sweet sorghum-based ethanol were calculated with the DSSAT (the Decision Support System for Agrotechnology Transfer) model. Considering the water consumption, net energy gain and Greenhouse Gas emission reduction potentials comprehensively, Yunnan Province in south China should be given priority for sweet sorghum-based ethanol development [26]. However, climate change and landuse change were not considered in the current studies, which were the sectors in the “water-energy-food” nexus. The main objective of this study was to explore sustainable development from the spatial-temporal variations of bioenergy potential and water footprint of bioenergy form cassava, considering climate change and landuse change within the “water-energy-food” nexus. Therefore, the main work this article includes: (1) presenting an operational approach to assess the potential bioenergy from cassava within the “water-energy-food” nexus framework; (2) analyzing the potential bioenergy that could have been produced from cassava during the period from 1990 to 2010, while including the factors of landuse change and climate change, and (3) discussing the impacts of landuse change and climate change on the water footprint of bioenergy from cassava. This study can determine the priority areas for development of cassava from the perspective of sustainable development, and provide a reference for China to develop a bioenergy development plan.

2. Materials and Methods

Based on the purpose of this study, we proposed an operational scheme to assess the sustainable development of bioenergy from cassava comprehensively, considering both climate change and landuse change within the “water-energy-food” nexus. The operational steps are listed as follows.
First, the land sources suitable for cassava were extracted within the “water-energy-food” nexus framework.
Second, the spatial distributions of the potential bioenergy from cassava for different years were simulated using a biogeochemical process model.
Third, the driving factors of the potential bioenergy from changes in cassava were analyzed from the perspectives of landuse change and climate change.
Finally, the change in the water footprint of bioenergy from cassava was discussed. In addition, the most suitable areas for the development of cassava were identified, while considering the landuse change, climate change and water footprint change.
The analytical framework of this article is shown in Figure 1.

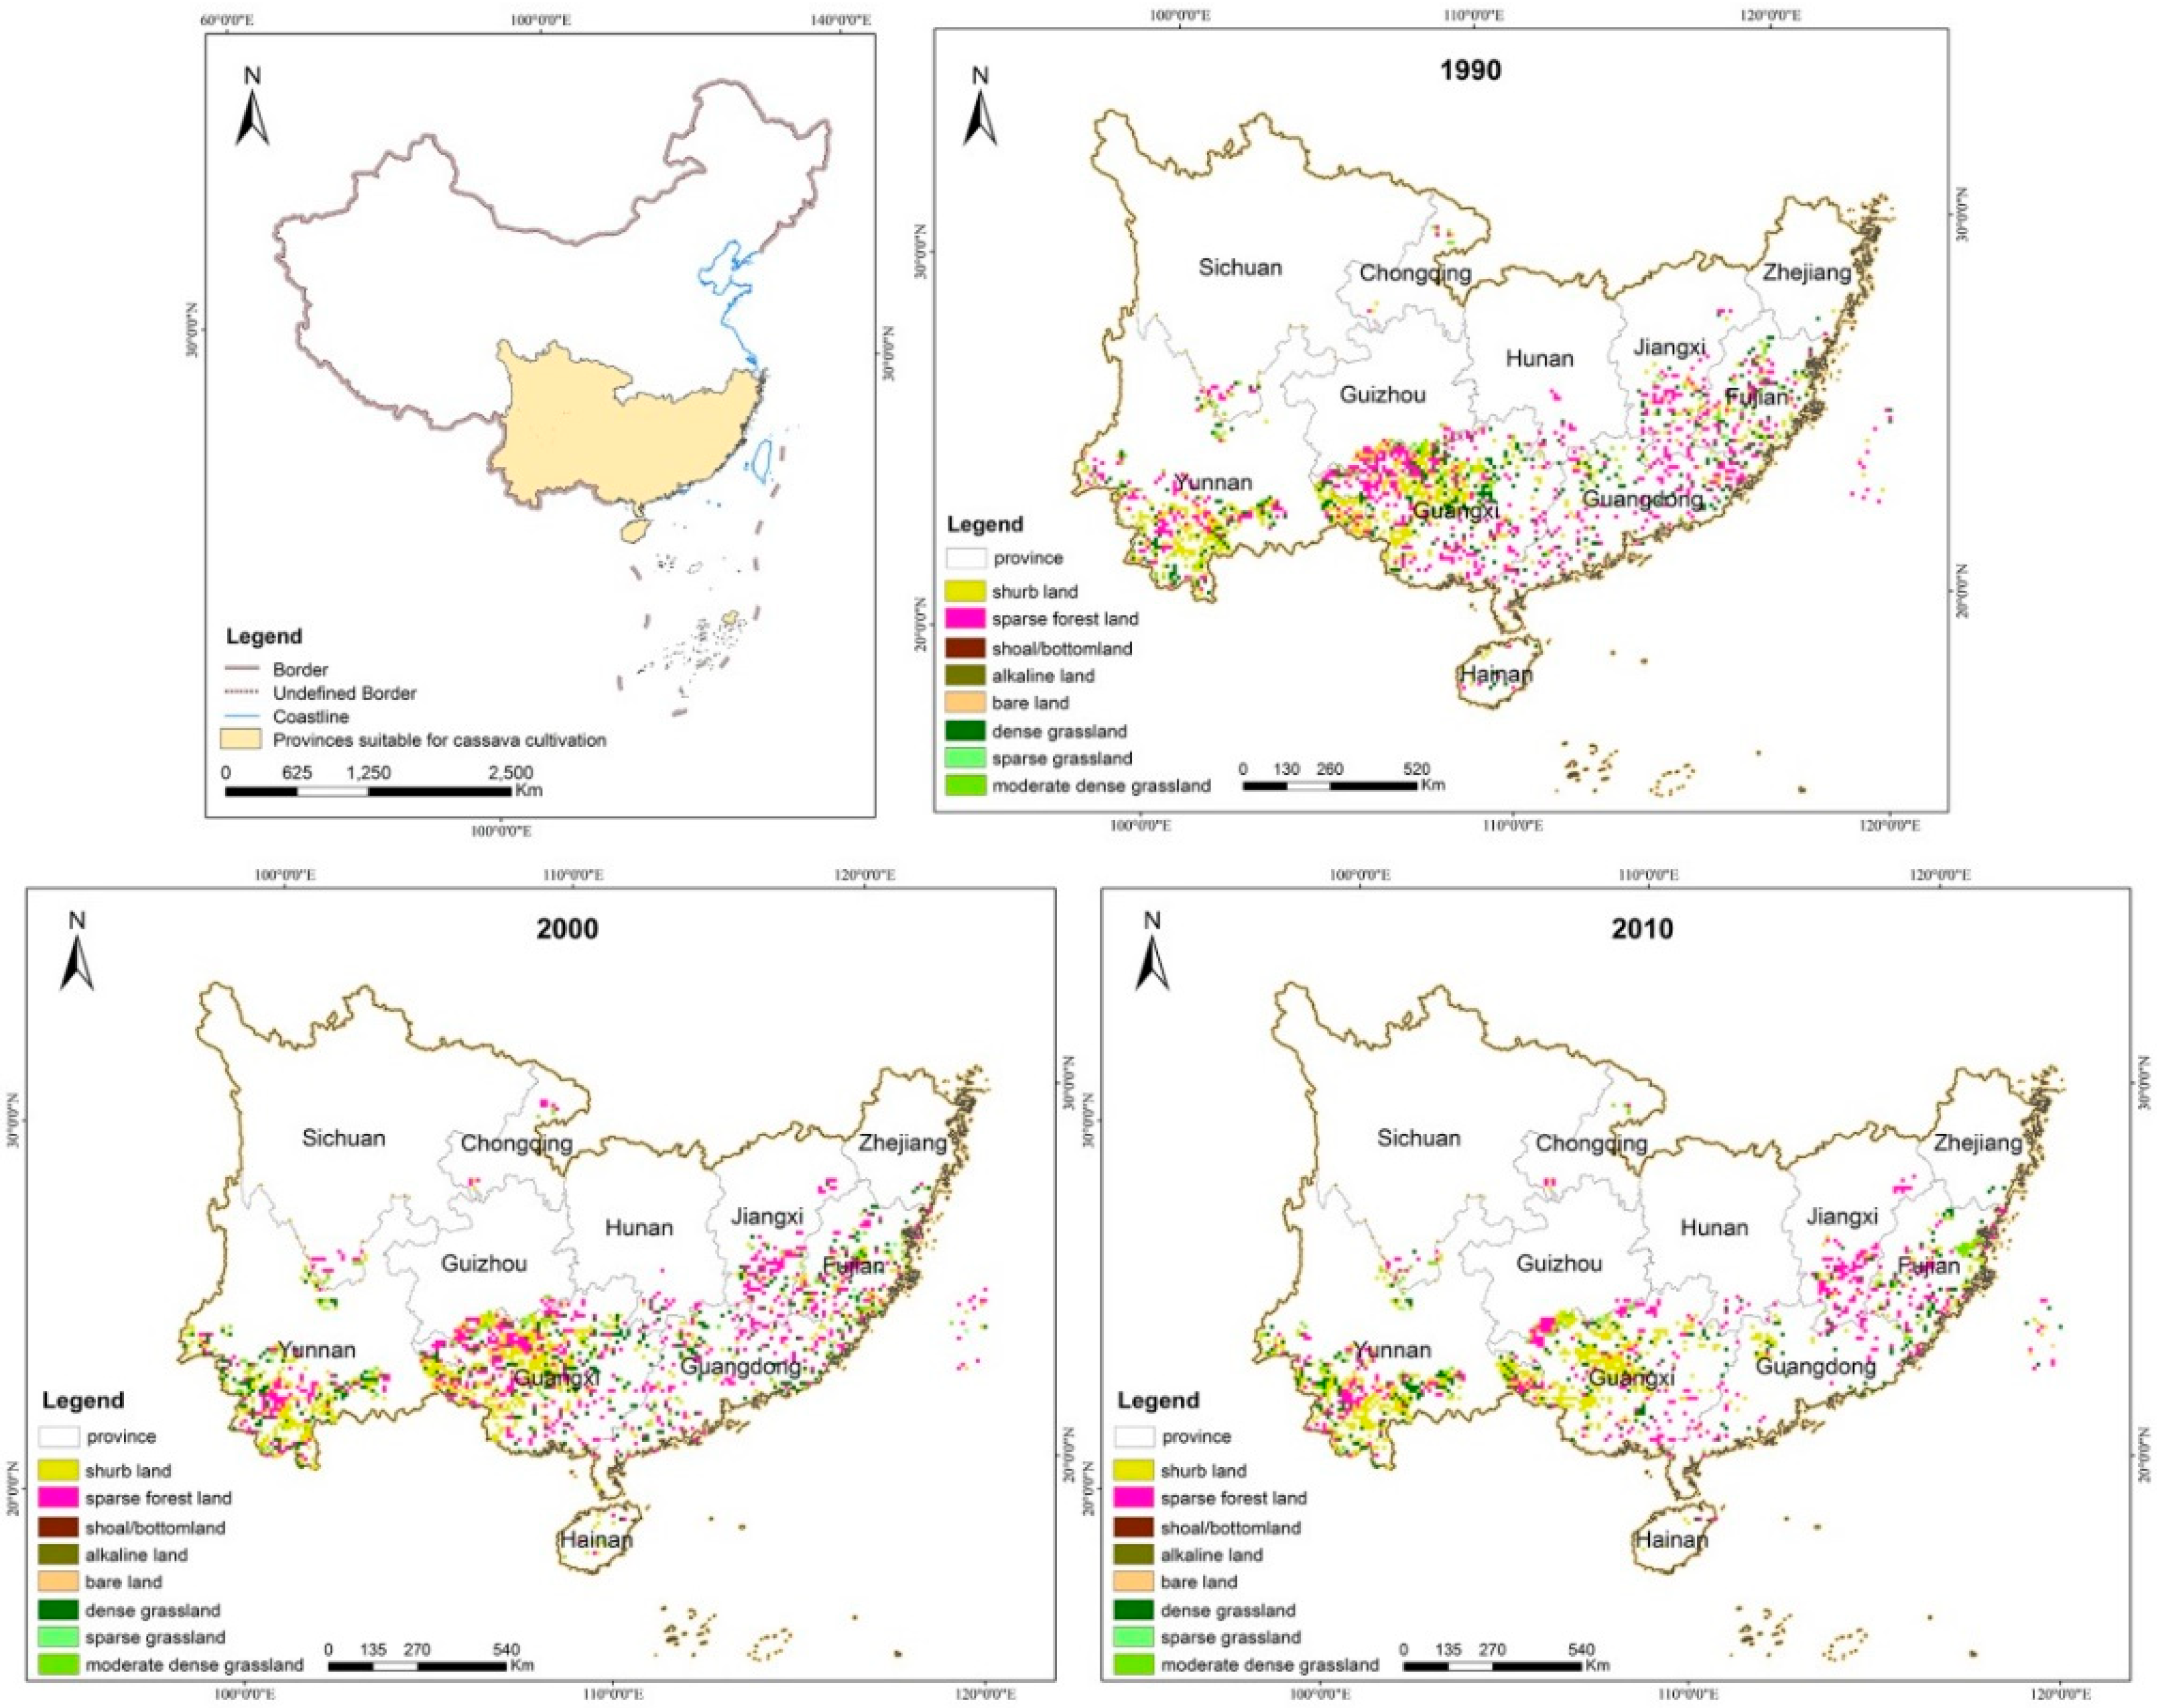
2.1. Land Resources Suitable for Cassava

The land resources suitable for cassava were extracted with no adverse effects on food production and water security. First, for the purpose of enhancing food security, the marginal land that was not suitable for food production was used in this study [27,28]. According to the definition provided by the Ministry of Agriculture (MoA) of China, marginal land is winter-fallowed paddy land and wasteland that may be used to cultivate energy crops. The wasteland that was considered in this study included shrub land, sparse forest, grassland (dense grassland, moderate dense grassland and sparse grassland), shoal/bottomland, alkaline land, and bare land. The landuse data included the three periods (i.e., 1990, 2000 and 2010) that were used in this study; landuse data were developed by experts from the Data Centre for Resources and Environmental Sciences (RESDC) of the Chinese Academy of Sciences. Second, for the purpose of enhancing water security, the supply of local water resources was considered at the grid and basin scales. If the water consumption of cassava stressed local water resources, it was determined that the area was not suitable for the development of bioenergy from cassava. Detailed information about this procedure was described in our previous publication [25]. Third, the extraction of land resources should also consider the growth requirements of cassava, including temperature (e.g., 18 °C ≤ Annual average temperature ≤ 29 °C), precipitation (e.g., 600 °C ≤ Aprecipitation ≤ 6000 °C), soil (e.g., soil depth ≥ 30 mm; soil organic matter content ≥ 1.5%), topography (e.g., elevation < 2000 m; slope < 25°), and so on [15]. In addition, the Natural Forest Conservation Program (NFCP), the Grain-to-Green Program (GTGP), the overall planning of the protection and construction of grassland use, and other, related policies were also considered.
The land resources that satisfied all types of conditions were extracted for the development of bioenergy from cassava with the “Superposition Analysis” and “Raster Calculator” tools in the ArcGIS software (https://www.esri.com/zh-cn/home) [23,29].

2.2. Long-Term Climate Data Sequence

To reflect climate change from 1990 to 2010, climatic indexes, including monthly average maximum temperature (Tmax), monthly average minimum temperature (Tmin), annual precipitation (Prec), and average annual precipitation days (Pred), were obtained. First, the daily climatic indexes from 824 meteorological stations in China from 1990 to 2010 were extracted from the China Meteorological Data Service Center (CMDC). Second, the monthly climate data were calculated based on the daily climate data from each meteorological station. Third, the spatial scales of the climate data were obtained using climate data at the station scale with ANUSPLIN, which is a professional weather interpolation software (http://fennerschool.anu.edu.au/research/products/anusplin-vrsn-44) [30,31].

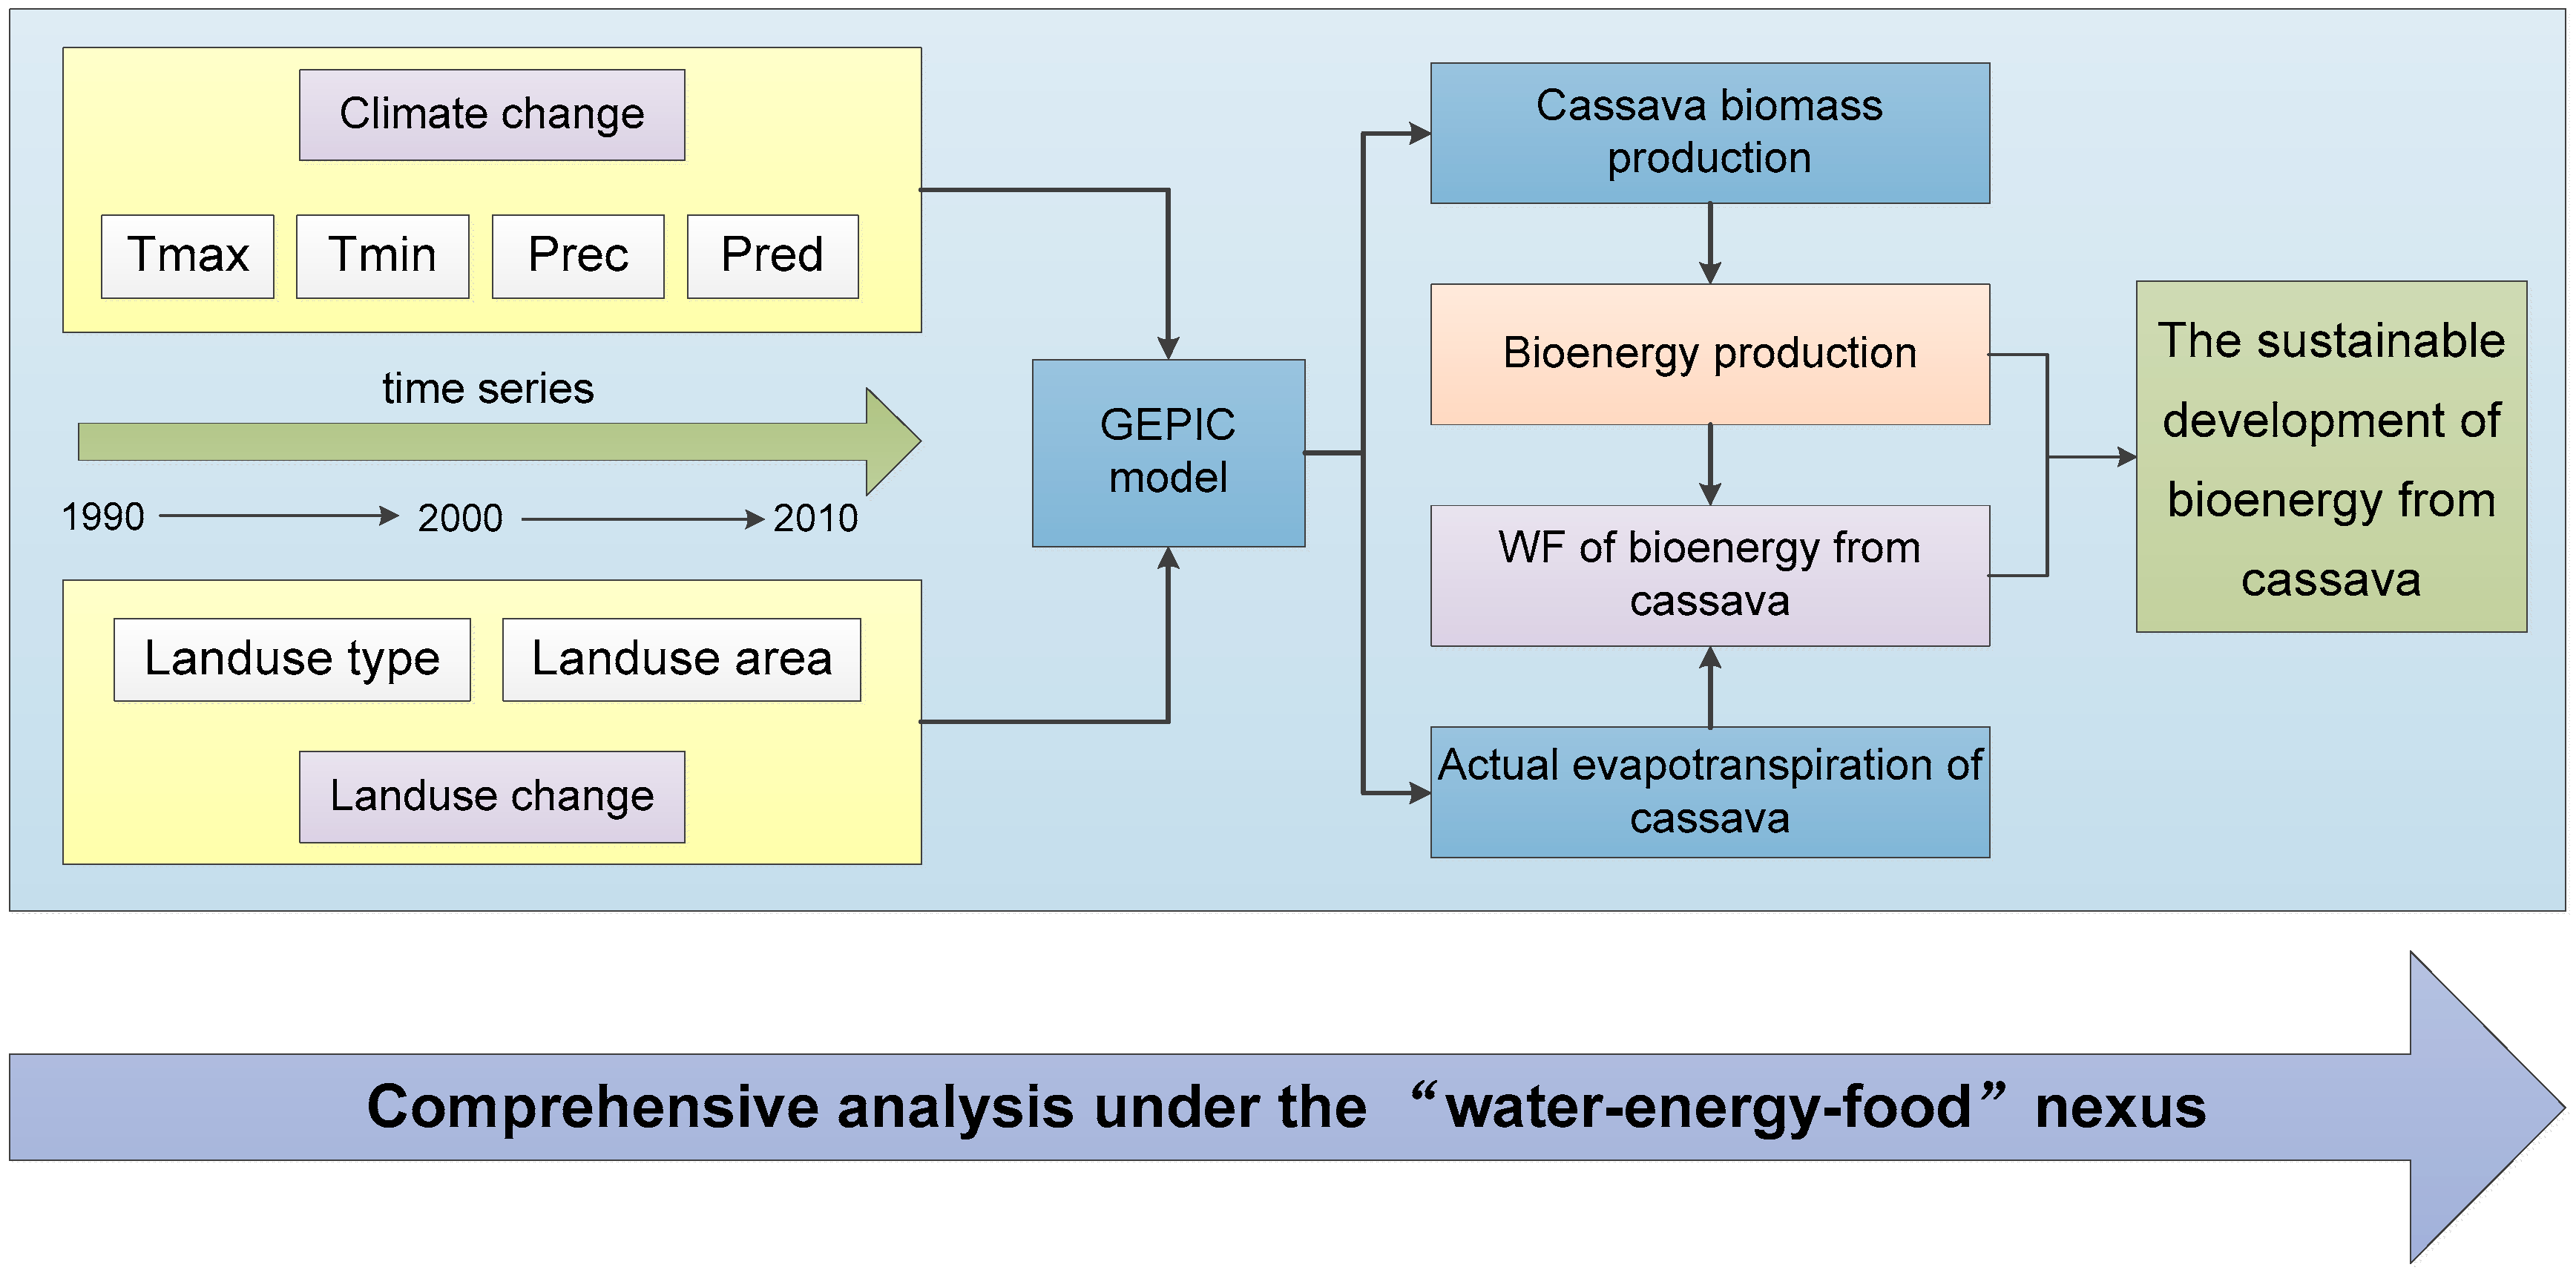
2.3. Biogeochemical Process Model

To simulate the growth of cassava, the GIS-based Environmental Policy Integrated Climate Model (GEPIC), i.e., one of the biogeochemical process models, was adopted because it has several advantages, such as its high-precision simulations of crop yield, relatively minimal input data requirements, and wide use [32,33]. GEPIC is a GIS-based crop growth model that integrates a biophysical environmental policy integrated climate (EPIC) model with GIS to simulate the spatial and temporal dynamics of the major processes related to the soil-crop-atmosphere management system [34,35]. The input data for the GEPIC model include land-use data, climate data, soil data, terrain data, and field management data [15,36]. The climate data are the monthly long-term climate data sequences from 1990 to 2010. The landuse data for the GEPIC model are the marginal lands that were suitable for cassava in 1990, 2000, and 2010. The other data for the GEPIC model were introduced in our previous publication [15]. Before the model simulation, model parameter localization and model validation were needed. For more information, details were also introduced in our previous publication [15].

2.4. Calculation of Bioenergy and Water Footprint

To calculate the bioenergy and the water footprint of bioenergy, the GEPIC model was used to simulate the biomass production and the actual evapotranspiration that occurred during the cassava growing season. The spatial distribution of the potential bioenergy from cassava was calculated using the biomass production and the conversion coefficient of cassava biomass to bioenergy, which has a value of 13.49 MJ/kg [15,37]. The simulation of biomass production was performed in these three steps: (1) calculation of the potential daily increase in biomass, (2) calculation of the actual daily increase in biomass, (3) calculation of the sum of actual daily increase in biomass. The main equations were as follows:
Δ B p j = 0.001 ( B E j ) ( P A R i )
Δ B j = ( Δ B p j ) ( R E G )
B j = Δ B j
In Equation (1), Δ B p j is the potential biomass increase of the crop on day i (t/ha); B E j is the biomass-energy ratio, which indicates the energy conversion to biomass (kg·m2/ha·MJ); P A R i is intercepted photosynthetically active radiation (MJ/(m2·day)). In Equation (2), Δ B j is the actual increase in biomass of crop j on day i (t/ha); R E G is the minimum value of the crop stress factor; for example, the temperature stress factor, water stress factor, nitrogen stress factor, etc. B j is the actual biomass production (t/ha).
From the respective of the life cycle of cassava bioenergy, the water demand mainly comes from the consumption of water during the cassava cultivation stage. In contrast, the water used during the other stages accounts for less than 1% of the total water consumption [38,39]. Therefore, the consumption of water during the cassava cultivation stage was calculated as the total water consumption of bioenergy from cassava, which is the actual evapotranspiration that occurs during the growth of cassava. The water footprint of a product is an indicator of freshwater consumption that takes into account both the direct and indirect uses measured over the full supply chain. This indicator comprises blue (surface or groundwater), green (precipitation), and gray (pollution) water footprints [40,41]. For the assessment of water footprint of bioenergy from cassava, since only actual evapotranspiration was considered, the green water footprint was calculated in this study using the following formula [42]:
W F = 10 × A E T Y b i o m a s s × C
where W F is the water footprint in m3/GJ, and A E T is the actual evapotranspiration during the growth of cassava in mm. Y b i o m a s s is the spatial distribution of biomass production, and C is the conversion coefficient of cassava biomass to bioenergy.

3. Results

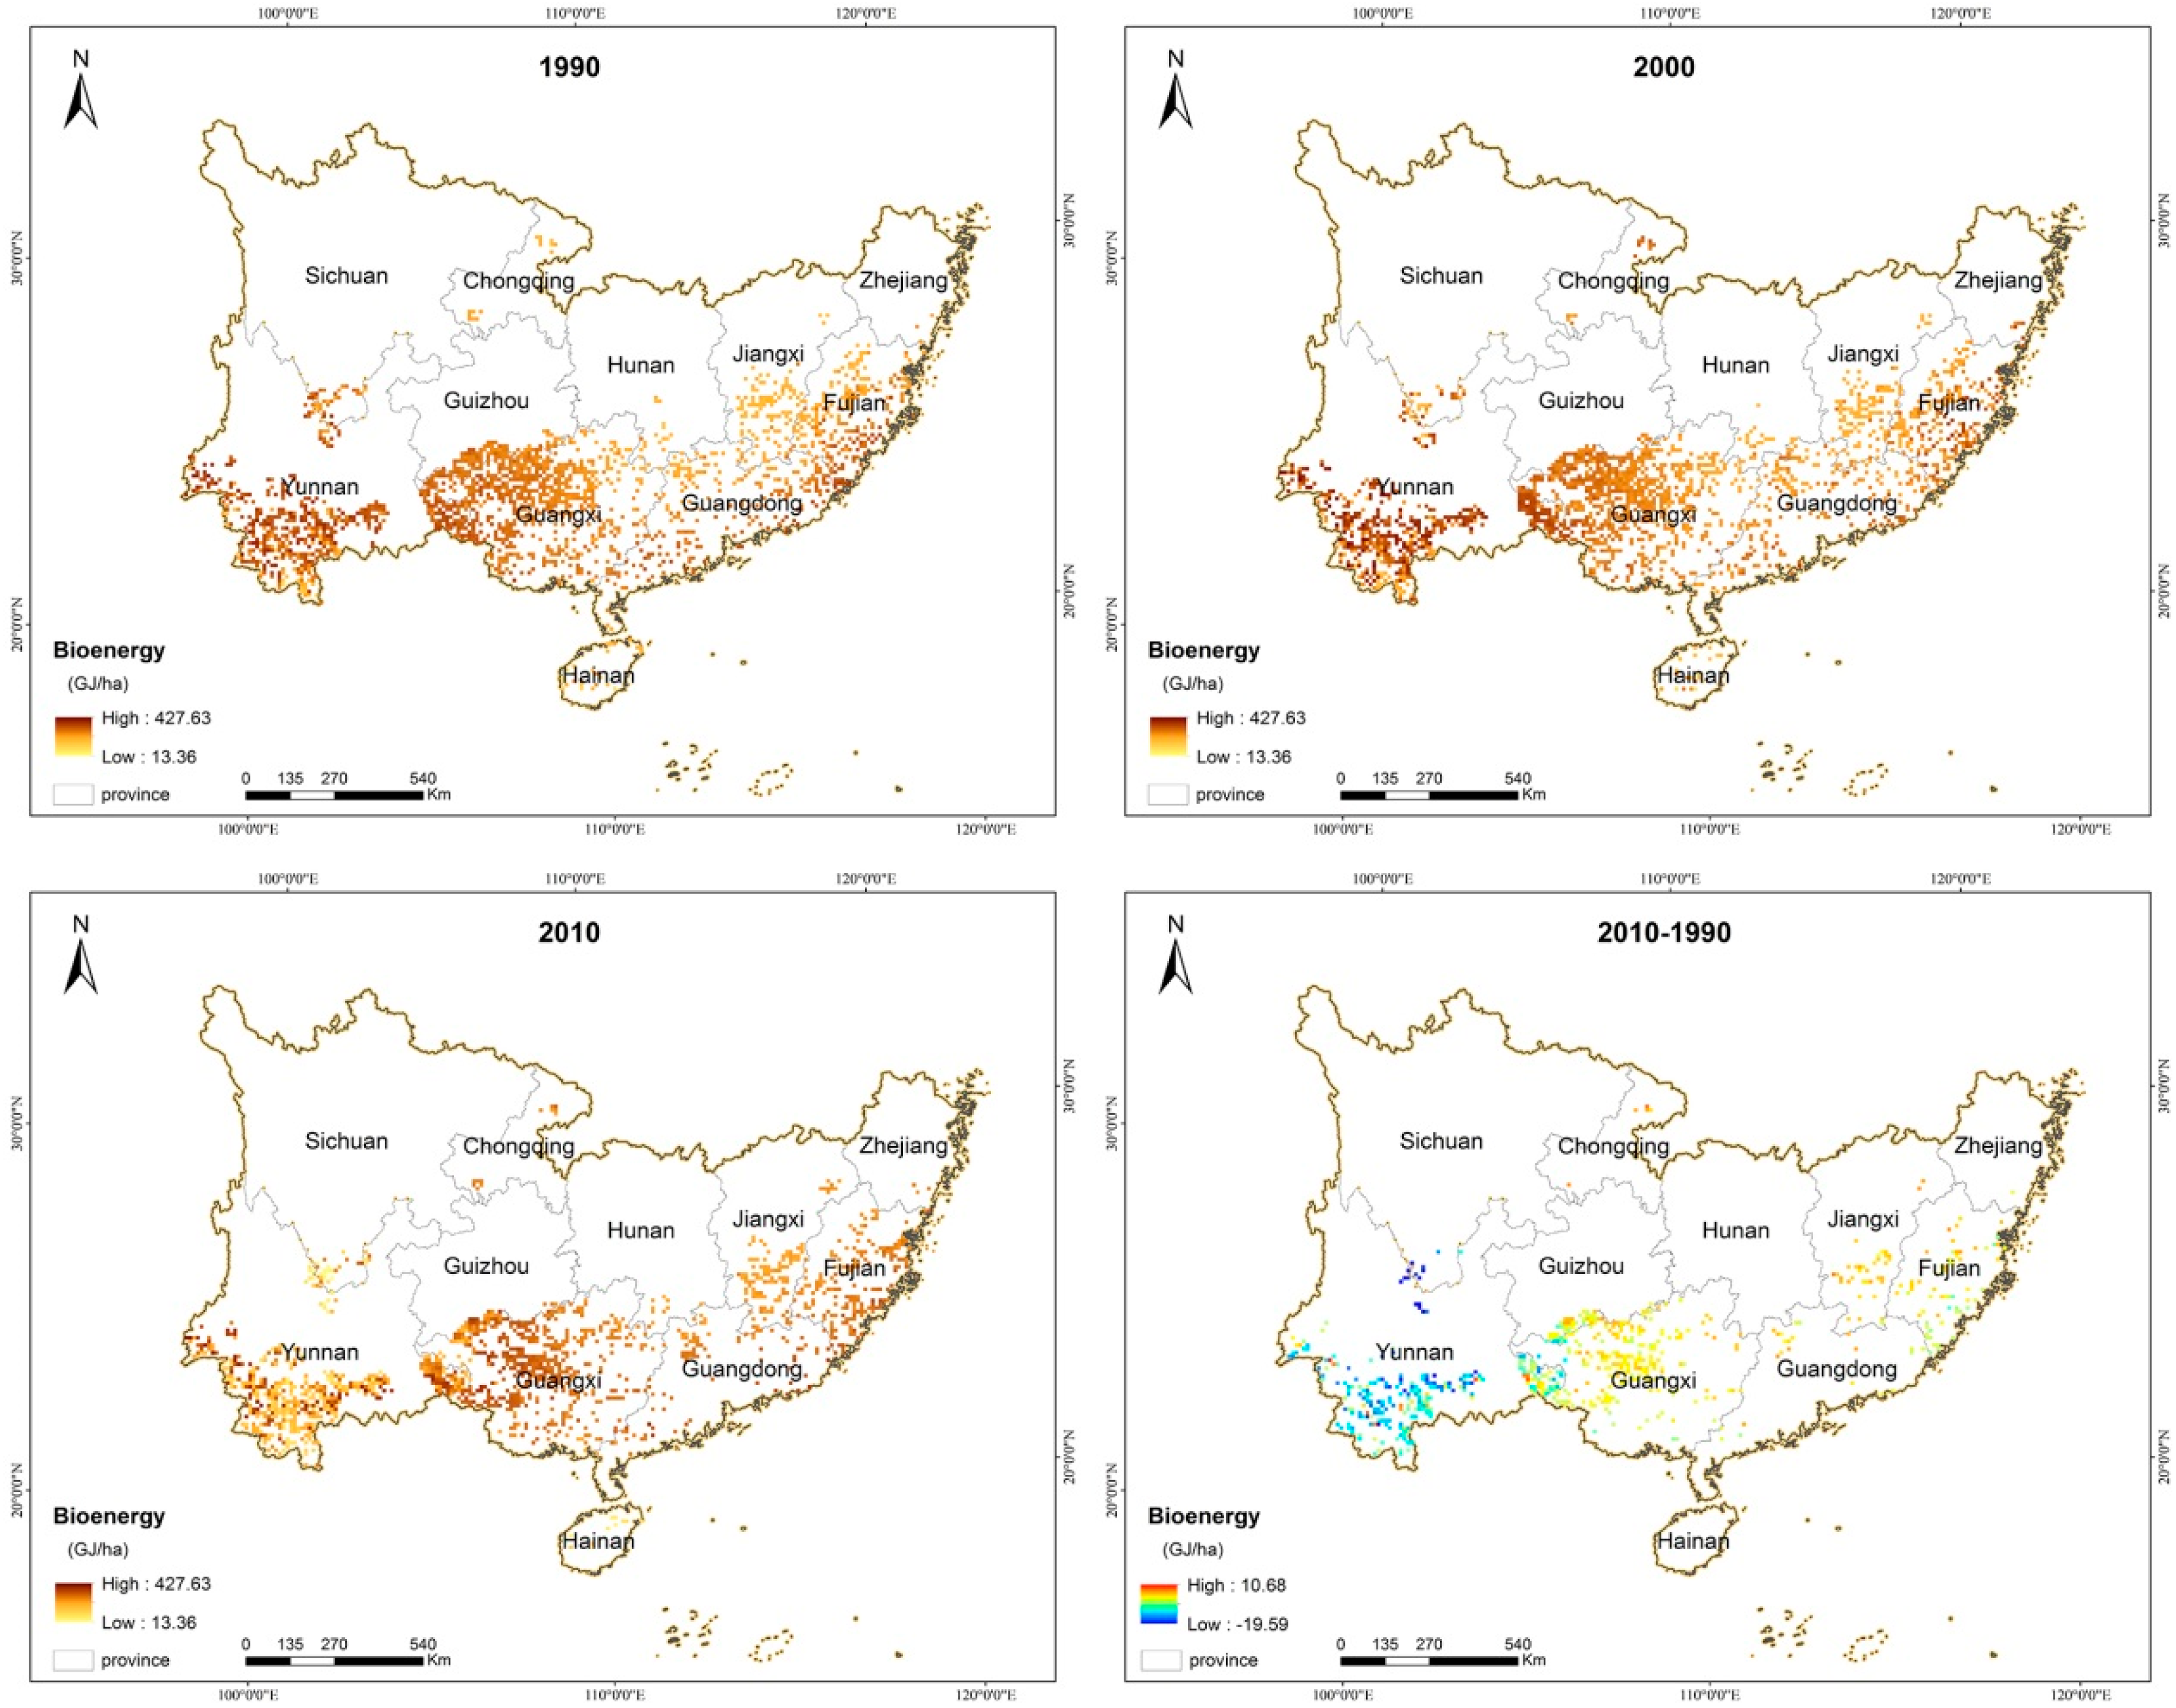
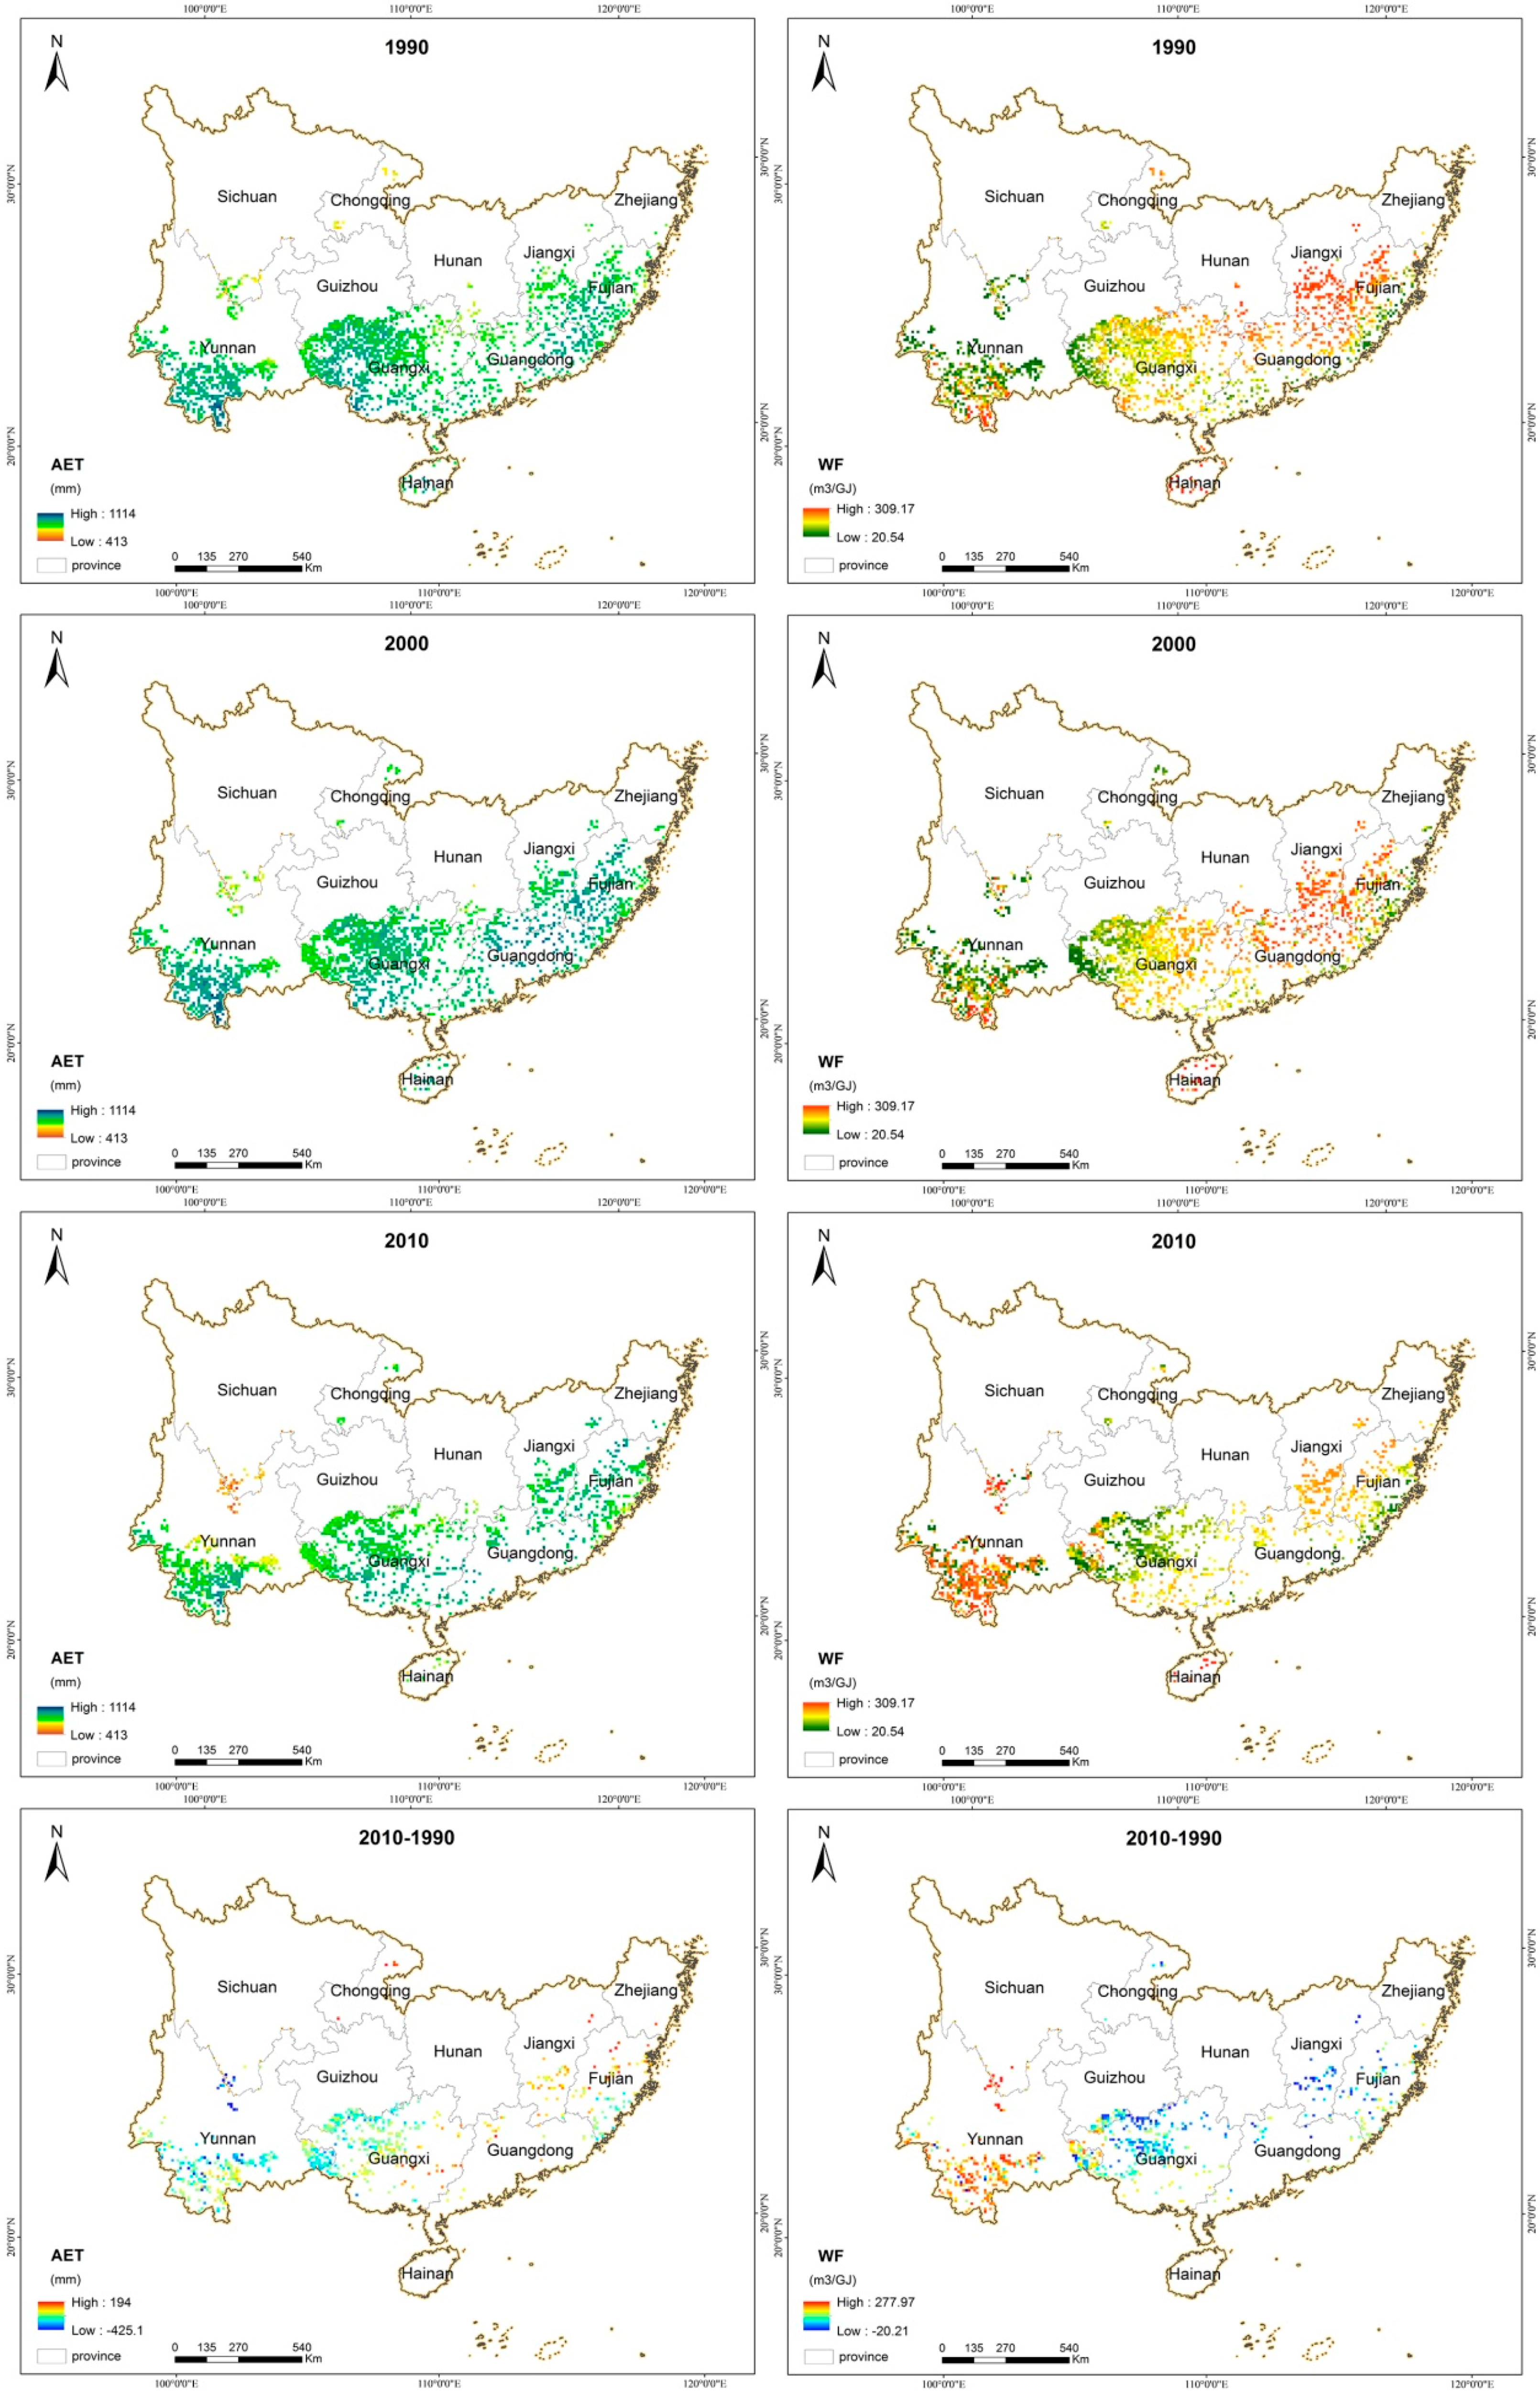
3.1. Spatial-Temporal Variation in Potential Bioenergy from Cassava

According to the method described above, the potential bioenergy production was obtained for each year using the biogeochemical process model shown in Figure 2. The land resources suitable for cassava were mainly distributed in southern China, which contains 11 provinces (see Figure 3). To allow readers to understand them clearly, only these 11 provinces were shown in the figure.
Figure 2 shows that the land resources suitable for cassava were mainly distributed in southern China. From the perspective of spatial distribution, there were significant spatial differences in the potential bioenergy production from cassava. From the east to the west of these 11 provinces that were suitable for cassava planting, there was a tendency for the bioenergy production per ha to first decrease and then increase. In addition, bioenergy production also had significant differences over time. In the eastern region, including Sichuan and Yunnan, the bioenergy production per ha was significantly reduced in 2010. However, the bioenergy production in the central region has been gradually increasing. The main reasons for this phenomenon were the climatic conditions and soil conditions in different regions.
The ArcGIS software was used to calculate the average bioenergy production per ha in each province to quantitatively analyze the changes in bioenergy production per ha. In addition, the total bioenergy production in each province was also calculated with the inclusion of landuse changes and changes in bioenergy production per ha. The results are shown in Table 1.
From the perspective of bioenergy production per ha, Table 1 shows that the average potential bioenergy production per ha for the 11 provinces had an initial increasing trend that was followed by a decreasing trend. The decline in the average bioenergy production per ha observed in 2010 was mainly due to the decline in the bioenergy production per ha that occurred in Hainan, Yunnan, and Sichuan. The most suitable annual precipitation for cassava growth was 1000 mm–2000 mm. As discussed in Section 3.2, the annual precipitation in each province showed a declining trend over the 20-year period. Of these 11 provinces, Yunnan and Sichuan had the least annual precipitation. With the decrease in precipitation, the average precipitation in 2010 was less than 1000 mm, which does not meet the water demand required for cassava growth. Therefore, the average bioenergy production per ha declined significantly in Yunnan and Sichuan. Although the average precipitation in 2000–2010 in Yunnan decreased compared with that in 1990–2000, the precipitation in Yunnan changed drastically from 2000 to 2010, showing an initial decreasing trend that was followed by an increasing trend. In 2010, the average precipitation reached 2300 mm, which was more than 1000 mm in the year that had the least annual precipitation. Extreme precipitation was the main factor driving the decline in bioenergy production per ha in Hainan. With the exceptions of Hainan, Yunnan, and Sichuan, the bioenergy production per ha in the other provinces experienced little change. From 1990 to 2010, the potential bioenergy production per ha increased in most of the 11 provinces. The province that had the largest increase in potential bioenergy production per ha was Chongqing, with an increase of 64.10 GJ/ha. Chongqing was followed by Jiangxi, Zhejiang, and Hunan, which had increases of 43.42 GJ/ha, 40.17 GJ/ha and 37.18 GJ/ha, respectively. The increase in the potential bioenergy production per ha in the remaining provinces was less than 30 GJ/ha. By comparing the bioenergy production per ha with the climate change in each province, we can see that when the precipitation was suitable, the increased temperature will increase the yield of cassava, and thus, this will increase the potential bioenergy production per ha.
From the perspective of the total bioenergy production in each province, Table 1 shows that Guangxi and Yunnan were the two provinces that had the largest potential for developing cassava bioenergy, with potential bioenergy production of 1508 PJ and 1328 PJ in 2010, respectively, which accounted for 34.29% and 30.19% of the total bioenergy production in China in 2010. Table 1 also shows that total bioenergy production in China continued to decline. The potential bioenergy production in China in 1990, 2000, and 2010 was 6075 PJ, 5974 PJ, and 4399 PJ, respectively. Compared to 1990, bioenergy production in 2010 declined by 1676.40 million GJ, which accounted for 27.59% of the value in 1990. As discussed in Section 3.2, due to the reduction of land resources suitable for cassava, the total bioenergy production in each province is reduced even if the potential bioenergy production per ha increased. The province with the largest reduction in the potential bioenergy production was Yunnan, with a reduction of 519 PJ. Yunnan was followed by Guangxi and Guangdong, which had reductions of 582 PJ and 377 PJ, respectively. Reductions in the other provinces were less than 100 PJ. Due to the large increase in the potential bioenergy production per ha in Jiangxi, Zhejiang, and Chongqing, as well as the small changes in the area of marginal lands suitable for cassava, the total bioenergy production in these three regions increased.

3.2. Analysis of the Driving Forces of Bioenergy Change

The main reason for the change in the potential bioenergy production from cassava was caused by landuse change and climate change. Climate change affects the cassava yield per ha, which in turn, affects the bioenergy production per ha. Landuse change affects the land resources that were suitable for cassava cultivation, which in turn, affects the total potential bioenergy production. Therefore, the impacts of landuse change and climate change on bioenergy from cassava have been estimated below.

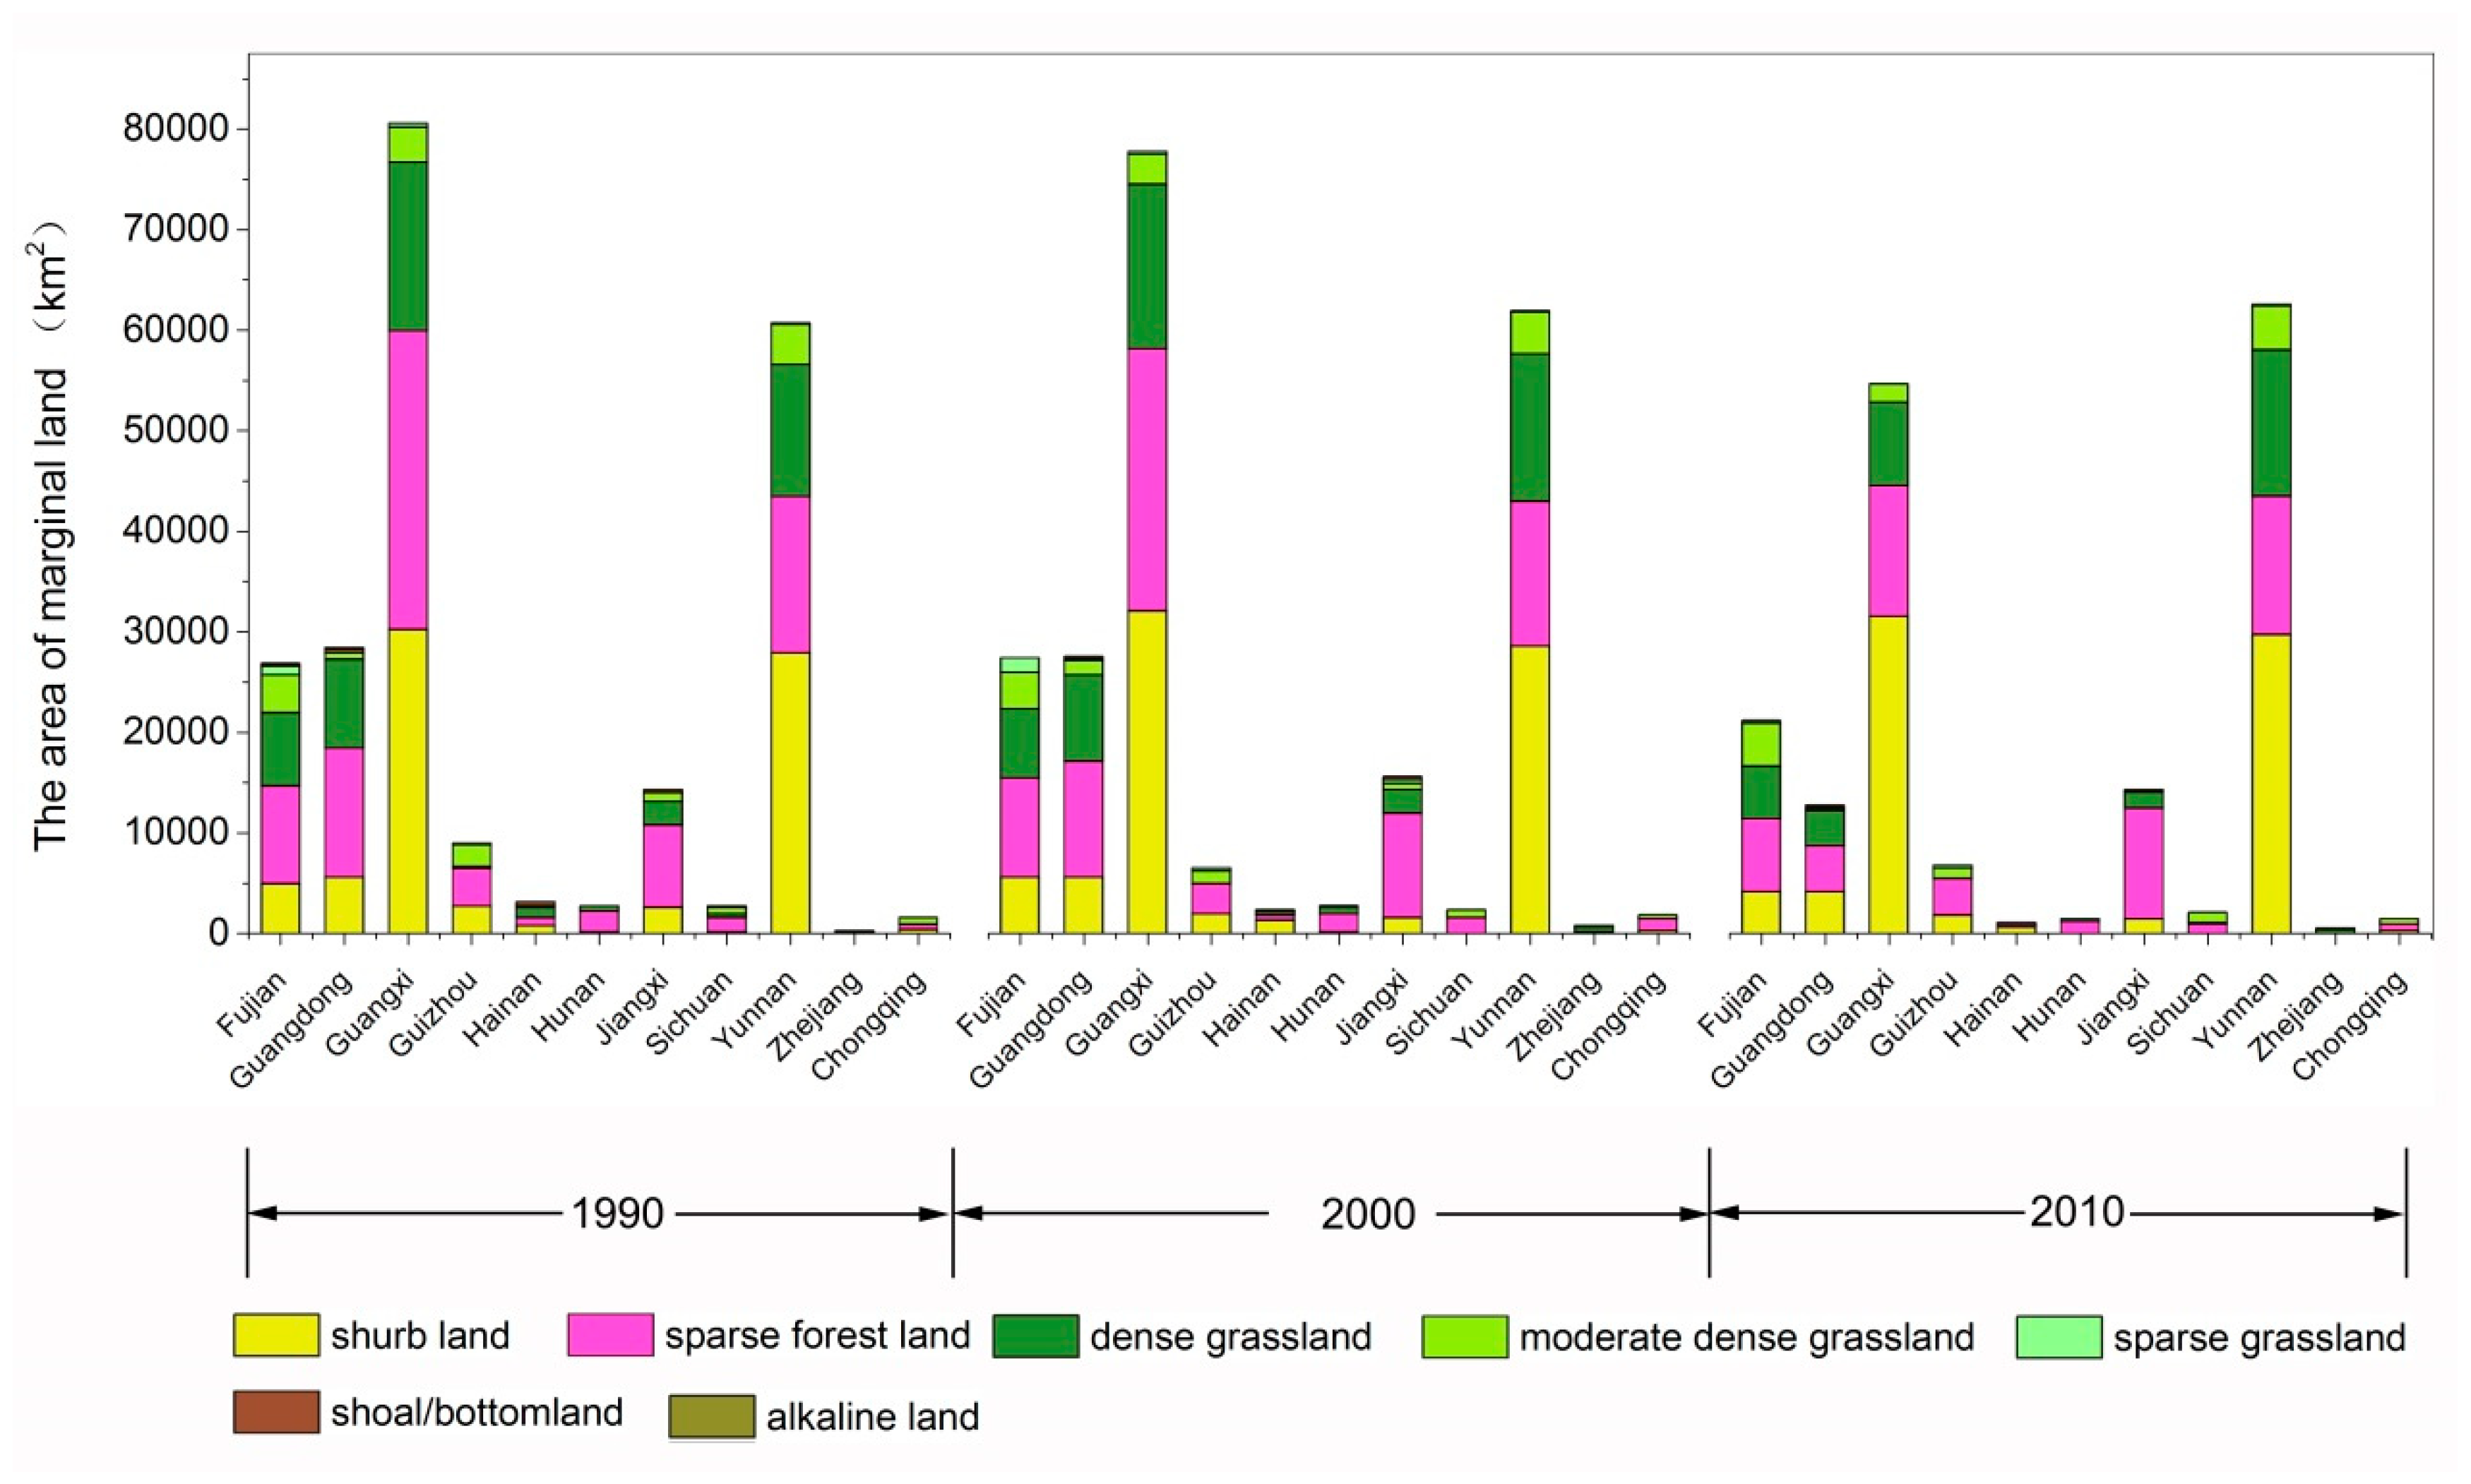
3.2.1. Impact of Landuse Change on Bioenergy Produced from Cassava

According to the landuse datasets and the method described above, the spatial distributions of the land resources that were suitable for cassava from 1990 to 2010 were obtained. The result is shown in Figure 3.
Figure 3 shows that the land resources that were suitable for cassava were mainly distributed in southern China, which contains 11 provinces. In addition, the land resources that were suitable for cassava mainly consisted of shrub land and sparse forest. The spatial distribution of the land resources that were suitable for cassava has changed significantly since 1990. The land resources that are suitable for cassava also decreased as a whole, especially for the period from 2000 to 2010. To quantitatively analyze the changes in the land resources that were suitable for cassava, the area of land resources was calculated in each province. The result is shown in Figure 4.
The area of land resources that were suitable for cassava in 1990, 2000, and 2010 was 23.02 million ha, 22.66 million ha, and 17.86 million ha, respectively. During this 20-year period, the area of land resources that were suitable for cassava declined by 5.16 million ha, accounting for 22.40% of the land resources that were suitable for cassava in 1990. The area of each type of land resource that was suitable for cassava has decreased since 1990. Among them, the area with the largest reduction was sparse forest, which was reduced by 2.84 million ha, which accounts for 33.56% of the total area of sparse forest in 1990. During this 20-year period, the area of dense grassland has been reduced by 1.65 million ha, which accounts for 32.62% of the total area of sparse forest in 1990. The areas of the remaining types of marginal land were reduced by less than 1 million ha. The area of alkaline land in 1990 was 0.013 million ha; however, no alkaline land existed in 2000 and 2010. The reasons for the reduction in land resources suitable for cassava were mainly due to urbanization [43]. Since the urbanization rate during 2000–2010 was higher than that of 1990–2000, the reduction in land resources from 2000 to 2010 was relatively large.
Figure 4 also clearly shows that the land resources that were suitable for cassava were mainly distributed in Guangxi, Yunnan, Fujian, and Guangdong. As a result, Guangxi, Yunnan, Fujian, and Guangdong are rich in bioenergy. In 1990, the largest area of land resources that were suitable for cassava was in Guangxi, with an area of 8.06 million ha that accounted for 35% of the land resources that were suitable for cassava in 1990. However, by 2010, the area of land resources that were suitable for cassava in Guangxi was only 5.46 million ha, which represented a reduction of 2.60 million ha. Guangxi was the region with the largest reduction in area. Guangdong and Fujian provinces also had reductions in land resource areas of 1.57 million ha and 0.57 million ha, respectively. By 2010, Yunnan had the largest land resource area of 6.26 million ha, which accounted for 35.03% of the total area of marginal land that was suitable for cassava in 2010. The corresponding area in Guangxi and Fujian was 5.46 million ha and 2.12 million ha, respectively, accounting for 30.60% and 11.85% of the marginal land area in 2010. The remaining provinces represented less than 10% of the total area. Due to the reduction in land resources for cassava, the total bioenergy production in each province was reduced, even if the potential bioenergy production per ha increased.

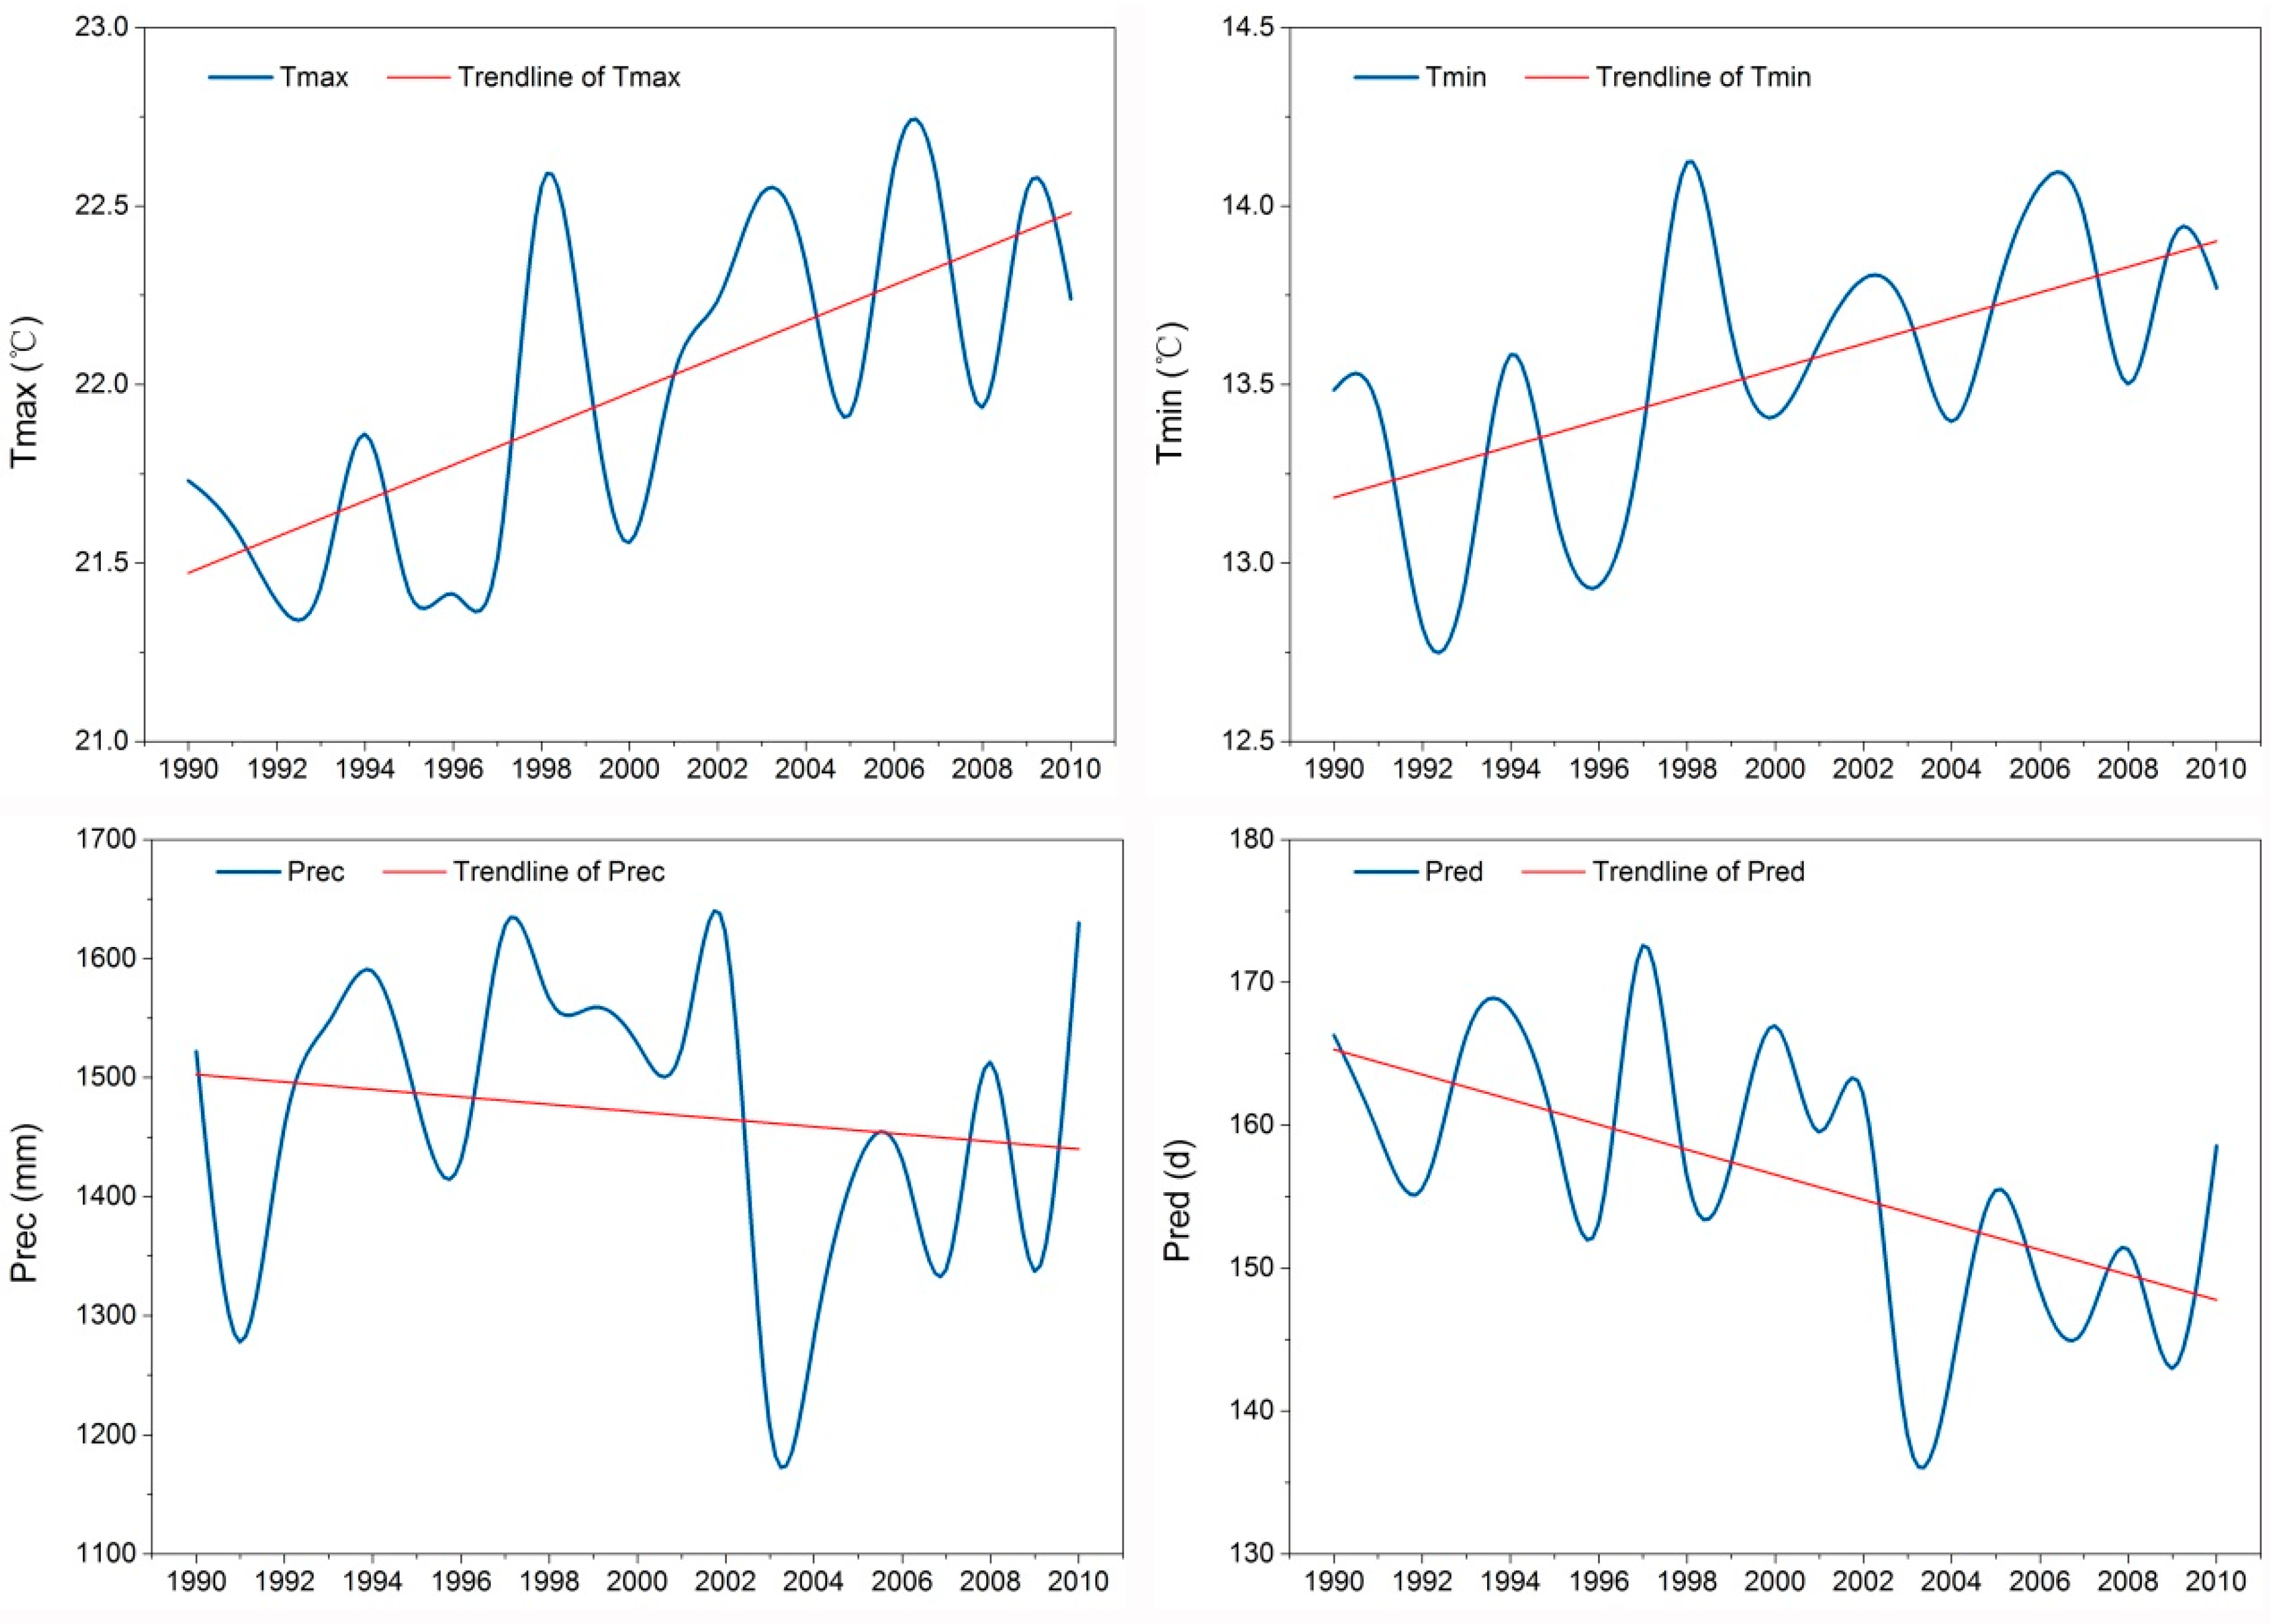
3.2.2. Impact of Climate Change on Bioenergy Produced from Cassava

To quantitatively analyze climate change from 1990 to 2010, the climatic indexes, including monthly average maximum temperature (Tmax), monthly average minimum temperature (Tmin), annual precipitation (Prec), and average annual precipitation days (Pred), were counted in that 11 provinces that were suitable for planting cassava; these values were obtained using the “spatial analysis” tool in the ArcGIS software, and were based on the monthly meteorological data. The results are shown in the Table 2.
To intuitively reflect the climate change in the period for 1990–2010, the climatic index curve and the trendline of climatic index were plotted, as shown in the Figure 5.
Table 2 shows that the temperature has shown an increasing trend over this 20-year period; furthermore, precipitation has shown a downward trend. The average Tmax for 2001–2010 in the provinces that were suitable for cassava cultivation was 22.29 °C, which was 0.6 °C higher than that of 1990–2000; additionally, the average Tmax for 1990–2010 was 21.69 °C. The average Tmin values for 1990–2000 and 2001–2010 in the provinces that were suitable for cassava cultivation were 13.36 °C and 13.75 °C, respectively. The average Tmin in 2001–2010 was 0.39 °C higher than that in 1990–2000. The average Prec for 2001–2010 in the provinces that were suitable for cassava cultivation was 1430.89 mm, which was 77.03 mm lower than that recorded for 1990–2000; additionally, the average Prec for 1990–2000 was 1507.92 mm. The average Pred values for 1990–2000 and 2001–2010 in the provinces that were suitable for cassava cultivation were 162 d and 151 d, respectively. The average Pred in 2001–2010 was 11 d less than that recorded for 1990–2000.
Table S1 shows that the climate changes in each province that was suitable for planting cassava were consistent with the average change. However, there were differences in the changes between each province. Zhejiang, Jiangxi, and Hunan had significant climate changes, and these are the neighboring provinces located to the north of the 11 provinces that were suitable for cassava cultivation. Climate change in Hainan was the smallest. Overall, the climate changes in these 11 provinces showed a gradual decrease from the north to the south.

3.3. Spatial-Temporal Variation in Water Footprint of Bioenergy from Cassava

Precipitation has a large impact on potential bioenergy production. Therefore, bioenergy and water are inextricably linked. In addition to considering landuse change and climate change, the future sustainable development of bioenergy must also consider the limitations in available water resources. Water has been identified as an emerging issue of concern in the area of bioenergy development, in terms of both its quantity and quality. Water availability will undoubtedly affect the extent to which bioenergy can contribute to the overall energy mix. Therefore, the water demand and water footprint for the development of bioenergy from cassava must be discussed. Based on the method described above, the results of the water demand and water footprint of bioenergy from cassava are shown in Figure 6.
Figure 6 shows that the water consumption of bioenergy from cassava ranged from 413 mm to 1114 mm under current climate conditions. There was an obvious spatial difference in the water consumption of bioenergy production from cassava. Overall, the water requirement of bioenergy gradually increased from the north to the south. From a temporal point of view, the water requirement gradually decreased from 1990 to 2010, as shown in Figure 6. Based on the spatial distributions of the water consumption of bioenergy and bioenergy production, the spatial distribution of the water footprint was obtained. Figure 6 showed that the water footprint of bioenergy in the eastern region was higher than that in the western region in 1990. However, in contrast to the results from 1990, the water footprint in the western region was higher than that in the eastern region in 2010. The water footprint of bioenergy was calculated in each province, and the results are shown in Table 3.
Table 3 shows that the average water footprint of bioenergy from cassava has gradually increased. The average water footprint was 36.64 m3/GJ, 36.86 m3/GJ and 48.23 m3/GJ in 1990, 2000, and 2010, respectively. This means that producing the same quantity and quality of bioenergy requires more water resources. For example, the potential bioenergy production in 2010 was 4399 PJ, and 0.21 million m3 of water was needed. To produce the same amount of bioenergy in 2000 and 1990, 0.162 million m3 and 0.161 million m3 of water was needed, respectively. The reason for the significant increase in the average water footprint in 2010 was the increase in the water footprints in Sichuan, Hainan, and Yunnan. The main reason for the significant increase in the water footprints in these three regions was due to the decline in the bioenergy production that was caused by climate anomalies; as a result, the water footprints increased.
From 1990 to 2010, the water footprint varied among provinces. The water footprints of Fujian, Guangdong, Guangxi, and Guizhou showed a trend of an initial increase followed by a decrease. The water footprints of Yunnan, Zhejiang, and Chongqing showed a trend of an initial decrease followed by an increase. The water footprints of Hainan and Sichuan showed an increasing trend, and the water footprints of Hunan and Jiangxi showed a continuously decreasing trend. From the perspective of spatial differences, the water footprints of Guangxi, Guizhou, and Chongqing, i.e., the adjacent regions, were relatively low. Therefore, after considering landuse change, climate change, and water resource constraints, it was concluded that Guangxi was the most suitable place for the development of cassava bioenergy, followed by Fujian, Guangdong, and Yunnan.

4. Discussion

The total energy consumption in 1990, 2000, and 2010 was 987.03 million tons of standard coal, 1469.64 million tons of standard coal and 3606.48 million tons of standard coal, respectively [44], which was equivalent to 28,890 PJ, 43,016 PJ, and 105,562 PJ, respectively. The potential bioenergy production of cassava in 1990, 2000, and 2010 was 6075 PJ, 5974 PJ and 4399 PJ, respectively, which accounted for 21.03%, 13.89% and 4.17% of the total energy consumption in 1990, 2000, and 2010, respectively. With the increasing process of urbanization, the influence of climate anomalies, and the increase in energy consumption, the proportion of bioenergy in energy consumption is declining. However, from the perspective of sustainable development, bioenergy is still a very promising form of renewable energy.
Although the potential bioenergy of cassava was huge, the development and utilization of biomass energy in China is very low. Bioenergy production in China in 2010 was 59 PJ according to the “BP Statistical Review of World Energy” [12], accounting for 1.3% of potential bioenergy in 2010. Fortunately, the Chinese government has attached great importance to the development of biomass energy. The “13th Five-Year Plan for Renewable Energy Development” which was released by Chinese government sets the target for the production of bioliquid fuels at 4 million tons of biofuel ethanol and 2 million tons of biodiesel in 2020, which equal 199 PJ.
Landuse change and climate change are the two main factors that will affect the future development of bioenergy from cassava. The results showed that with the intensification of urbanization, fewer land resources were available. On the other hand, climate change had a direct impact on cassava yield. In the case of stable precipitation, a slight increase in temperature would increase cassava yield, which would in turn increase the production of bioenergy. However, increased temperature will cause a series of ecological and environmental issues [45,46]. The stated aim of the 2015 UNFCCC Paris Agreement is to limit the increase in the global average temperature to well below 2 °C above preindustrial levels, and to pursue efforts to limit temperature increases to 1.5 °C [47,48]. Therefore, the increase in production caused by the increase in temperature was not a very significant phenomenon. In addition, precipitation had a greater impact on cassava bioenergy production, and extreme rainfall can cause a sudden decline in production. In general, changes in landuse and climate will result in less potential for bioenergy development. Thus, it is necessary to develop new technologies that increase the production of bioenergy.
There are a lot of uncertainties in this study. Cassava bioenergy potential is calculated under ideal conditions. In fact, there will be depletion in the conversion of cassava bioenergy. Technological innovation also affects the potential of bioenergy. When calculating the water footprint of bioenergy from cassava, only the water consumption for cassava growth was considered, the water demand in other stages were not included. In addition to the uncertainties caused by human intervention, there are uncertainties in the process of model simulation. Due to the complexity of the GEPIC model and the numerous parameters in the model, coupled with the defects of the model structure and the variability of the parameters, there are uncertainties in the simulation results.

5. Conclusions

The sustainable development of bioenergy from cassava within the “water-energy-food” nexus, which considered landuse change and climate change, was assessed. First, the land resources that were suitable for cassava in different periods were extracted considering the food security and the water security. Next, the spatial distributions of the potential bioenergy produced from cassava in different years were simulated using a biogeochemical process model. Third, the driving factors of the potential bioenergy produced from changes in cassava were analyzed from the perspectives of landuse change and climate change. Finally, the change in the water footprint of bioenergy produced from cassava was discussed. In addition, the most suitable areas for the development of cassava were identified after considering landuse change, climate change and water footprint change. The results showed that the land resources that were suitable for the development of cassava bioenergy have continuously decreased since 1990. At the same time, the climate has also undergone significant changes. The temperature has shown an increasing trend over this 20-year period, and precipitation has shown a downward trend. Under the influence of both landuse change and climate change, the total biomass energy of cassava showed a downward trend. The potential bioenergy production in China in 1990, 2000, and 2010 was 6075 PJ, 5974 PJ, and 4399 PJ, respectively, equal to the 207, 203, and 150 million tons of standard coal, respectively. Compared to 1990, the bioenergy production in 2010 declined by 1676.40 million GJ, which accounted for 27.59% of the value observed in 1990. Considering landuse change, climate change and water resource constraints, it was concluded that Guangxi was the most suitable place for the development of cassava bioenergy, followed by Fujian, Guangdong and Yunnan. The results can determine the priority areas for development of cassava from the perspective of sustainable development, and provide a reference for China to develop a bioenergy development plan.
Since there are many uncertainties in the study, the next work should consider more factors which influence the sustainable development of cassava bioenergy, including the production technology of cassava to bioenergy, the energy benefit, GHG reduction benefit, and economic benefit in the life cycle process of cassava bioenergy. The landuse change caused by cassava cultivation should also be considered. In general, the life cycle assessment and the biogeochemical process model should be coupled to analyze the sustainable development of cassava bioenergy.

Supplementary Materials

The following are available online at https://www.mdpi.com/2071-1050/10/7/2153/s1, Table S1: The climate indexes for each province from 1990 to 2010.

Author Contributions

D.J. conceived and designed the survey; M.M.H. wrote the majority of the paper; S.C. contributed to data analysis; J.Y.F. and F.Y.D. provided some useful suggestions.

Acknowledgments

This research was funded by the Strategic Priority Research Program of the Chinese Academy of Sciences [XDA19040305], National Natural Science Foundation of China [Grant No. 41571509] and China Postdoctoral Science Foundation [2018T110134].

Conflicts of Interest

The authors declare no conflict of interest.

References

  1. Souza, G.M.; Ballester, M.V.R.; Cruz, C.H.D.B.; Chum, H.; Dale, B.; Dale, V.H.; Fernandes, E.C.M.; Foust, T.; Karp, A.; Lynd, L. The role of bioenergy in a climate-changing world. Environ. Dev. 2017, 23, 57–64. [Google Scholar] [CrossRef]
  2. Renewable Energy Policy Network for the 21st Century (REN21). Available online: http://www.Ren21.Net/status-of-renewables/global-status-report/ (accessed on 8 May 2018).
  3. Masera, O.R.; Bailis, R.; Drigo, R.; Ghilardi, A.; Ruiz-Mercado, I. Environmental Burden of Traditional Bioenergy Use. Annu. Rev. Environ. Resour. 2015, 40, 121–150. [Google Scholar] [CrossRef]
  4. Zhou, A.; Thomson, E. The development of biofuels in Asia. Appl. Energy 2009, 86, S11–S20. [Google Scholar] [CrossRef]
  5. Sahoo, P.K.; Das, L.M.; Babu, M.K.G.; Naik, S.N. Biodiesel development from high acid value polanga seed oil and performance evaluation in a CI engine. Fuel 2007, 86, 448–454. [Google Scholar] [CrossRef]
  6. Ahrens, T.; Drescherhartung, S.; Anne, O. Sustainability of future bioenergy production. Waste Manag. 2017, 67, 1–2. [Google Scholar] [CrossRef] [PubMed]
  7. Garcia, D.J.; You, F. The water-energy-food nexus and process systems engineering: A new focus. Comput. Chem. Eng. 2016, 91, 49–67. [Google Scholar] [CrossRef]
  8. Giupponi, C.; Gain, A.K. Integrated spatial assessment of the water, energy and food dimensions of the sustainable development goals. Reg. Environ. Chang. 2017, 17, 1881–1893. [Google Scholar] [CrossRef]
  9. Zhang, X.; Vesselinov, V.V. Integrated modeling approach for optimal management of water, energy and food security nexus. Adv. Water Resour. 2017, 101, 1–10. [Google Scholar] [CrossRef]
  10. López-Díaz, D.C.; Lira-Barragán, L.F.; Rubio-Castro, E.; Serna-González, M.; El-Halwagi, M.M.; Ponce-Ortega, J.M. Optimization of biofuels production via a water–energy–food nexus framework. Clean Technol. Environ. Policy 2017, 1–24. [Google Scholar] [CrossRef]
  11. Mirzabaev, A.; Guta, D.; Goedecke, J.; Gaur, V.; Börner, J.; Virchow, D.; Denich, M.; Braun, J.V. Bioenergy, food security and poverty reduction: Trade-offs and synergies along the water-energy-food security nexus. Soc. Sci. Electron. Publ. 2015, 40, 772–790. [Google Scholar] [CrossRef]
  12. BP. Available online: https://www.Bp.Com/ (accessed on 8 May 2018).
  13. Gosens, J.; Kåberger, T.; Wang, Y. China’s next renewable energy revolution: Goals and mechanisms in the 13th five year plan for energy. Energy Sci. Eng. 2017, 5, 141–155. [Google Scholar] [CrossRef]
  14. National Development and Reform Commission (NDRC) People’s Republic of China. Available online: http://en.Ndrc.Gov.Cn/ (accessed on 8 May 2018).
  15. Jiang, D.; Hao, M.M.; Fu, J.Y.; Huang, Y.H.; Liu, K.; Zhou, Y.; Kumar, L.; Mabee, W. Evaluating the bioenergy potential of cassava on marginal land using a biogeochemical process model in guangxi, china. J. Appl. Remote Sens. 2015, 9, 097699. [Google Scholar] [CrossRef]
  16. Zvinavashe, E.; Elbersen, H.W.; Slingerland, M.; Kolijn, S.; Sanders, J.P.M. Cassava for food and energy: Exploring potential benefits of processing of cassava into cassava flour and bioenergy at farmstead and community levels in rural mozambique. Biofuels Bioprod. Biorefin. 2015, 5, 151–164. [Google Scholar] [CrossRef]
  17. Ozoegwu, C.G.; Eze, C.; Onwosi, C.O.; Mgbemene, C.A.; Ozor, P.A. Biomass and bioenergy potential of cassava waste in nigeria: Estimations based partly on rural-level garri processing case studies. Renew. Sustain. Energy Rev. 2017, 72, 625–638. [Google Scholar] [CrossRef]
  18. Wang, F.; Zhuo, L.; Qin, X.D.; Li, S.Y.; Yang, Z.H.; Huang, H.J. Evaluation on suitability of planting potential of energy plants on marginal land of guangdong province. Trans. Chin. Soc. Agric. Eng. 2015, 31, 276–284. [Google Scholar]
  19. Chandra, V.V.; Hemstock, S.L. The potential of sugarcane bioenergy in fiji. Sugar Tech 2016, 18, 229–235. [Google Scholar] [CrossRef]
  20. Ziska, L.H.; Runion, G.B.; Tomecek, M.; Prior, S.A.; Torbet, H.A.; Sicher, R. An evaluation of cassava, sweet potato and field corn as potential carbohydrate sources for bioethanol production in alabama and maryland. Biomass Bioenergy 2009, 33, 1503–1508. [Google Scholar] [CrossRef]
  21. Wu, M.; Wang, M.; Hong, H. Fuel-Cycle Assessment of Selected Bioethanol Production; Argonne National Laboratory (ANL): Lemont, IL, USA, 2007. [Google Scholar]
  22. Le, L.T.; van Ierland, E.C.; Zhu, X.; Wesseler, J. Energy and greenhouse gas balances of cassava-based ethanol. Biomass Bioenergy 2013, 51, 125–135. [Google Scholar] [CrossRef]
  23. Jiang, D.; Hao, M.; Fu, J.; Tian, G.; Ding, F. Estimating the potential of energy saving and carbon emission mitigation of cassava-based fuel ethanol using life cycle assessment coupled with a biogeochemical process model. Int. J. Biometeorol. 2017. [Google Scholar] [CrossRef] [PubMed]
  24. Kurian, M. The water-energy-food nexus. Environ. Sci. Policy 2017, 68, 97–106. [Google Scholar] [CrossRef]
  25. Hao, M.; Jiang, D.; Wang, J.; Fu, J.; Huang, Y. Could biofuel development stress China’s water resources? GCB Bioenergy 2017, 9, 1447–1460. [Google Scholar] [CrossRef]
  26. Yan, X.; Jiang, D.; Fu, J.; Hao, M. Assessment of Sweet Sorghum-Based Ethanol Potential in China within the Water–Energy–Food Nexus Framework. Sustainability 2018, 10, 1046. [Google Scholar] [CrossRef]
  27. Fu, J.; Dong, J.; Huang, Y.; Zhuang, D.; Wei, J. Evaluating the marginal land resources suitable for developing bioenergy in asia. Adv. Meteorol. 2014, 2014, 45–49. [Google Scholar] [CrossRef]
  28. Zhuang, D.; Jiang, D.; Liu, L.; Huang, Y. Assessment of bioenergy potential on marginal land in china. Renew. Sustain. Energy Rev. 2011, 15, 1050–1056. [Google Scholar] [CrossRef]
  29. Dong, J.; Hao, M.; Fu, J.; Zhuang, D.; Huang, Y. Spatial-temporal variation of marginal land suitable for energy plants from 1990 to 2010 in china. Sci. Rep. 2014, 4, 5816. [Google Scholar]
  30. Tan, J.; Li, A.; Lei, G. Contrast on anusplin and cokriging meteorological spatial interpolation in southeastern margin of Qinghai-Xizang plateau. Plateau Meteorol. 2016, 35, 875–886. [Google Scholar]
  31. The, C.; Hutchinson, M.; Johnson, F.; Beesley, C.; Green, J. Application of Anusplin to Produce New Intensity-Frequency-Duration (IFD) Index Rainfalls across Australia; Engineers Australia: Barton, Australia, 2014. [Google Scholar]
  32. Bernardos, J.N.; Viglizzo, E.F.; Jouvet, V.; Lértora, F.A.; Pordomingo, A.J.; Cid, F.D. The use of epic model to study the agroecological change during 93 years of farming transformation in the argentine pampas. Agric. Syst. 2001, 69, 215–234. [Google Scholar] [CrossRef]
  33. Liu, J.; Williams, J.R.; Zehnder, A.J.B.; Yang, H. Gepic—Modelling wheat yield and crop water productivity with high resolution on a global scale. Agric. Syst. 2007, 94, 478–493. [Google Scholar] [CrossRef]
  34. Liu, J. A gis-based tool for modelling large-scale crop-water relations. Environ. Model. Softw. 2009, 24, 411–422. [Google Scholar] [CrossRef]
  35. Liu, J.G. Consumptive water use in cropland and its partitioning: A high-resolution assessment. Sci. China 2009, 52, 3309–3314. [Google Scholar] [CrossRef]
  36. Liu, J.; Hong, Y.; Zehnder, A.J.B. Drops for crops: Modelling crop water productivity on a global scale. Glob. Nest J. 2007, 10, 295–300. [Google Scholar]
  37. Rahman, S.; Awerije, B.O. Technical and scale efficiency of cassava production system in delta state, nigeria: An application of two-stage dea approach. J. Agric. Rural Dev. Trop. Subtrop. 2015, 116, 59–69. [Google Scholar]
  38. Jongschaap, R.E.; Blesgraaf, R.A.; Bogaard, T.A.; van Loo, E.N.; Savenije, H.H. The water footprint of bioenergy from Jatropha curcas L. Proc. Natl. Acad. Sci. USA 2009, 106, E92. [Google Scholar] [CrossRef] [PubMed]
  39. Mathioudakis, V.; Gerbens-Leenes, P.W.; Meer, T.H.V.D.; Hoekstra, A.Y. The water footprint of second-generation bioenergy: A comparison of biomass feedstocks and conversion techniques. J. Clean. Prod. 2017, 148, 571–582. [Google Scholar] [CrossRef]
  40. Gerbensleenes, W.; Hoekstra, A.Y.; Th, V.D.M. The water footprint of bioenergy. Proc. Natl. Acad. Sci. USA 2009, 106, 10219. [Google Scholar] [CrossRef] [PubMed]
  41. Seabra, J.; Hernandes, T.; Galdos, M. Water Footprint and Water Consumption for the Main Crops and Biofuels Produced in Brazil. Available online: http://adsabs.harvard.edu/abs/2011AGUFM.H11M..05S (accessed on 19 June 2018).
  42. Hernandes, T.A.D.; Bufon, V.B.; Seabra, J.E.A. Water footprint of biofuels in Brazil: Assessing regional differences. Biofuels Bioprod. Biorefin. 2014, 8, 241–252. [Google Scholar] [CrossRef] [Green Version]
  43. Chen, B.; Hao, S.; Yang, X. The Dynamic Mechanism of the Rapid Development of Urbanization in China. Acta Geogr. Sin. 2004, 59, 1068–1075. [Google Scholar]
  44. China Statistical Yearbook. Available online: http://www.stats.gov.cn/ (accessed on 19 June 2018).
  45. Höffle, H.; Wernberg, T.; Thomsen, M.S.; Holmer, M. Drift algae, an invasive snail and elevated temperature reduce ecological performance of a warm-temperate seagrass, through additive effects. Mar. Ecol. Prog. 2012, 450, 67–80. [Google Scholar] [CrossRef] [Green Version]
  46. Wang, X.; Cai, J.; Liu, F.; Jin, M.; Yu, H.; Dong, J.; Wollenweber, B.; Dai, T.; Cao, W. Pre-anthesis high temperature acclimation alleviates the negative effects of post-anthesis heat stress on stem stored carbohydrates remobilization and grain starch accumulation in wheat. J. Cereal Sci. 2012, 55, 331–336. [Google Scholar] [CrossRef]
  47. Millar, R.; Fuglestvedt, J.S.; Grubb, M.; Rogelj, J.; Skeie, R.B.; Friedlingstein, P.; Forster, P.; Frame, D.J.; Pierrehumbert, R.; Allen, M.R. Future Emissions Pathways Consistent with Limiting Warming to 1.5 °C. Available online: http://adsabs.harvard.edu/abs/2016AGUFMGC24D..04M (accessed on 19 June 2018).
  48. Torjesen, I. Paris agreement’s ambition to limit global warming to 1.5 °C still possible, analysis shows. BMJ 2017, 358. [Google Scholar] [CrossRef] [PubMed]
Figure 1. Analysis framework for sustainable development of bioenergy from cassava. The land resources suitable for cassava in different years were extracted considering the “water-energy-food” nexus. Considering landuse change and climate change, the spatial-temporal variations of bioenergy production and water footprint of bioenergy from cassava were calculated with the GEPIC model (GIS-based Environmental Policy Integrated Climate Model). Finally, the sustainable development of bioenergy from cassava was analyzed.
Sustainability 10 02153 g001
Figure 2. The spatial distribution of potential bioenergy production from 1990 to 2010. 2010–1990 refers to the bioenergy change from 1990 to 2010, the regions with the value greater than 0 means the bioenergy has increased.
Sustainability 10 02153 g002
Figure 3. The spatial distribution changes in land resources that were suitable for cassava from 1990 to 2010.
Sustainability 10 02153 g003
Figure 4. The area of different types of marginal lands that were suitable for cassava in each province in different years.
Sustainability 10 02153 g004
Figure 5. The average climate change in the provinces suitable for cassava cultivation from 1990 to 2010.
Sustainability 10 02153 g005
Figure 6. The spatial distribution of water demand and water footprint for bioenergy from cassava in the period 1990–2010. 2010–1990 refers to the changes of AET and WF from 1990 to 2010, the regions with the value greater than 0 means the AET and WF have increased.
Sustainability 10 02153 g006
Table 1. The potential bioenergy production from 1990 to 2010 in each province.
ProvinceBioenergy Production (GJ/ha)Bioenergy Production (PJ)
199020002010199020002010
Fujian246256267667677595
Guangdong257247275700627323
Guangxi269262284209020391508
Guizhou269272269281196197
Hainan17618086574611
Hunan189205226446929
Jiangxi189207232248307326
Sichuan269241120975628
Yunnan302314215184718821328
Zhejiang22729226762614
Chongqing194272258384940
Average/Sum235250227607559744399
Table 2. The average climatic index in the 11 provinces that were suitable for planting cassava from 1990 to 2010.
Climatic Index1990199119921993199419951996
Tmax (°C)21.7321.6121.3921.4321.8621.4221.41
Tmin (°C)13.4813.4312.8212.9613.5813.1512.94
Prec (mm)1522.001277.651459.231546.591589.171479.771431.35
Pred (d)166159156166168160153
Climatic Index1997199819992000200120022003
Tmax (°C)21.5122.5622.0921.5622.0322.2422.54
Tmin (°C)13.3714.1213.6513.4113.6213.8013.70
Prec (mm)1627.821566.251558.931528.391524.341619.411206.26
Pred (d)173156157167160162138
Climatic Index2004200520062007200820092010
Tmax (°C)22.3421.9222.6122.5521.9422.5522.24
Tmin (°C)13.4013.7514.0613.9713.5013.9113.77
Prec (mm)1280.821428.261430.681339.281512.601337.251630.00
Pred (d)143155148146151143159
Table 3. The water footprint of bioenergy in each province from 1990 to 2010.
ProvinceWater Footprint of Bioenergy from Cassava (m3/GJ)
199020002010
Fujian36.1436.8732.84
Guangdong34.2537.9732.79
Guangxi33.1234.6330.83
Guizhou32.8132.8131.68
Hainan53.8258.10104.55
Hunan40.5340.0034.10
Jiangxi44.1643.5937.70
Sichuan28.1033.25114.48
Yunnan31.1630.1747.20
Zhejiang33.8228.7832.97
Chongqing35.1329.3531.44
Average36.64 36.8648.23

