Article

Garden Pollinators and the Potential for Ecosystem Service Flow to Urban and Peri-Urban Agriculture

1
Department of Horticulture, Oregon State University, Corvallis, OR 97331, USA
2
Toulan School of Urban Studies and Planning, Portland State University, Portland, OR 97207, USA
*
Author to whom correspondence should be addressed.
Sustainability 2018, 10(6), 2047; https://doi.org/10.3390/su10062047
Submission received: 16 April 2018 / Revised: 12 June 2018 / Accepted: 14 June 2018 / Published: 16 June 2018

Abstract

:
Hedgerows, flowering strips, and natural areas that are adjacent to agricultural land have been shown to benefit crop production, via the provision of insect pollinators that pollinate crops. However, we do not yet know the extent to which bee habitat in the form of urban gardens might contribute to pollination services in surrounding crops. We explored whether gardens might provision pollinators to adjacent agricultural areas by sampling bees from gardens in the Portland, Oregon metropolitan area, and estimating typical foraging distances in the context of commercial- and residential-scale pollination-dependent crops up to 1000 m from garden study sites. We estimate that garden bees could forage outside of the garden in which they were collected, and that when pollination-dependent crops (commercial-scale or residential-scale) are nearby, 30–50% of the garden bee community could potentially provide pollination services to adjacent crops, if urban bees readily cross boundaries and forage among habitat types. Urban gardens might thus be well-positioned to provision neighboring farms and food gardens with pollination services, or could serve as a refuge for pollinators when forage is scarce or crop management practices are inhospitable. The actual capacity of gardens to serve as a refuge for pollinators from agricultural fields depends upon the extent to which bees forage across habitat types. However, relatively little is known about the degree to which bees move among habitat patches in heterogeneous landscapes. We thus propose a research agenda that can document the extent to which gardens contribute to pollinator health and pollination services at the interface of urban, peri-urban, and rural landscapes. In particular, more data is needed on how landscape context impedes or promotes garden bee movement between habitat types.

1. Introduction

Multiple, interacting stressors (e.g., habitat loss and fragmentation, pesticide exposure and the spread of pathogens) have been identified as drivers of global bee decline [1,2,3,4,5,6,7,8,9]. Intensive agricultural systems, in particular, appear at the nexus of many of these stressors, leading to homogenization of wild bee communities and an increased reliance on managed species for pollination services [10], even though managed bees appear less suitable for achieving high fruit sets in many systems [11]. Recent research has demonstrated that wild pollination services can be enhanced through the retention or restoration of small fragments of natural habitat situated within broader agricultural landscapes [6,7,12,13,14]. Ponisio and colleagues [14] hypothesize that, while agricultural landscapes act as an “ecological filter” through which only a restricted group of generalist pollinator taxa can pass, diverse and mature bee habitat fragments act as refugia that not only result in greater spatial heterogeneity in bee communities, but also more robust pollination service to agriculture [12]. As a consequence, other researchers have observed that negative effects of intensive agriculture, such as pesticide exposure, can effectively be reversed if bee habitat is retained in close proximity to agricultural fields [15].
Researchers have confirmed that natural land [16], flower strips [13,17] or hedgerows [12,14] can benefit crop yield via the local attraction of pollinators and the provisioning of pollination services. However, there has been no research examining the implications of the growth of a particularly prominent form of habitat fragment surrounding many crops: bee habitat in the urban landscape. Urban bee habitat might, in fact, be well positioned to deliver significant value to U.S. agriculture, since 90% of fruits, nuts and berries and 78% of vegetables and melons are now grown in counties with significant urban encroachment [18]. The growing importance of the peri-urban zone to pollinator-dependent crop yield is particularly acute in the Pacific Northwest, where, since the mid-1990s, some cities have experienced a 45% expansion of the area planted for highbush blueberry, a highly-pollinator dependent crop [19].
Although urbanization has also contributed to biodiversity loss in its own right [20], paradoxically, urban areas have been shown to support surprisingly diverse, abundant and intact bee communities [21,22,23,24,25,26]. In fact, the abundance and diversity of bees visiting urban gardens and street trees have been observed to approach, and even exceed, numbers in adjacent wild land [27,28,29,30]. This is likely because cities, unlike intensive agricultural systems, can contain exceptionally rich small patches of flowering plants [31], resulting in a high degree of plant species diversity within properties (α-diversity) between properties (β-diversity), and in aggregate across the city (γ-diversity) [32,33,34]. High plant diversity results in a wide range of floral types, frequently producing considerable nectar and pollen resources for bees across the entire year [35,36,37]. In addition, preliminary findings suggest that the exposure of bees to pesticides in urban areas is considerably lower compared to agricultural settings [38]. Moreover, urban areas appear to provide a diversity of nesting substrates that are otherwise rare in agricultural settings [21,39]. All of these factors help explain observations that urban areas have higher abundance and diversity of bees compared to adjoined agricultural areas [36,40], and, at least in one E.U. study, higher rates of pollinator visitation to crops growing on peri-urban farms [40].
While crop yields in peri-urban agriculture might be more connected to urban bee management decisions than previously thought, there is considerable evidence to suggest that urban bees are important to yields in the rapidly expanding field of urban agriculture [41,42,43]. Urban agriculture is becoming a prominent activity in many cities, where there has been significant demand for local and sustainable food [35,44]. Urban agriculture, be it in the form of community and backyard gardens or urban farms, is well positioned to take advantage of abundant pollinator service flow, particularly when coupled with the growth of urban beekeeping [45] as well as efforts to propagate other managed solitary bee species in the city, particularly the orchard mason bee (Osmia lignaria) [46].
Whether or the extent to which the ecosystem service of pollination links urban gardens and pollination-dependent crops via the movement of insect pollinators between habitat types has yet to be established. Just because a bee is capable of flying among habitat patches does not mean that it will. Previous studies have documented high levels of site fidelity and limited movement of pollinators among habitat types, for pollinators foraging in landscape matrices composed of forest and grassland [47] or agricultural land and grasslands [48]. Similarly, work in urban landscapes has shown that aspects of the built, urban environment (e.g., roads and railroads) restrict, but do not eliminate movement of pollinator movement between habitat patches [41,49].
However, the question of bee movement between habitat types is far from resolved. In particular, work on bee movement among habitat fragments in urban landscapes has tended to be short term (e.g., 3 weeks of less), with limited resampling for marked pollinators (e.g., across 5–6 days), and limited sampling of nearby sites where marked pollinators could potentially travel (e.g., 4–12 adjacent habitat patches) [41,49]. More work is needed to better understand the potential contributions of urban gardens to bees, at the peri-urban edge.
In this paper, we explore a preliminary question: are bees in urban and peri-urban gardens within the flight range of properties growing pollination-dependent food crops? We predict that there is significant overlap between the flight range of bees found in residential gardens, and the location of pollinator-dependent food production in the surrounding landscape. We selected Portland as a best case example to explore this question because there is significant food production proximal to residential land [50]. We hope that data presented here stimulate discussion and research into the potential role of urban gardens in provisioning pollinators to adjacent agricultural sites, and/or providing refuge to pollinators from agricultural stresses.

2. Materials and Methods
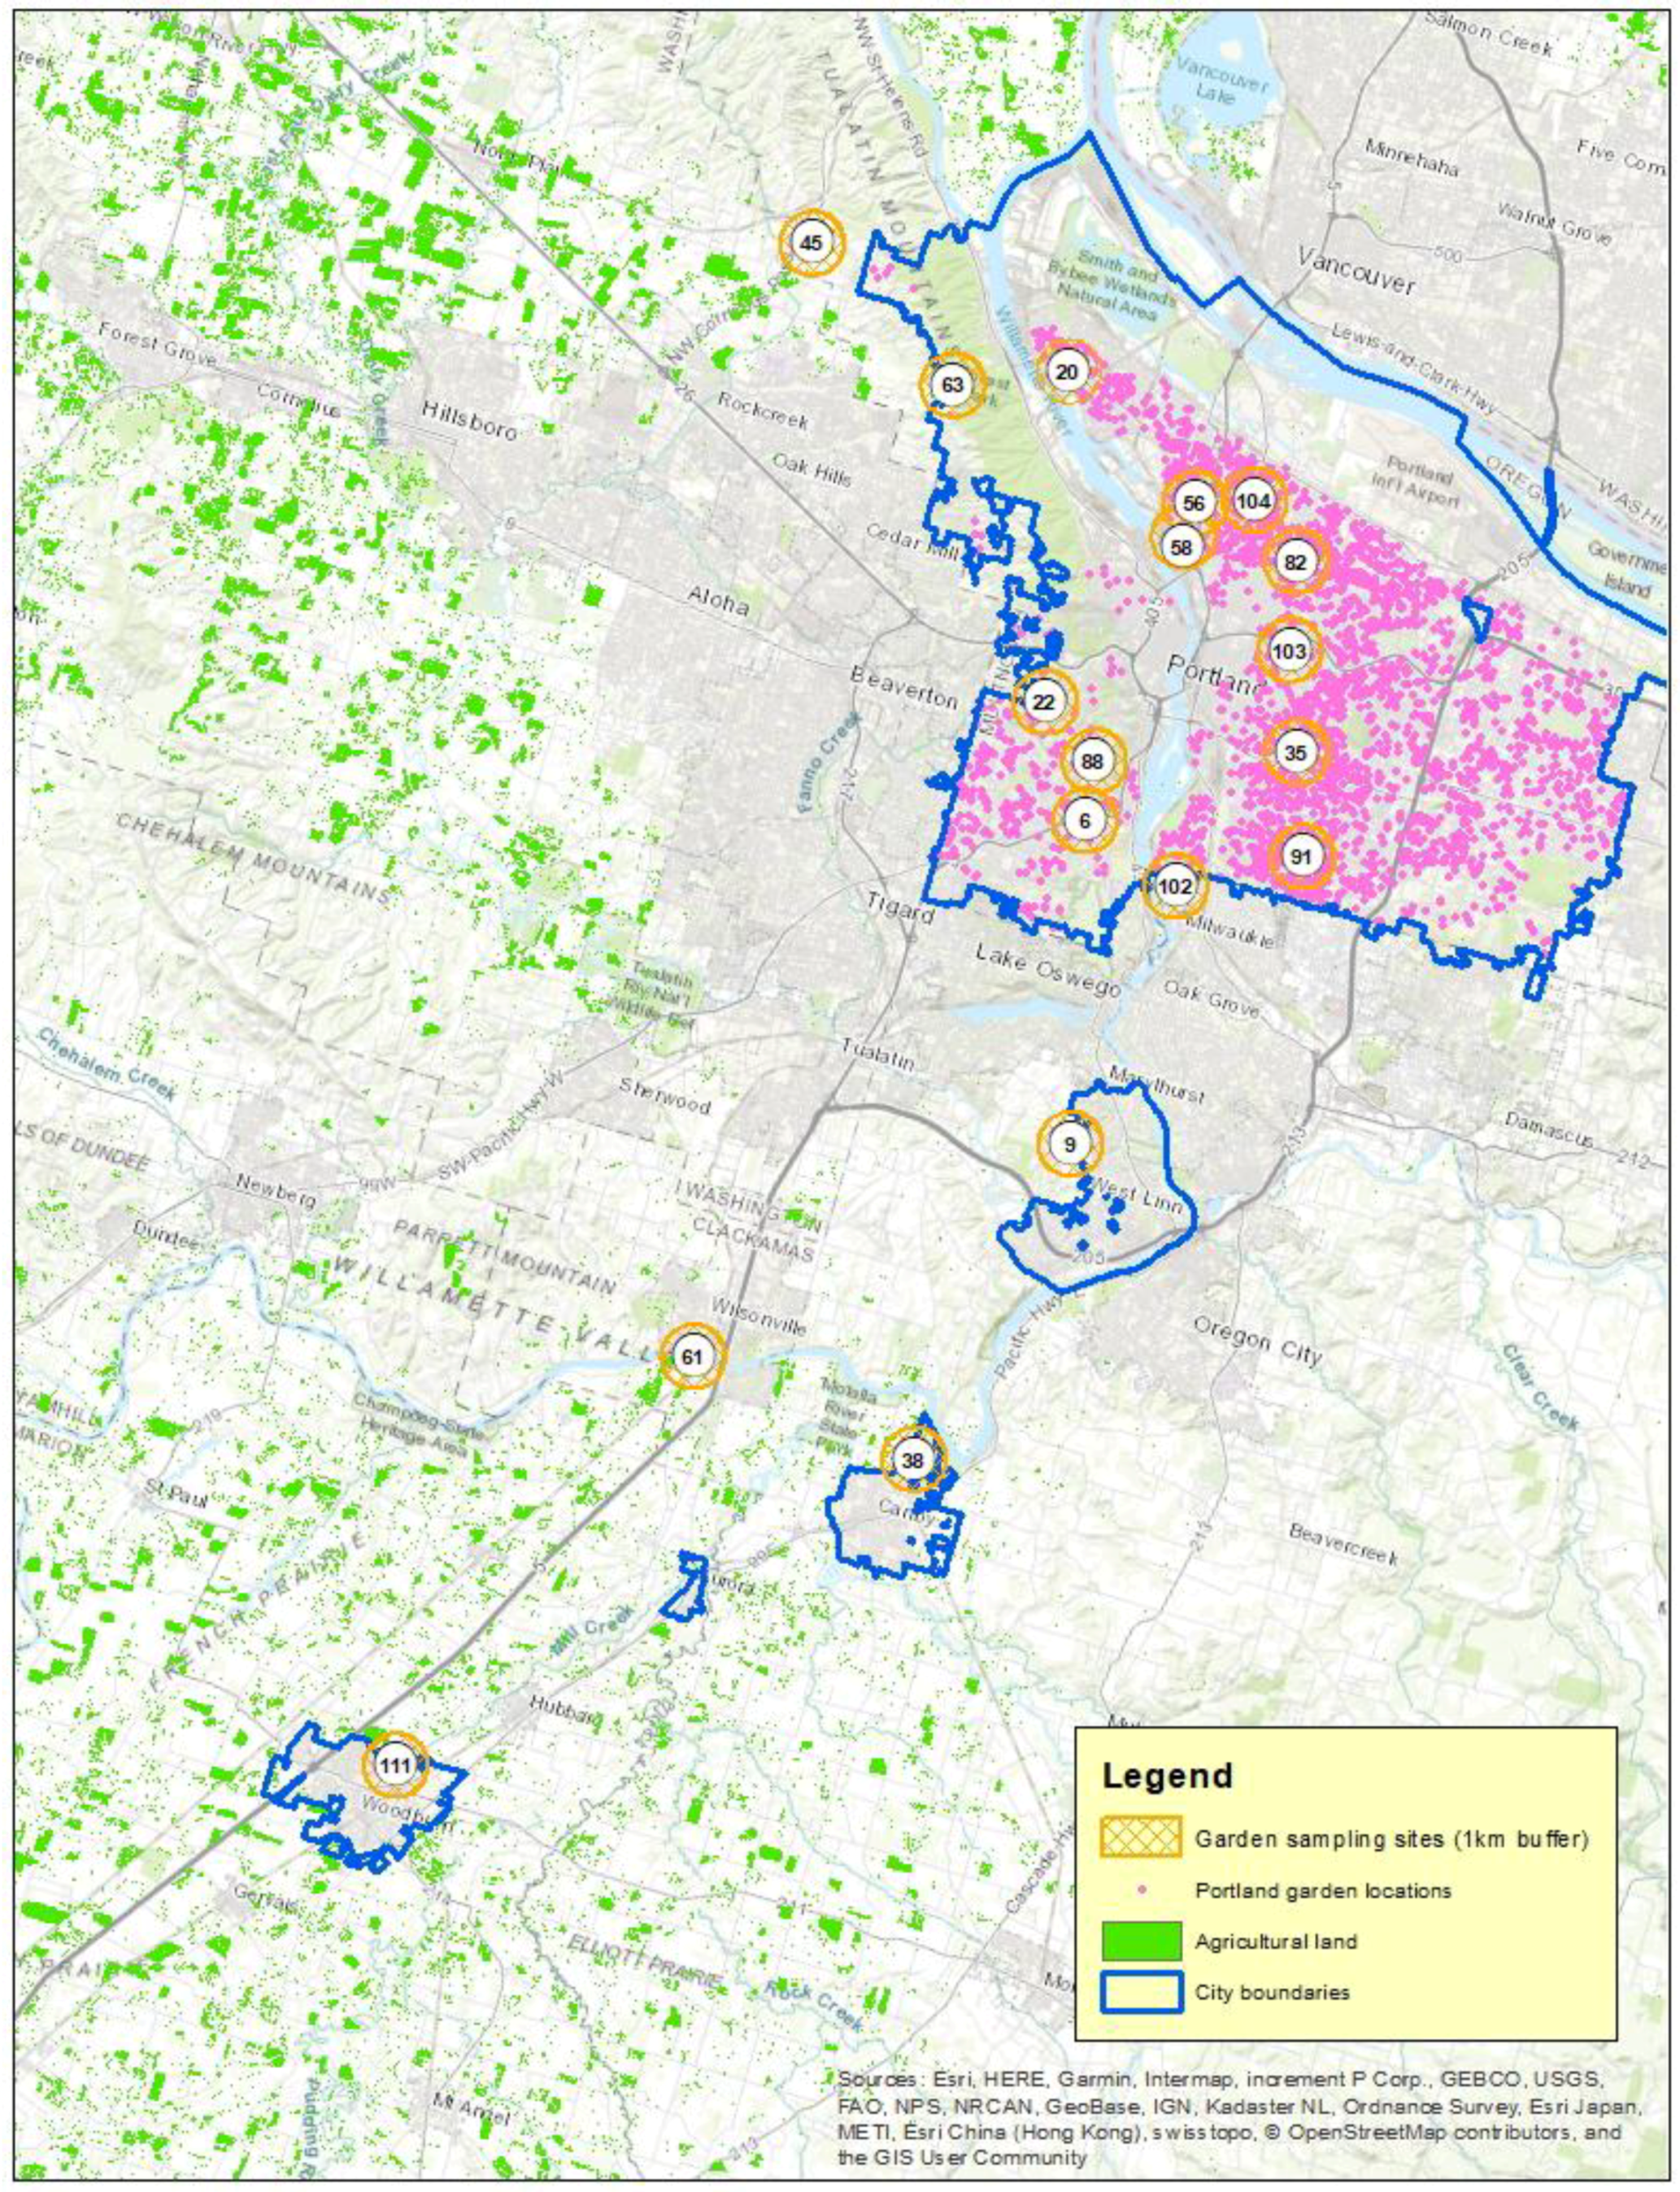
2.1. Study Sites

Portland, Oregon is well-suited to explore the implications of pollinator movement between residential gardens and surrounding agriculture. The region has several types of pollination-dependent cropping systems in the urban- and peri-urban landscape, including tree fruits, berries, and vegetable seeds [50]. Within the Portland city limits, school gardens, community gardens, and residential gardens are ubiquitous [50].
In the summer of 2017, we sampled bees from 24 gardens within the Portland, Oregon Metropolitan area (Figure 1). Study sites were selected based upon property owners’ willingness to allow us to collect bees from their property. To increase the probability that we would collect as diverse a bee assemblage as possible, gardens were also selected to represent a range of: landscape contexts (e.g., urban, peri-urban), adjacent landscape features (e.g., golf course, river, forest, farm), and gardening styles (e.g., native plant gardens, perennial gardens, edible gardens). Finally, to facilitate efficient sampling, we selected gardens that could be mapped along a reasonably efficient driving route. Site selection was not optimized to address the specific question of ecosystem service flow between gardens and farms. However, because our sites were located in urban and peri-urban landscapes, we were able to use data collected from these sites to conduct a post hoc examination of the potential for ecosystem service flow from gardens to surrounding commercial- and residential-scale agricultural land.
With the exception of one demonstration garden on city property, all gardens were privately owned. Online real estate data was used to estimate lot size for each study garden [51].
We collected bees on three separate occasions within each garden (June, July, and August 2017), using a combination of water pan traps and hand collecting. Water pan traps were constructed from white plastic bowls (Greenbrier International Inc., Chesapeake, VA, USA) approximately 400 mL) that were painted fluorescent yellow or fluorescent blue (Risk Reactor, Inc., Huntington Beach, CA, USA), or that were left unpainted, as white. During each sampling event, two blue, two yellow, and two white bowls were placed into each garden. Traps were placed near areas of noticeable bee activity. Bowls were filled with a dilute soapy water solution, so that bees attracted to bowls would break the surface tension of the water. After 24 h, traps were retrieved, and the contents poured through a strainer (0.3 mm mesh size), rinsed with water and stored in Whirlpak bags in 90% ethanol.
On the day that water pan traps were placed into gardens, we also hand-collected bees for 10 person-minutes (i.e., one person collecting for 10 min, or two people collecting for five mins). Bees were hand-collected from flowers using an aspirator attached to a vial (9 dram, for smaller bees) or small jars (120 mL, for larger bees). Bees were aspirated or trapped while they were foraging on flowers. We did not use nets to collect bees, in order to avoid and prevent damage to ornamental plantings. Hand-collected bees were stored in a cooler until they could be transferred to the laboratory. All specimens were placed into a freezer until they could be pinned and processed.
In 2017, sampling events totaled approximately 72 h of pan trapping and 30 min of hand collections, per garden. Data on bee richness and diversity will be reported in a subsequent paper.

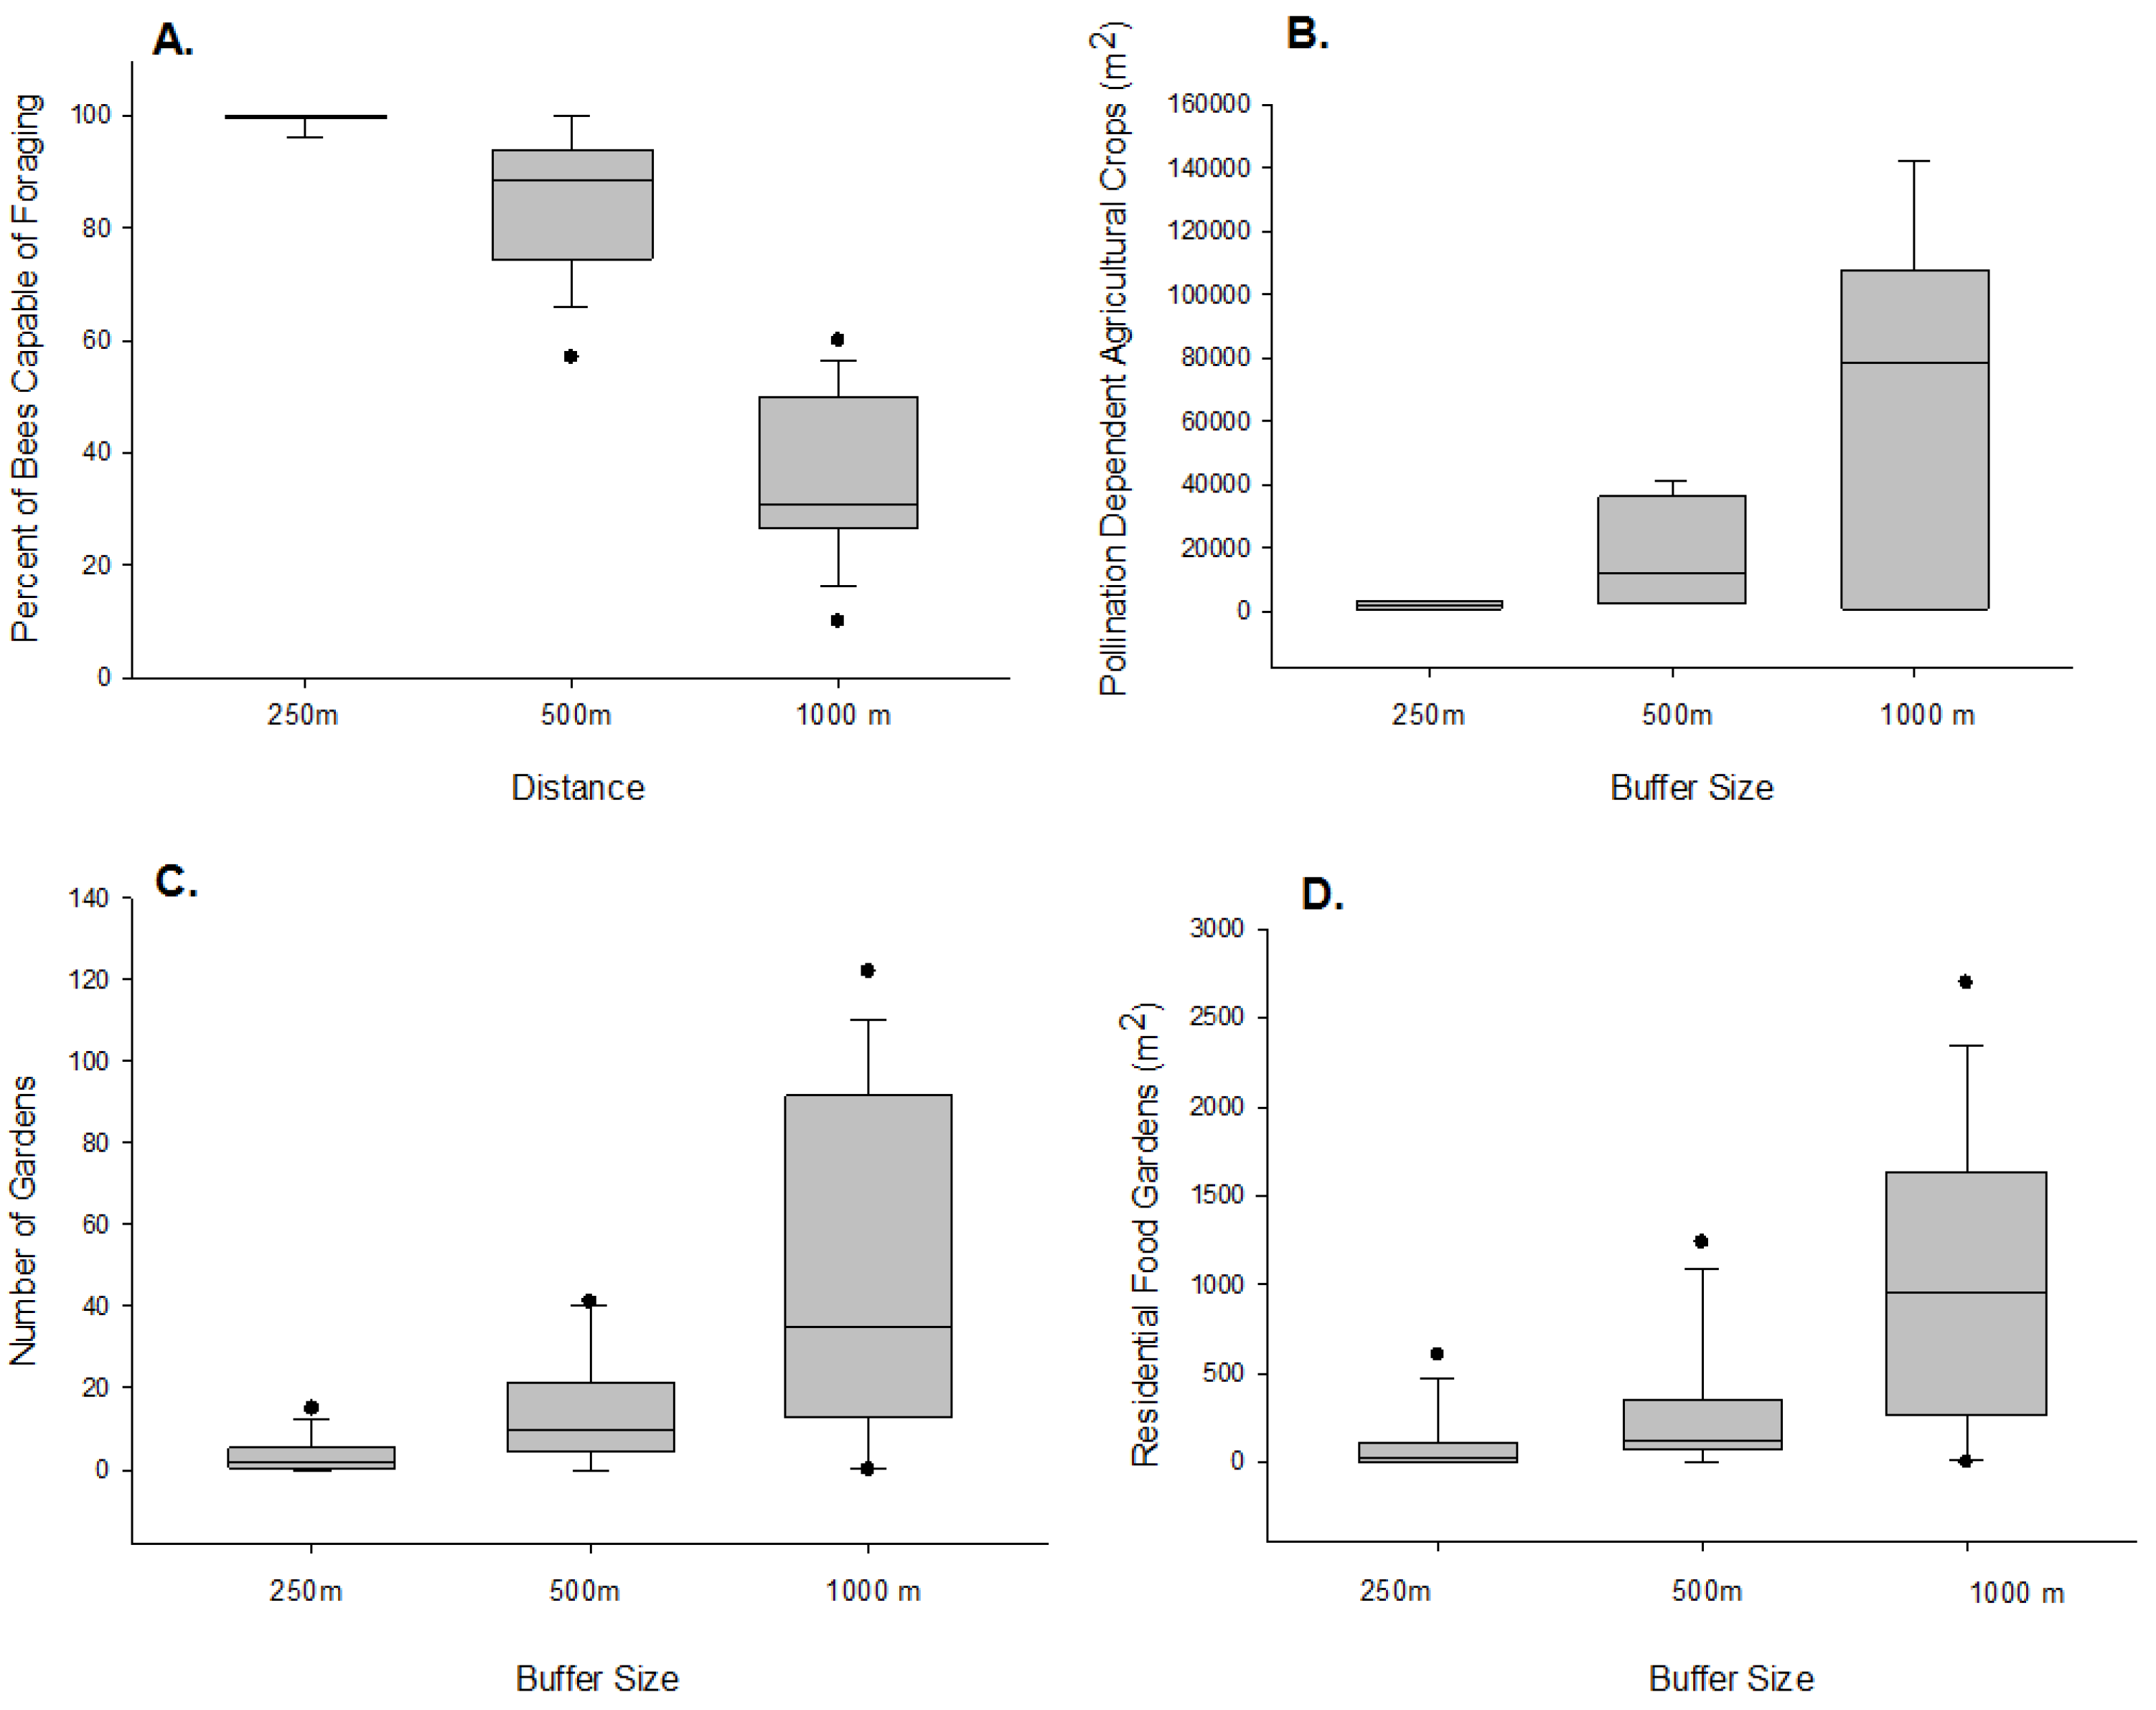
2.2. Bee Size and Foraging Distance

To estimate typical foraging distance and maximum foraging distance, we measured the distance between bee tegulae. Tegula are plates at the base of a bee’s forewings. Measuring the distance between forewing tegulae gives a reliable estimate of bee size [52]. We then used Equation (1) from Greenleaf et al. [53] to estimate bees’ foraging range:
Y = log a + b log IT,
where Y is typical homing range (in km), IT is intertegula distance (in mm), and a and b are constants. For typical homing distance, log a = −1.643 and b = 3.242.
For each garden study site, we then determined the range of foraging capabilities, for bees collected from a garden, as the minimum typical foraging distance (from the smallest bee collected from a garden) and the maximum typical foraging distance (from the largest bee collected from a garden). We also determined the proportion of each garden study site’s bee community that was estimated to typically forage ≥250 m, ≥500 m, and ≥1000 m.

2.3. Agricultural Context

The agricultural context of sampled gardens was determined using ArcMap 6.1 (ESRI, Redlands, CA, USA) [54]. Specifically, we determined the percent of pollination-dependent crop-land surrounding each garden at a radius of 250 m, 500 m, and 1000 m. Buffers were calculated from the central GPS point for each property. To do so, we obtained the 2017 USDA Cropland Data Layer for our area of interest [55]. This provided a raster layer consisting of all types of agricultural cover, as well as urban area and natural area. Using the “Reclassify” tool in the Spatial Analyst Toolbox of ArcMap 10.6, we created a new raster layer that excluded natural land, developed land, crops that are not pollinator dependent, and crops not grown in Oregon. This new layer retained pixels representing pollinator-dependent commercial crops grown in the region: sugarbeet (seed), onion, cucumber, caneberry, clover/wildflower (seed), cherry, apple, pear, carrot, garlic, broccoli, plums, pumpkin, blueberry, and cauliflower (seed) [56]. Of these, clover/wildflowers were most abundant across all sites (266,400 m2 across all 1000 m buffers), followed by cauliflower (67,500 m2), greens (30,600 m2), blueberries (29,700 m2), cherries (17,100 m2), caneberries (4500 m2), radish (4500 m2), sugarbeets (3600 m2), onion (1800 m2) and apples (900 m2).
We imported the GPS coordinates of study gardens into ArcMap 10.6, and used the “Buffer” tool in the Analysis Toolbox to create circular buffers around the gardens at distances of 250 m, 500 m, and 1000 m. Using the “Zonal Statistics as Table” tool in the Spatial Analyst Toolbox, we counted the number of pixels in our reclassified raster layer that were found within each individual garden-site buffer. Each pixel represented land area of 30 m2. We could thus estimate the proportion of area within each individual buffer that was occupied by agricultural land.

2.4. Residential Gardens

Several of our study gardens are located in densely-populated areas of Portland, where land access is an impediment to commercial-scale, urban farms [57], and/or the Cropland Data Layer resolution of 30 m2 [55] is too coarse to capture smaller-scale, urban farms. Within cities, residential scale gardens are the most prominent form of urban agriculture [50,58], and nearly all crops grown in these small-scale food gardens depend upon pollination to some degree, for fruit or seed sets [41]. To estimate the extent of residential-scale agriculture surrounding garden study sites within the city of Portland, we used data from a separate analysis of residential food production within the city, from 2012–2013 [59]. Briefly, Google Earth Pro (Google LLC, Mountain View, CA, USA) was used to visually scan Portland tax lots (i.e., individually-owned properties), for any area over 1 m2 that appeared to be a garden (i.e., clearly delineated beds or planting areas). Garden area was estimated using ArcGIS, and adjusted to exclude paths, hardscape, or other non-productive areas. A combination of Google Streetview, mailed surveys, and conventional ground-truthing was used to confirm the accuracy of Google Earth Pro-identified gardens. For full details on the methodology, please refer to McClintock et al. [55].
We imported these data points into our ArcMap 10.6, and used the “Clip” tool to identify the garden locations within the 250 m, 500 m, and 1000 m buffers surrounding our study sites. This allowed us to sum the area of each of the included gardens to estimate the extent of residential agriculture surrounding our study sites. One garden study site (site 102) was located within Portland city limits. However, the buffers surrounding this garden fell outside of the range of our residential garden data. Thus, this site was not included in analyses of residential garden number or land area. Altogether, we estimated the extent of residential gardens in the surrounding landscape, for 13 of our 24 study sites.

2.5. Ecosystem Service Flow between Gardens and Surrounding Agriculture

We qualitatively estimated bee foraging ranges for each garden site, relative to the extent of large-scale, commercial agriculture or residential-scale food gardening surrounding study gardens. Six of our study sites did not have pollination dependent cropland in surrounding buffers, and/or they were outside of the Portland City limits (where we did not have data on residential food production by tax lot). These sites were dropped from subsequent analyses, leaving us with 18 total study sites.
To estimate the maximum distance, a bee would have to fly to leave each garden site (we used ArcMap 10.6). Each garden was located on a satellite basemap via its GPS coordinates. The corresponding addresses were then located on Google Maps in order to “ground-truth” the locations of the gardened area of the yard via satellite imagery and Google Street View. Once the location of each garden area was ascertained, the “Measure” tool was used in ArcMap to estimate the maximum distance from the center of the garden that a bee would need to fly to leave the property. For gardens with long backyard gardens, this was generally the distance from the center of the backyard to the back of the property. For those with narrow front yard gardens, this was generally the half-width of the front yard. For sprawling, rural properties, this was from the center of the gardened area to the edge of the property via the longest straight path. We also considered the extent of pollination-dependent agricultural land surrounding garden study sites (including commercial scale agriculture and residential-scale food gardening), by comparing the percent of each garden bee community estimated to typically forage up to 250 m, 500 m, and 1000 m from a central foraging point, to the land area planted to pollination-dependent agriculture in buffers with radii of 250 m, 500 m, and 1000 m. Because it is unlikely that garden bees reside at or exclusively forage from the center of each garden study site, our estimate of bees’ ability to move into pollination-dependent crop land should be considered a conservative estimate.

3. Results

Overall, we collected and measured 756 individual bees from garden study sites (range of 10 to 67 bees per site). Across all bees, mean typical foraging distance was estimated to be 760 m (±270 m SD) and median foraging distance was 720 m. Of the bees that we collected, only 1% were so small (IT distance ≤ 1.03 mm) that we estimate they would not typically forage 250 m from the garden. Nearly all bees collected from garden study sites (mean = 99%, median = 100%) are estimated to typically forage at least 250 m (Figure 2A). The majority of bees (mean = 83%, median = 83%) are estimated to typically forage at least 500 m from garden study sites (Figure 2A). About a third of bees collected from gardens (mean = 36%, median = 33%) are estimated to typically forage at least 1000 m (Figure 2A).
Study gardens were situated on lots ranging from 167 m2 to 20,234 m2 (0.04 to 1.9 ha; Appendix A). All gardens had an estimated maximum flight distance to leave of 135 m or less, well within the typical flight range of even the smallest garden bee (190 m from a central foraging point; Appendix A). Only seven of our 18 study sites (9, 38, 45, 61, 63, 102, 111) were located within 1000 m of commercial-scale, pollination-dependent crops (Appendix A; Figure 1). The pollination-dependent crop area surrounding these gardens at the 1000 m scale was fairly substantial (median = 78,300 m2; Figure 2B). Reducing the buffer size around gardens reduced both the number of gardens and the area of pollination-dependent cropland in the surrounding landscape (Figure 2B). Only four garden study sites (38, 45, 61, 111) had pollination dependent cropland within 500 m of the garden (median = 12,514 m2; Figure 2B) and only three sites (38, 45, 61) had pollination-dependent cropland within 250 m of the garden (median = 1800 m2; Figure 2B).
None of the eight gardens sampled in East Portland (sites 20, 35, 56, 58, 82, 91, 103, 104) had large-scale, commercial cropping systems in the surrounding landscape. Some of the gardens sampled in West Portland had few (site 63) or no (site 45) residential food gardens in the surrounding landscape. For the rest of the 16 gardens within Portland City limits, there was an abundance of residential-scale gardening within 1000 m (Appendix A; Figure 2C). At this scale, residential gardens in the surrounding landscape covered a sizeable area (mean = 961 m2, median = 953 m2, respectively; Figure 2D) and were numerous (mean = 50, median-35, respectively; Figure 2C). At 500 m and 250 m surrounding study sites, the number of gardens (mean = 14 and 3, median = 10 and 2, respectively; Figure 2C) and the combined area of surrounding gardens (mean = 291 m2 and 96 m2, median = 120 m2 and 27 m2, respectively; Figure 2D) was much smaller. However, it is notable that all but two study sites (sites 45 and 63) had another residential, food-producing garden in the surrounding landscape, even at these relatively small spatial scales.

4. Discussion

In this observational, post hoc study, we explored the possibility of pollination service flow between urban, residential gardens, and adjacent agriculture. We found that when pollination-dependent crops (commercial-scale or residential-scale) are nearby, 30–50% of the garden bee community could potentially provide pollination services to adjacent crops. The potential value of garden bees to commercial-scale, pollination dependent crops was largely restricted to the outlying suburbs of the greater Portland metropolitan area. This is not surprising, given the region’s land-use policies and Portland’s urban growth boundary (UGB), which was created to protect rural farmland [60]. In some places, these limits to development have pushed urban and suburban housing up to the inside edge of the UGB, with farmland preserved on the outside edge [60]. In addition, the rise of non-farm use permits within the region, for land zoned as ‘exclusive farm use’ has increased the number of on-farm dwellings [61]. These phenomena create increased opportunities for the ecosystem service flow between gardens and farms. For the gardens within Portland’s city limits, a large number of residential-scale food gardens surrounded our garden study sites. Previous research suggests that nearly all crops (92%) grown in small-scale, urban food gardens are dependent upon bee pollination for fruit or seed sets [41].
Our results suggest that urban gardens might provision neighboring farms and food gardens with pollination services, and/or those gardens could serve as a refuge for pollinators when forage or nest sites are scarce, or management practices are inhospitable. However, the extent to which these potential benefits of urban gardens are realized is dependent upon the degree to which bees actually move across habitat boundaries, rather than their estimated ability to do so. Bee foraging is a complex behavior, influenced by habitat area, habitat isolation, density and distribution of floral resources, and physical barriers (e.g., trees, roads, buildings) [47,48,49,62,63,64]. Whether or not bees will cross boundaries between gardens and agricultural land in an urban-suburban-rural landscape remains unknown.
Pollinators are highly mobile animals, and evidence suggests that they move between habitat types, particularly at the interface of farmland and natural habitats. For example, natural habitat within 1000 m of organic farmland has been shown to benefit melon production in California [1]. Subsequent research has found that pollination services are sensitive to natural upland habitat within 1 km–2.5 km of farm sites [65]. However, even though bees may be capable of long-distance flight, studies suggest that only a small proportion of individuals within a population are vagile, long-distance foragers [66].
Both honey bees and bumblebees were collected during our garden sampling efforts, and are included in our estimates of minimum bee foraging distances. However, the equation that we used to estimate bee foraging distances [53] typically underestimates the distance that these taxa can travel. For example, our estimates of Apis mellifera minimum foraging distances ranged from 0.80–1.07 km, with a mean of 1.01 km (±0.03SD), but foraging ranges of 6 km or more can be typical of honey bee workers, particularly in complex landscapes [67]. Our estimates of Bombus sp. minimum foraging distances ranged from 0.83–1.27 km, with a mean of 1.07 km (±0.06SD) (see Table S1 for data). Others have shown that bumblebee workers have been shown to routinely forage 1.5 km from a central nest site, even when suitable resources were available at shorter distances [68].
Honey bees and bumblebees might be particularly important to ecosystem service flow between gardens and farms, given their extended foraging capabilities, their ability to cross landscape boundaries, and the perennial nature of eusocial bee colonies. Together, these characteristics suggest that these honey bees and bumblebees might be predisposed to utilize urban food resources that are temporally complementary to those at farms [69]. We did not survey bumblebee nests within gardens, but other studies have found that nest densities can be quite high in urban parks and gardens [28,70,71], particularly for bumblebee species that are competitively dominant in urban areas. In addition, although feral honey bee colonies are unlikely to be nesting urban gardens, there has been explosive growth in residential beekeeping over the past decade, which has resulted in relatively large densities of honey bees in some cities [45,72]. Gardens could potentially provide important nectar and pollen sources to offset the relatively high colony losses observed in urban areas in Oregon [73], and, in turn, contribute to increasing colony strength and density for surrounding pollinator-dependent food production. Currently, we know relatively little about insect movement between urban gardens and adjacent sites, in part because of the difficulty of studying insect movement in the urban environment [74]. In New York City, butterfly movement into community gardens has been shown to vary with local floral abundance [74], which suggests that some butterflies can track resources among habitat sites in an urban landscape. In Zurich, Switzerland, bees and syrphid flies were found to be sensitive to greenspace at scales of up to 200 m from study sites [75].
Foraging theory predicts that pollinators should adopt a strategy that maximizes (or at least enhances) resource collection and minimizes foraging movements [76]. Given the abundance and diversity of floral and nesting resources present in urban and suburban gardens [77,78], it is possible that many bees do not forage beyond garden boundaries, in which case, ecosystem service flow to adjacent agricultural sites would be negligible. Indeed, mark-recapture experiments on bees from urban gardens failed to document bee movement between gardens in New York City, even though bees were anecdotally observed leaving gardens after a foraging bout [41]. In Sao Carolos, Brazil, less than 1% of 870 marked bees were recaptured in a different site than where they were marked [79]. Bees have been shown to reduce their foraging range in urban landscapes [80]. However, variable environments are also known to influence pollinator foraging strategy [80] and evidence suggests that the floral abundance that characterizes urban gardens might promote bee movement from adjacent areas into garden habitats [81]. In this case, gardens might negatively affect crop pollination, by drawing pollinators away from pollination-dependent crops, and into garden habitats.
Understanding the influence and interplay of floral resources in gardens and agricultural fields on bee foraging behavior is key but will be a challenge to study. Previous mark–recapture studies (e.g., [41,49,79]) were likely looking for pollinator movement among habitat types at too small a spatial scale (e.g., 4–18 sites), over too short a time period (e.g., 2–4 weeks). Longer-term, landscape-levels studies are needed to better assess the extent to which pollinators move among habitats within an urban landscape matrix.
Developing a better understanding of the extent to which bees move between gardens and farms has the potential to yield benefits beyond pollination service flow. With the expansion of the urban built environment and related land uses into rural agricultural areas, conflicts are fairly common at the urban-rural interface [82]. For example, when farms are adjacent to residential developments, inputs of pesticides and fertilizers are often formally (i.e., by law) or informally (i.e., by social norms and expectations of non-farmers) restricted. Neighbors may complain about the impact of farm activities and animals on quality of life. Given that both farmers [83] and non-farmers [78,84] recognize the importance of pollinators to economic and environmental health, demonstrating mutually-beneficial ecological linkages between gardens and farms, mediated by pollinators, might be one way to help bridge an urban-rural divide.
Given the potential benefits of—yet general lack of clarity on—bee movements between gardens and farms, we suggest a research agenda for documenting the extent to which gardens contribute to on-farm pollinator health and pollination services. Specifically, we propose an agenda focused on answering five questions:
  • What is the extent of pollinator movement between urban gardens and urban and peri-urban farms?
  • Could management of urban bee habitat, in the form of residential gardens, parkland, and other managed green spaces within the city, positively influence pollinator movement between gardens and farms, to improve peri-urban and urban crop production?
  • How far could the effects of urban land management extend out to agriculture in the surrounding peri-urban landscape, and what is the extent that current agriculture is benefitting from these services?
  • How do effects of urban land management influence wild bees, versus managed bees?
  • What is the spatial and temporal extent (i.e., quantity) and importance (i.e., quality) of urban gardens, relative to other forms of pollinator habitat (e.g., natural areas, other agricultural land) surrounding farms?
Addressing these questions will take a combination of field work and geographic spatial analyses, as well as prolonged efforts to quantify insect movements across habitat patches in complex landscapes.
The growing importance of peri-urban and urban agriculture represents a major restructuring of the U.S. agricultural landscape [18]. However, there is a general lack of research examining the implications of urbanization and associated habitat fragmentation on bee communities and pollination services at the peri-urban boundary. As urbanization continues, landscapes are predicted to become increasingly more diverse in land use, more fragmented in structure, and more complex in shape [85], and these changes are expected to impact biodiversity [86,87] and ecosystem function [34,85,88,89]. In order to protect pollinator health, promote best management practices for pollination services, and ultimately improve sustainability in U.S. agriculture in the face of rapidly changing landscapes, there needs to be a better understanding of effective strategies for managing urban bee habitat and pollination services across the peri-urban interface.

Supplementary Materials

The following are available online at https://www.mdpi.com/2071-1050/10/6/2047/s1, Table S1: Raw Data for Langellotto et al. (2018), Garden Pollinators and Ecosystem Service Flow.

Author Contributions

G.L. and A.M. conceived and designed the experiments; G.L., N.M., I.M., and L.C. performed the experiments; G.L., A.A. and N.M. analyzed the data; G.L., A.M., A.A., and N.M. wrote the paper.

Funding

This research was funded in part by a generous donation from Spike Wadsworth and Y. Sherry Sheng and the Dale and Alice Hoecker Extension Innovation Grant.

Acknowledgments

We thank the editors and three anonymous reviewers for comments which helped to improve this manuscript. We also thank the gardeners who allowed us to use their gardens as study sites.

Conflicts of Interest

The authors declare no conflict of interest.

Appendix A

Table A1. Garden study sites, site size (m2), maximum distance (m) a bee must fly to leave a garden, number of bees collected and measured from each site, minimum and maximum estimated foraging range of the bee community from that garden (calculated using the equation provided by Greenleaf et al. [53]), land planted to pollination-dependent crops (m2), as residential food gardens (m2), and number of residential food gardens, surrounding garden study sites, in circular buffers with radii of 250 m, 500 m, or 1000 m. Estimates of land area as residential food gardens and number of residential food gardens were derived from the Cropland Data Layer of McClintock et al. [59].
Site #Site Size (m2)Max. Site Distance (m)# of Bees Collected and Measured Min.–Max. Foraging Range (m) of Bee CommunityLand Area Planted to Pollination Dependent Commercial Crops (m2)Land Area Planted as Gardens (m2)Number of Gardens
250 m500 m1000 m250 m500 m1000 m250 m500 m1000 m
66881116440–112000019593291719
920,2346051190–114000900n.cn.cn.cn.cn.cn.c
20581722200–127000060612372697153973
2219822521360–103000062992303515
35486912350–11600002678681,72484193
389291826480–1250360021,60078,300n.cn.cn.cn.cn.cn.c
4518,9393767310–1120180041,400108,000000000
56465760330–107000015340395382361
58445516270–11400000865370733
6126702941460–12709002,700142,200n.cn.cn.cn.cn.cn.c
6313,2732010380–10800081000017001
82445716470–1130000273041,27022091
8812952046260–11900005992981411
9151,89413548210–1150000212811,816218122
10217402222460–112000900n.cn.cn.cn.cn.cn.c
1034451226210–1110000471201,07421035
104167836350–1160000472241,54932092
111441715470–111002,70081,000n.cn.cn.cn.cn.cn.c
n.c.: Not Calculated. We did not calculate land area planted as garden, or number of gardens for study sites that were outside of Portland city limits (Figure 1).

References

  1. Kremen, C.; Williams, N.M.; Thorp, R.W. Crop pollination from native bees at risk from agricultural intensification. Proc. Natl. Acad. Sci. USA 2002, 99, 16812–16816. [Google Scholar] [CrossRef] [PubMed] [Green Version]
  2. Goulson, D.; Lye, G.C.; Darvill, B. Decline and conservation of bumble bees. Annu. Rev. Entomol. 2008, 53, 191–208. [Google Scholar] [CrossRef] [PubMed]
  3. Potts, S.G.; Biesmeijer, J.C.; Kremen, C.; Neumann, P.; Schweiger, O.; Kunin, W.E. Global pollinator declines: Trends, impacts and drivers. Trends Ecol. Evol. 2010, 25, 345–353. [Google Scholar] [CrossRef] [PubMed]
  4. Ratnieks, F.L.W.; Carreck, N.L. Clarity on honey bee collapse? Science 2010, 327, 152–153. [Google Scholar] [CrossRef] [PubMed]
  5. Brittain, C.; Potts, S.G. The potential impacts of insecticides on the life-history traits of bees and the consequences for pollination. Basic Appl. Ecol. 2011, 12, 321–331. [Google Scholar] [CrossRef]
  6. Carvalheiro, L.G.; Kunin, W.E.; Keil, P.; Aguirre-Gutiérrez, J.; Ellis, W.N.; Fox, R.; Groom, Q.; Hennekens, S.; Van Landuyt, W.; Maes, D.; et al. Species richness declines and biotic homogenisation have slowed down for NW-European pollinators and plants. Ecol. Lett. 2013, 16, 870–878. [Google Scholar] [CrossRef] [PubMed]
  7. Kennedy, C.M.; Lonsdorf, E.; Neel, M.C.; Williams, N.M.; Ricketts, T.H.; Winfree, R.; Bommarco, R.; Brittain, C.; Burley, A.L.; Cariveau, D.; et al. A global quantitative synthesis of local and landscape effects on wild bee pollinators in agroecosystems. Ecol. Lett. 2013, 16, 584–599. [Google Scholar] [CrossRef] [PubMed] [Green Version]
  8. Goulson, D.; Nicholls, E.; Botias, C.; Rotheray, E.L. Bee declines driven by combined stress from parasites, pesticides, and lack of flowers. Science 2015, 347, 1255957. [Google Scholar] [CrossRef] [PubMed]
  9. Koh, I.; Lonsdorf, E.V.; Williams, N.M.; Brittain, C.; Isaacs, R.; Gibbs, J.; Ricketts, T.H. Modeling the status, trends, and impacts of wild bee abundance in the United States. Proc. Natl. Acad. Sci. USA 2016, 113, 140–145. [Google Scholar] [CrossRef] [PubMed]
  10. Kremen, C.; Miles, A. Ecosystem services in biologically diversified versus conventional farming systems: Benefits, externalities, and trade-offs. Ecol. Soc. 2012, 17, 388–395. [Google Scholar] [CrossRef]
  11. Garibaldi, L.A.; Steffan-Dewenter, I.; Winfree, R.; Aizen, M.A.; Bommarco, R.; Cunningham, S.A.; Kremen, C.; Carvalheiro, L.G.; Harder, L.D.; Afik, O.; et al. Wild pollinators enhance fruit set of crops regardless of honey bee abundance. Science 2013, 339, 1608–1611. [Google Scholar] [CrossRef] [PubMed]
  12. Morandin, L.A.; Kremen, C. Hedgerow restoration promotes pollinator populations and exports native bees to adjacent fields. Ecol. Appl. 2013, 23, 829–839. [Google Scholar] [CrossRef] [PubMed] [Green Version]
  13. Blaauw, B.R.; Isaacs, R. Larger patches of diverse floral resources increase insect pollinator density, diversity, and their pollination of native wildflowers. Basic Appl. Ecol. 2014, 15, 701–711. [Google Scholar] [CrossRef]
  14. Ponisio, L.C.; M’Gonigle, L.K.; Kremen, C. On-farm habitat restoration counters biotic homogenization in intensively managed agriculture. Glob. Chang. Biol. 2016, 22, 704–715. [Google Scholar] [CrossRef] [PubMed]
  15. Park, M.G.; Blitzer, E.J.; Gibbs, J.; Losey, J.E.; Danforth, B.N. Negative effects of pesticides on wild bee communities can be buffered by landscape context. Proc. Natl. Acad. Sci. USA 2015, 282, 20150299. [Google Scholar] [CrossRef] [PubMed] [Green Version]
  16. Joshi, N.K.; Otieno, M.; Rajotte, E.G.; Fleischer, S.J.; Biddinger, D.J. Proximity to woodland and landscape structure drives pollinator visitation in apple orchard ecosystem. Front. Ecol. Evol. 2016, 4, 38. [Google Scholar] [CrossRef]
  17. Williams, N.M.; Ward, K.L.; Pope, N.; Isaacs, R.; Wilson, J.; May, E.A.; Ellis, J.; Daniels, J.; Pence, A.; Ullmann, K.; et al. Native wildflower plantings support wild bee abundance and diversity in agricultural landscapes across the United States. Ecol. Appl. 2015, 25, 2119–2131. [Google Scholar] [CrossRef] [PubMed]
  18. Francis, C.A.; Hansen, T.E.; Fox, A.A.; Hesje, P.J.; Nelson, H.E.; Lawseth, A.E.; English, A. Farmland conversion to non-agricultural uses in the US and Canada: Current impacts and concerns for the future. Int. J. Agric. Sustain. 2012, 10, 8–24. [Google Scholar] [CrossRef]
  19. Condon, P.M.; Mullinix, K.; Fallick, A.; Harcourt, M. Agriculture on the edge: Strategies to abate urban encroachment onto agricultural lands by promoting viable human-scale agriculture as an integral element of urbanization. Int. J. Agric. Sustain. 2010, 8, 104–115. [Google Scholar] [CrossRef]
  20. McKinney, M.L. Urbanization as a major cause of biotic homogenization. Biol. Conserv. 2006, 127, 247–260. [Google Scholar] [CrossRef]
  21. Fetridge, E.J.; Ascher, J.S.; Langellotto, G.A. The bee fauna of residential gardens in a suburb of New York City (Hymenoptera: Apoidea). Ann. Entomol. Soc. Am. 2008, 101, 1067–1077. [Google Scholar] [CrossRef]
  22. Matteson, K.C.; Ascher, J.S.; Langellotto, G.A. Bee richness and abundance in New York City urban gardens. Ann. Entomol. Soc. Am. 2008, 101, 140–150. [Google Scholar] [CrossRef]
  23. Frankie, G.W.; Thorp, R.W.; Pawelek, J.C.; Hernandez, J.; Coville, R. Urban bee diversity in a small residential garden in northern California. J. Hymenopt. Res. 2009, 18, 368–379. Available online: http://biostor.org/reference/111478 (accessed on 13 April 2018).
  24. Pawelek, J.C.; Frankie, G.W.; Thorp, R.W.; Przybylski, M. Modification of a community garden to attract native bee pollinators in urban San Luis Obispo, California. Cities Environ. 2009, 2. Article 7. Available online: http://digitalcommons.lmu.edu/cate/vol2/iss1/7 (accessed on 13 April 2018). [CrossRef]
  25. Pardee, G.L.; Philpott, S.M. Native plants are the bee’s knees: Local and landscape predictors of bee richness and abundance in backyard gardens. Urban Ecosyst. 2014, 17, 641–659. [Google Scholar] [CrossRef]
  26. Baldock, K.C.R.; Goddard, M.A.; Hicks, D.M.; Kunin, W.E.; Mitschunas, N.; Osgathorpe, L.M.; Potts, S.G.; Robertson, K.M.; Scott, A.V.; Stone, G.N.; et al. Where Is the UK’s pollinator biodiversity? the importance of urban areas for flower-visiting insects. Proc. Biol. Sci. 2015, 282, 20142849. [Google Scholar] [CrossRef] [PubMed]
  27. Sirohi, M.H.; Jackson, J.; Edwards, M.; Ollerton, J. Diversity and abundance of solitary and primitively eusocial bees in an urban centre: A case study from Northampton (England). J. Insect Conserv. 2015, 19, 487–500. [Google Scholar] [CrossRef]
  28. Osborne, J.L.; Martin, A.P.; Shortall, C.R.; Todd, A.D.; Goulson, D.; Knight, M.E.; Hale, R.J.; Sanderson, R.A. Quantifying and comparing bumblebee nest densities in gardens and countryside habitats. J. Appl. Ecol. 2007, 45, 784–792. [Google Scholar] [CrossRef] [Green Version]
  29. Goulson, D.; Lepais, O.; O’Connor, S.; Osborne, J.L.; Sanderson, R.A.; Cussans, J.; Goffe, L.; Darvill, B. Effects of land use at a landscape scale on bumblebee nest density and survival. J. Appl. Ecol. 2010, 47, 1207–1215. [Google Scholar] [CrossRef] [Green Version]
  30. Wojcik, V.A.; McBride, J.R. Common factors influence bee foraging in urban and wildland landscapes. Urban Ecosyst. 2012, 15, 581–598. [Google Scholar] [CrossRef]
  31. Angold, P.G.; Sadler, J.P.; Hill, M.O.; Pullin, A.; Rushton, S.; Austin, K.; Small, E.; Wood, B.; Wadsworth, R.; Sanderson, R.; et al. Biodiversity in urban habitat patches. Sci. Total Environ. 2006, 360, 196–204. [Google Scholar] [CrossRef] [PubMed]
  32. Hope, D.; Gries, C.; Zhu, W.; Fagan, W.F.; Redman, C.L.; Grimm, N.B.; Nelson, A.L.; Martin, C.; Kinzig, A. Socioeconomics drive urban plant diversity. Proc. Natl. Acad. Sci. USA 2003, 100, 8788–8792. [Google Scholar] [CrossRef] [PubMed] [Green Version]
  33. Grove, J.M.; Troy, A.R.; O’Neil-Dunne, J.P.M.; Burch, W.R.; Cadenasso, M.L.; Pickett, S.T.A. Characterization of households and its implications for the vegetation of urban ecosystems. Ecosystems 2006, 9, 578–597. [Google Scholar] [CrossRef]
  34. Grimm, N.B.; Faeth, S.H.; Golubiewski, N.E.; Redman, C.L.; Wu, J.; Bai, X.; Briggs, J.M. Global change and the ecology of cities. Science 2008, 319, 756–760. [Google Scholar] [CrossRef] [PubMed]
  35. Jarosz, L. The city in the country: Growing alternative food networks in metropolitan areas. J. Rural Stud. 2008, 24, 231–244. [Google Scholar] [CrossRef]
  36. Kaluza, B.F.; Wallace, H.; Heard, T.A.; Klein, A.-M.; Leonhardt, S.D. Urban gardens promote bee foraging over natural habitats and plantations. Ecol. Evol. 2016, 6, 1304–1316. [Google Scholar] [CrossRef] [PubMed] [Green Version]
  37. Somme, L.; Moquet, L.; Quinet, M.; Vanderplanck, M.; Michez, D.; Lognay, G.; Jacquemart, A.-L. Food in a row: Urban trees offer valuable floral resources to pollinating insects. Urban Ecosyst. 2016, 19, 1149–1161. [Google Scholar] [CrossRef]
  38. David, A.; Botías, C.; Abdul-Sada, A.; Nicholls, E.; Rotheray, E.L.; Hill, E.M.; Goulson, D. Widespread contamination of wildflower and bee-collected pollen with complex mixtures of neonicotinoids and fungicides commonly applied to crops. Environ. Int. 2016, 88, 169–178. [Google Scholar] [CrossRef] [PubMed] [Green Version]
  39. Cane, J.H.; Minckley, R.L.; Kervin, L.J.; Roulston, T.H.; Neal, M. Complex responses within a desert bee guild ( Hymenoptera: Apiformes) to urban habitat fragmentation. Ecol. Appl. 2006, 16, 632–644. [Google Scholar] [CrossRef]
  40. Carré, G.; Roche, P.; Chifflet, R.; Morison, N.; Bommarco, R.; Harrison-Cripps, J.; Krewenka, K.; Potts, S.G.; Roberts, S.P.M.; Rodet, G.; et al. Landscape context and habitat type as drivers of bee diversity in European annual crops. Agric. Ecosyst. Environ. 2009, 133, 40–47. [Google Scholar] [CrossRef]
  41. Matteson, K.C.; Langellotto, G.A. Bumble bee abundance in New York City community gardens: Implications for urban agriculture. Cities Environ. 2009, 2. Article 5. Available online: http://digitalcommons.lmu.edu/cate/vol2/iss1/5 (accessed on 13 April 2018). [CrossRef]
  42. Lowenstein, D.M.; Matteson, K.C.; Minor, E.S. Diversity of wild bees supports pollination services in an urbanized landscape. Oecologia 2015, 179, 811–821. [Google Scholar] [CrossRef] [PubMed]
  43. Potter, A.; LeBuhn, G. Pollination service to urban agriculture in San Francisco, CA. Urban Ecosyst. 2015, 18, 885–893. [Google Scholar] [CrossRef]
  44. Ackerman, K.; Conard, M.; Culligan, P.; Plunz, R.; Sutto, M.-P.; Whittinghill, L. Sustainable food systems for future cities: The potential of urban agriculture. Econ. Soc. Rev. 2014, 45, 189–206. Available online: http://www.esr.ie/article/view/136 (accessed on 13 April 2018).
  45. Moore, L.J.; Kosut, M. Buzz: Urban Beekeeping and the Power of the Bee; New York University Press: New York, NY, USA; London, UK, 2013. [Google Scholar]
  46. Edmunds, B.; Little, R.; Sagilli, R. Nurturing Mason Bees in Your Backyard in Western Oregon; Extension Service: Corvallis, OR, USA, 2016. [Google Scholar]
  47. Kreyer, D.; Oed, A.; Walther-Hellwig, K.; Frankl, R. Are forests potential landscape barriers for foraging bumblebees? Landscape scale experiments with Bombus terrestris agg. and Bombus pascuorum (Hymenoptera, Apidae). Biol. Conserv. 2004, 116, 111–118. [Google Scholar] [CrossRef]
  48. Krewenka, K.M.; Holzschuh, A.; Tscharntke, T.; Dormann, C.F. Landscape elements as potential barriers and corriders for bees, wasps and parasitoids. Biol. Conserv. 2011, 144, 1816–1825. [Google Scholar] [CrossRef]
  49. Bhattacharya, M.; Primack, R.B.; Gerwing, J. Are roads and railroads barriers to bumblebee movement in a temperate suburban conservation area? Biol. Conserv. 2003, 109, 37–45. [Google Scholar] [CrossRef]
  50. McClintock, N.; Young, J.; Santos, J.; Evans, T.; Simpson, M. Periodic atlas of the metroscape: Food production. In Metroscape; Institute of Portland Metropolitan Studies, Portland State University: Portland, OR, USA, 2013; pp. 13–19. [Google Scholar]
  51. Zillow. Available online: https://www.zillow.com/ (accessed on 3 April 2018).
  52. Cane, J.H. Estimation of bee body size using intertegula span (Apoidea). J. Kansas Entomol. Soc. 1987, 60, 145–147. [Google Scholar]
  53. Greenleaf, S.S.; Williams, N.M.; Winfree, R.; Kremen, C. Bee foraging ranges and their relationship to body size. Oecologia 2007, 153, 589–596. [Google Scholar] [CrossRef] [PubMed]
  54. Environmental Systems Research Institute, (ESRI). ArcGIS Release 10.6; Environmental Systems Research Institute, (ESRI): Redlands, CA, USA, 2018. [Google Scholar]
  55. USDA National Agricultural Statistics Service Cropland Data Layer; USDA-NASS: Washington, DC, USA, 2018. Available online: https://nassgeodata.gmu.edu/CropScape/ (accessed on 14 March 2018).
  56. Kleijn, D.; Winfree, R.; Bartomeus, I.; Carvalheiro, L.G.; Henry, M.; Isaacs, R.; Klein, A.M.; Kremen, C.; M’Gonigle, L.K.; Rader, R.; et al. Delivery of crop pollination services is an insufficient argument for wild pollinator conservation. Nat. Commun. 2015, 6, 7414. [Google Scholar] [CrossRef] [PubMed] [Green Version]
  57. Oberholtzer, L.; Dimitri, C.; Pressman, A. Urban agriculture in the United States: Characteristics, challenges, and technical assistance needs. J. Ext. 2014, 52, 6FEA1. Available online: https://joe.org/joe/2014december/a1.php (accessed on 16 April 2018).
  58. Taylor, J.R.; Lovell, S.T. Mapping public and private spaces of urban agriculture in Chicago through the analysis of high-resolution aerial images in Google Earth. Landsc. Urban Plan. 2012, 108, 57–70. [Google Scholar] [CrossRef]
  59. McClintock, N.; Mahmoudi, D.; Simpson, M.; Santos, J.P. Socio-spatial differentiation in the sustainable city: A mixed-methods assessment of residential gardens in metropolitan Portland, Oregon, USA. Landsc. Urban Plan. 2016, 148, 1–16. [Google Scholar] [CrossRef]
  60. Harvey, T.; Works, M.A. Urban sprawl and rural landscapes: Perceptions of landscape as amenity in Portland, Oregon. Local Environ. 2002, 7, 381–396. [Google Scholar] [CrossRef]
  61. Chun, N. An emerging contradiction: Non-farm activity within exclusive farm use zones. In Metroscap; Institute of Portland Metropolitan Studies, Portland State University: Portland, OR, USA, 2018; Available online: https://metroscape.imspdx.org/an-emerging-contradiction-non-farm-activity-within-exclusive-farm-use-zones (accessed on 16 April 2018).
  62. Schtickzelle, N.; Baguette, M. Behavioural responses to habitat patch boundaries restrict dispersal and generate emigration-patch area relationships in fragmented landscapes. J. Anim. Ecol. 2003, 72, 533–545. [Google Scholar] [CrossRef] [Green Version]
  63. Krauss, J.; Alfert, T.; Steffan-Dewenter, I. Habitat area but not habitat age determines wild bee richness in limestone quarries. J. Appl. Ecol. 2009, 46, 194–202. [Google Scholar] [CrossRef] [Green Version]
  64. Winfree, R.; Dushoff, J.; Crone, E.E.; Schultz, C.B.; Budny, R.V.; Williams, N.M.; Kremen, C. Testing simple indices of habitat proximity. Am. Nat. 2005, 165, 707–717. [Google Scholar] [CrossRef] [PubMed]
  65. Kremen, C.; Williams, N.M.; Bugg, R.L.; Fay, J.P.; Thorp, R.W. The area requirements of an ecosystem service: Crop pollination by native bee communities in California. Ecol. Lett. 2004, 7, 1109–1119. [Google Scholar] [CrossRef]
  66. Zurbuchen, A.; Landert, L.; Klaiber, J.; Müller, A.; Hein, S.; Dorn, S. Maximum foraging ranges in solitary bees: Only few individuals have the capability to cover long foraging distances. Biol. Conserv. 2010, 143, 669–676. [Google Scholar] [CrossRef]
  67. Beekman, M.; Ratnieks, F.L.W. Long-range foraging by the honey-bee, Apis mellifera L. Funct. Ecol. 2000, 14, 490–496. [Google Scholar] [CrossRef]
  68. Osborne, J.L.; Martin, A.P.; Carreck, N.L.; Swain, J.L.; Knight, M.E.; Goulson, D.; Hale, R.J.; Sanderson, R.A. Bumblebee flight distances in relation to the forage landscape. J. Anim. Ecol. 2008, 77, 406–415. [Google Scholar] [CrossRef] [PubMed] [Green Version]
  69. Leong, M.; Ponisio, L.C.; Kremen, C.; Thorp, R.W.; Roderick, G.K. Temporal dynamics influenced by global change: Bee community phenology in urban, agricultural, and natural landscapes. Glob. Chang. Biol. 2016, 22, 1046–1053. [Google Scholar] [CrossRef] [PubMed]
  70. McFrederick, W.S.; LeBuhn, G. Are urban parks refuges for bumble bees Bombus spp. (Hymenoptera: Apidae)? Biol. Conserv. 2006, 129, 372–382. [Google Scholar] [CrossRef]
  71. Ahrné, K.; Bengtsson, J.; Elmqvist, T. Bumble bees (Bombus spp.) along a gradient of increasing urbanization. PLoS ONE 2009, 4, e5574. [Google Scholar] [CrossRef] [PubMed]
  72. Melathopoulos, A.P.; Rodia, R.; Holt, J.; Sagili, R. Residential Beekeeping: Best-practice Guidelines for Nuisance-free Beekeeping in Oregon; Oregon State University: Corvallis, OR, USA, 2018; EM9186. [Google Scholar]
  73. Winter Bee Losses of Oregon Backyard Beekeepers, 2018. Available online: http://www.webcitation.org/706hgm01U (accessed on 11 June 2018).
  74. Matteson, K.C.; Langellotto, G.A. Evaluating community gardens as habitat for an urban butterfly. Cities Environ. 2012, 5. Article 10. Available online: http://digitalcommons.lmu.edu/cate/vol5/iss1/10 (accessed on 16 April 2018). [CrossRef]
  75. Hennig, E.I.; Ghazoul, J. Pollinating animals in the urban environment. Urban Ecosyst. 2012, 15, 149–166. [Google Scholar] [CrossRef]
  76. Heinrich, B. Do bumblebees forage optimally, and does it matter? Am. Zool. 1983, 23, 273–281. [Google Scholar] [CrossRef]
  77. Hicks, D.M.; Ouvrard, P.; Baldock, K.C.R.; Baude, M.; Goddard, M.A.; Kunin, W.E.; Mitschunas, N.; Memmott, J.; Morse, H.; Nikolitsi, M.; et al. Food for pollinators: Quantifying the nectar and pollen resources of urban flower meadows. PLoS ONE 2016, 11, e0158117. [Google Scholar] [CrossRef] [PubMed]
  78. Hall, D.M.; Camilo, G.R.; Tonietto, R.K.; Ollerton, J.; Ahrné, K.; Arduser, M.; Ascher, J.S.; Baldock, K.C.R.; Fowler, R.; Frankie, G.; et al. The city as a refuge for insect pollinators. Conserv. Biol. 2017, 31, 24–29. [Google Scholar] [CrossRef] [PubMed] [Green Version]
  79. López-Uribe, M.M.; Oi, C.A.; Del Lama, M.A. Nectar-foraging behavior of Euglossine bees (Hymenoptera: Apidae) in urban areas. Apidologie 2008, 39, 410–418. [Google Scholar] [CrossRef] [Green Version]
  80. Real, L.A. Uncertainty and pollinator-plant interactions: The foraging behavior of bees and wasps on artificial flowers. Ecology 1981, 62, 20–26. [Google Scholar] [CrossRef]
  81. Bennett, J.A.; Gensler, G.C.; Cahill, J.F., Jr. Small-scale bee patch use is affected equally by flower availability and local habitat configuration. Basic Appl. Ecol. 2014, 15, 260–268. [Google Scholar] [CrossRef]
  82. Sharp, J.; Smith, M. Social capital and farming at the rural–urban interface: The importance of nonfarmer and farmer relations. Agric. Syst. 2003, 76, 913–927. [Google Scholar] [CrossRef]
  83. Hanes, S.P.; Collum, K.K.; Hoshide, A.K.; Asare, E. Grower perceptions of native pollinators and pollination strategies in the lowbush blueberry industry. Renew. Agric. Food Syst. 2015, 30, 124–131. [Google Scholar] [CrossRef]
  84. Wilson, J.S.; Forister, M.L.; Carril, O.M. Interest exceeds understanding in public support of bee conservation. Front. Ecol. Environ. 2017, 15, 460–466. [Google Scholar] [CrossRef] [Green Version]
  85. Wu, J.; Jenerette, G.D.; Buyantuyev, A.; Redman, C.L. Quantifying spatiotemporal patterns of urbanization: The case of the two fastest growing metropolitan regions in the United States. Ecol. Complex. 2011, 8, 1–8. [Google Scholar] [CrossRef]
  86. Fahrig, L. Effects of habitat fragmentation on biodiversity. Annu. Rev. Ecol. Evol. Syst. 2003, 34, 487–515. [Google Scholar] [CrossRef]
  87. Müller, N.; Ignatieva, M.; Nilon, C.H.; Werner, P.; Zipperer, W.C. Patterns and Trends in Urban Biodiversity and Landscape Design. In Urbanization, Biodiversity and Ecosystem Services: Challenges and Opportunities; Springer: Dordrecht, The Netherlands, 2013; pp. 123–174. ISBN 978-94-007-7088-1. [Google Scholar] [Green Version]
  88. McKinney, M.L. Urbanization, biodiversity, and conservation: The impacts of urbanization on native species are poorly studied, but educating a highly urbanized human population about these impacts can greatly improve species conservation in all ecosystems. Bioscience 2002, 52, 883–890. [Google Scholar] [CrossRef]
  89. Kareiva, P.; Watts, S.; McDonald, R.; Boucher, T. Domesticated nature: Shaping landscapes and ecosystems for human welfare. Science 2007, 316, 1866–1869. [Google Scholar] [CrossRef] [PubMed]
Figure 1. Location of study gardens, within the Portland Metropolitan area. The city boundaries mark (from north to south) the cities of Portland, West Linn, Aurora, and Woodburn, Oregon.
Sustainability 10 02047 g001
Figure 2. Box and whisker plots of (A) percent of garden bees with minimum, typical foraging distances of 250 m, 500 m, and 1000 m; and (B) land area planted to pollination dependent crops (m2); (C) number of gardens; and (D) land area planted as residential food gardens (m2) within circular buffers with radii of 250 m, 500 m, and 1000 m surrounding study gardens. Box and whisker plots represent (from center, outwards) the median (center line), upper and lower quartiles (boxes), upper and lower 90% confidence intervals (error bars), and upper and lower 95% confidence intervals (points).
Sustainability 10 02047 g002

