Article

Antecedents for College Students’ Environmentally Responsible Behavior: Implications for Collective Impact and Sustainable Tourism

1
Business College of Taihu University of Wuxi, Wuxi 214064, China
2
Tourism College of Beijing Union University, Beijing 100101, China
*
Author to whom correspondence should be addressed.
Sustainability 2018, 10(6), 2024; https://doi.org/10.3390/su10062024
Submission received: 20 May 2018 / Revised: 8 June 2018 / Accepted: 10 June 2018 / Published: 15 June 2018
(This article belongs to the Special Issue Collective Impact and Sustainable Tourism)

Abstract

:
With the advent of mass tourism, tourism-related environmental problems are often reported in the news media. Tourists’ environmentally responsible behaviors (TERB) are critical for solving tourism environmental problems. This study argues that college students are a critical source of collective impact for tourism sustainability, and examines chained relationships that might determine college student TERB. Five hundred and twenty-five (525) college tourists were surveyed. Structural equation modeling was used to determine the relationships among the variables and the mediating effects. Results confirmed our proposed relationships of chained influences from tourism destination image (as key information) to tourist expectation (as cognition), to perceived quality and value (as experiences), to tourist satisfaction, loyalty, and complaints (as emotional reflection), and finally to TERB. Such results shed light on TERB education and construction, as well as on the collective impact for sustainable tourism.

1. Introduction

With the development of economics, transportation networks, and increased leisure time, the tourism industry is developing vigorously. However, environmental problems correlated with tourists are increasingly obvious. For example, in many tourism destinations, trash is thrown everywhere, grass is walked on, trees are climbed and wrecked, historic and cultural buildings and statues are painted and scratched, etc. Environmental ecosystems and other ecological elements (such as soil, vegetation, water, and wild animals) suffer from some unprecedented changes. Tourism destination environmental protection is becoming a practical problem for sustainable tourism.
Usually, tourists are treated as troublemakers rather than problem-solvers. Nonetheless, tourists can also be an untapped resource for solving tourism environment problems by conducting tourism environmentally responsible behavior (TERB) [1]. Environmentally responsible behavior (ERB) refers to advocating sustainable development or reducing the use of natural resources [2] or undertaking some behavior willingly to minimize the negative impact on environment [3], including persuading others’ to forego environmentally unfriendly behaviors, recycle, and reuse waste. Therefore, exploring the influencing factors of TERB is an important issue in the field of tourism sustainable development.
Most evident is the concept of “collective impact” which has potential to be applied in tourism research and practices. Collective impact refers to the positive situation that actors of multiple sectors committing themselves seriously to providing solutions to social problems such as the harmful tourist behavior mentioned, with the premise of a well-designed collaborative working arrangement [4]. In such a premise, if tourists from different areas (geographical, professional, social, cultural areas etc.) can conduct ecologically friendly behaviors collectively, collective impact can be achieved for more sustainable tourism.
Put differently, the better we understand those actors with a will for TERB, the better we can achieve collective impact in tourism sustainability. However, who fits the definition of actors from different sectors contributing their collective impact for tourism environmental sustainability? A good way to resolve this question scientifically is to research college students’ TERB and its antecedents. College students are educated for future careers. They enter different sectors in society after graduation. Thus, college students are important human capital that may contribute greatly towards achieving collective impact for TERB.
Moreover, despite previous research on TERB from the perspectives of situational factors, demographic characteristics, social norms, personal green knowledge, etc., studies based on college students’ emotional reflections—namely tourist satisfaction (TS), tourist loyalty (TL), and tourist complaint (TC)—are scarce. Mostly, the TERB which has been explored is rational behavior, because it arises from tourists’ attributes, group common norms, and situational factors. However, tourists, especially pre-mature tourists such as those from colleges, have their own emotions when travelling. As pointed out by [5], TERB is a result of personal interests and prosocial motivation, and that context is a factor in tourism destinations. Therefore, this study is interested in investigating emotional reflection, its antecedents, and its influences on TERB. The research framework of this study is presented in Figure 1.

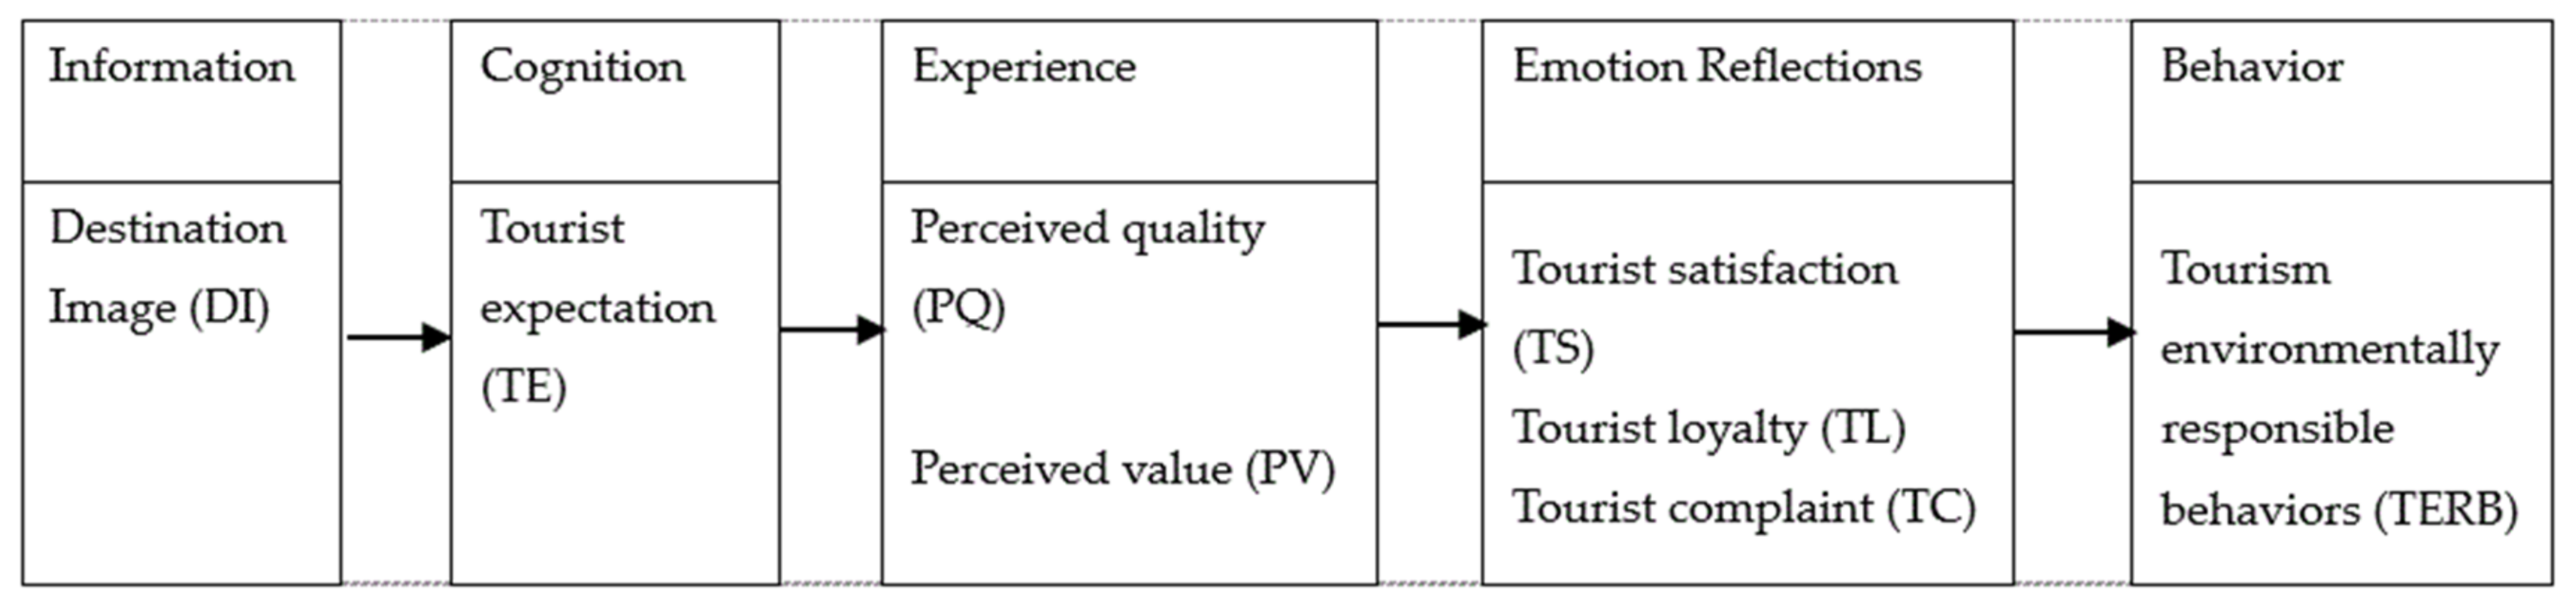
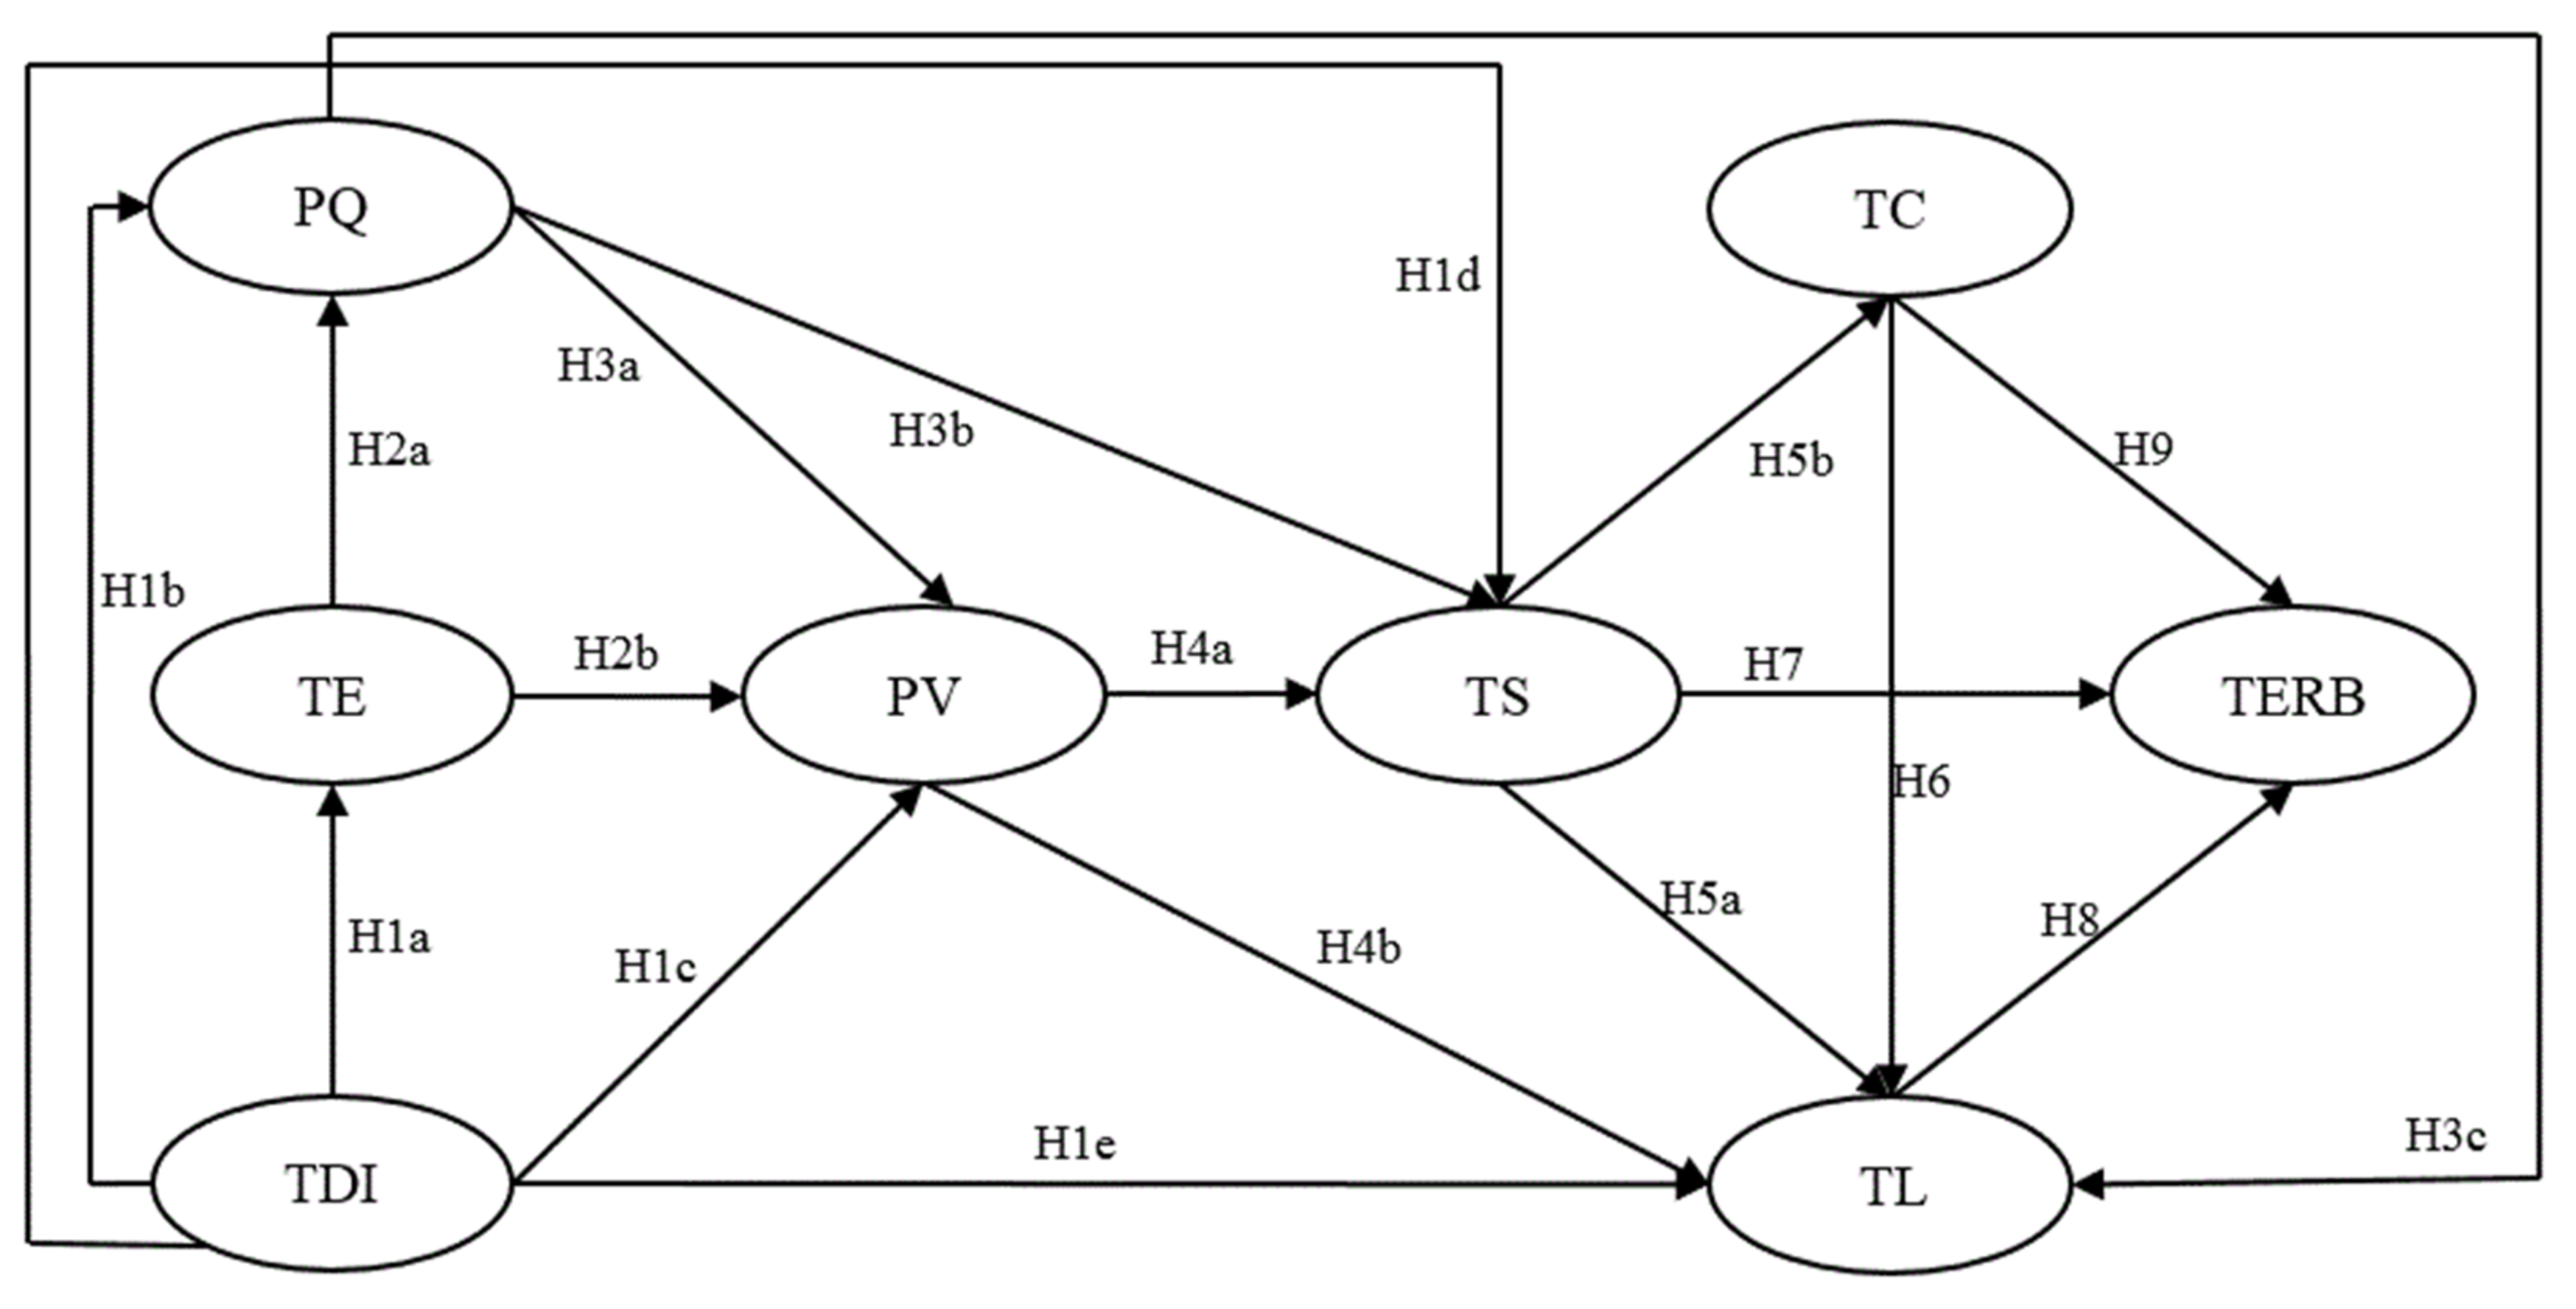
2. Literature Review and Hypotheses

2.1. The Relationship between Tourist Satisfaction, Tourist Loyalty, and Tourist Complaint

Tourism destination image (TDI) refers to the impression of tourism destinations. Tourist expectation (TE) refers to tourists’ expectations for tourism destinations. Perceived quality (PQ) refers to the actual perceptions of tourists to tourism products and services in tourism destinations. Perceived value (PV) refers to the subjective feeling of tourists after judging the quality and cost of tourism products and services. Tourism satisfaction (TS) refers to positive feelings shown by tourists when tourism products and services meet expectations. Tourist loyalty (TL) refers to the willingness to recommend and repurchase tourism products and services. Tourist complaint (TC) refers to negative feelings shown by tourists when tourism products and services do not meet expectations.
Some studies have suggested that TDI is a premise of TE, and TE determines performance perception of tourism products and services or attribute satisfaction [6]; a high level of performance perception and satisfaction will cause the increase of TL [7]. Other studies suggested that TDI has a direct impact on tourist attributed satisfaction, that TDI and satisfaction directly affect the overall satisfaction, and attributed satisfaction and overall satisfaction in turn directly and positively affect TL [8]. Evidence also demonstrates that TDI has a positive impact on PV, TS, and TL; and the PV and TS also affect TL [9]; PV positively affects TS and TL [10]; PQ in tourism services has an impact on TS which in turn affects revisit intention and recommendation intention [11]. In Chinese studies, scholars have found that TDI has a positive influence on TE, PV and TL; TE has negative effects on PQ and PV; PQ is positively associated to PV and TS, PV is positively associated to TS, TS is positively associated to TL and negatively associated to TC, and TC is negatively associated to TL [12], these research results are supported by other Chinese scholars’ studies [13]. Moreover, scholars have pointed out that TDI has positive effects on PQ [14,15]. In addition, based on existing research, the following research hypotheses are proposed.
Hypothesis 1.
Tourist destination image has a significant impact on tourist expectation (H1a), perceived quality (H1b), perceived value (H1c), tourist satisfaction (H1d), and tourist loyalty (H1e).
Hypothesis 2.
Tourist expectation has a negative impact on perceived quality (H2a) and perceived value (H2b).
Hypothesis 3.
Perceived quality has a significant impact on perceived value (H3a), tourist satisfaction (H3b), and tourist loyalty (H3c).
Hypothesis 4.
Perceived value has a significant impact on tourist satisfaction (H4a), and tourist loyalty (H4b).
Hypothesis 5.
Tourist satisfaction has a significant impact on tourist loyalty (H5a) and a negative impact on tourist complaint (H5b).
Hypothesis 6.
Tourist complaint has a negative impact on tourist loyalty.

2.2. The Relationship of Tourist Satisfaction, Tourist Loyalty, Tourist Complaint with Environmental Responsibility Behavior

In the studies on ERB, most scholars in western countries have done a lot of research and put forward a series of theories, such as the environmental literacy model [16], planned behavior theory [17], the value-faith-specification theory [18], the ERB model [19] etc., which identified the impact of problem awareness, guilt, environmental attitude, subjective norm, social norm, behavioral control, moral responsibility perception, behavioral willingness towards ERB. Many scholars have explored the impact of individual philosophical beliefs, environment awareness, perceived control [1,20,21], environmental attitudes, place attachment [22,23], natural environment commitment [24], environment experience motivations [25,26], tourist experience, environment knowledge [27,28,29], guide services [21,30], and environmental education [31,32] on TERB.
The studies on TERB executed from the perspectives of TS, TL, and TC are scarce, and only a few scholars have made meaningful attempts in this field. The research of [33] indicated that tourist satisfaction positively affects TERB, and that tourists showing a higher level of satisfaction towards destinations are more likely to demonstrate positive behaviors, such as prevention or active protection for a given place. In addition, according to other researchers, tourists’ affective connections to destinations have a significant impact on TERB [22,23,32,34,35]. Tourists who have low cognitive satisfaction with TDI during travel [32], or stay in poorer destination environments, will readjust themselves to the imbalanced environments, executing environmentally unfriendly behaviors [36]. That is to say, when they complain about destinations, tourists will not demonstrate positive ERB. To explore the relationship between TL and TERB, 30 college tourists were interviewed, and among them, 90% argued that if they were willing to recommend or revisit some destinations, they will implement ERB, the reasons being that “if I have the willing of recommendation or revisit for a destination, it means I have special feelings for it” (F3, M6, F7, F9, M29), or “the feeling this destination gives is not found at other places, I am willing to guard this feeling in my heart silently” (M1, F5, M12, F27), so “when seeing other tourists damage the destination, I will prevent them” (M2, F4, M8, F11). This in-depth interview shows TL influence TERB positively. Based on this research, the following research hypotheses are formulated.
Hypothesis 7.
Tourist satisfaction has a significant impact on tourist environmentally responsible behavior.
Hypothesis 8.
Tourist loyalty has a significant impact on tourist environmentally responsible behavior.
Hypothesis 9.
Tourist complaint has a negative impact on tourist environmentally responsible behavior.
Figure 2 presents the theoretical model that will be tested in this study, which shows the hypotheses developed.

3. Methodology

3.1. Sample Selection

This study selected college students as sample objects. The reasons are as follows: first, there are many college students in China, and 95% of them have high willingness to travel. Secondly, college students will become the main customers and visitors of destinations in the future, so exploring TERB has prospective significance for the management of tourist behaviors. Thirdly, college students have high educational level as well as rich environmental knowledge, so if emotional reflections of college tourists have impacts on TERB, it suggests that the implementation of TERB should not only depend on environment knowledge and the rules and regulations of destinations, and tourist demands and expectation should be considered by operational and managerial agencies of destinations, which has significance for destinations’ management teams. Therefore, the college students regarded as sample objects are typical and representative in exploration of the influencing factors of TERB.

3.2. Measurement

This study used the TS scale developed by other researchers [7,8,9,10,11,12,14,15] to assess tourist satisfaction with specific domains including TDI, TE, PQ and PV. The instrument for measuring TERB was based on the scale developed by related researchers [5,22,23,32,34,35,36]. By consulting these existing relative scales, this study developed a new questionnaire for eight dimensions, including 43 questions: there were four items for TDI, four items for TE, fourteen items for PQ, four items for PV, five items for TS, four items for TL, two items for TC, and six items for TERB. A preliminary survey for this new questionnaire was undertaken via 50 college students to improve the reliability and validity of the study. In addition, after deleting ten items and modifying the expression of sentences according to the results of preliminary survey, this study determined final items for each dimension. TDI was measured by three items, TE by three items, PQ by ten items, PV by three items, TS by five items, TL by three items, TC by two items, and TERB by four items. All scales were based on a Likert 5-point scale, from “strongly disagree (1)” to “strongly agree (5)”.

3.3. Data Collection

Given that the causational factors of TERB may be not always related to tourism sites specific to college students, the data collection was via paper questionnaires distributed at Olympic forest park, Xiangshan Park, and temple of heaven, Old Summer Palace. Students were randomly selected by trained interviewees physically located in major tourism destinations mentioned in this paper. Data were collected from July to September 2017, and 571 questionnaires were distributed for college students who have travel experience. After removing questionnaires that only provides insufficient information, there were 525 valid questionnaires returned, for a valid return rate of 91.9%. There was no missing value. Skewness score is −1.99 (s.d. = 3.21) while kurtosis score is 1.90 (s.d. = 2.21), which means the z-score of skewness is −0.62 and z-score of kurtosis is 0.86, which represents acceptable data value distribution through skewness and kurtosis indices.

3.4. Measure Reliability and Validity Analysis

We used AMOS statistical software to perform major analyses. To measure correlation among the dimensions, this study conducted confirmation factor analysis and tested validity and reliability of the returned valid questionnaires. The data in Table 1 shows that the Cronbach’s α of each dimension lies in between 0.710 and 0.914, which reaches above 0.7, signifying the basic requirement of internal consistency [37]. In addition, factor loading falls in the range of 0.587–0.991, which is significant (p < 0.001) and matches the standard of 0.50–0.95, as suggested by [38]. Composite reliability (CR) of dimensions falls in the range of 0.747–0.914, which is above 0.60 [39], indicating good reliability of the constructs measured in this study [40]. Regarding the validity of scales, the corresponding t-value is between 5.480 and 16.453, which is larger than 1.96, and AVE falls in the range of 0.501–0.676, which is above 0.50 and reaches the standard; thus, the scale of this study has convergent validity [39]. In addition, the square roots of the AVE dimensions are above the correlation coefficients of pair dimensions (see Table 2). Therefore, the scale has good convergent validity and discriminant validity [39].

4. Results

4.1. Respondents’ Profile

There were more male than female respondents (51.92% compared with 48.08%). All respondents were 19 years or older, and among them, the majority were between 19 and 24 years old (79.46%), which generally represents the basic age group of college students in China. 64.16% of respondents were graduate students; postgraduate students and above accounted for 35.84%. In terms of source of respondents, interviewed college students were from thirty regions, including Beijing (49.43%), Henan province (8.47%), Tianjin (5.49%), Shanxi province (4.58%), Jiangsu province (3.89%), Zhejiang province (3.20%), Hebei province (2.97%), Anhui province (2.75%), Shandong province (2.52%), Guangdong province (2.52%), Hunan province (1.83%), Shanghai (1.60%), Chongqing (1.60%), Fujian province (1.14%) etc. Most respondents had more than three previous tourism experiences (65.4%).The profile of respondents is summarized in Table 3.

4.2. Structural Model
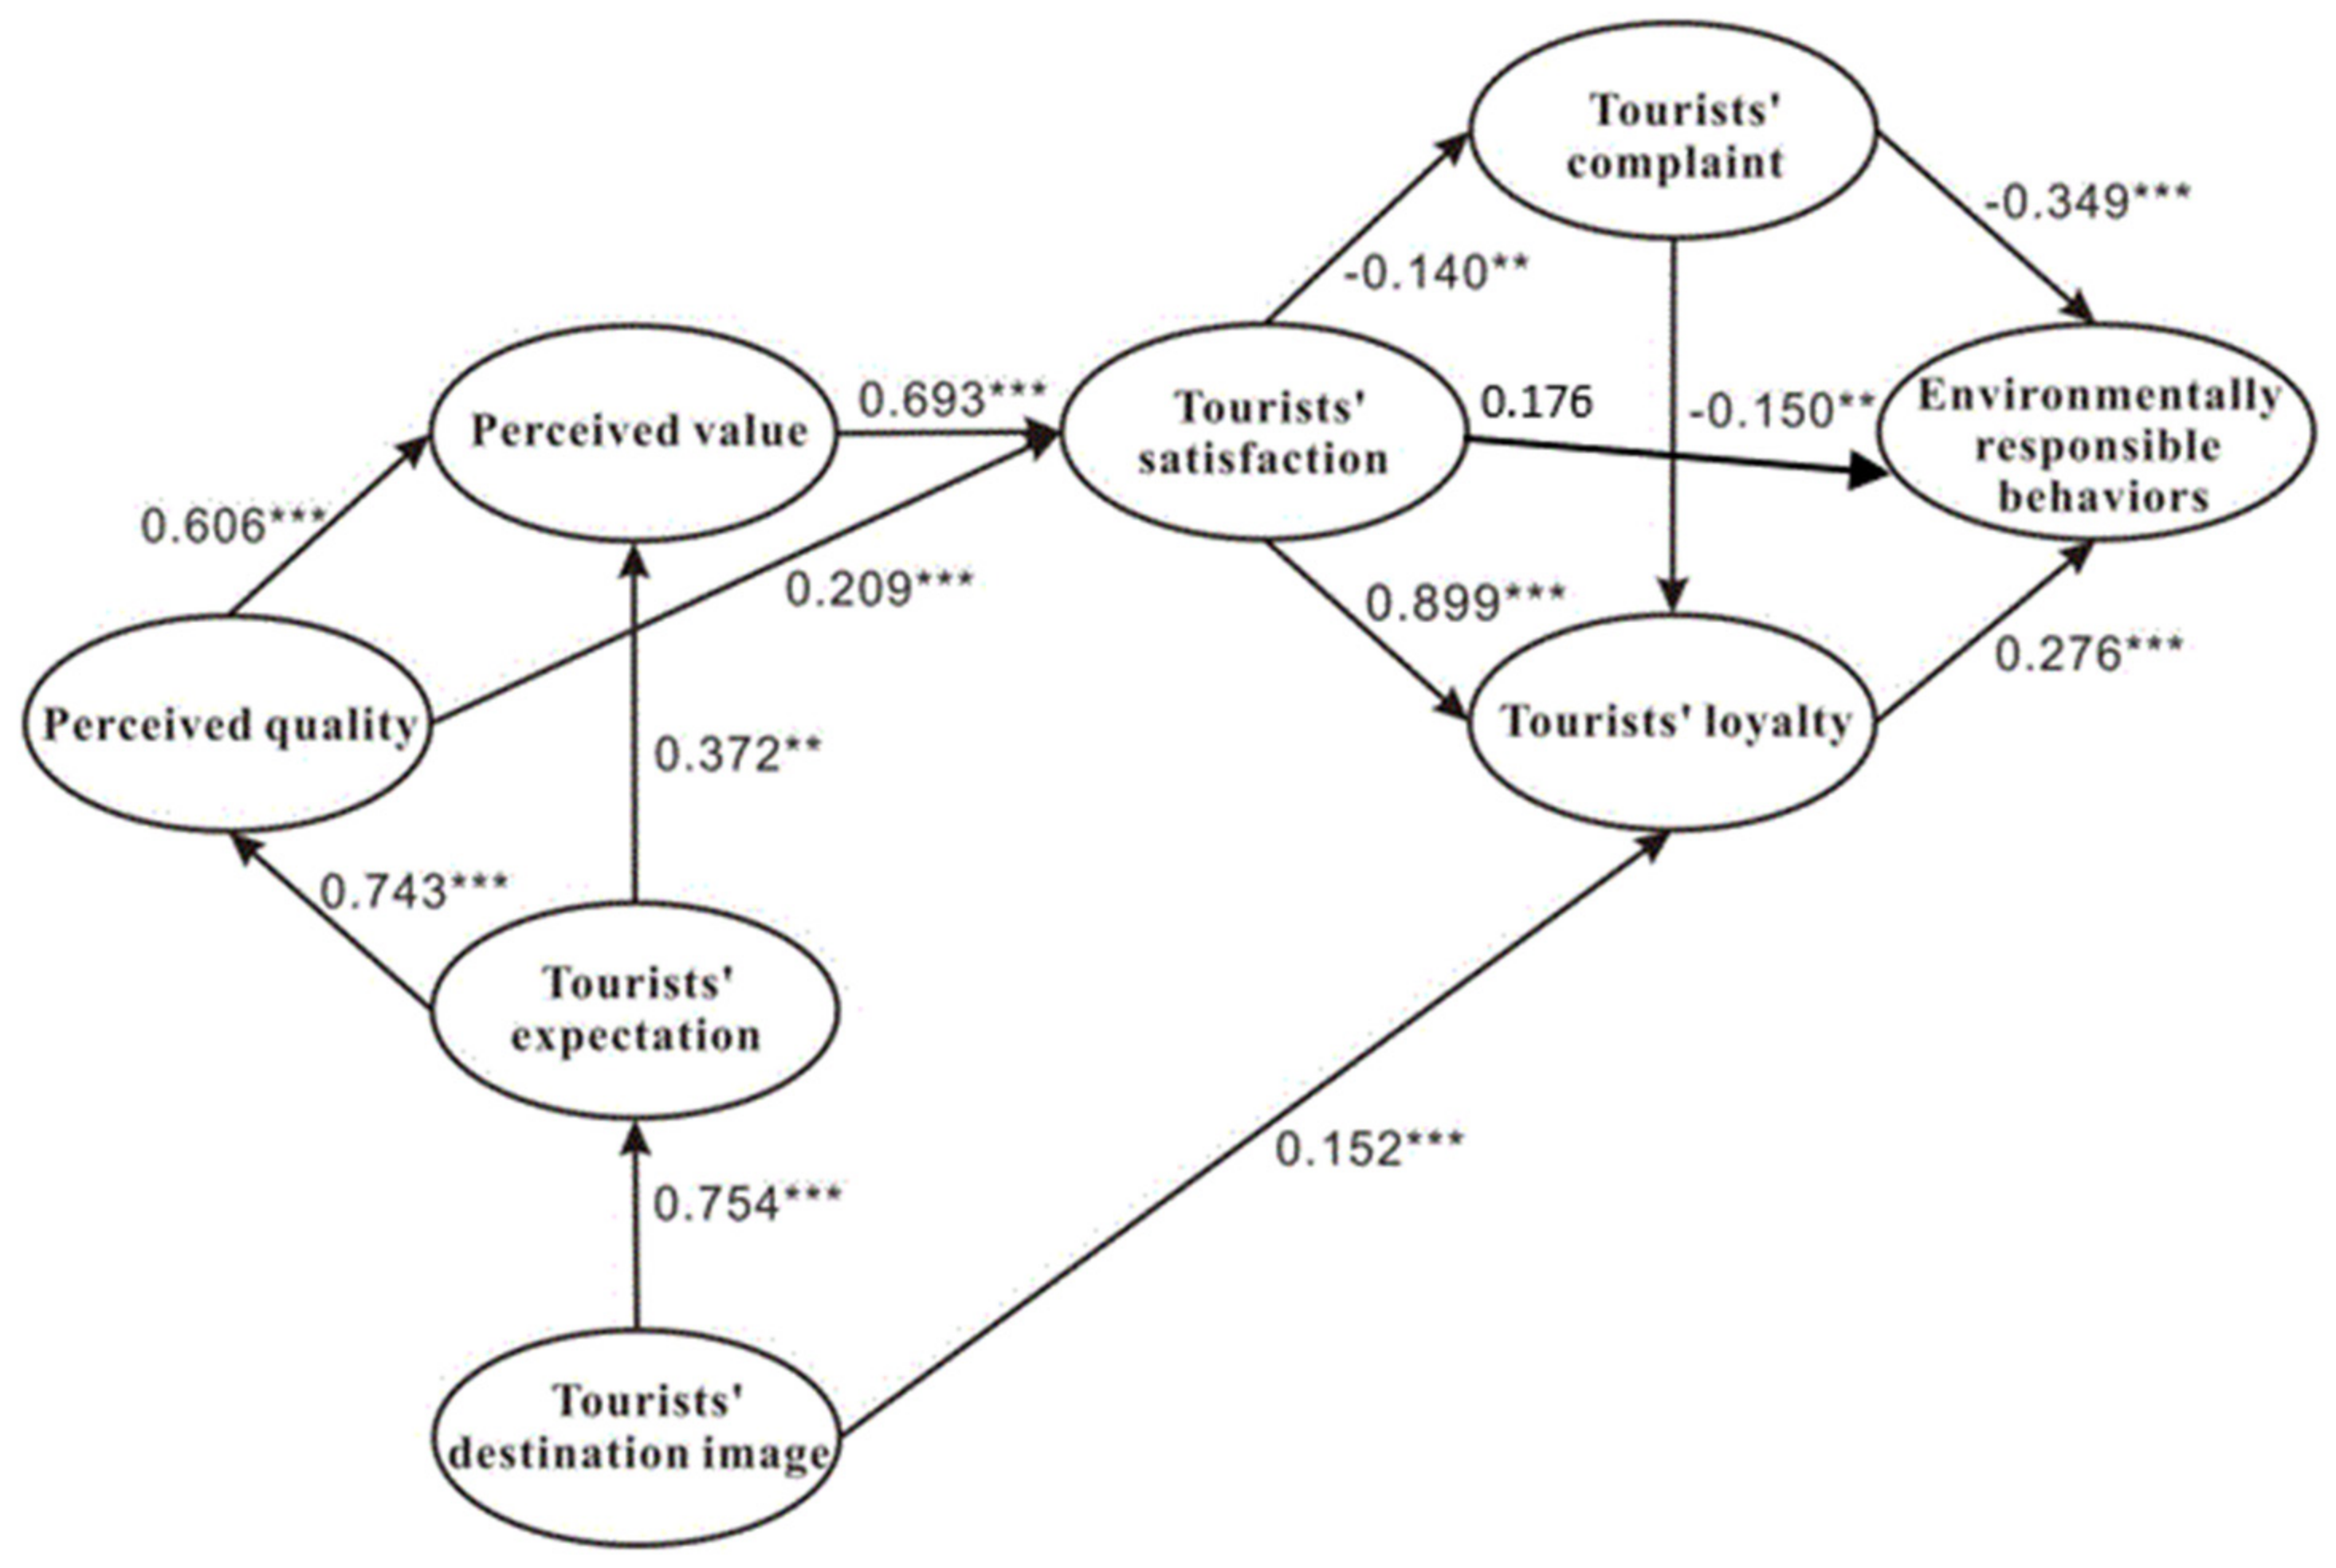
To measure the causal relationships between latent variables and observable variables, this study adopted structural equation modeling (SEM) and maximum likelihood estimation to estimate the correlations of variables in the proposed model. SEM was used to evaluate the influence of TDI, TE, PQ, PV, TS, TL, and TC on TERB. This study tested overall model goodness of fit, with the results as follows: NCI (X2/df) (normed chi-square index) = 1.771 (X2 = 843.191, df = 476, p = 0.000), GFI (goodness-of-fit index) = 0.961, AGFI (adjusted goodness of-fit index) = 0.936, TLI (Tucker-Lewis Index) = 0.910, NFI (normed fit index) = 0.927, IFI (incremental fit index) = 0.920, CFI (comparative fit index) = 0.919, RMR (root mean square residual) = 0.035, RMSEA (root mean square error of approximation) = 0.049. Please note that the model fit was achieved without removing any observed variable. The above figures satisfy the standard of fit, and demonstrate that the scales constructed by this study have goodness of fit (see Table 4).

4.3. Path Analysis

Among the eighteen hypotheses, twelve hypotheses’ paths are retained in the theoretical model (see Table 5). In Table 5, it can be found that, TDI significantly and positively influences TE (H1a) (β = 0.754 ***, t = 8.097, p < 0.01) and TL (H1e) (β = 0.152 ***, t =3.675, p < 0.01), which means that the parameter estimates of the paths are significant. H1a and H1e are supported. TE significantly and negatively influences PQ (H2a) (β = −0.743 ***, t = −4.003, p < 0.01) and PV (H2b) (β = −0.372 **, t = −2.829, p < 0.05). H2a and H2b are supported. PQ significantly and positively influences PV (H3a) (β = 0.606 ***, t = 5.252, p < 0.01) and TS (H3b) (β = 0.209 ***, t =3.684, p < 0.05). H3a and H3b are supported. PV positively and significantly influences TS (H4a) (β = 0.693 ***, t = 5.310, p < 0.01). H4a is supported. TS positively and significantly influences TL (H5a) (β = 0.899 ***, t = 5.577, p < 0.01) and negatively and significantly influences TC (H5b) (β = −0.140 **, t = −2.887, p < 0.05). H5a and H5b are supported. TC negatively and significantly influences TL (H6) (β = −0.150**, t = −2.919, p < 0.05). H6 is supported. TL positively and significantly influences TERB (H8) (β = 0.276 ***, t = 4.020, p < 0.05). H8 is supported. TC negatively and significantly influences TERB (H9) (β = −0.349 ***, t = −4.109, p < 0.01). H9 is supported. The outcomes are shown in Figure 3.
According to Table 6, there are 34 paths regarding the effects on tourists’ ERB. There are two direct paths: “TC → TERB” and “TL → TERB”. Total negative and direct effects are −0.073 (−0.349 + 0.276). Total effects are 0.251, which means that the effects of indirect paths are more significant than direct paths (0.324 > −0.073) and the implementation of TERB is a complex process and influenced by many factors. 28 paths of effects on TERB are triggered by TDI, TE, PQ, and PV; it shows that, to reveal the influencing mechanism of emotion reflections on TERB, we should learn about the influencing factors existing before and during travel. Two paths of effects on TERB are triggered by TC (−0.349) and TL (0.276), which means that TC and TL are key factors for tourists to have ERB. Meanwhile, TS influences TERB through TC and TL, and its indirect total effects on TERB are 0.303. Therefore, it can be concluded that tourist emotional reflections do significantly influence TERB in different directions.

5. Discussion

This study explored, based on tourist satisfaction model, the effects of TDI, TE, PQ, PV, TS, TL, and TC on TERB for college students. The findings reveal that TDI, TE, PQ, and PV are the key antecedent variables of emotional reflections, and affect TERB through emotional reflections. In particular, TDI, TE, PQ, and PV significantly affect each other in order, and they affect tourist emotional reflections and further indirectly influence TERB. In general, the indirect effects of the above four variables on TERB are −0.128, −0.226, 0.196, and 0.22 respectively; total indirect effects are 0.062. Therefore, it can be concluded that TDI and TE restrain TERB, and PQ and PV promote TERB. This is because when the image of a destination in tourists’ memory is better, and TE is higher before travel, then higher TE will in turn lower the PQ of tourism products and services during travel, so if tourism products and services cannot meet TE, tourist interests therefore cannot be realized. As a result, tourists will have negative emotional reflections during travel and they will not be willing to carry out ERB. Conversely, if PQ is higher, PV will be higher, and tourists will feel that their interests have been realized. In this case, tourists will have positive emotional reflections, and they are more willing to carry out ERB to protect the ecosystem environment of destinations from being damaged when travelling; additionally, they are more likely to develop harmonious relationships with destinations’ natural environments, manifested by not throwing trash anywhere, not painting or scratching historic and cultural building and statues, not climbing or wrecking trees, and not capturing or killing rare animals etc.
As the emotional reflections after tourist interests are collated, TS, TC, and TL all influence TERB in different directions. TS indirectly affects TERB through TL and TC, its total effects are 0.303. In other words, when tourists are more satisfied with a destination, their willingness to carry out ERB is higher. The results agree with the research of [33].
TL positively and directly affects TERB; its total effects are 0.276. The result reveals that when tourists are more likely to revisit a destination, as well as recommend and evaluate this destination to their friends and relatives, they are more willing to put ERB into practice. The result validates the findings of [41], which indicate that when tourists are more willing to revisit a destination or evaluate it positively, they are more likely to implement ERB.
TC negatively and directly influences TERB, and its total effects are −0.349. It means that when the tourists are not satisfied with a destination, they will not carry out ERB. Therefore, even though the college students have a high education degree and rich knowledge of environment, if their expectations for travel cannot be met, they are also not willing to take measures to protect tourism environments. The result agrees with studies by [32,36].
Therefore, the realization of protecting destination environments for tourism sustainable development not only depends on tourists’ characteristics, social norms, green knowledge and the regulations of environmental protection, but also the organizers and managers of tourism destinations, who should improve the quality and value of tourism products and services, giving tourists the chance to realize their expectations. By doing so, tourist satisfaction and loyalty will increase, and complaints will reduce, so that positive emotions will become the impetus of TERB.

6. Conclusions and Implications

From the perspectives of emotional reflections and based on the tourist satisfaction model, this study explored the relationships among TDI, TE, PQ, PV, TS, TL, TC, and TERB, to reveal the influencing factors of TERB and solve environmental problems at destinations. Based on the results, the findings are summarized as follows: (1) the variables TDI, TE, PQ, and PV are the important antecedents of emotional reflections, and they all significantly influence TERB; TDI and TE negatively and indirectly influence TERB; PQ and PV positively and indirectly influence TERB. (2) In the relationship between TS and TERB, TS indirectly affects TERB through TL and TC, and stronger TS is associated with stronger TERB toward the destination. (3) In the relationship between TL and TERB, higher TL better enhances TERB. (4) In the relationship between TC and TERB, TC negatively and directly affects TERB, and higher TC will lower tourist willingness to carry out TERB.
This research contributes to the existing knowledge base about tourist satisfaction model and TERB in several ways. First, it is among the first to offer empirical evidence regarding the influence of emotion reflections (TS, TL, and TC) on TERB in the Eastern context. A major limitation of existing TERB studies was that the perspectives were mainly focused on situational factors in tourism destinations, demographic characteristics, social norms, and green knowledge, overlooking the effects of tourist emotional reflections on TERB. For example, the research of [33] only explored the relationship between TS and TERB. In addition, according to results of this study, apart from satisfaction, loyalty and complaint both significantly affect TERB. It worth noting that TC negatively and significantly influences TERB and has the greatest effects on TERB. Second, this study provides promising new information on how TDI, TE, PQ, and PV influenced TERB. In addition, the results indicate that the four variables are the important antecedents of TERB, the total effects of which on TERB are 0.062. In other words, this study reveals tourists accrue thoughts before and during travel, and in turn help the destination to better predict TERB. Finally, the tourist satisfaction model explored the relationships among TS, TL, and TC, while the study represented one of the first attempts to construct a systematic theoretical model for a TERB-based tourist satisfaction model and to test it empirically; the results of this study are rich, and extend the tourist satisfaction model.
Based on the above results, the study also points to several practical implications for tourism destination to guide and cultivate TERB. First, the results suggest that TDI affects TERB through tourist emotional reflections, and it is a premise of tourist expectation, as suggested by [6], and can influence tourist decisions to travel. Hence, the marking and management agencies at destinations should pay better attention in shaping TDI, and advertise it via mass media and the internet. Moreover, the destinations should be kept clean and tidy, and the landscape of the tourism destination should be planned and designed elaborately to give tourists a visual enjoyment and stimulate TERB. Second, tourist expectation, perceived quality, and value all influence TERB through tourist emotional reflections. However, among them, tourist expectation negatively affects TERB, because tourist expectation has not been met. Hence, the quality and cost effects of tourism products and services at the destination should be guaranteed and improved to meet the needs of tourists, with a view to enhance their ERB. In fact, tourist behavior is based on their interests met, and in TERB guiding and cultivation the management agencies of tourism destinations should do their best to provide enough products and services as well as facilities, such as the provision of food, accommodation, vehicles, shopping, entertainment, accurate travel routes, toilets, lounges and signboards for tourists. By doing so, tourist expectation before travel will be met, and then perceived value of tourism products and services will increase, and they will think this tourism experience is worthy of their expended money, time, and energy. Compared to other tourism experiences, they will think this one is much better. Based on this, the degree of tourist loyalty and satisfaction will grow, and subsequently tourist complaints will reduce, and this will in turn promote ERB, so that tourists will comply with the rules and regulations of destination willingly, not walking on the lawn, not throwing trash on the ground or into a pool or river, not painting or scratching historic and cultural buildings, not wrecking or climbing trees, and not capturing and killing rare animals. Finally, tourism destinations should be equipped with corresponding feedback facilities, such as free phone booths and suggestion boxes for tourist complaints, to help managers and organizers of destinations know about and deal with tourist troubles, reducing tourist negative emotional reflections and unfriendly behaviors to the tourism environment, and helping realize the sustainable development of tourism.
Some limitations of this study need to be acknowledged. First, this study targets only college students. That means the results are only representative of a college student tourist group. Future studies are required in order to explore other tourists with different ages and identities to examine the differences of the effects of emotional reflections on TERB in different types of tourists. Second, this study mainly chose college students in China as the sample; there are few samples from other countries. Future studies are required in order to explore college tourists in the particular cases of other countries to test the robustness of the theoretical model used for this study. In particular, more attempts are necessary to apply this research model in other groups, more numerous or diverse in terms of culture and age. Finally, it is noteworthy that this study emphasizes on the “practical potential” of students’ current cognition and behavior on collective impact in the future. We did not empirically test the students’ cognition and behaviors in their future states (which is logically and practically impossible). Future studies should conduct longitudinal design and trace the developmental information at different time points for this highly important issue.

Author Contributions

Y.P. was the major writer for the manuscript; J.-G.L. led the project and acquired funding support.

Acknowledgments

The study was supported by a grant from Taihu University of Wuxi (No. 17WUSS008); National Natural Science Foundation of China (No. 41771131), Premium Funding Project for Academic Human Resources Development in Beijing Union University (No. BPHR2017CS13).

Conflicts of Interest

The authors declare no conflict of interest.

References

  1. Brown, T.J.; Ham, S.H.; Hughes, M. Picking up litter: An application of theory-based communication to influence tourist behavior in protected areas. J. Sustain. Tour. 2010, 18, 879–900. [Google Scholar] [CrossRef]
  2. Sivek, D.J.; Hungerford, H. Predictors of responsible behavior in members of three Wisconsin conservation organizations. J. Environ. Educ. 1985, 21, 35–40. [Google Scholar] [CrossRef]
  3. Kollmuss, A.; Agyeman, J. Mind the gap: Why do people act environmentally and what are the barriers to pro-environmental behavior? Environ. Educ. Res. 2002, 8, 239–260. [Google Scholar] [CrossRef]
  4. Kani, J.; Kramer, M.; Collective Impact. Stanford Soc. Innov. Rev. 2011, 36–41. Available online: https://communityengagement.uncg.edu/wp-content/uploads/2014/08/Collective-Impact.pdf (accessed on 14 May 2018).
  5. Bamberg, S.; Moser, G. Twenty years after Hines, Hungerford and Tomera: A new meta-analysis of psycho-social determinants of pro-environmental behaviour. J. Environ. Psychol. 2007, 27, 14–25. [Google Scholar] [CrossRef]
  6. Gnoth, J. Tourism expectation formation. In Consumer Behavior in Travel and Tourism; Pizamand, A., Mansfeld, Y., Eds.; The Haworth Press: Binghamton, NY, USA, 1999; pp. 245–303. [Google Scholar]
  7. Baker, D.A.; Crompton, J.L. Quality, satisfaction and behavioural intentions. Ann. Tour. Res. 2007, 27, 785–804. [Google Scholar] [CrossRef]
  8. Chi, C.G.-Q.; Qu, H. Examining the structural relationships of destination image, tourist satisfaction and destination loyalty: An integrated approach. Tour. Manag. 2007, 29, 342–636. [Google Scholar] [CrossRef]
  9. Song, Z.; Su, X.; Li, L. The Indirect Effectss of Destination Image on Destination Loyalty Intention through Tourist Satisfaction and Perceived Value: The Bootstrap Approach. J. Travel Tour. Mark. 2013, 30, 386–409. [Google Scholar] [CrossRef]
  10. Williams, P.; Soutar, G.N. Value, satisfaction and behavioural intentions in an adventure tourism context. Ann. Tour. Res. 2009, 36, 413–438. [Google Scholar] [CrossRef]
  11. McDowall, S. International Tourist Satisfaction and Destination Loyalty: Bangkok, Thailand. Asia Pac. J. Tour. Res. 2010, 15, 21–42. [Google Scholar] [CrossRef]
  12. Xia, W.; Chaolin, G.; Hu, M. Tourist Attraction Customer Satisfaction Index Model. Acta Geogr. Sin. 2005, 50, 807–816. [Google Scholar]
  13. Qun, W.; Zu-Rong, D.; Jin-He, Z.; Xing-Zhu, Y. Study on the model of tourist satisfaction index about tourism environment: A case study of Huangshan Mountain. Geogr. Res. 2006, 25, 171–181. [Google Scholar]
  14. Xianhong, B. Research on the inter-relationship of tourists destination image, quality, satisfaction and behaviour intention. East China Econ. Manag. 2005, 19, 84–88. [Google Scholar]
  15. Bin, D. Tourist satisfaction measurement of special tourism: Based on the SEM mode. Stat. Decis. 2015, 12, 104–106. [Google Scholar]
  16. Hungerford, H.R.; Peyton, R.B.; Tomera, A.N. Investigating and Evaluating Environmental Issues and Actions: Skill Development Modules; Stipes Publishing Company: Champaign, IL, USA, 1986; 250p. [Google Scholar]
  17. Ajzen, I. The theory of planned behavior. Organ. Behav. Hum. Decis. Process. 1991, 50, 179–211. [Google Scholar] [CrossRef]
  18. Stern, P.C. New environmental theories: Toward a coherent theory of environmentally significant behavior. J. Soc. Issues 2000, 56, 407–424. [Google Scholar] [CrossRef]
  19. Hines, J.M.; Hungerford, H.R.; Tomera, A.N. Analysis and synthesis of research on responsible environmental behavior: A meta-analysis. J. Environ. Educ. 1987, 18, 1–8. [Google Scholar] [CrossRef]
  20. Schultz, P.W.; Shriver, C.; Tabanico, J.J.; Khazian, A.M. Implicit connections with nature. J. Environ. Psychol. 2004, 24, 31–42. [Google Scholar] [CrossRef] [Green Version]
  21. Kim, A.K.; Airey, D.; Szivas, E. The multiple assessment of interpretation effectsiveness: Promoting visitors’ environmental attitudes and behavior. J. Travel Res. 2010, 50, 321–334. [Google Scholar]
  22. Vaske, J.J.; Kobrin, K.C. Place attachment and environmentally responsible behavior. J. Environ. Educ. 2001, 32, 16–21. [Google Scholar] [CrossRef]
  23. Williams, D.; Vaske, J. The measurement of place attachment: Validity and generalizability of a psychometric approach. For. Sci. 2003, 49, 830–840. [Google Scholar]
  24. Kerstetter, D.L.; Bricker, K.S. Exploring Fijian’s sense of place after exposure to tourism development. J. Sustain. Tour. 2009, 17, 691–708. [Google Scholar] [CrossRef]
  25. Andereck, K.L. Tourists’ perceptions of environmentally responsible innovations at tourism businesses. J. Sustain. Tour. 2009, 17, 489–499. [Google Scholar] [CrossRef]
  26. Lee, T.H.; Jan, F.H.; Huang, G.W. The influence of recreation experiences on environmentally responsible behavior: The case of Liuqiu Island, Taiwan. J. Sustain. Tour. 2015, 23, 947–967. [Google Scholar] [CrossRef]
  27. Beaumont, N. Ecotourism and the conservation ethic: Recruiting the uninitiated or preaching to the converted. J. Sustain. Tour. 2001, 9, 317–341. [Google Scholar] [CrossRef] [Green Version]
  28. Cottrell, S.P. Influence of socio-demographics and environmental attitudes on general responsible environmental behavior among recreational boaters. Environ. Behav. 2003, 35, 347–375. [Google Scholar] [CrossRef]
  29. Duerden, M.D.; Witt, P.A. The impact of direct and indirect experiences on the development of environmental knowledge, attitudes, and behavior. J. Environ. Psychol. 2010, 30, 379–392. [Google Scholar] [CrossRef]
  30. Orams, M.B. The effectsiveness of environmental education: Can we turn tourists into ‘Greenies’. Prog. Tour. Hosp. Res. 1993, 3, 295–306. [Google Scholar] [CrossRef]
  31. Thapa, B.; Graefe, A.R.; Meyer, L.A. Moderator and mediator effectss of scuba diving specialization on marine-based environmental knowledge-behavior contingency. J. Environ. Educ. 2011, 37, 53–67. [Google Scholar] [CrossRef]
  32. Jun, F.; Hongliang, Q.; Xuefei, W. Tourist Destination Image, Place Attachment and Tourists’ Environmentally Responsible Behavior: A Case of Zhejiang Tourist Resorts. Tour. Trib. 2014, 29, 55–66. [Google Scholar]
  33. Hongliang, Q.; Zhenhua, L.; Dong, W. Place Attachment, Visitor Satisfaction and Visitor Environmentally Responsible Behavior. J. Tour. Coll. Zhejiang 2014, 10, 36–42. [Google Scholar]
  34. Qiucheng, L.; Linqiang, Z. The Impact of Social Capital on Tourists’ Intention to Exhibit Environment-friendly Behaviors. Tour. Trib. 2014, 29, 74–82. [Google Scholar]
  35. Yanju, J.; Derong, L. Influence Factors and effectss of Tourists’ Environmentally Responsible Behaviors on place theory. China Popul. Resour. Environ. 2015, 25, 161–169. [Google Scholar]
  36. Xiaoting, Y.; Xiaogen, W.; Yuling, Z.; Yuan, W. Factors Driving Environmentally Responsible Behaviors by Tourists: A Case Study of Taiwan, China. Tour. Trib. 2015, 30, 49–59. [Google Scholar]
  37. Hair, J.F.; Anderson, R.E.; Tatham, R.L.; Black, W.C. Multivariate Data Analysis; Prentice Hall: London, UK, 1998. [Google Scholar]
  38. Bagozzi, R.P.; Yi, Y. On the evaluation of structural equation models. J. Acad. Mark. Sci. 1988, 16, 76–94. [Google Scholar] [CrossRef]
  39. Fornell, C.; Larcker, D.F. Evaluating structural equation models with unobservable and measurement error. J. Mark. Res. 1981, 18, 39–50. [Google Scholar] [CrossRef]
  40. Joreskog, K.; Sorbom, D. Lisrel8: User’s Reference Guide; Chicago Scientific Software International: Chicago, USA, 1996. [Google Scholar]
  41. Hongliang, Q. Tourism Festival image, Festival Attachment, Tourists’ loyalty and Environmentally Responsible Behavior. J. Zhejiang Soc. Sci. 2017, 11, 84–92. [Google Scholar]
Figure 1. Research framework.
Sustainability 10 02024 g001
Figure 2. Responsible behavior model for college tourists.
Sustainability 10 02024 g002
Figure 3. Structural model of environmentally responsible behavior for college tourists. ** p < 0.05; *** p< 0.01.
Sustainability 10 02024 g003
Table 1. Confirmatory factor analysis.
Dimensions and ItemsFactor LoadingCRtCronbach’s αAVE
Tourist destination image (TDI)
 I think the overall image of tourism destination is very good before travel.0.842 ***0.747-0.7420.501
 I think the degree of popularity of tourism destination is very high before travel.0.632 *** 9.584
 I think the tourism destination is special before travel.0.627 *** 9.494
Tourist expectation (TE)
 I expect that the tourism destination will do its best to meet my needs before travel.0.765 ***0.760-0.7560.514
 I expect that the tourism destination will safeguard my rights and interests before travel.0.703 *** 9.678
 In general, I expect that I will gain a lot from this travel before travel.0.681 *** 9.383
Perceived quality (PQ)
 I really enjoy the landscape of the tourism destination.0.698 ***0.914-0.9140.517
 I think the routes designed are very reasonable.0.672 *** 8.390
 I think the guide service is very professional.0.637 *** 7.994
 I think the management of the tourism destination is put in place.0.789 *** 9.614
 I think the tourism destination is very clean.0.777 *** 9.499
 I think the tourism destination is not crowded.0.637 *** 7.988
 I think the tourism destination is very safe and there will not be dangerous accidents.0.791 *** 9.640
 I think the entertainment condition of the tourism destination is very attractive.0.728 *** 9.001
 I think the food, shopping and accommodation are good.0.720 *** 8.920
 I think the equipment and facilities, such as toilets, lounges and signboards are good.0.721 *** 8.928
Perceived value (PV)
 Compared with other tourism destinations, I think this one’s cost effectiveness is higher.0.763 ***0.818-0.7100.530
 Compared with ticket price, my tourism experience is very good value.0.723 *** 10.147
 Compared with the tourism experience accepted, I think the ticket price is not very high.0.710 *** 9.798
 In general, this tourism experience is worthy of my expended money, time, and energy.0.715 *** 9.943
Tourist satisfaction (TS)
 In general, I am very satisfied with this tourism experience.0.818 ***0.870-0.8810.626
 Compared with my ideal tourism destination, this one is much better.0.795 *** 15.732
 Compared with my expected tourism destination, this one is much better.0.821 *** 16.453
 Compared with the tourism destinations I have been to, this one is much better.0.726 *** 13.924
Tourist loyalty (TL)
 I will positively evaluate this tourism destination to my friends and relatives as well as other people.0.858 ***0.801-0.7990.580
 I will revisit this tourism destination in the future.0.587 *** 10.479
 I will recommend this tourism destination to my friends and relatives as well as other people.0.811 *** 15.547
Tourist complaint (TC)
 I will complain about the tourism destination.0.991 ***0.798-0.7970.676
 I will negatively evaluate the tourism destination to my friends and relatives as well as other people.0.608 *** 5.480
Tourist Environmentally Responsible Behavior (TERB)
 I will not walk on the grass, or wreck and climb trees.0.788 ***0.876-0.8350.586
 I will not capture and kill rare animals.0.682 *** 10.859
 I will not throw my trash on the ground or into a pool or river.0.741 *** 11.632
 I will not paint or scratch historic and cultural buildings and statues.0.825 *** 12.534
 I will comply with the rules and regulations of destination, and if I see my companions doing bad things to the destination, I will persuade them to stop.0.785 *** 11.973
Notes: *** p < 0.001.
Table 2. Correlation coefficients of variables and dimensions.
Variable and Dimension 12345678
TDI0.612
TE0.1560.656
PQ0.1920.1180.584
PV0.1120.3680.1570.655
TS0.1530.2380.1810.1010.599
TL0.1450.1310.0770.1940.1280.565
TC0.1220.2000.1180.2450.0970.1860.502
TERB0.1830.2550.1500.2840.2510.2370.3640.643
Notes: Figures of diagonal lines are square roots of AVE of latent variables, which should be higher than the figures of non-diagonal lines.
Table 3. Demographic profile of the respondents.
Variablen%
Gender
 Male25248.08
 Female27351.92
Age (years)
 19–2441779.46
 25–299417.81
 ≥29142.73
Education level in university
 Fresh students 5810.96
 Sophomore students7814.84
 Junior students8015.07
 Senior students12223.29
 Postgraduate students and above18735.84
Tourism experience
 one time ≤ two times18234.6
 ≥ three times34365.4
Willingness for TERB
 Not willing112.05
 Willing51497.95
Main Source of Tourists
 Beijing city26049.43
 Henan province448.47
 Tianjin city295.49
 Shanxi province244.58
 Jiangsu province203.89
 Zhejiang province173.20
 Hebei province162.97
 Anhui province142.75
 Shandong province132.52
 Guangdong province132.52
 Hunan province101.83
 Shanghai city81.60
 Chongqing city 81.60
 Fujian province61.14
Table 4. Goodness-of-fit test for the complete mediation model.
IndicesModel FitCriteriaTest Result of Measurement
x2 test
x2/df (NCI)1.771 (843.191/476)<3Yes
Absolute fit measures
 GFI0.961>0.90Yes
 AGFI0.936>0.90Yes
 RMR0.035<0.05Yes
 RMSEA0.049<0.08Yes
Baseline comparisons
 NFI0.927>0.90Yes
 TLI0.910>0.90Yes
 IFI0.920>0.90Yes
 CFI0.919>0.90Yes
Table 5. Results of initial hypotheses.
Hypotheses and PathsPath Coefficientt ValueHypothesis Supported?
H1a: TDI → TE0.754 ***8.097Yes
H1b: TDI → PQ−0.181−1.176No
H1c: TDI → PV−0.249−1.732No
H1d: TDI → TS0.0571.047No
H1e: TDI → TL0.152 ***3.675Yes
H2a: TE → PQ−0.743 ***4.003Yes
H2b: TE → PV−0.372 **2.829Yes
H3a: PQ → PV0.606 ***5.252Yes
H3b: PQ → TS0.209 ***3.684Yes
H3c: PQ → TL0.0030.033No
H4a: PV → TS0.693 ***5.310Yes
H4b: PV → TL−0.163−0.917No
H5a: TS → TL0.899 ***5.577Yes
H5b: TS → TC−0.140 **−2.887Yes
H6: TC → TL−0.150 **−2.919Yes
H7: TS → TERB0.1761.397No
H8: TL → TERB0.276 ***4.020Yes
H9: TC → TERB−0.349 ***−4.109Yes
Notes: *** p < 0.001, ** p < 0.01.
Table 6. Paths of effect of TERB.
ProcessPaths of EffectDirect EffectIndirect Effect
Emotional reflections → ERBTC → TERB−0.349
TL → TERB0.276
TC →TL → TERB −0.041
TS → TC → TERB 0.049
TS → TC → TL → TERB 0.006
TS → TL → TERB 0.248
The influencing factors during travelPV → TERBPV → TS → TC → TERB 0.044
PV → TS → TC → TL → TERB 0.004
PV → TS → TL → TERB 0.172
PQ → TERBPQ → PV → TS → TC → TERB 0.027
PQ → PV → TS → TC → TL → TERB 0.002
PQ → PV → TS → TL → TERB 0.104
PQ → TS → TC → TERB 0.010
PQ → TS → TC → TL → TERB 0.001
PQ → TS → TL → TERB 0.052
The influencing factors before travelTE → ERBTE → PQ → PV → TS → TC → TERB −0.020
TE → PQ → PV → TS → TC → TL → TERB −0.001
TE → PQ → PV → TS → TL → TERB −0.077
TE → PQ → TS → TC → TERB −0.007
TE → PQ → TS → TC → TL → TERB −0.001
TE → PQ → TS → TL → TERB −0.039
TE → PV → TS → TC → TERB −0.016
TE → PV → TS → TC → TL → TERB −0.001
TE → PV → TS → TL → TERB −0.064
TDI → TERBTDI → TE → PQ → PV → TS → TC → TERB −0.015
TDI → TE → PQ → PV → TS → TC → TL → TERB −0.001
TDI → TE → PQ → PV → TS → TL → TERB −0.058
TDI → TE → PQ → TS → TC → TERB −0.005
TDI → TE → PQ → TS → TC → TL → TERB −0.001
TDI → TE → PQ → TS → TL → TERB −0.029
TDI → TE → PV → TS → TC → TERB −0.012
TDI → TE → PV → TS → TC → TL → TERB −0.001
TDI → TE → PV → TS → TL → TERB −0.048
TDI → TL → ERB 0.042
Total −0.0730.324
Total effect 0.251

