Article

Life Cycle Environmental Impact of Onshore and Offshore Wind Farms in Texas

1
Center for Energy & Environmental Sustainability, Prairie View A&M University, Prairie View, TX 77446, USA
2
Center for Energy & Environmental Sustainability, Department of Civil & Environmental Engineering, Prairie View A&M University, Prairie View, TX 77446, USA
3
Center for Energy & Environmental Sustainability, Department of Mechanical Engineering, Prairie View A & M University, Prairie View, TX 77446, USA
*
Author to whom correspondence should be addressed.
Sustainability 2018, 10(6), 2022; https://doi.org/10.3390/su10062022
Submission received: 21 May 2018 / Revised: 11 June 2018 / Accepted: 12 June 2018 / Published: 14 June 2018

Abstract

:
The last decade witnessed a quantum increase in wind energy contribution to the U.S. renewable electricity mix. Although the overall environmental impact of wind energy is miniscule in comparison to fossil-fuel energy, the early stages of the wind energy life cycle have potential for a higher environmental impact. This study attempts to quantify the relative contribution of individual stages toward life cycle impacts by conducting a life cycle assessment with SimaPro® and the Impact 2002+ impact assessment method. A comparative analysis of individual stages at three locations, onshore, shallow-water, and deep-water, in Texas and the gulf coast indicates that material extraction/processing would be the dominant stage with an average impact contribution of 72% for onshore, 58% for shallow-water, and 82% for deep-water across the 15 midpoint impact categories. The payback times for CO2 and energy consumption range from 6 to 14 and 6 to 17 months, respectively, with onshore farms having shorter payback times. The greenhouse gas emissions (GHG) were in the range of 5–7 gCO2eq/kWh for the onshore location, 6–9 CO2eq/kWh for the shallow-water location, and 6–8 CO2eq/kWh for the deep-water location. A sensitivity analysis of the material extraction/processing stage to the electricity sourcing stage indicates that replacement of lignite coal with natural gas or wind would lead to marginal improvements in midpoint impact categories.

1. Introduction

Wind energy accounts for 39% of the total amount of renewable electricity generated in 2017 in the U.S. [1]. The decade from 2007 to 2017 witnessed a quantum increase in installed wind capacity from 34.5 to 246 billion kWh [2]. The carbon dioxide (CO2) emissions from electricity generation decreased by 15 percent below 2005 levels, around 830 million metric tons due to the increased share of electricity generated from renewable sources [3]. Wind energy offers an alternative to fossil fuels by lowering air pollutant and greenhouse gas (GHG) emissions and dampens the pace of the depletion of natural resources, such as fresh water and fertile land/forests [4]. The projections for growth in utility-scale wind capacity are around 20 gigawatts (GW) between 2020 and 2050 [2]. Currently, Texas is the leading state in installed wind capacity, with a share of 12.63% of all in-state electricity production in 2016 [5]. However, a majority of the wind farms in Texas are onshore and no operational information is available for offshore wind farms in the Texas Gulf coast [6]. The only offshore wind farm on the U.S. coast recently became operational in deep-water near New Shoreham, Rhode Island and has a project capacity of 30 MW, which is estimated to reduce 42,942 tons of CO2 and 999 tons of SO2 per year assuming a capacity factor of 45% [7,8]. Offshore wind farms in water depths less than 30 m are typically referred to as shallow-water wind installations, and wind farms in water depths greater than 50 m are identified as deep-water installations [9,10]. Texas has great potential for utilizing the first U.S. offshore wind energy experience to expand Texas’ reach into tapping wind energy in the Gulf coast [6]. The experience in offshore oil platforms can be leveraged to serve the needs of the wind energy industry and improve the marine and port infrastructure that facilitates installation of offshore wind farms. In addition, Texas has water jurisdiction over 9 nautical miles offshore, placing Texas as one of the ideal candidates to further investments in offshore wind [5,6,7]. The low life cycle GHG emissions from wind energy, averaging around 26 tons/GWH (range: 6–124 tons/GWh), place wind at an advantageous position in terms of environmental impact to other renewables, such as biomass and solar photovoltaics, which have average life cycle GHG emissions of around 45 (range: 10–101) and 85 (13–731) tons/GWH, respectively.
Life cycle assessment (LCA) is a valuable tool that allows for a comprehensive evaluation of the potential environmental impacts associated with all stages of the wind energy life cycle, from cradle to grave. Haapala and Prempreeda (2014) performed an LCA for two 2 MW onshore wind turbines located between the states of Oregon and Washington, and suggested that the manufacturing stage accounts for 78% of the life cycle environmental impact for supply chains in the U.S. [11]. The energy payback times were reported to be 5.2 and 6.4 months for the two turbines and the turbine with a three-part tower module reported a lower environmental impact. The quantity of steel required in the tower was identified as the major contributor to environmental impact followed by the rotor and the nacelle [11]. However, the manufacturing stage in this study also included material extraction and the transportation of components to the site location, thereby decreasing the probability to narrow down the critical stages responsible for maximum environmental impact [11]. Another LCA study of wind energy in North America was conducted by Kabir et al. (2012), which compared Endurance (5 kW), Jacobs (20 kW), and Northern power (100 kW) turbines installed near Alberta, Canada and found that the 100 kW turbine has 58% lower global warming potential (GWP) compared to the 5 kW turbine and would be the most cost-effective and environmentally sustainable [12]. This study considered raw material production for turbine manufacturing that was located in the U.S. and transported to Canada [12].
Lenzen and Wachsmann (2004) determined that the location and geographical variability associated with the local economy play a major role in determining the life cycle environmental impacts of wind farms [13]. This finding suggests that the assessment of life cycle environmental impacts is subjective to location and would require consideration of spatial variations in markets and supply chains of raw materials. In addition to geographical location, the life cycle environmental impact of wind energy is also dependent on major parameters such as axis of rotation (horizontal or vertical), capacity factor, and rated power [14]. Kadiyala et al. (2016) performed a statistical evaluation of wind energy LCA studies and determined that for wind turbines greater than 0.25 MW capacity, onshore turbines have higher GHG emissions (15.98 ± 17.12 gCO2eq/kWh) compared to offshore wind turbines (12.9 + 7.61 gCO2eq/kWh) [14]. This review also suggested that the life cycle GHG emissions from wind turbines were inversely proportional to the capacity factor. Material production, including manufacturing, was identified as the primary stage responsible for a majority of GHG emissions at onshore locations by numerous studies, with the power rating being an additional control variable [12,13,14,15,16,17,18,
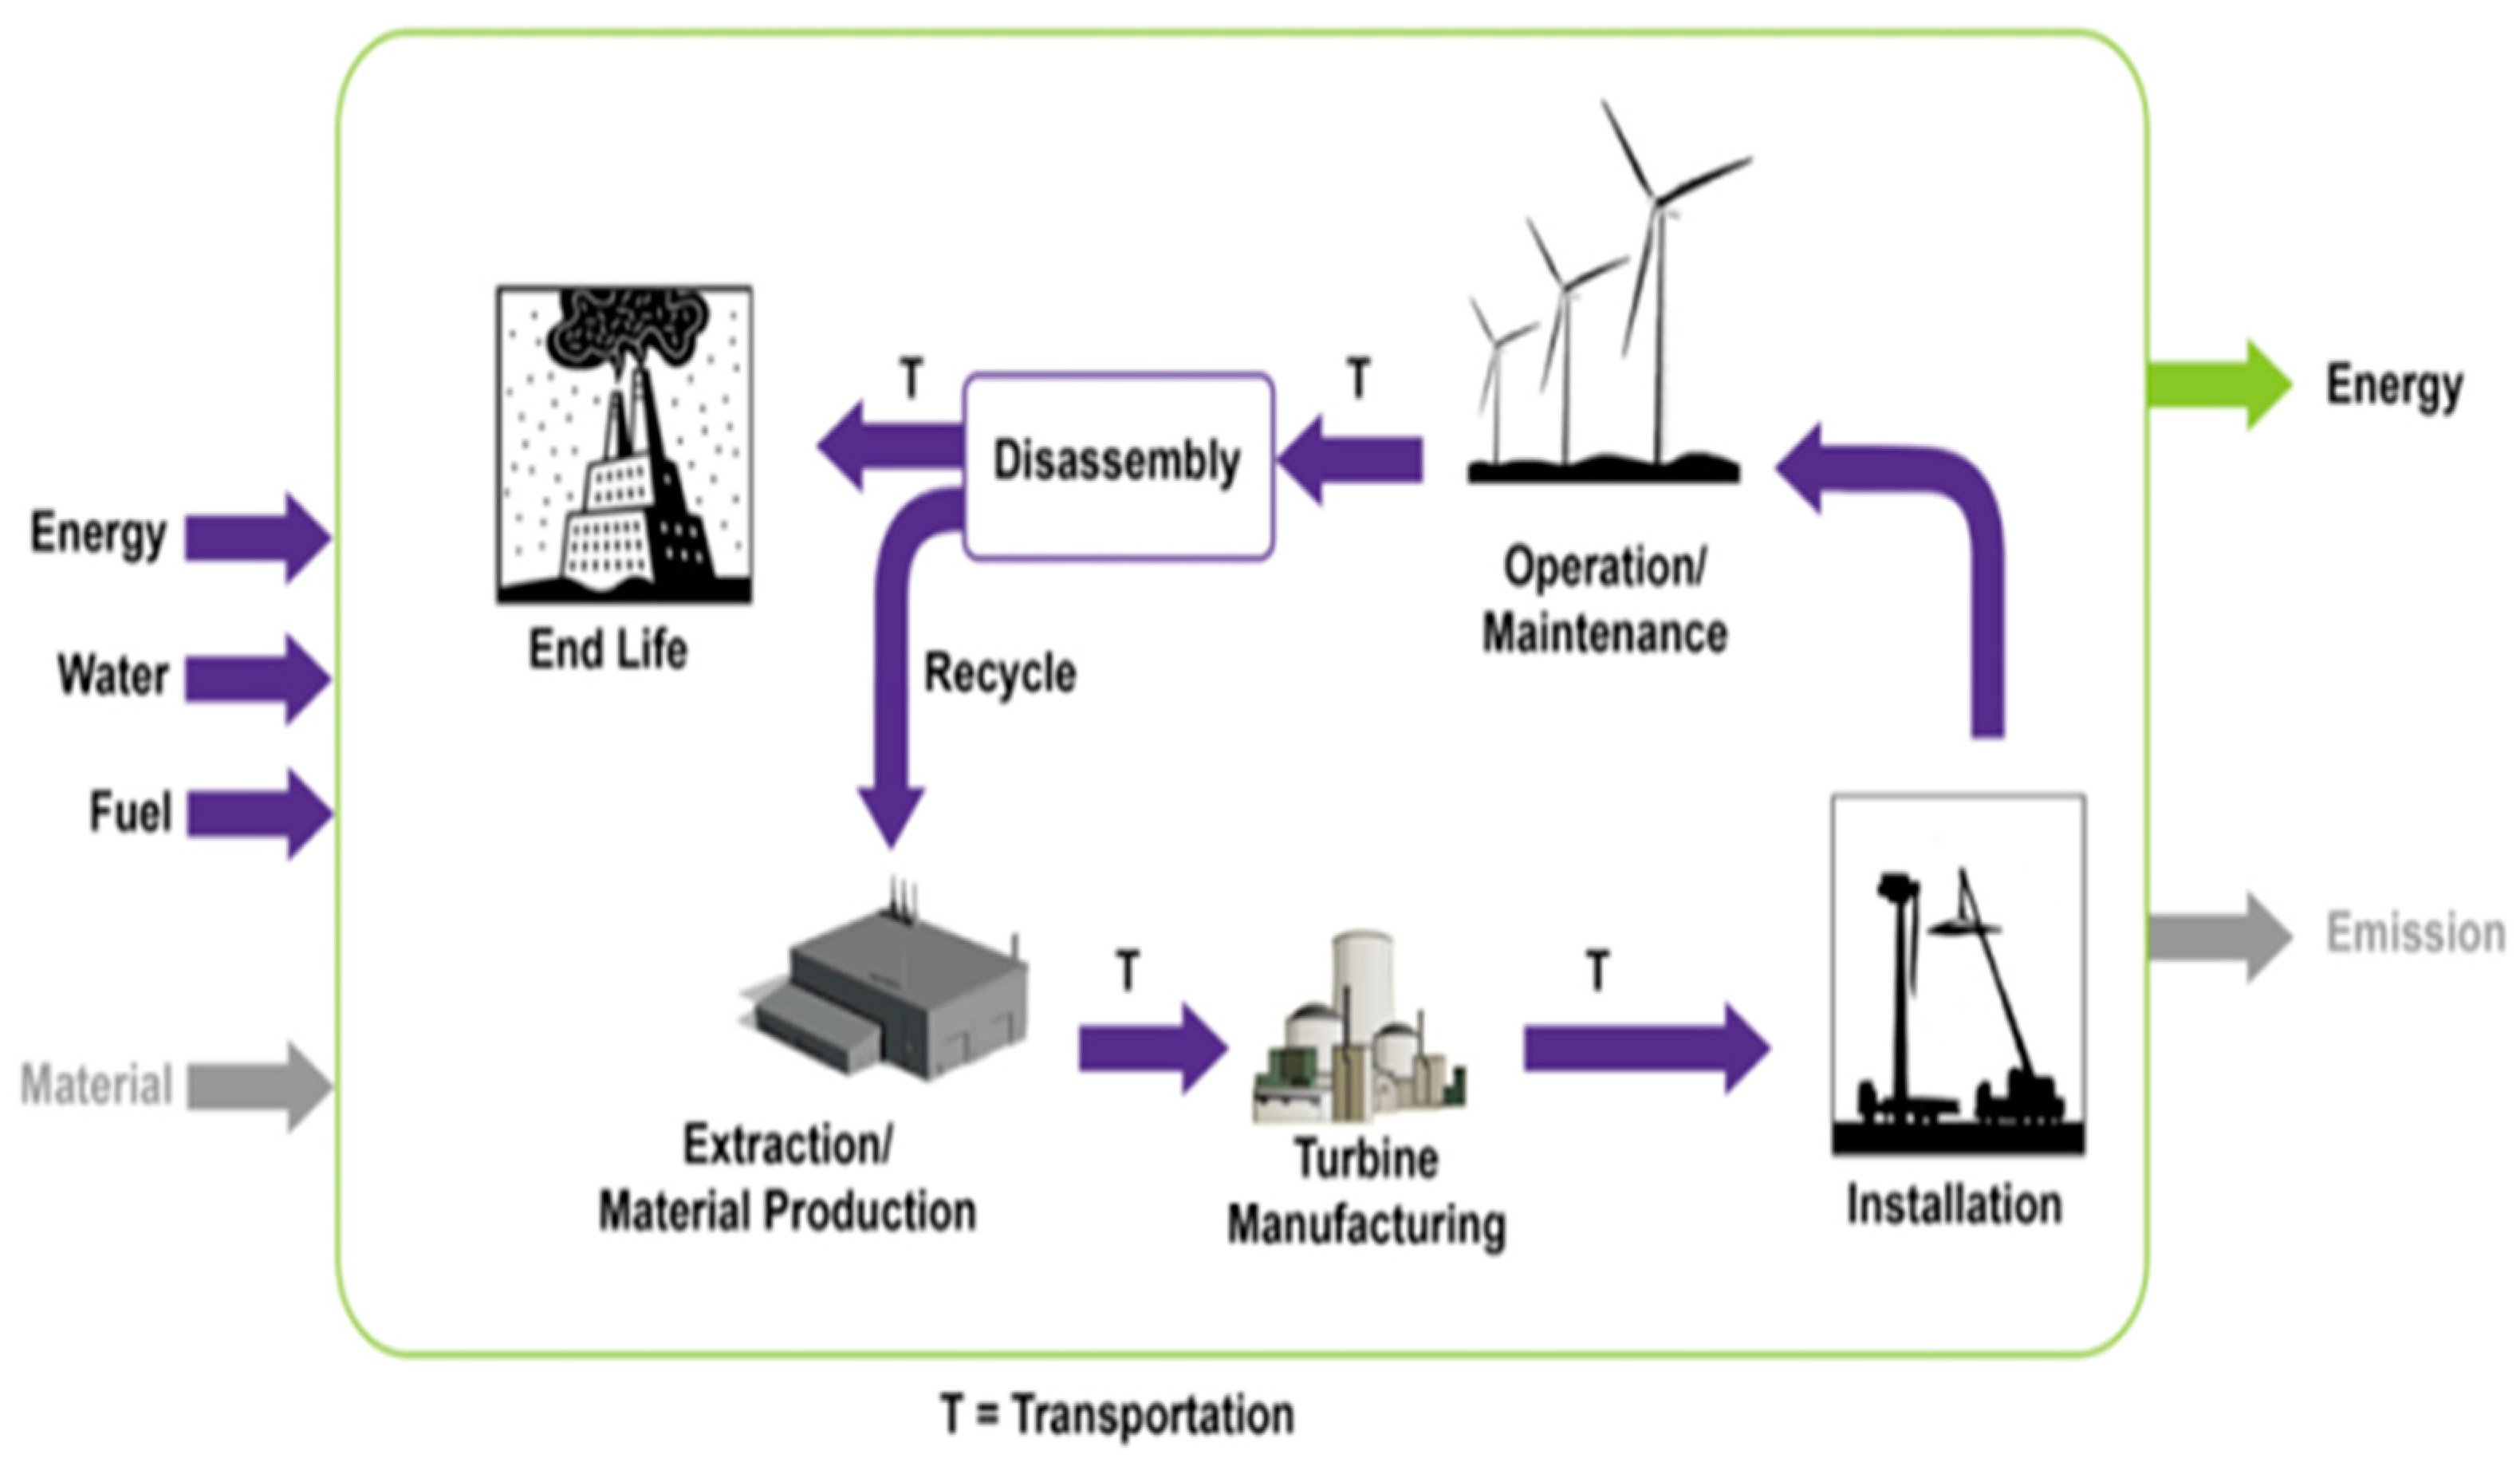
19]. The major stages in the life cycle of wind that were included in the system boundary of previously reported LCA studies include raw material extraction/processing, turbine manufacturing, transportation, installation, operation and maintenance and end-life/disassembly [12,13,14,15,16,17,18,19]. Offshore wind installations have an advantage in electricity production due to the higher wind speeds available at sea. However, this advantage is countered by a requirement for higher material input during construction of the foundation and transmission units, which causes higher energy and environmental emissions during the initial stages of the life cycle [20]. Research is currently underway for the development of reliable and cost-effective foundations for offshore wind turbines and bottom-fixed foundations, such as monopile, gravity-based, or jacket foundations, are suited for shallow-water depths (less than 30 m), whereas floating wind turbines are preferred for deep-water locations [21,22,23,24,25,26]. Recent LCA studies on offshore wind farms suggest that the material used in installing the foundations would be a major contributor to environmental impact in categories such as fossil fuels and respiratory inorganics and direct-drive turbines have lower impact than geared turbines [27,28]. In order to optimize the environmental performance of wind systems, an analytical study identifying the critical stage and processes contributing the highest impact needs to be conducted for onshore and offshore locations. The objective of the current study is to estimate the contribution of individual stages toward the life cycle environmental impact of utility-scale wind turbines and identify the critical stage that can be redesigned to lower the impacts. In addition, a comparative analysis of onshore and offshore (shallow- and deep-water) wind systems in Texas and the gulf coast with respect to GHG emissions, impact on air, water, and land resources and payback times is conducted to facilitate better decision-making tools to environmental planners and policy makers.

2. Methodology

2.1. System Boundary

The methodology followed in this study is based on the ISO standards 14040 and the ecoinvent3 database in SimaPro® [29]. The system boundary described in Figure 1 includes all of the stages: extraction of raw materials, manufacturing of different components, transportation to the site, installation, operation period and end of life. A cutoff criterion of 0.1% was implemented throughout the life cycle process to eliminate minor impacts and help set up boundaries for the total system inventory. Impact 2002+ was selected for impact assessment and to compare results across 15 midpoint impact categories (carcinogens, non-carcinogens, respiratory inorganics, ionizing radiation, ozone layer depletion, respiratory organics, aquatic ecotoxicity, terrestrial ecotoxicity, terrestrial acidification/nitrification, land occupation, aquatic acidification, aquatic eutrophication, global warming, non-renewable energy, and mineral extraction) grouped into four damage categories (human health: carcinogenic and non-carcinogenic, ecosystem quality, climate change, and resources) [30]. In addition, this study uses a single score method that assesses the cumulative energy demand (CED) or energy used during the turbine life cycle [30]. Cumulative energy results determine the total energy used and the operating time required to offset total CO2 and energy used. This study methodology allows for evaluation of three hypothetical wind farms installed onshore with capacities of 1, 2, and 2.3 MW, 2 and 2.3 MW wind farms in shallow-water and 2.3 and 5 MW wind farms in deep-water. The locations of the wind farms were restricted to the Electric Reliability Council of Texas (ERCOT) grid and based on the potential of onshore and offshore wind resources developed by the National Renewable Energy Laboratory (NREL), and the detailed conditions are described in Table 1 [31,32]. The total emissions and electricity produced are evaluated on a 20-year life span for all wind turbines and a functional unit of gCO2eq/kWh is adopted. The capacity factors (CF) were assumed to be 35% for onshore, 45% for shallow-water, and 47% for deep-water wind systems [33,34]. Onshore CF was estimated based on the CF data available for the study region, as calculated by the Texas Wind Energy Consortium, for Nolan County [35]. For shallow-water wind farms, the CF of 45% was estimated considering the 90 m power class 6 (8–8.5 m/s) U.S. offshore wind speed reported in the NREL/TP-6A20-51946 and NREL/TP-500-45889 reports [33,34]. For the offshore deep-water wind farm, the CF was chosen considering a high wind speed (class 6) similar to the CF of Rhode Island, the only U.S. offshore wind farm. Statistical analysis for midpoint impacts across 15 midpoint impact categories at each location was conducted by calculating means and standard deviations from SimaPro Impact 2002+ method results across the three turbines (1, 2 and 2.3 MW) for onshore locations and two turbines (2.0 and 2.3 MW for shallow-water and 2.3 and 5 MW for deep-water) for offshore locations. All of the emissions for each impact category were obtained per kWh of electricity produced in order to allow for a comparative study.

2.1.1. Extraction and Material Production

This stage represents a combination of the extraction of material (mining) and processing of the raw materials, including steel, glass-fiber-reinforced plastic (prepreg), aluminum, copper, glass, and auxiliary material. The inventory analysis of the onshore and offshore wind turbines were calculated based on technical data and LCA studies of turbine manufacturing companies such as Vestas, General Electric (GE), WinWind, and Gamesa. The major differences are noted in the material used for foundation and blades. Onshore foundations are mostly concrete with small percentage of reinforced steel while the offshore foundations use steel structures designed to resist the distinctive weather and the environmental conditions at shallow- and deep-water wind farms.

2.1.2. Turbine Manufacturing

This stage is a gate-to-gate LCA that starts with different materials entering the factory until the main parts (tower, nacelle, and rotor) are manufactured and ready to be transported to the wind farm. The environmental burden for this stage is strictly associated with the energy required per kilogram of the material used for each of the main parts.

2.1.3. Transportation

During the transportation stage, the environmental impact is mostly associated with the energy used for transportation of the main turbine parts. This is obtained by multiplying the distance (km) by the weight (kg). This stage includes all required equipment to transport the material from processing until it is finally delivered to the wind farm’s location. In addition, distances from the manufacturing location to the onshore or the offshore wind systems were also calculated. Towers and the offshore foundation are manufactured within close proximity of the wind farm to accommodate the complications associated with the transferring of heavy parts. Truck transport was the main mode of transportation used to transfer the turbine parts to the designated onshore location. Offshore moving parts are transported to the fabrication yard near the port, from where they are shipped to the designated offshore locations. The average distance for the nacelle, hub, and blades was 10,000 km. The fixed parts for offshore farms include the foundation and tower, which are manufactured at the yard located in the port area. Transportation accounts for the distances from the yard to the turbine’s designated location. The transportation and installation is performed by two self-propelled jack-ups with six legs that are capable of operation as a barge depending on the sea conditions. A wind-feeder barge equipped with a crane is used to transport the turbine parts to the designated offshore shallow-water location. The average distance by barge transport for the shallow-water locations is approximately 2.7 km from the shore. Based on the distance of the wind farm from the shore and the water depth in the Gulf of Mexico, it is feasible to preinstall some of the turbine parts onshore using the “Bunny Ear” (BE1T) principle with a tower in one piece, which reduces the number of lifts from 8 to 3. This principle requires that only one blade is installed onsite [30,31]. The distances described in Table 2 reflect the weight of each part per distance transferred using boats, trucks, and trains. Estimates could be made for any other location within the U.S. by extrapolating the data provided in the current study. For the deep-water location, one tugboat and two auxiliary boats are required to tow one 5 MW wind turbine to its location 70 km from the shore.

2.1.4. Installation/Disassembly

Onshore installation is performed using conventional construction equipment, such as cranes, excavators, and forklifts. However, offshore installation includes the energy used for other equipment (self-propelled jack-ups, hydraulic hammers, and auxiliary boats) described in Table 3. The installation required for the shallow-water turbines includes a monopile foundation and transition pieces that are transported by jack-up platforms from the fabrication yard to the designated offshore location. Jack-ups are equipped with a crane, a pile gripper, a pile tilt and a hydraulic hammer. The piles are driven with the hammer and the transition piece is placed on top of the pile, which is connected and sealed with concrete to support the turbine weight wave’s motion. Pile driving is selected as it has proven to be cheap and provide easy installation in soft-soil regions [36]. The foundation for the deep-water locations is assumed to be a Dutch Tri-Floater configuration, as described by Butterfield et al. (2005), due to advantages such as lower energy usage and cost as experienced in the oil and gas industry [9,37,38]. The deep-water foundation includes three buoyancy tanks that are partially submerged and arranged in the form of an equilateral triangle connected by steel beams and braces. For the deep-water location, all parts are assumed to be assembled onshore, including the foundation, by considering the same equipment as that for an onshore installation. Upon completion, the entire wind turbine is assumed to be towed to the designated deep-water location. The turbines are assumed to be connected with a medium voltage of 36 kV (Standard Voltage Level) and weigh approximately 20 to 40 kg/m. Cable connection length is estimated to be 1000 m for each turbine. The transformer is not considered to be part of this evaluation [39].

2.1.5. Operation and Maintenance (O&M)

Results from previous LCA studies show that the emissions and the energy consumption during the O&M phase are very low with an average of 2% [11,12,13,15,44,45,46]. It should be noted that this value represents emissions for routine maintenance and inspection that includes oil change, lubrication, and the fuel consumption from transportation. The frequency of material being replaced and a wind farm’s location also induce an additional degree of variability. This study considers that no major part is replaced during the 20-year lifetime and that half of the gearbox (steel and cast iron) is replaced every 5 years, which is more conservative than the typical 10-year replacement period suggested by previous studies [11,47]. Other assumptions include a routine inspection being conducted every year in addition to the 3-year oil change.

2.1.6. Turbine End of Life

This phase represents an important part of the life cycle assessment that could contribute to an improvement in the overall environmental impact by crediting the emissions released during the manufacturing phase. Steel represents 80% of the total amount of wind turbine material and typical wind turbines are installed in tubular steel structures that can be infinitely recycled. Table 4 presents the material type, disposal methods and U.S. recycling scenarios for aluminum and steel.

2.2. Electricity Sourcing

This study attempts to quantify the changes to the environmental impact of the critical stage resulting from the varying electricity sources. To ensure consistency in the electricity mix, all of the selected parts (towers, foundations, and blades) are considered to be manufactured in the U.S. The current U.S. electricity generation mix originates from a higher proportion of fossil-fueled sources as presented in Table 5. The different scenarios considered for replacing lignite coal in the grid include (i) the default/base case (U.S. grid mix from the EcoInvent database, 2009); (ii) the Texas electricity grid mix (2015); (iii) 25% of lignite-coal-based electricity replaced with natural gas (LG-25 NG); (iv) 25% of lignite-coal-based electricity replaced with nuclear (LG-25 Nuclear); (v) 25% of lignite-coal-based electricity replaced with wind (LG-25 Wind); and (vi) 50% of lignite-coal-based electricity replaced with natural gas (LG-50 NG). The details for the relative contribution of each electricity source scenario are provided in Appendix.

2.3. Energy and CO2 Payback Times

The energy payback times (EPT) were calculated according to Equation (1) [49,50]. The CO2 emissions from the extraction, material processing, transportation, installation stages and energy used (EU) were calculated using the cumulative energy methodology. The yearly energy produced (EP) considers significant parameters, such as the turbine rate power (TRP) in MW and the lifetime in hours which influences the turbine capacity factor (TCF). The TCFs are assumed to be 0.35 for onshore, 0.45 for the offshore shallow-water wind farms and 0.47 for the offshore deep-water wind farms determined as per Equation (2). The carbon payback time (CPT) measures the time frame (months) required for a turbine to offset the carbon emissions generated throughout the turbine’s life cycle process and is calculated according to Equation (3), where fossil fuel energy is denoted as F (kWh).
Energy   payback   time   ( EPT ) = Energy   used   ( EU )   Energy   produced   ( EP ) year
EP = TRP   ×   8760 h year ×   20   years   ×   TCF
CPT = F   ( kWh ) ÷ ( TRP   ×   TCF ) 24 h day

3. Results

3.1. Identification of Critical Stage

The average midpoint impacts of the onshore and offshore wind turbines are presented in Table 6. These values were obtained by calculating the mean and standard deviations over three onshore, two shallow-water, and two deep-water turbines. The contribution of individual stages to total life cycle impacts was calculated using Equation (4), where the height of each column (hi) represents the relative contribution of onshore, offshore shallow-water, and offshore deep-water wind farms, and pi represents the individual stage-wise impact. The results are described in Figure 2 for each of the 15 midpoint categories. The material extraction/processing stage is the highest contributor toward the life cycle impact for all locations. For onshore wind turbines, the material extraction/processing phase contributes an average of 71.9% followed by O&M (13.8%) and the manufacturing stage (9%) to total environmental impact. The majority of O&M’s impact is due to the use of lubrication oil and the electricity usage accounts for the primary source of impact in the manufacturing stage. U.S. electricity generation is predominantly from fossil fuels and its usage in manufacturing contributes to the release of CO2 and other GHGs. This factor also controls the level of respiratory organics/inorganics harmful to human health. For onshore wind farms, transportation and installation have lower impacts (1 to 6%) due to the lower distances involved in moving the manufactured components.
h i = p i 1 6 ( Abs ( p i ) )
For shallow-water wind turbines, material extraction/processing accounts for an average of 57.7% of the total life cycle impact across the 15 impact categories. Installation of shallow-water wind turbines is the second dominant stage, contributing around 26.5% of total life cycle impact. One of the principal drivers of this impact is the amount of heavy equipment required for the foundation material, steel. This pattern has an end-of-life benefit as the recycling of steel has a 19.9% credit towards lowering impact in shallow-water turbines. A steel foundation also benefits the total life cycle impact by reducing the impact in the respiratory inorganics, global warming, and aquatic eutrophication categories. For deep-water turbines, the manufacturing stage accounts for 81.5% of the total impact, and the nature of installation being done at the dock and towed to the designated location eliminates the use of heavy equipment and lowers fuel consumption. Another contributing factor that determines the relative importance of the material extraction stage is the turbine size, which directly impacts the quantity of material and foundation requirements. The results presented in Figure 2 also indicates that recycling has a greater role in alleviating the impact of global warming potential in the case of deep-water turbines compared to onshore and shallow-water locations. This is due to the large amounts of material, such as concrete, involved in onshore installations are being left on the ground after end-of-life. Although this minimizes the respiratory inorganic effects that usually originate from cement and concrete handling, it does not result in any recycling credit for concrete in contrast to steel and aluminum. Considering the midpoint LCA results by individual wind turbines at all sites, it is evident that material extraction/processing is the largest contributor to the environmental impact at all locations, which is a direct result of the natural resources consumed at the early stage of turbine life. The terrestrial eutrophication that is caused by surplus nitrogen and phosphorus enriches the aquatic ecosystems with nutrients, leading to an increase in production of plankton algae and deterioration of the water quality. As a result of excess nutrients, spatial changes in the diversity of aquatic species would also be an important consideration in offshore wind farms.

3.2. Air Pollutants and GHG Emissions

The life-cycle emissions of air pollutants and GHG for each turbine were evaluated in g/kWh of electricity produced and are presented in Table 7. The overall trends indicate that emissions of air pollutants are inversely proportional to turbine size given the capacity factor and location. CO2 accounts for 96% of the total air emissions due to natural resource consumption and electricity sourced from coal in the sub-processes -of manufacturing stage. This factor suggests that geographical location influences the total CO2 emissions indirectly through electricity consumption. Methane (CH4) and sulfur hexafluoride (SF6) have varying patterns compared to CO2 and nitrous oxide (N2O), with the 2 MW onshore turbine showing an increase in emissions compared to the 1 MW turbine. Due to the usage of a high percentage of lignite, methane emissions can be reduced compared to locations where natural gas or petroleum is the energy source. Although the magnitude of emissions for SF6 and NOx are lower than methane, the trend of offshore locations having higher emissions as compared to onshore locations is consistent and could be attributed to the electricity sourcing at the material and manufacturing stages.
Despite the variation in the individual GHGs, the trend observed for Global Warming Potential is as expected and decreases with increasing turbine size as presented in Figure 3. The contribution of wind energy toward ozone layer depletion was higher for offshore locations and increased with turbine size as indicated in Figure 4. Ozone layer depletion has a direct impact on human health by causing ultraviolet (UV-B) radiation to reach the Earth’s surface. This impact could be due to fugitive emissions in petroleum and gas production, and the release of hydrocarbons containing halogens (bromine and chlorine), in combination with the emissions generated during the copper treatment. Due to the usage of organic materials in offshore locations, and lignite coal in electricity generation for the U.S. mix (34.3%), a high proportion of ferro-chromo and copper production accounts for 14.8% and 12.97% of the total ozone depletion emissions, respectively. In addition, results from a literature review conducted by MiningWatch Canada indicate that during the smelting of ore, some of the compounds emitted as gases can combine with the dust and return as solids [51]. Depending on whether coke, coal, or charcoal is used, the repetition of this process may emit several gases, including chlorine atoms, which destroy nearly 1000 ozone molecules. Particulate air pollutants originate from different sources and can be a combination of complex reactions of chemicals, such as sulfur dioxide and nitrogen oxides, which are pollutants emitted from power plants during turbine manufacturing. For both onshore and offshore locations, the change in SO2 emissions with turbine size is minimal. The main factors impacting SO2 emissions occur during the processing phase of metal and the use of electricity for steel production, which is marginally higher in offshore foundations, whereas, at the onshore locations, the primary foundation material is mostly concrete.

4. Discussion

4.1. Energy and CO2 Payback Times

The results for the energy and CO2 payback times of all turbines installed at offshore and onshore locations are presented in Figure 5. The energy payback time decreases as the turbine size increases. The capacity factor at each location affects the total turbine output, which increases with the capacity factor and results in a reduction of the payback periods for energy and CO2 emissions. Another essential aspect that controls payback times is the total amount of fossil fuel used for each turbine. Since all wind farms’ turbine has a 20-year lifetime, and most of them pay off the CO2 and energy after 6 months of operation, we can then estimate an emission-free period of about 38 times more than those used during the extraction, material processing, manufacturing, transportation, and installation phases. The emission-free time highlights the benefits of wind farm installation in comparison to other electricity-generation sources. Furthermore, a close analysis of each turbine’s performance suggests that the installation of a larger-size turbine shows benefits compared to a small turbine size. The results of turbine performance at the onshore locations clearly indicate that the 2.3 MW turbine demonstrates better payback times for both energy and CO2. For the offshore location, deep-water turbines have better performance, and the 5 MW wind turbine at the deep-water location has better payback times than the 2.3 MW wind turbine, particularly for energy. This indicates that deep-water wind farms would perform better in terms of environmental performance as larger turbines with higher capacity factors are used. The scale of difference observed at the deep-water location, where a 2.3 MW wind turbine requires 11 months to offset the energy used and the 5 MW wind turbine is paid off in 9.6 months, is an important finding that will determine the future of offshore wind farm planning. Similarly, the evaluation of the same size turbine installed at various locations, as presented in Figure 6, shows that at the current technological level in the U.S., the performance is better for onshore turbines. The main reason is the emissions and energy associated with the used turbine foundation. The larger the turbine, the higher the percentage of material and energy use in the manufacturing process.
Onshore CO2 and energy use is approximately half of the energy used and CO2 emitted of offshore shallow-water turbines, whereas the deep-water farms show an increase of 39.8% and 36.1% of energy and CO2 increase, respectively, when compared to the same size at the onshore locations. Shallow-water locations tend to have the highest impact. The installation phase is one of the principal reasons there is an increase in the environmental impact of the offshore shallow-water relative to the offshore deep-water wind farms. An offshore shallow-water turbine has a monopole foundation that requires long hours of heavy equipment use, including cranes, hydraulic hammers, pile drivers, jack-up vessels, and tugboats. The operation of this heavy equipment consumes fossil-fueled sources responsible for the increase of CO2 and other GHGs in the atmosphere. On the other hand, an offshore deep-water installation does not require much use of fossil fuels because the entire turbine is installed onshore (including the floating foundation) and towed to the designed offshore location.

4.2. Sensitivity Analysis of Material Stage to Electricity Sourcing

Table 8 presents the effect of changing the electricity source during the material extraction/processing stage on the life cycle impact in the midpoint categories. The relative change observed for each scenario is calculated with reference to the base case (default U.S. grid) and expressed as a percentage. The results indicate that the effect on land impact categories is not significant with an increasing natural gas contribution in place of lignite coal. This is mostly due to the fact that all three categories (land occupation, terrestrial ecotoxicity, and terrestrial acidification and nitrification) relate directly to soil pollutants (heavy metals) that would not change with an increasing natural gas contribution. As specified in the Ecoinvent database, the damage factors for soil emissions are mostly from mining for raw materials (kg SO2_eq into air, kg of triethylene glycol into soil_eq, and the area in m2 of land), which has no link to electricity generation emissions. With respect to air emissions, the analysis shows that by using the Texas electricity mix, the material stage contribution reduces in respiratory inorganics by 5% and global warming by 1%. The low value in respiratory inorganic emissions reflects the percentage of coal (lignite) used for electricity generation in the ERCOT region (28% versus 55% from the U.S. grid) [32]. Lowering the respiratory inorganic emissions offers potential to decrease the damage to human health and ecosystem quality. In contrast, for the Texas grid scenario, impacts in the respiratory organics and ozone layer depletion categories increase when compared with the default U.S. grid. The Texas grid increased the ozone layer depletion by 4% and the impact in respiratory organics increased by 1%. These results are consistent with the LCA study conducted by Atilgan and Azapagic (2014), which states that ozone layer depletion increases when natural gas electricity generation plants reduce their share of lignite and hard coal electricity [52]. Air emissions results show that, apart from the Texas electricity mix, all other scenarios remained constant. The comparison of impact on water quality shows negligible changes across all scenarios. The total impact of aquatic acidification, aquatic eutrophication, and aquatic ecotoxicity remains constant for all scenarios due to the direct release of water pollutants at all existing electricity generation units complying with the discharge standards of the Clean Water Act. The results also indicate that the impact categories of ionizing radiation and carcinogens would increase with a natural gas source contribution. The Texas electricity mix has 11% more fossil fuel than the U.S. mix due to a higher share of electricity generated from natural gas [32]. As per the ionizing radiation, all scenarios report very little variation with the exception of LG-25% Nuclear. A 10% increase was observed primarily from mining activity, the enrichment process, and the operation of reactors. Under this scenario, the results from nuclear energy indicate that the benefits of exchanging lignite with nuclear fuel is not significant to overcome the environmental impact caused by radioactive substances. The evaluation of change in electricity share during the extraction/material processing phase suggests that despite the increase in ozone layer depletion, the reduction of lignite use in electricity generation benefits the overall environmental impact for this stage. Although the trends observed in this study for the life cycle impact of onshore and offshore wind turbines can be extrapolated for other geographic locations, the quantitative estimates for payback times and emissions would be dependent on local characteristics, such as the selection of foundations, electricity usage, construction process efficiency, and modes of transportation.

5. Conclusions

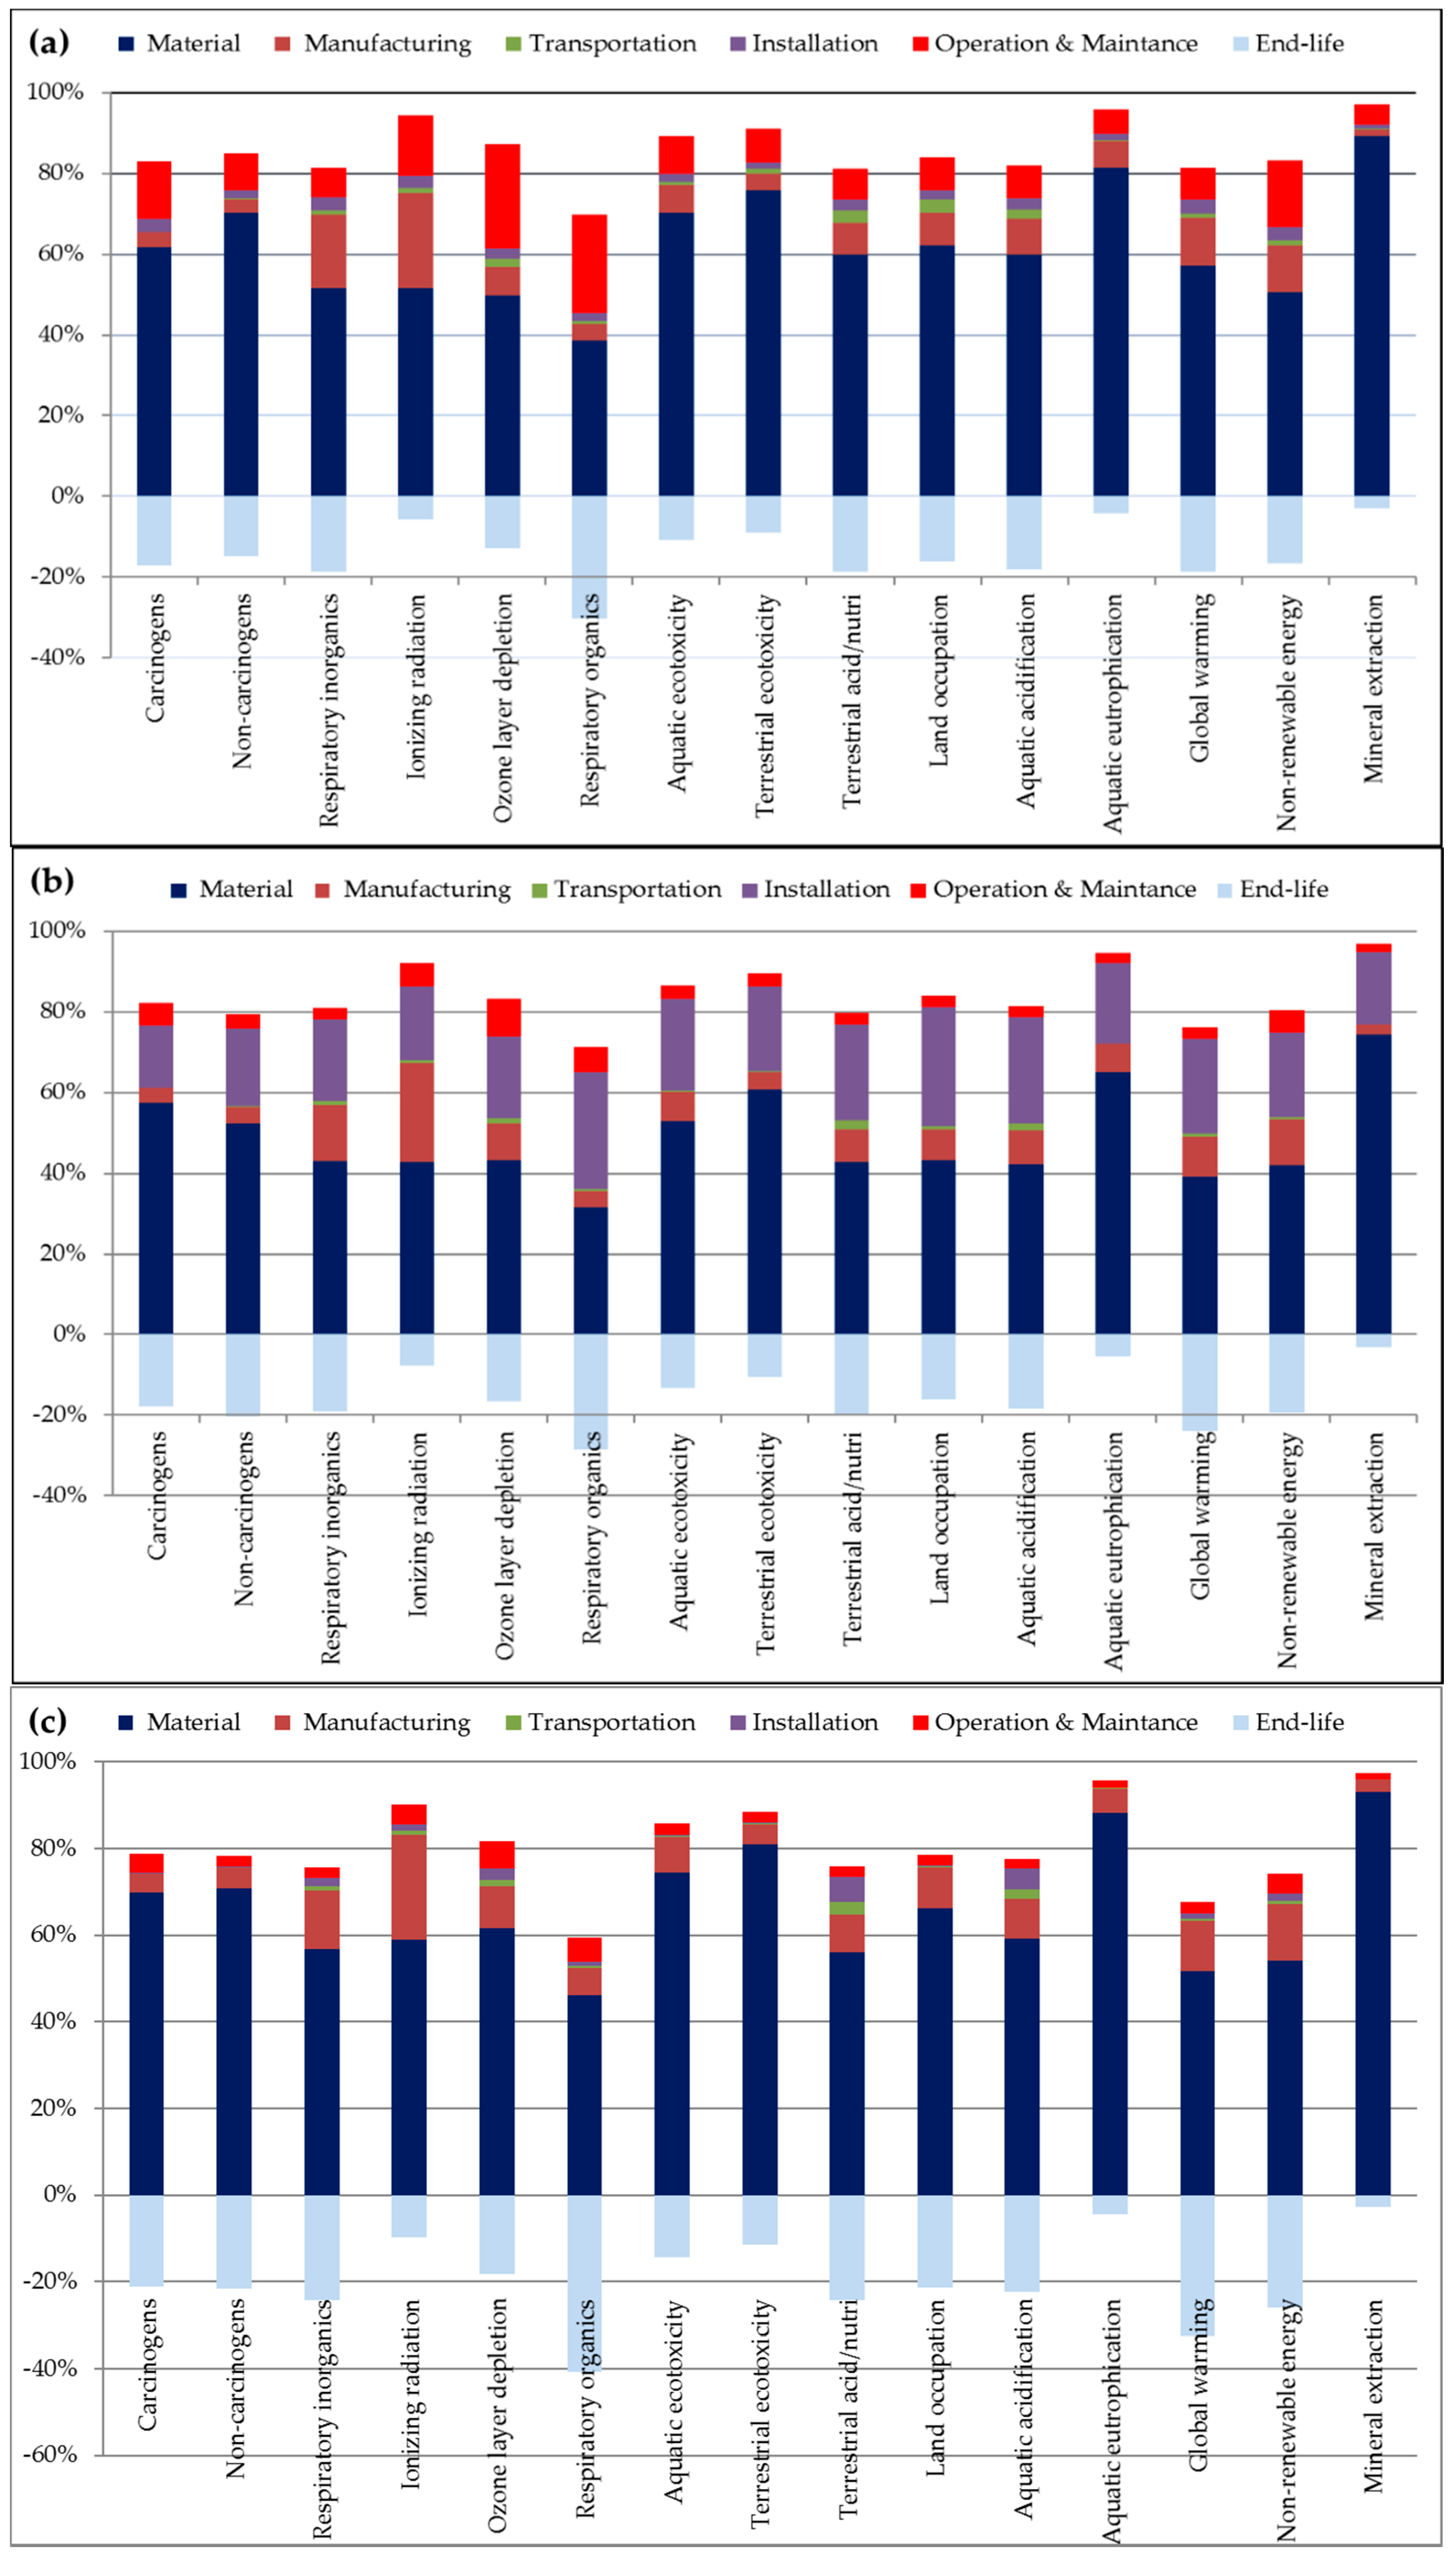
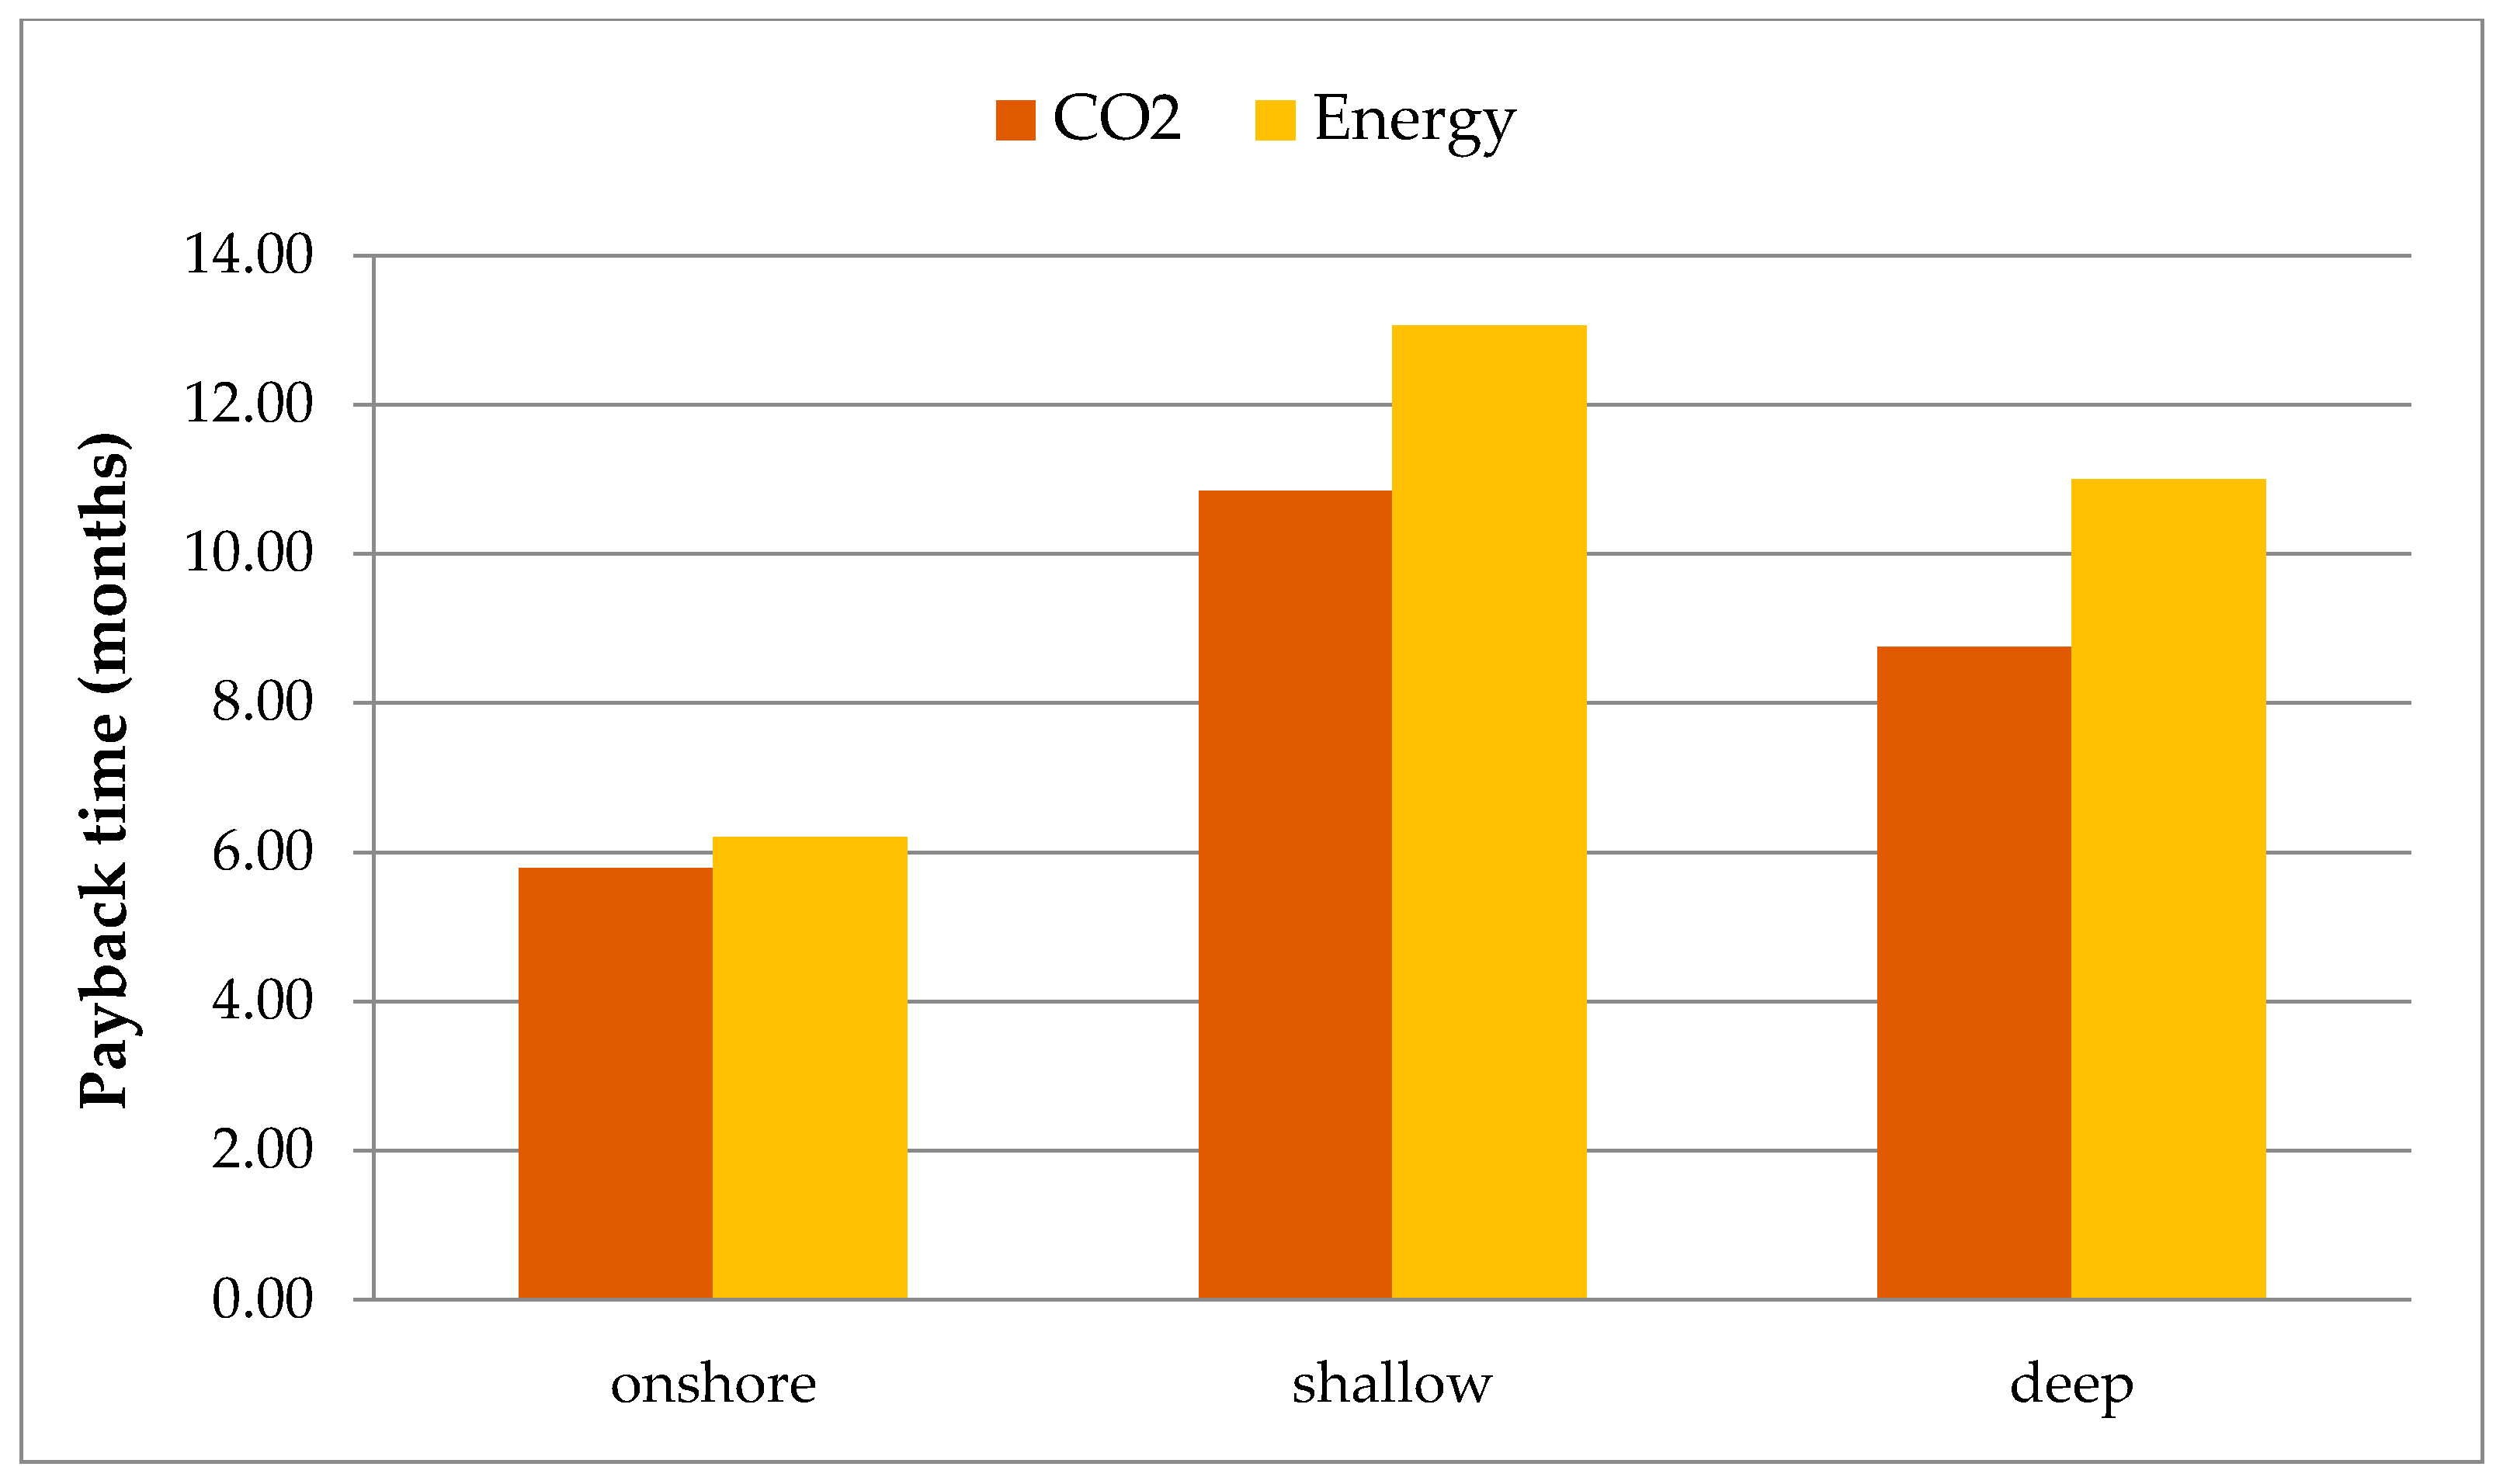
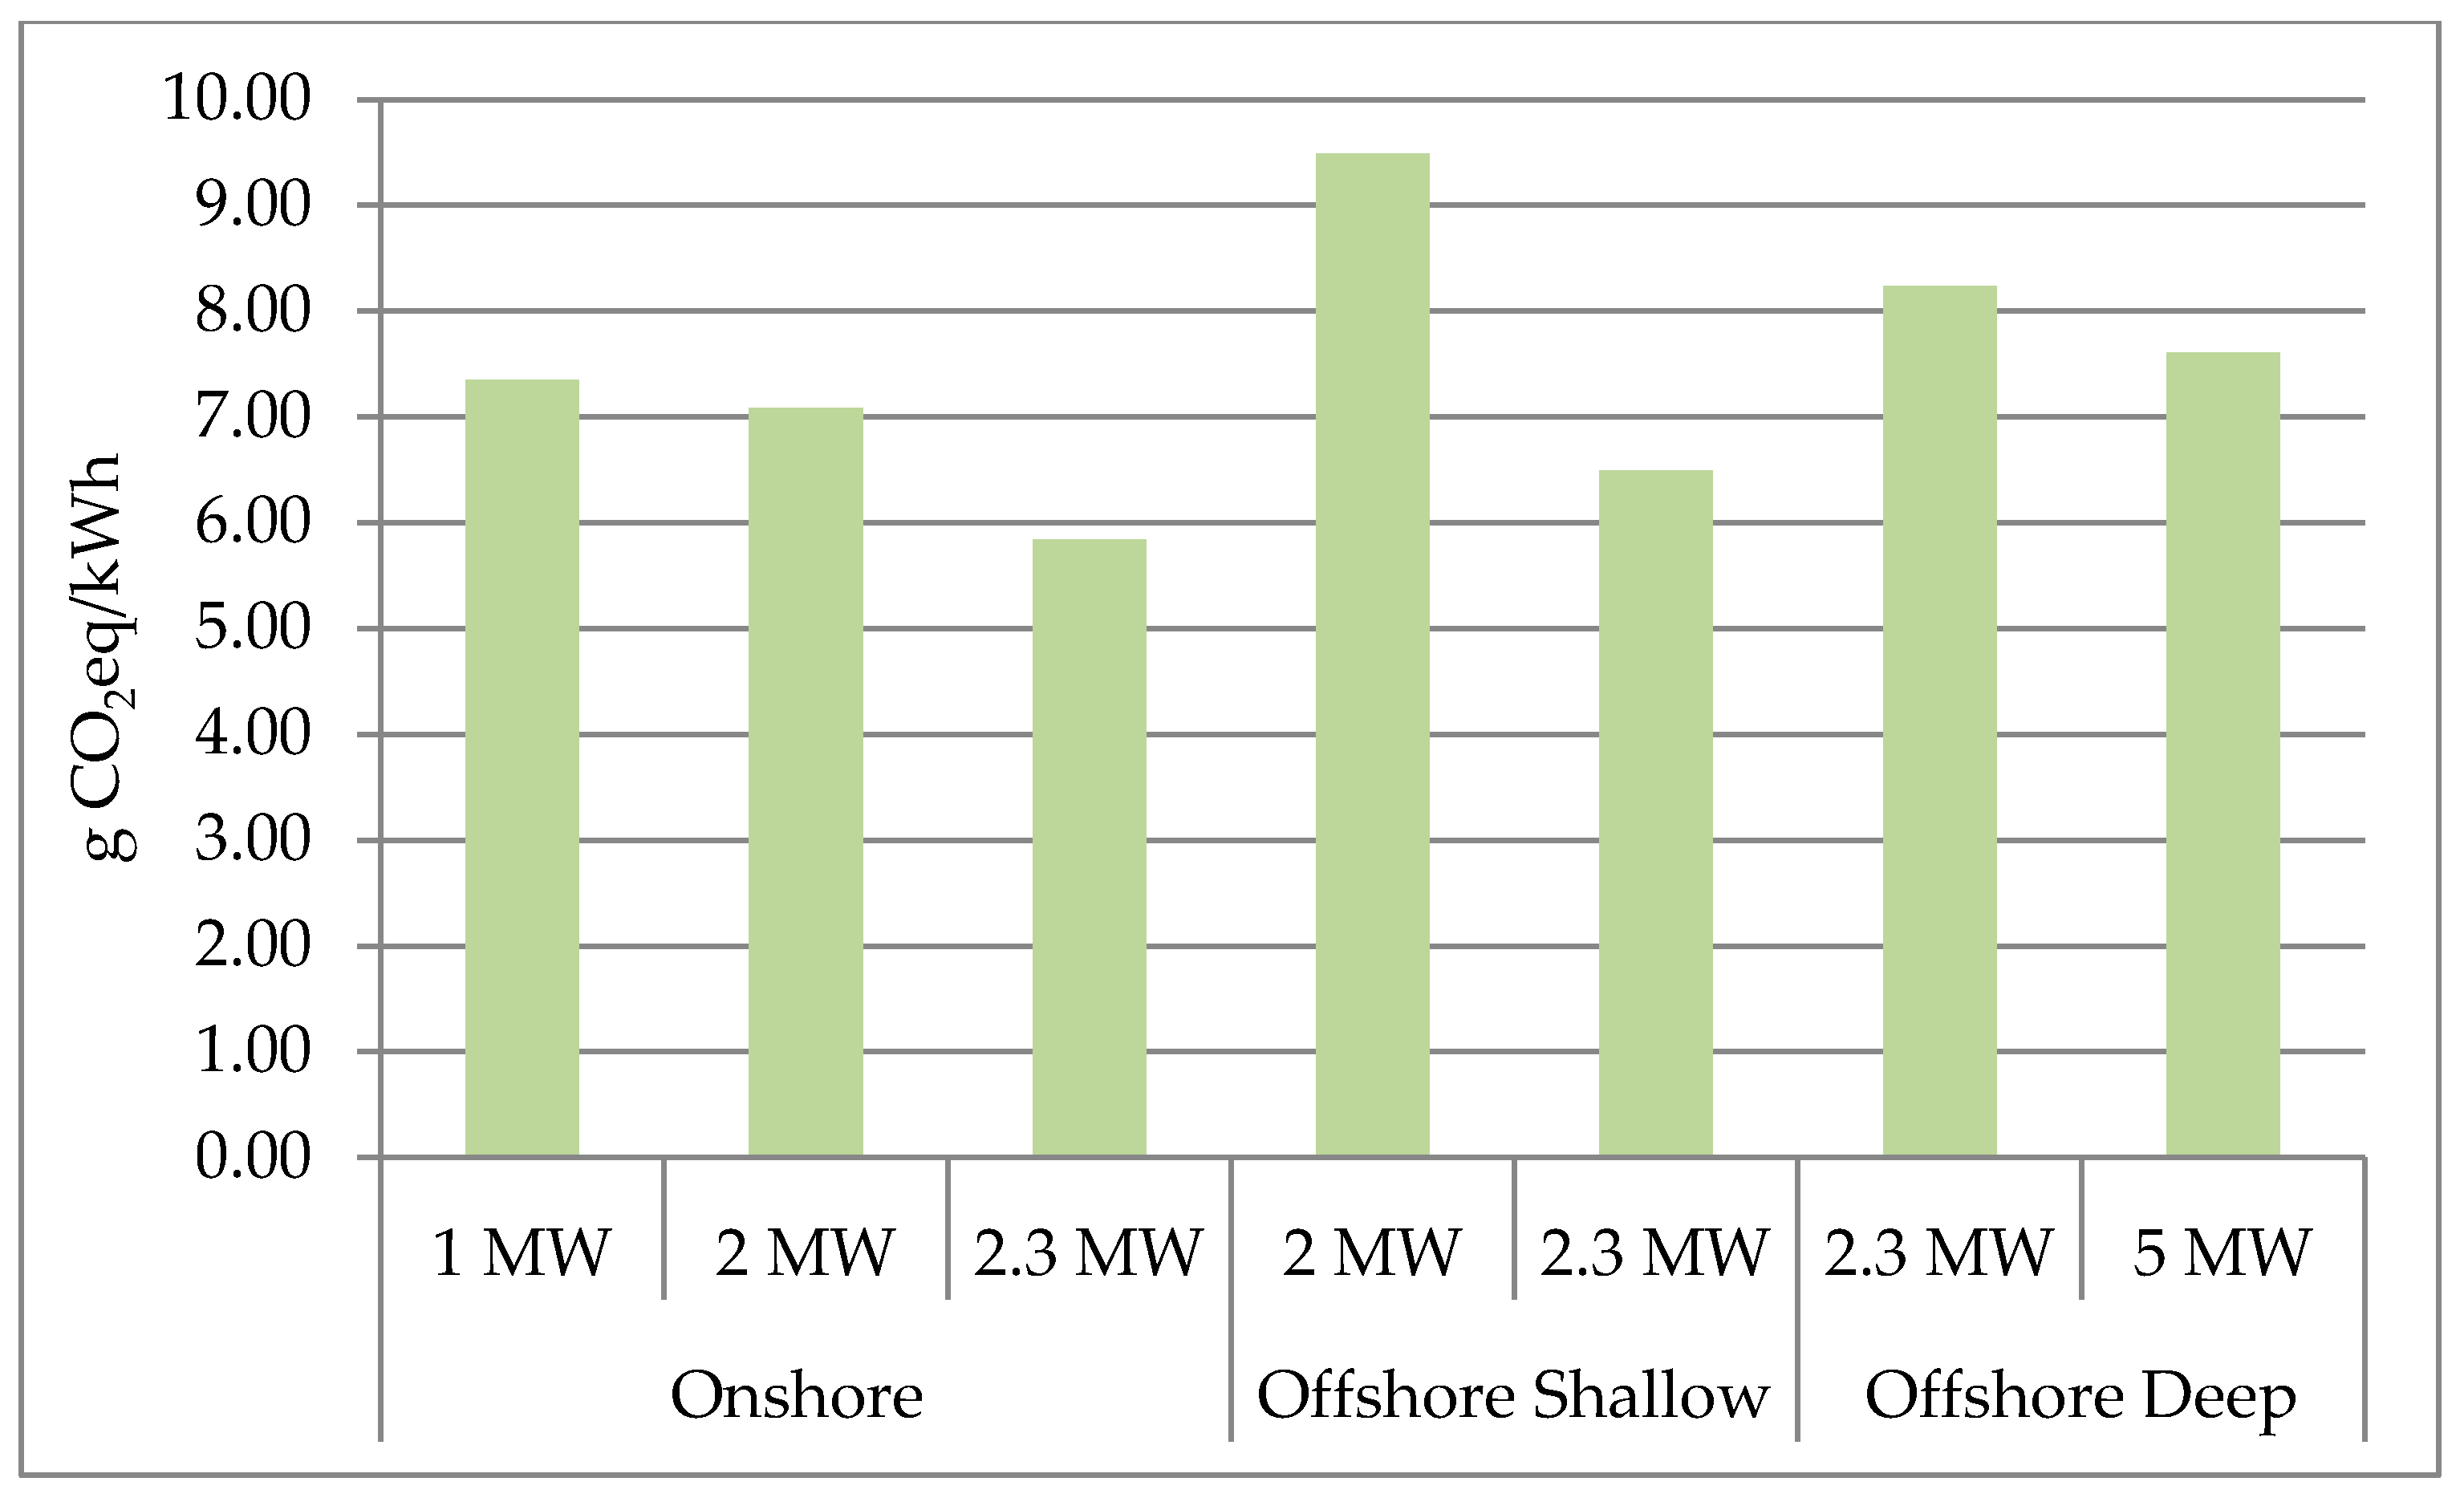
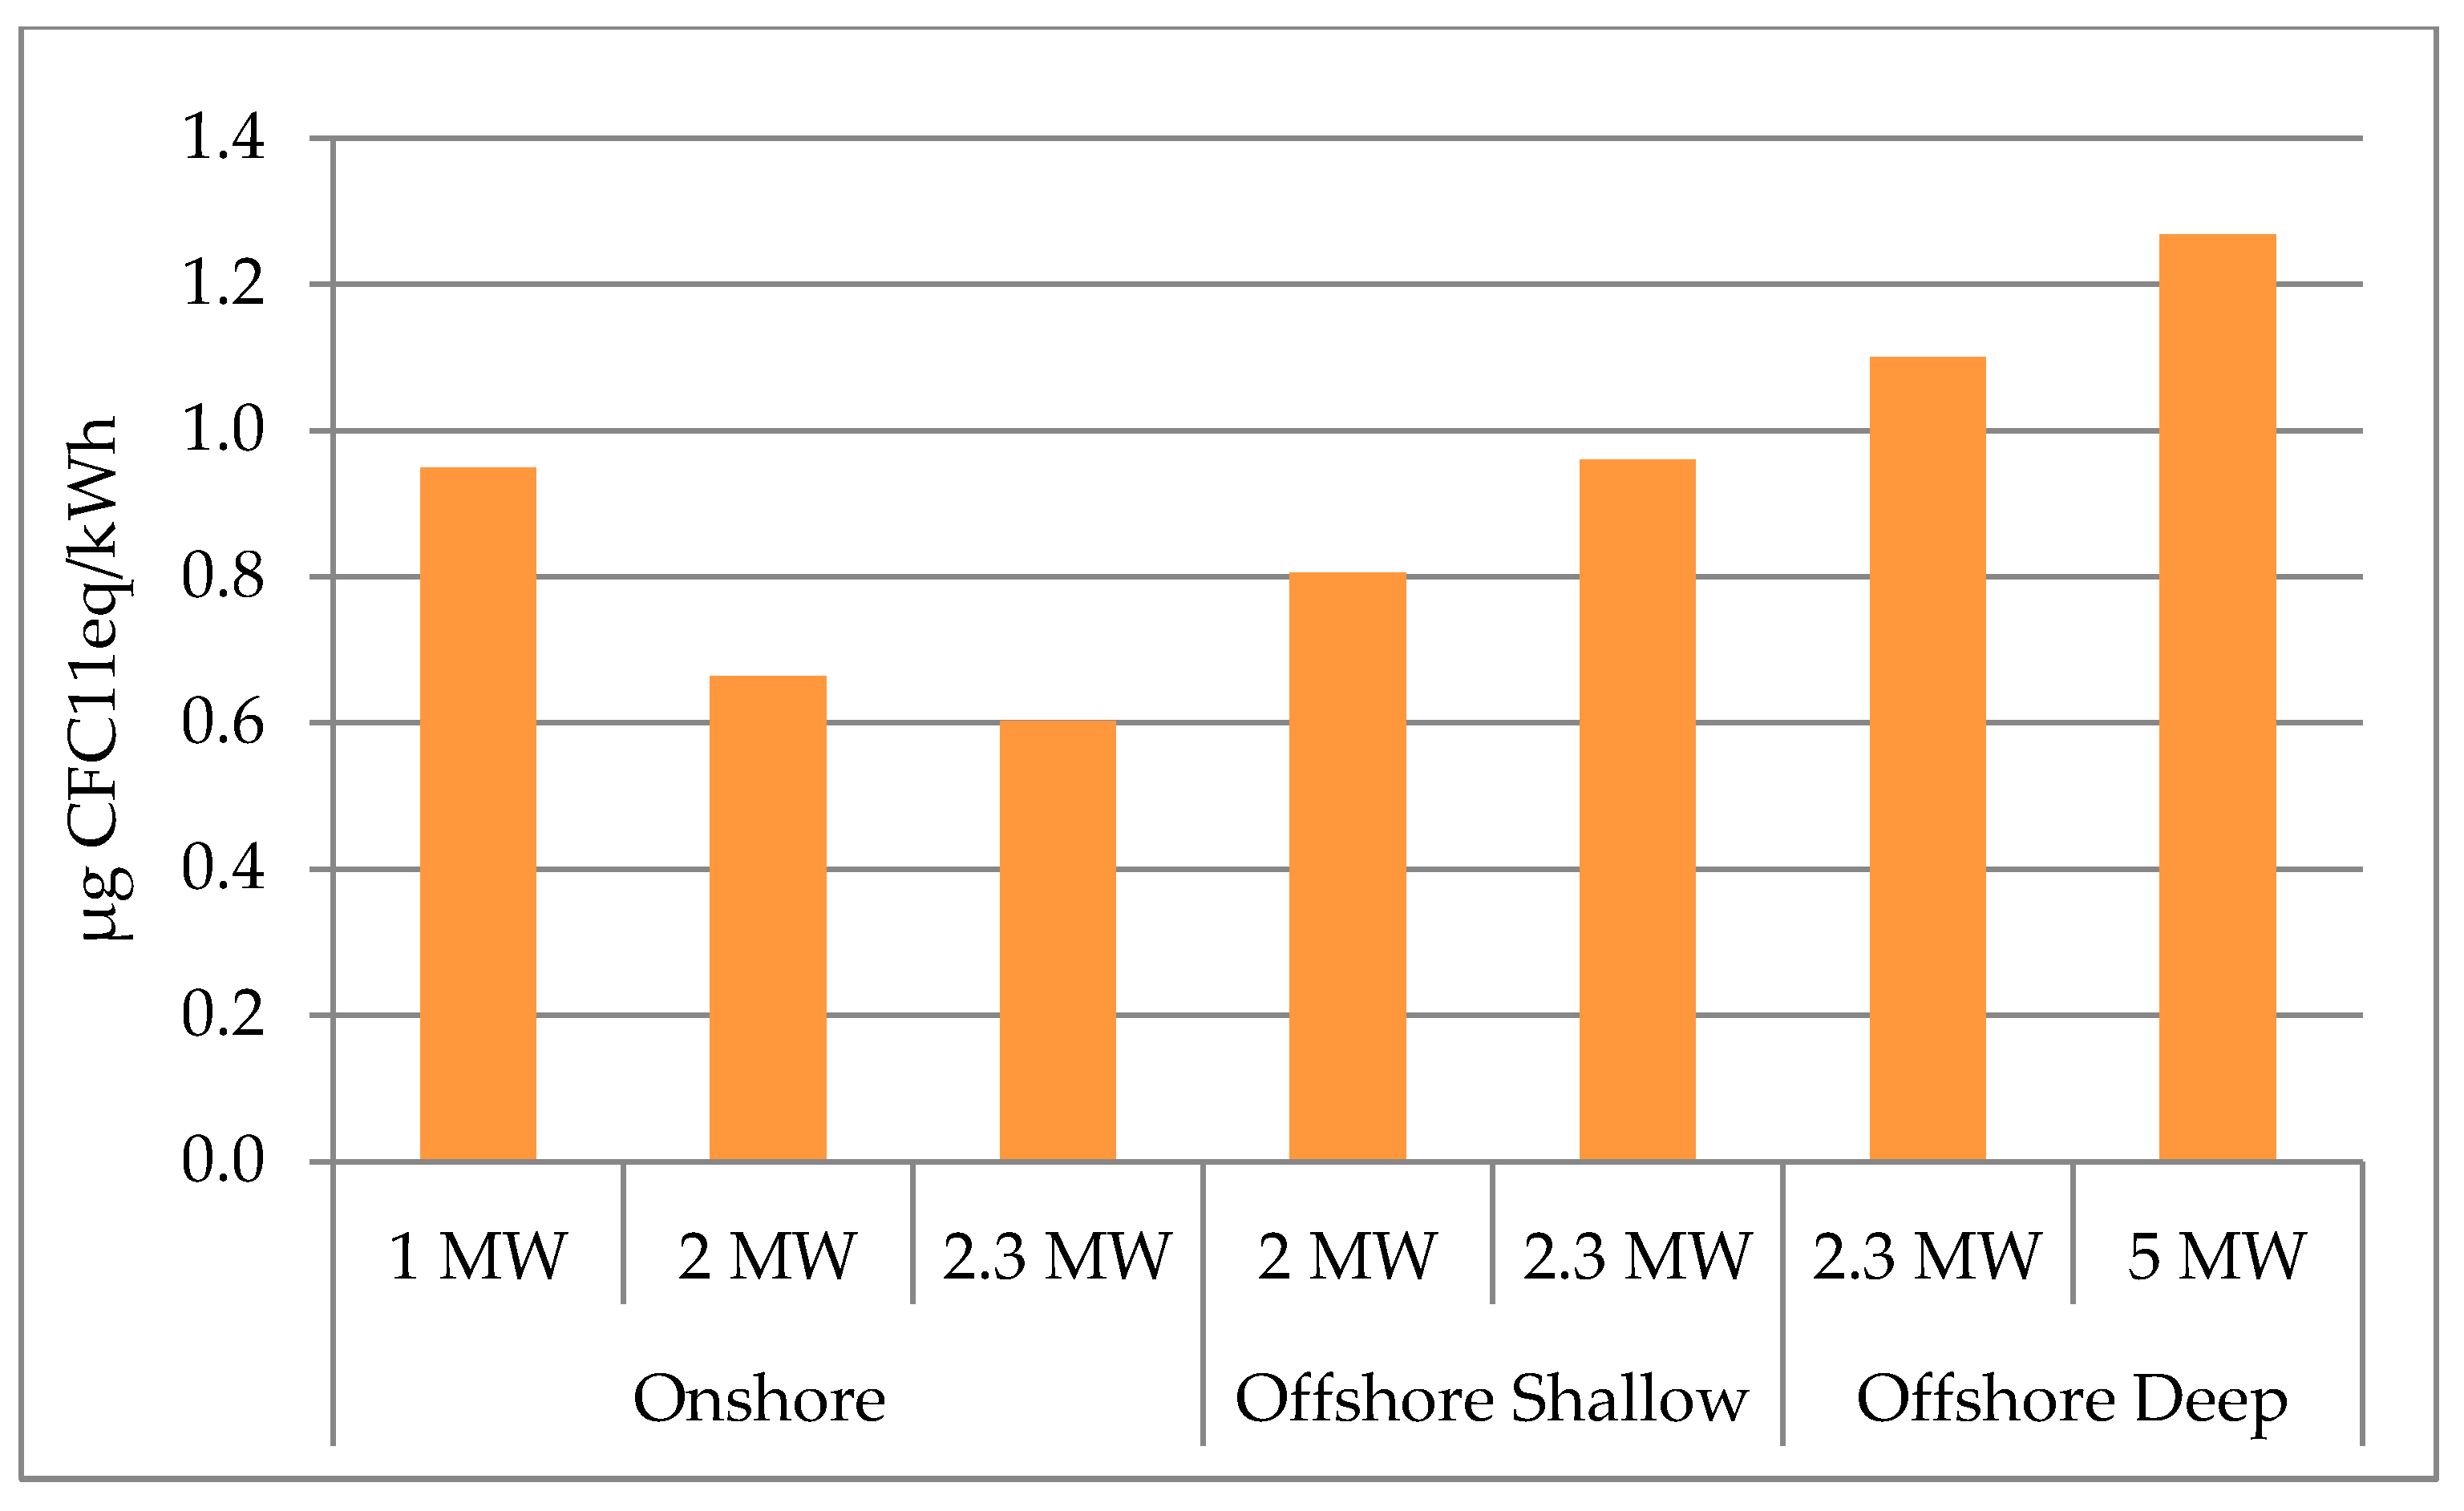
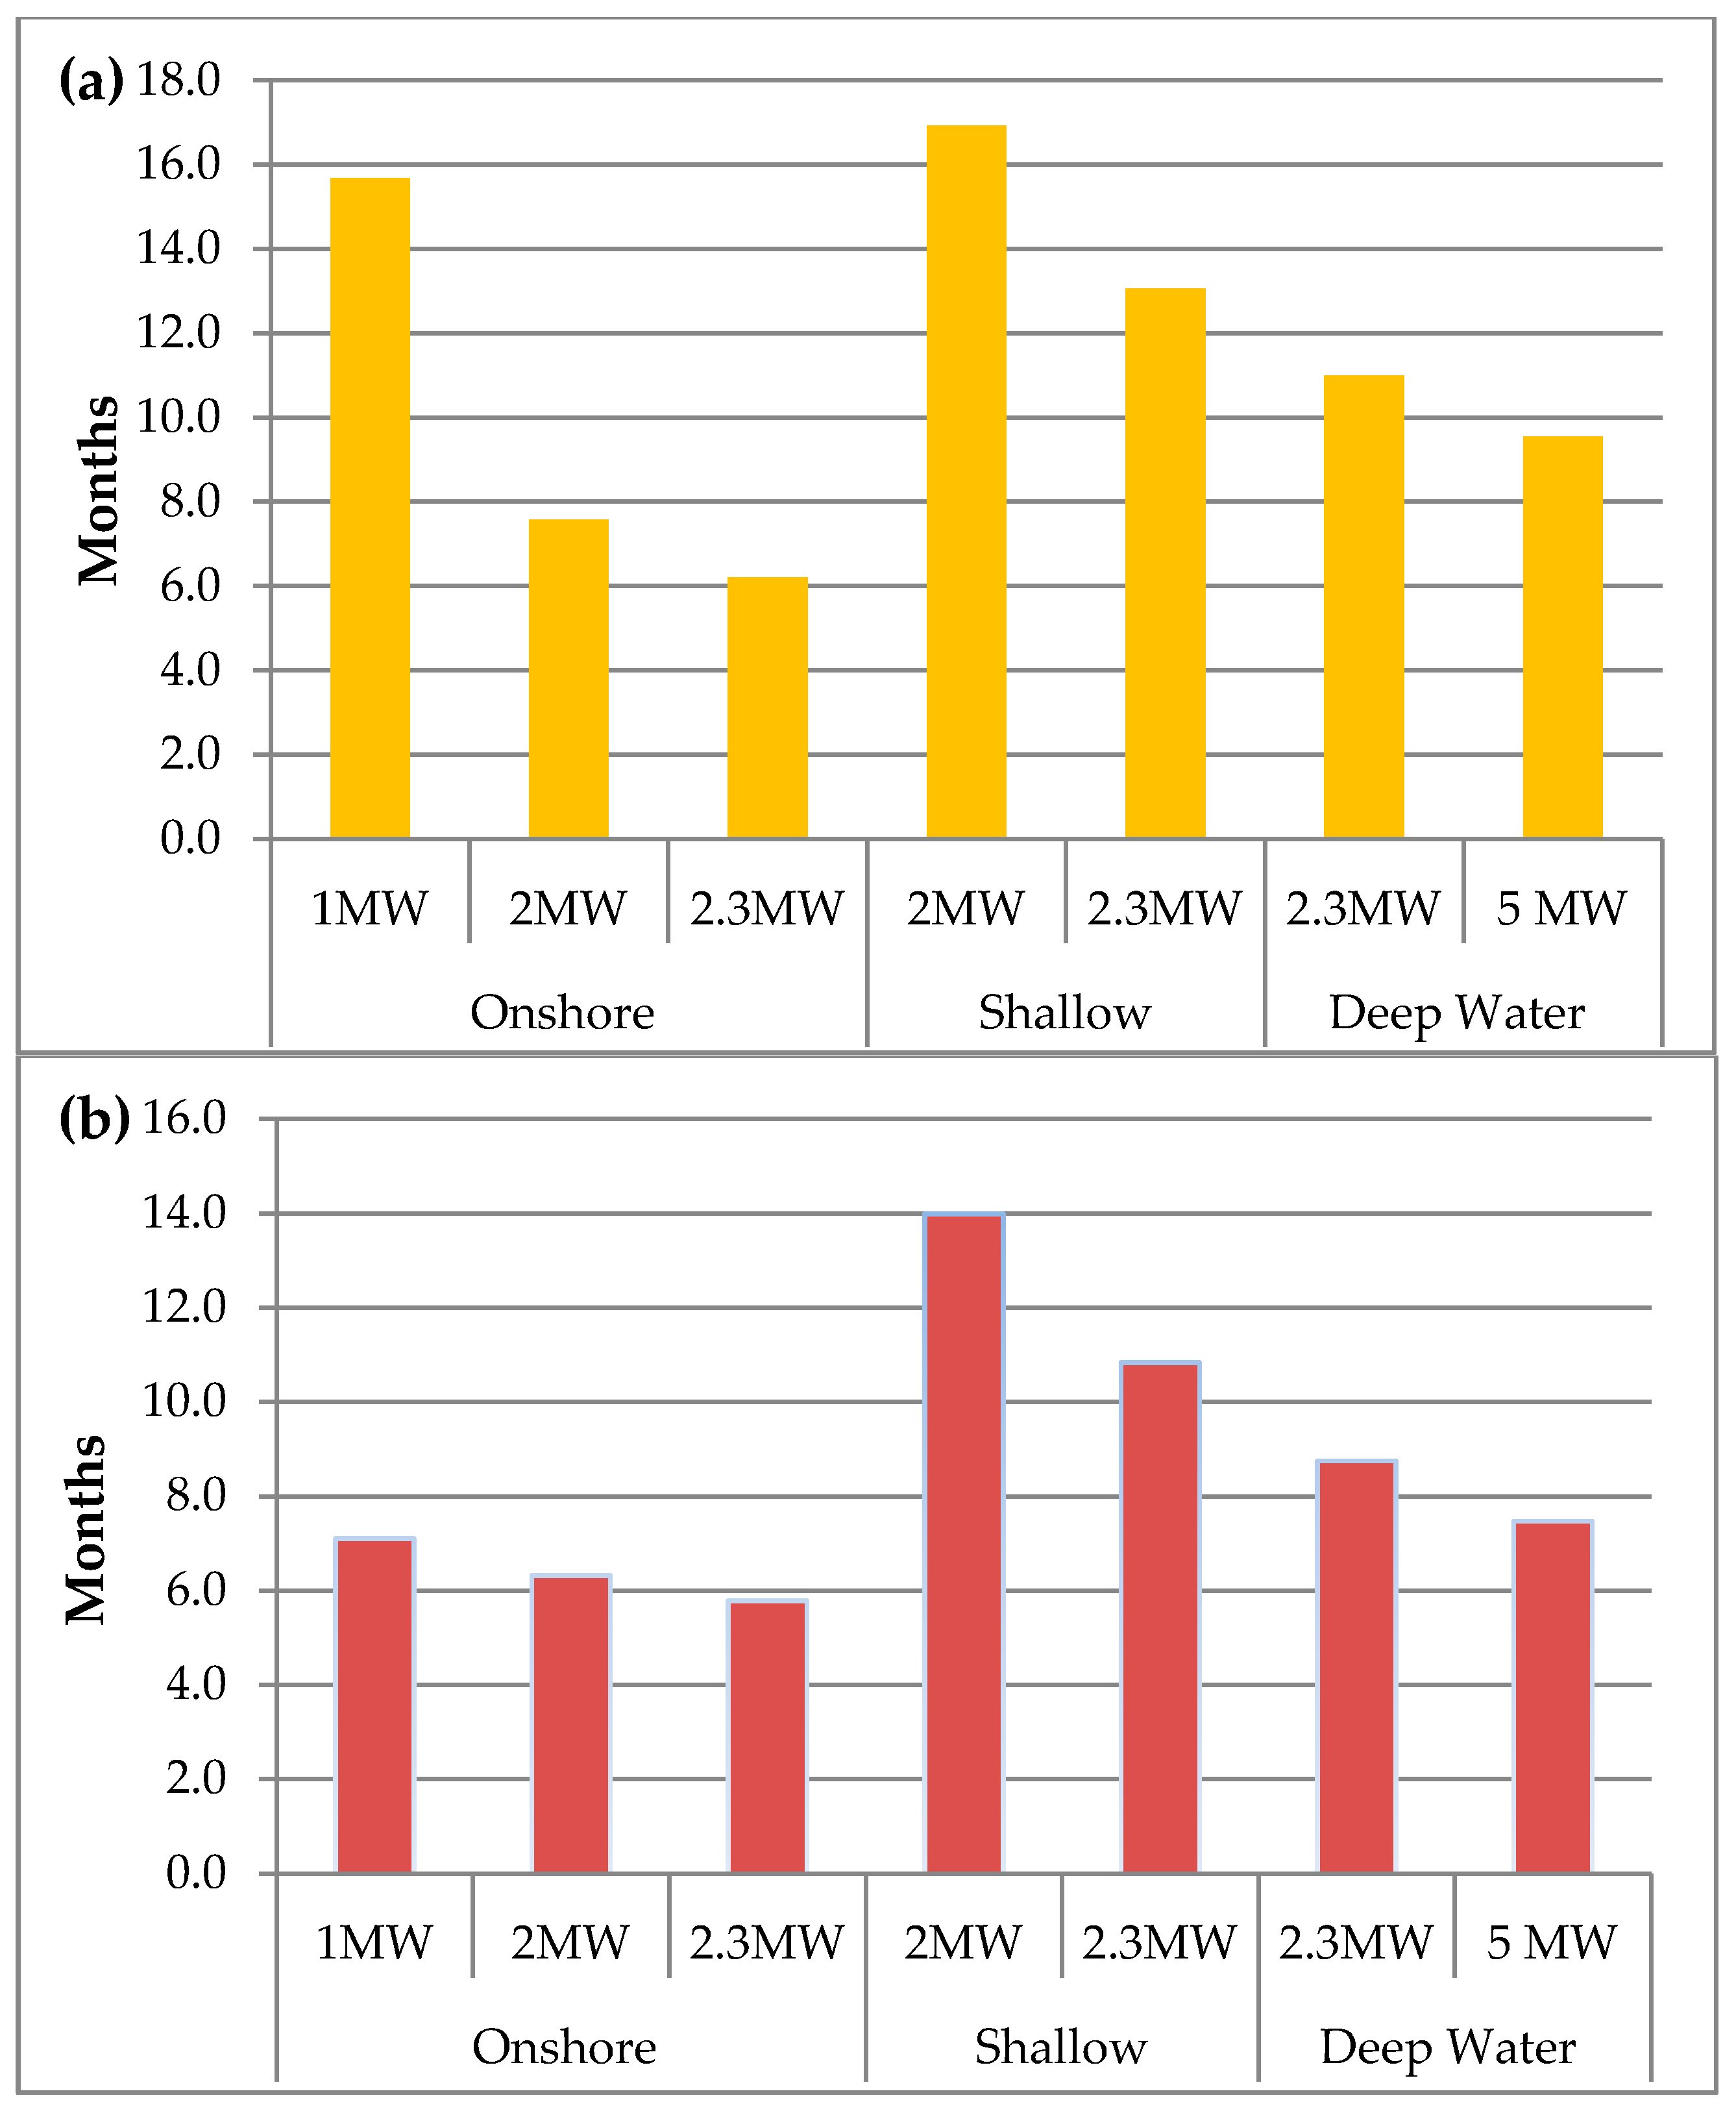
This study conducted an environmental life cycle impact assessment of three wind farms at onshore, shallow-, and deep-water locations in Texas and the adjoining gulf coast. The material extraction/processing stage was identified as the critical stage responsible for an average contribution of 72% of potential impact in onshore, 58% in shallow-water, and 82% in deep-water locations across 15 midpoint impact categories in the Impact 2002+ method. Results from the inclusion of recycling as an option for the disassembly of wind turbines suggests that recycling of steel could result in a lowering of 20% of the average impact across the 15 midpoint impact categories. For the operation and maintenance stage, onshore wind farms have higher emissions than offshore wind farms as a function of a relatively lower percentage of emissions resulting from a relatively streamlined installation process for onshore wind farms. The major parts, such as towers, foundations, and blades, consume more electricity during the fabrication period resulting in higher emissions. The installation and operation stages contributed less than 2% of emissions in the onshore and deep-water locations, whereas the shallow-water wind farms have a 30% contribution from installation. The overall emissions per kWh of electricity produced varies from 5.63 to 7.29 gCO2eq, suggesting an inverse relationship between turbine size and emissions. Onshore wind farms have shorter payback times for CO2 and energy compared to shallow- and deep-water wind farms, although offshore wind farms have lower GHG emissions per kWh than onshore wind farms. A sensitivity analysis of the material extraction/processing stage to the electricity sourcing stage indicates that the replacement of lignite coal with natural gas would lead to marginal improvements in midpoint impact categories and that replacement with wind offers better environmental performance.

Author Contributions

R.R.K. conceived the idea, obtained funding, and designed the study outline with H.D. and J.C.; J.C. performed the literature review and conducted the life cycle assessment with SimaPro®; J.C. and V.S.V.B. analyzed the data and drafted the paper; R.R.K. and Z.H. supervised the project.

Acknowledgments

This work is funded by an external grant from the National Science Foundation (NSF) through the Center for Energy and Environmental Sustainability (CEES), a CREST Center, Award No. 1036593.

Conflicts of Interest

The authors declare no conflict of interest. The sponsors had no role in the design of the study; in the collection, analyses, or interpretation of data; in the writing of the manuscript, and in the decision to publish the results.

Appendix

Table A1. Turbine inventory.
Onshore Turbine Mass (kg)Offshore Shallow-Water Turbine Mass (kg)Offshore Deep-Water Turbine Mass (kg)
Turbine main parts1 MW2 MW2.3 MW2 MW2.3 MW2.3 MW5.0 MW
ROTOR33,562.0111,826.136,204.137,153.126,529.626,529.669,443.6
Cast Iron3126.226,366.28500.08500.0---
Epoxy Resin3859.38903.19368.811,603.112,035.112,035.116,689.5
Steel16,928.324,082.15400.05400.01077.51077.5-
Prepreg (fiberglass or carbon fiber)9648.252,474.812,935.311,650.013,416.913,416.952,754.1
NACELLE32,213.176,477.059,941.8710,949.7132,777.7132,777.71,198,059.3
Cast Iron11,083.820,481.03048.926,366.268,663.168,663.1990,401.2
Steel-1002.250,538.624,082.150,538.650,538.6156,091.0
Copper2543.621583.22787.91583.210,028.710,028.743,715.3
Chromium16,928.351,379.51038.951,379.01077.51077.56325.8
Aluminum596.4841.41336.61270.51227.81227.8960.8
Electronics (m2)2929.6435.6401.04668.8451.9451.9565.2
Oil (lubricant)675.0754.1790.0601,600.0790.0790.0-
TOWER56,661.5195,425.0245,723.3165,000.01,123,095.01,123,095.0347,460.0
Steel56,661.5195,425.0245,723.3165,000.01,123,095.01,123,095.0347,460.0
FOUNDATION9605.410,705.427,556.062,551.0600,000.0862,500.01,150,000.0
Concrete (m3)650.0750.0825.0----
Steel8955.49955.426,731.062,551.0600,000.0862,500.01,150,000
OTHERS1315.83647.43784.33528.62918.810,406.77487.8
Polyethylene544.72852.22814.42926.92918.82918.8-
Coated zinc771.2795.2969.9601.7-7487.87487.8
Total mass133,357.8398,080.9373,209.5979,182.41,885,321.12,155,308.92,772,450.7
Table A2. Scenarios of electricity mix.
ParameterDEFAULT (U.S.)LG-25% NGLG-50% NGLG-25% NUCLEARLG-25% WINDTEXAS MIX
Wood ship0.3%0.3%0.3%0.3%0.3%0.0%
Wind 3 MW0.1%0.1%0.1%0.1%0.1%0.0%
Wind 1 MW to 3 MW11.6%11.6%11.6%11.6%18.9%11.6%
Wind 1 MW1.0%1.0%1.0%1.0%1.0%1.0%
Oil0.1%0.1%0.1%0.1%0.1%0.0%
Nuclear pressure water9.3%9.3%9.3%9.3%9.3%0.0%
Nuclear boiler4.8%4.8%4.8%12.1%4.8%11.0%
Naturalgascogeneration 400 MW0.6%0.6%0.6%0.6%0.6%0.0%
Naturalgascogeneration 100 MW0.9%0.9%0.9%0.9%0.9%0.0%
Natural Gas3.9%11.2%18.5%3.9%3.9%48.4%
Natural_Gas_Comb_Cycle0.3%0.3%0.3%0.3%0.3%0.0%
Lignite29.1%21.9%14.6%21.9%21.9%11.2%
Hydrorunoff3.9%3.9%3.9%3.9%3.9%0.0%
Hydrores1.0%1.0%1.0%1.0%1.0%0.0%
Hard coal26.5%26.5%26.5%26.5%26.5%16.8%
Cogeneration_Oil0.0%0.0%0.0%0.0%0.0%0.0%
CASK0.1%0.1%0.1%0.1%0.1%0.0%
CAMB5.8%5.8%5.8%5.8%5.8%0.0%
Biogas0.6%0.6%0.6%0.6%0.6%0.0%
100.0%100.0%100.0%100.0%100.0%100.0%

References

  1. U.S. Energy Information Administration. Renewable Energy Generating Capacity and Generation; U.S. Energy Information Administration: Washington, DC, USA, 2018. Available online: https://www.eia.gov/outlooks/aeo/data/browser/#/?id=16-AEO2018&cases=ref2018&sourcekey=0 (accessed on 11 March 2018).
  2. U.S. Energy Information Administration. Annual Energy Outlook 2018; U.S. Energy Information Administration: Washington, DC, USA, 2018.
  3. U.S. Energy Information Administration. U.S. Energy-Related Carbon Dioxide Emissions, 2016; U.S. Energy Information Administration: Washington, DC, USA, 2016.
  4. Cullen, J. Measuring the Environmental Benefits of Wind-Generated Electricity. Am. Econ. J. Econ. Policy 2013, 5, 107–133. [Google Scholar] [CrossRef] [Green Version]
  5. American Wind Energy Association (AWEA). Wind Energy in Texas; AWEA: Washington, DC, USA, 2016. [Google Scholar]
  6. U.S. Department of Energy. 2016 Offshore Wind Technologies Market Report; U.S. Department of Energy: Washington, DC, USA, 2016.
  7. U.S. Department of Energy. 2014–2015 Offshore Wind Technologies Market Report; U.S. Department of Energy: Washington, DC, USA, 2015.
  8. 4COffshore. Block Island Wind Farm; Orbis Energy Center: Suffolk, UK, 5 December 2017; Available online: https://www.4coffshore.com/windfarms/block-island-wind-farm-united-states-us12.html (accessed on 6 June 2018).
  9. Musial, W.S.; Butterfield, S.; Boone, A. Feasibility of Floating Platform Systems for Wind Turbines. In Proceedings of the 23rd ASME Wind Energy Symposium, Reno, NV, USA, 5–8 January 2004. [Google Scholar]
  10. Dolan, S. Life Cycle Assessment and Emergy Synthesis of a Theoretical Offshore Wind Farm for Jacksonville, Florida; Department of Mechanical & Aerospace Engineering, University of Florida: Gainesville, FL, USA, 2007; p. 125. [Google Scholar]
  11. Haapala, K.R.; Prempreeda, P. Comparative life cycle assessment of 2.0 MW wind turbines. Int. J. Sustain. Manuf. 2014, 3, 170–185. [Google Scholar] [CrossRef]
  12. Kabir, R.M.; Rooke, B.; Dassanayake, G.D.M.; Fleck, B.A. Comparative life cycle energy, emission, and economic analysis of 100 kW nameplate wind power generation. Renew. Energy 2012, 37, 133–141. [Google Scholar] [CrossRef]
  13. Lenzen, M.; Wachsmann, U. Wind turbines in Brazil and Germany: An example of geographical variability in life-cycle assessment. Appl. Energy 2004, 77, 119–130. [Google Scholar] [CrossRef]
  14. Kadiyala, A.; Kommalapati, R.; Huque, Z. Characterization of the life cycle greenhouse gas emissions from wind electricity generation systems. Int. J. Energy Environ. Eng. 2017, 8, 55–64. [Google Scholar] [CrossRef]
  15. Khan, I.F.; Hawboldt, K.; Iqbal, M.T. Life Cycle Analysis of wind–fuel cell integrated system. Renew. Energy 2005, 30, 157–177. [Google Scholar] [CrossRef]
  16. Pehnt, M. Dynamic life cycle assessment (LCA) of renewable energy technologies. Renew. Energy 2006, 31, 55–71. [Google Scholar] [CrossRef]
  17. Ardente, F.; Beccali, M.; Cellura, M.; Brano, V.L. Energy performances and life cycle assessment of an Italian wind farm. Renew. Sustain. Energy Rev. 2008, 12, 200–217. [Google Scholar] [CrossRef]
  18. Guezuraga, B.; Zauner, R.; Pölz, W. Life cycle assessment of two different 2 MW class wind turbines. Renew. Energy 2012, 37, 37–44. [Google Scholar] [CrossRef]
  19. Oebels, B.K.; Pacca, S. Life cycle assessment of an onshore wind farm located at the northeastern coast of Brazil. Renew. Energy 2013, 53, 60–70. [Google Scholar] [CrossRef]
  20. Wagner, H.-J.; Baack, C.; Eickelkamp, T.; Epe, A.; Lohmann, J.; Troy, S. Life cycle assessment of the offshore wind farm alpha ventus. Energy 2011, 36, 2459–2464. [Google Scholar] [CrossRef]
  21. Richmond, M.; Balaam, T.; Causon, P.; Cevasco, D.; Leimeister, M.; Kolios, A.; Brennan, F. Multi-Criteria Decision Analysis for Benchmarking Human-Free Lifting Solutions in the Offshore Wind Energy Environment. Energies 2018, 11, 1175. [Google Scholar] [CrossRef]
  22. Uraz, E. Offshore Wind Turbine Transportation & Installation Analyses; Department of Wind Energy, Gotland University: Visby, Sweden, 2011; p. 65. [Google Scholar]
  23. Wang, W.; Bai, Y. Investigation on installation of offshore wind turbines. J. Mar. Sci. Appl. 2010, 9, 175–180. [Google Scholar] [CrossRef]
  24. Myhr, A.; Bjerkseter, C.; Ågotnes, A.; Nygaard, T.A. Levelised cost of energy for offshore floating wind turbines in a life cycle perspective. Renew. Energy 2014, 66, 714–728. [Google Scholar] [CrossRef]
  25. Ku, N.; Roh, M.-I. Dynamic response simulation of an offshore wind turbine suspended by a floating crane. Ships Offshore Struct. 2015, 10, 621–634. [Google Scholar] [CrossRef]
  26. Jiang, Z.; Li, L.; Gao, Z.; Halse, K.H.; Sandvik, P.C. Dynamic response analysis of a catamaran installation vessel during the positioning of a wind turbine assembly onto a spar foundation. Mar. Struct. 2018, 61, 1–24. [Google Scholar] [CrossRef]
  27. Huang, Y.-F.; Gan, X.-J.; Chiueh, P.-T. Life cycle assessment and net energy analysis of offshore wind power systems. Renew. Energy 2017, 102, 98–106. [Google Scholar] [CrossRef]
  28. Bonou, A.; Laurent, A.; Olsen, S.I. Life cycle assessment of onshore and offshore wind energy-from theory to application. Appl. Energy 2016, 180, 327–337. [Google Scholar] [CrossRef]
  29. International Organization for Standardization (ISO). ISO 14040: 2006 Environmental Management: Life Cycle Assessment—Principles and Framework; ISO Central Secretariat: Geneva, Switzerland, 2006. [Google Scholar]
  30. Jolliet, O.; Margni, M.; Charles, R.; Humbert, S.; Payet, J.; Rebitzer, G.; Rosenbaum, R. IMPACT 2002+: A new life cycle impact assessment methodology. Int. J. Life Cycle Assess. 2003, 8, 324. [Google Scholar] [CrossRef]
  31. National Renewable Energy Laboratory (NREL). National Wind Resource Assessment: Wind Resource Maps; NREL: Golden, CO, USA, 2017.
  32. Electric Reliability Council of Texas (ERCOT). Grid Information: ERCOT Region Map; ERCOT: Austin, TX, USA, 2017; Available online: http://www.ercot.com/news/mediakit/maps (accessed on 10 September 2016).
  33. Anthony Lopez, B.R.; Heimiller, D.; Blair, N.; Porro, G. U.S. Renewable Energy Technical Potentials: A GIS-Based Analysis; National Renewable Energy Laboratory: Golden, CO, USA, 2012.
  34. Marc Schwartz, D.H.; Haymes, S.; Musial, W. Assessment of Offshore Wind Energy Resources for the United States; National Renewable Energy Laboratory: Golden, CO, USA, 2010.
  35. Brannstrom, C.; Tilton, M.; Klein, A.; Jepson, W. Spatial Distribution of Estimated Wind-Power Royalties in West Texas. Land 2015, 4, 1182–1199. [Google Scholar] [CrossRef] [Green Version]
  36. Kaiser, M.J.; Snyder, B.F. Offshore Wind Energy Cost Modeling; Green Energy and Technology; Springer: London, UK, 2012. [Google Scholar]
  37. Butterfield, S.; Musial, W.; Jonkman, J.; Sclavounos, P. Engineering Challenges for Floating Offshore Wind Turbines. In Proceedings of the 2005 Copenhagen Offshore Wind Conference, Copenhagen, Denmark, 26–28 October 2005. [Google Scholar]
  38. Pérez-Collazo, C.; Greaves, D.; Iglesias, G. A review of combined wave and offshore wind energy. Renew. Sustain. Energy Rev. 2015, 42, 141–153. [Google Scholar] [CrossRef]
  39. Mark, J.; Kaiser, B.S. Offshore Wind Energy Installation and Decommissioning Cost Estimation in the U.S. Outer Continental Shelf; U.S. Department of the Interior: Herndon, VA, USA, 2010; p. 340.
  40. Vladislav Kecojevic, D.K. Impact of Bulldozer’s Engine Load Factor on Fuel Consumption, CO2 Emission and Cost. Am. J. Environ. Sci. 2011, 7, 125–131. [Google Scholar] [CrossRef]
  41. Mario Klanfar, T.K.; Kujundžić, T. Fuel Consumption and Engine Load Factors of Equipment in Quarrying of Crushed Stone. Tehnički Vjesnik 2016, 23, 163–169. [Google Scholar]
  42. Ahn, D.; Shin, S.-C.; Kim, S.-Y.; Kharoufi, H.; Kim, H.-C. Comparative evaluation of different offshore wind turbine installation vessels for Korean west–south wind farm. Int. J. Naval Archit. Ocean Eng. 2017, 9, 45–54. [Google Scholar] [CrossRef]
  43. Al-Behadili, S.H.; El-Osta, W.B. Life Cycle Assessment of Dernah (Libya) wind farm. Renew. Energy 2015, 83, 1227–1233. [Google Scholar] [CrossRef]
  44. Hapke, H.M.; Haapala, K.R.; Wu, Z.; Brekken, T.K.A. Life cycle assessment of modern wind power plants. In Proceedings of the ASME 2010 International Design Engineering Technical Conferences and Computers and Information in Engineering Conference, Montreal, QC, Canada, 15–18 August 2010; pp. 395–403. [Google Scholar]
  45. Fleck, B.; Huot, M. Comparative life-cycle assessment of a small wind turbine for residential off-grid use. Renew. Energy 2009, 34, 2688–2696. [Google Scholar] [CrossRef]
  46. Davidsson, S.; Höök, M.; Wall, G. A review of life cycle assessments on wind energy systems. Int. J. Life Cycle Assess. 2012, 17, 729–742. [Google Scholar] [CrossRef] [Green Version]
  47. Martínez, E.; Sanz, F.; Pellegrini, S.; Jiménez, E.; Blanco, J. Life cycle assessment of a multi-megawatt wind turbine. Renew. Energy 2009, 34, 667–673. [Google Scholar] [CrossRef]
  48. Vestas. Life Cycle Assessment of Electricity Delivered from an Onshore Power Plant Based on Vestas V82-1.65 MW Turbines; Vestas Wind Systems A/S: Randers, Denmark, 2006. [Google Scholar]
  49. Uddin, M.S.; Kumar, S. Energy, emissions and environmental impact analysis of wind turbine using life cycle assessment technique. J. Clean. Prod. 2014, 69, 153–164. [Google Scholar] [CrossRef]
  50. Emily, A.; Smoucha, K.F.; Buckingham, S.; Oliver, K.; Knox, G.G. Life Cycle Analysis of the Embodied Carbon Emissions from 14 Wind Turbines with Rated Powers between 50 KW and 3.4 MW. J. Fundam. Renew. Energy Appl. 2016, 6, 1–10. [Google Scholar]
  51. Canada, M. Potential Toxic Effects of Chromium, Chromite Mining and Ferrochrome Production: A Literature Review; MiningWatch Canada: Ottawa, ON, Canada, 2012. [Google Scholar]
  52. Atilgan, B.; Azapagic, A. Life cycle environmental impacts of electricity from fossil fuels in Turkey. J. Clean. Prod. 2015, 106, 555–564. [Google Scholar] [CrossRef]
Figure 1. System boundary for the life cycle assessment (LCA) study.
Sustainability 10 02022 g001
Figure 2. Relative contribution of major stages in the life cycle of wind energy across 15 midpoint impact categories at (a) onshore; (b) shallow-water; and (c) deep-water locations.
Sustainability 10 02022 g002
Figure 3. Total Global Warming Potential (GWP) (gCO2eq/kWh) at onshore and offshore locations.
Sustainability 10 02022 g003
Figure 4. Ozone layer depletion (gCFC11eq/kWh) at onshore and offshore locations.
Sustainability 10 02022 g004
Figure 5. Energy and CO2 payback time for different turbine sizes and locations. (a) Energy payback time (months); (b) CO2 payback time (month).
Sustainability 10 02022 g005
Figure 6. Comparison of CO2 and energy payback performance of turbines of the same size at different locations.
Sustainability 10 02022 g006
Table 1. Site information for on- and off-shore wind turbines.
TypeLocation (Latitude & Longitude)Elevation/Depth (m)Typical Wind Speed (m/s)
OnshoreN 35.255267, W 101.18214010167.5
Offshore (Shallow)N 27.77429, W 97.04247−138–8.5
Offshore (Deep)N 27.46967, W 96.20652−1408–8.5
Table 2. List of turbine distances by part calculated using the actual manufacturing location.
Turbine SizePartTruckBoatTrain
1 MWTower72.4------
Nacelle37.217,659---
Rotor ---404
2 MWTower72.4------
Nacelle1953------
Rotor 404
2.3 MWTower72.4------
Nacelle7049648.42
Rotor404------
5 MWTower---70
Nacelle---3687---
Rotor---1084---
Table 3. Total fuel consumption by hours per equipment worked (in L) [40,41,42,43].
OnshoreOffshore Shallow-WaterOffshore Deep-Water
EquipmentFuel Consumption (L)EquipmentFuel Consumption (L)EquipmentFuel Consumption (L)
Generator418Pull tunga boat591Crane620.1
Crane620.1Workboat148.5Forklift64.0
Truck Mixer69.7Crane620.1Tugboat628
Truck Gravel74.7Self-propelled jack-up barge21,330Auxiliary boats297
Forklift64.0Hydraulic Hammer44.3
Excavation digger44.1
Table 4. Disposal and recycling strategy * [48].
Material TypeDisposal Method
Iron90% Recycling
Fiberglass100% Landfill
Oil100% Combusted
Plastic PVC100% Landfill
Aluminum55.1% Recycling
Steel90% Recycling
Copper90% Recycling
Concrete100% Landfill
* Assumption that an onshore foundation (concrete and ferule) is covered and left on the ground.
Table 5. Percentage distribution of various electricity source mixes used for the sensitivity analysis *.
Electricity SourceDefaultTexas GridLG-25% NGLG-25% NuclearLG-25% WindLG-50% NG
Hard coal26.516.826.526.526.526.5
Lignite29.211.221.921.921.914.6
Natural gas5.7048.413.05.705.7020.3
Nuclear14.111.014.121.414.114.1
Wind12.712.712.712.720.012.7
Others11.8-11.811.811.811.8
* Source: Data from the EcoInvent database and the 2015 ERCOT data. LG-25 NG, 25% of lignite-coal-based electricity replaced with natural gas; LG-25 Nuclear, 25% of lignite-coal-based electricity replaced with nuclear; LG-25 Wind, 25% of lignite-coal-based electricity replaced with wind; LG-50 NG, 50% of lignite-coal-based electricity replaced with natural gas.
Table 6. Life cycle impacts of onshore and offshore wind turbines across 15 midpoint impact categories.
Mid-Point CategoryUnit (Per kWh)OnshoreOffshore (Shallow-Water)Offshore (Deep-Water)
MeanSt. DevMeanSt. DevMeanSt. Dev
Carcinogenskg C2H3Cleq29.643.0489.933.6979.5415.27
Non-carcinogenskg C2H3Cleq23.112.4059.057.6762.519.19
Respiratory inorganicskg PM2.5eq0.900.102.650.481.960.10
Ionizing radiationBq C14eq466372110,19716648838777
Ozone layer depletionkg CFC11eq4.64 × 10−51.20 × 10−59.59 × 10−55.98 × 10−69.76 × 10−57.73 × 10⁻⁶
Respiratory organicskg C2H4eq2.17 × 10−13.40 × 10−27.77 × 10−17.71 × 10−22.75 × 10−17.70 × 10⁻³
Aquatic ecotoxicitykg TEG65,20011,198178,1648101181,04119,959
Terrestrial ecotoxicitykg TEG2627712367,346183766,7404625
Terrestrial acid/nutrikg SO2eq8.481.1222.910.7319.090.98
Land occupationm2 organic arable land6.861.0421.322.3715.441.06
Aquatic acidificationkg SO2eq2.650.457.720.106.470.30
Aquatic eutrophicationkg PO4 P-lim0.400.061.010.191.290.16
Global warmingKgCO2eq44058114421864842.7
Non-renewable energyMJ657868316,115287010,9301072
Mineral extractionMJ22370.059029.170276.7
Table 7. Emissions of air pollutants and greenhouse gases (GHGs) from individual turbine life cycles.
Air EmissionsUnit (Per kWh)OnshoreOffshore ShallowOffshore Deep
1 MW2 MW2.3 MW2 MW2.3 MW2.3 MW5 MW
CO2gCO2eq7.136.865.639.116.237.586.98
N2OgCO2eq0.040.040.030.080.050.570.68
CH4gCO2eq0.170.180.160.270.190.220.21
SF6gCO2eq0.020.020.010.030.020.030.02
O3g CFC11eq9 × 10−77 × 10−76 × 10−78 × 10−71 × 10−61 × 10−61 × 10−6
NOxg PM2.5eq0.0020.0020.0020.0030.0030.0030.003
PM2.5g PM2.5eq0.010.0090.0090.020.010.060.01
SO2g PM2.5eq0.0030.0020.0030.0030.0030.0030.004
GWPgCO2eq7.357.095.849.496.497.897.28
Table 8. Relative percentage change in midpoint impacts due to variation in electricity source mix *.
Impact CategoryDefault (U.S.)Texas Electricity MixLG-25% NGLG-25% NuclearLG-25% WindLG-50% NG
Carcinogens0%6.84%1.16%0.00%0.00%2.31%
Non-carcinogens0%1.00%0.17%0.00%−0.01%0.35%
Respiratory inorganics0%−5.38%−2.22%−2.30%−2.30%−4.43%
Ionizing radiation0%0.74%0.01%11.15%−0.02%0.02%
Ozone layer depletion0%4.10%0.75%0.67%−0.01%1.51%
Respiratory organics0%1.07%0.19%−0.02%−0.02%0.38%
Aquatic ecotoxicity0%0.40%0.13%0.07%0.00%0.27%
Terrestrial ecotoxicity0%−0.16%0.01%0.01%0.00%0.01%
Terrestrial acid/nutrification0%−0.28%−0.11%−0.27%−0.27%−0.22%
Land occupation0%−0.95%−0.03%−0.04%−0.02%−0.05%
Aquatic acidification0%0.16%−0.08%−0.33%−0.33%−0.16%
Aquatic eutrophication0%−1.22%−0.42%−0.43%−0.43%−0.85%
Global warming0%−0.71%−0.40%−0.77%−0.77%−0.80%
Non-renewable energy0%0.55%−0.04%0.09%−0.57%−0.08%
* Positive numbers indicate an increase in impact and negatives indicate a decrease from the default/base case. The best-case scenarios for each impact category are identified in green.

