Carbon Footprint Assessment of Four Normal Size Hydropower Stations in China


1
State Key Laboratory of Hydrology-Water Resources and Hydraulic Engineering, Hohai University, Nanjing 210098, China
2
College of Water Conservancy and Hydropower Engineering, Hohai University, Nanjing 210098, China
3
National Engineering Research Center of Water Resources Efficient Utilization and Engineering Safety, Hohai University, Nanjing 210098, China
4
Key Laboratory of Land Surface Pattern and Simulation, Institute of Geographical Sciences and Natural Resources Research, Chinese Academy of Sciences, Beijing 100101, China
5
College of Resources and Environment, University of Chinese Academy of Sciences, Beijing 100049, China
6
Department of Geological Sciences, Jackson School of Geosciences, University of Texas at Austin, Austin, TX 78712, USA
7
Beijing No. 4 High School, Beijing 100034, China
*
Author to whom correspondence should be addressed.
Sustainability 2018, 10(6), 2018; https://doi.org/10.3390/su10062018
Submission received: 24 May 2018
/
Revised: 8 June 2018
/
Accepted: 12 June 2018
/
Published: 14 June 2018
(This article belongs to the Special Issue Environmental Life Cycle Assessment)
Abstract
:The emission of Greenhouse gases (GHG) during the life cycle of four hydropower stations with installed capacity from 95 MW to 500 MW are assessed by the integrated GHG reservoir tool developed by International Hydropower Association. Model inputs are extracted from multi-source geographic datasets and construction planning documents. Three main conclusions are summarized: (1) In pre- and post-impoundment stages, areal GHG emission balance in reservoir area depends on the climate background, humid subtropical regions are more active than arid temperate regions. In the construction stage, emissions from fill, concrete and equipment account for more than 70% of the total. (2) GHG intensity falls rapidly when lifetime increases from 10 to 40 years and then drops slightly when lifetime becomes longer, which is 13.60 tCO2e/GWh for 50 years and 8.13 tCO2e/GWh for 100 years on average. The emission rates of hydropower stations with lower installed capacity are obviously large if they work for less than 30 years and differ less with stations possessing a higher installed capacity when their lifetime approaches 100 years. (3) Comparing with electricity generated by coal in China whose GHG intensity is 822 tCO2e/GWh, hydroelectricity is almost 100 times more efficient and clean. Thus, hydropower station plays an important role in dealing with the global warming issue as a substitution for a fossil fuel power source.
1. Introduction
Anthropogenic greenhouse gas (GHG) emissions are the primary cause of global warming [1] and the global temperature is expected to increase 2.6–3.1 °C by the end of 21st century comparing with the preindustrial period due to the current climate and energy policies around the world [2]. An aim of limiting the warming to below 2 °C to reduce the risk and impacts of climate change and toward a sustainable development requires global emissions to reach the peak before 2030 and steeply decline afterwards [3,4].
In 2016, total global GHG emissions are about 49.3 GtCO2e, in which carbon dioxide (CO2) and methane (CH4) make up more than 90% (72% and 19%, respectively). Moreover, fossil fuel energy related emission is the largest source for CO2 and CH4 (87% and 25%, respectively) [5]. Thus, it is important to substitute fossil fuel with clean energy to achieve the 2 °C target. According to statistics from the International Renewable Energy Agency (IRENA), over the past decade, global installed hydropower has increased from 926,340 MW to 1,245,708 MW [6], making a great contribution to the energy transformation. In 2016, global electricity production from hydropower is 4022.9 TWh, which generates 16.2% of total electricity and is almost equal to sum of the other clean energy sources including nuclear, solar, wind, geothermal and biomass (4470.8 TWh) [7]. In addition, the exploited hydropower is still far from reaching its technical and economic potential, especially for developing countries in Asia, Africa and South America where only about 10% of total hydro energy has been utilized [8]. It is expected that hydropower will continue to dominate more than half of the worldwide installed capacity of renewables in future [9].
However, large hydro schemes are also carbon sources to the environment due to dam construction and the emission of both CO2 and CH4 from the reservoir area [10,11] and are now considered to have the some adverse effects on the local environment [12]. It is urgent to give some overall assessments to evaluate whether hydropower is an optimal choice for a low carbon path. The carbon footprint is a measure of the exclusive total amount of CO2 equivalent emissions that are directly and indirectly caused by an activity or accumulated over the life stages of a product [13], which is built on the principles established by a life cycle assessment [14]. In particular, calculating the carbon footprint through a hydropower station’s life cycle is able to quantificational estimate the total carbon emission and benefits comparing with power generation from fossil fuel. In past decade, many works have focused on the GHG emission balance of hydropower stations worldwide, including the United Kingdom, India, Thailand, Japan, Switzerland, Norway, Italy and Brazil [15,16,17,18,19,20,21,22]. The result appears to be a decreasing trend of emissions per unit of electricity generated when installed capacity grows. Most of these stations are run-of river and canal-based stations, so more cases of the reservoir type are needed.
In China, the installed capacity of hydropower is 333,650 MW in 2016, which is the largest in the world, totaling 1,245,708 MW [6]. Furthermore, construction of hydropower stations in China over the last decade even makes up a 58% (185,420 MW out of 319,368 MW) share of global growth and there are still a large number of projections under planning based on Chinese Nationally Determined Contribution (NDC) pledge. Besides, China is also the highest emitting country and has the largest proposed reduction target [23]. The energy mix and emission coefficient (i.e., emissions per unit of energy consumption) are important determinants of Chinese emission pattern changes [24,25]. Therefore, it is necessary to assess the carbon balance of different scales of hydropower stations in China to help optimize the pathway to 2030 and mid-century.
Several studies have investigated the carbon footprint of some large size (installed capacity more than 1000 MW) hydropower stations in China. For example, Baihetan station (installed capacity 16,000 MW), Xiluodu station (12,600 MW), Xiangjiaba station (6400 MW), Nuozhadu station (5850 MW), and Jinpingyiji station (3600 MW), will emit approximately 54,170 ktCO2e, 40,817 ktCO2e, 24,214 ktCO2e, 8800 ktCO2e and 9539 ktCO2e during the lifespans of 44 years for Nuozhadu and 100 years for the others [26,27,28,29]. However, the lifespans included and methods used in these studies are not the same as each other, which brings difficulty to attempting to synthesize the results together. Moreover, in addition to the large size hydropower stations, there are also nearly 5 hundred normal size ones (installed capacity 50–500 MW) [30] over China, which may have a different proportion of carbon footprint compared with large ones. This paper focuses on four normal size cases with installed capacity from 95–500 MW (Shimen, Jilebulake, Sinan River and Pankou) in China and uses the GHG reservoir (G-res) tool [31,32] to conduct carbon footprint analysis.
2. Materials and Methods
2.1. GHG Reservoir (G-res) Tool
The G-res tool integrates a series of modules to calculate the net carbon footprint of a freshwater reservoir. It is first developed in 2010 by the International Hydropower Association (IHA) based on the recommendation from the Intergovernmental Panel on Climate Change (IPCC) [33] that net emissions be evaluated in determining the impact of reservoir systems. In this study, G-res tool v1.12 launched on 6 February 2018 is used. G-res tool is a high-performance model to assess GHG emissions in the life time of a hydropower station, while it has a strict requirement for input data. We first introduce the scientific basis of G-res tool and then propose a general procedure to prepare the input data from multi-source geographic datasets. The calculation of net carbon footprint in the G-res tool consists of emissions from four parts of the lifespan of the hydropower station using the following equation [34]:
Net carbon footprint =
− [Pre-impoundment carbon balance of the reservoir area before reservoir introduction]
+ [Post-impoundment carbon balance of the reservoir]
− [Emissions from the reservoir due to unrelated anthropogenic sources (UAS)]
+ [GHG due to construction]
− [Pre-impoundment carbon balance of the reservoir area before reservoir introduction]
+ [Post-impoundment carbon balance of the reservoir]
− [Emissions from the reservoir due to unrelated anthropogenic sources (UAS)]
+ [GHG due to construction]
(1) The term pre-impoundment considers the emissions within the landscape that will be occupied by the reservoir. The reservoir area is generated based on 30m spatial resolution SRTM digital elevation data [35] via an earth engine after inputting the exact coordinates of the dam and the normal operating level above sea level [36]. Then the land types within the reservoir area are estimated using 300 m spatial resolution ESACCI land cover data [37]. The last procedure is multiplying the surface area of each land type with the corresponding emission factor for both CO2 and CH4 [38].
(2) Post-impoundment term represents the GHG flux, including diffusive for CO2 and CH4, bubbling and degassing for CH4, into the atmosphere over the reservoir area after inundation, which is simulated from the semi-empirical model based on flux observations from 223 reservoirs around the world [10,38].
(3) Unrelated anthropogenic sources (UAS) mean the carbon emissions in the reservoir area due to sewage from anthropogenic activities should be removed. Here the input is the catchment area, which is the scope of land where precipitation collects and drains off into a common outlet. In our study, the catchment area equals to the upstream watershed region controlled by the dam. Community and industrial activities which occur in the catchment area make contributions to nutrients and carbon flowing into the reservoir. This part of emissions is reconstructed by using a share of phosphorus load exceeding the natural background load as a proxy [34]. Land types within the catchment area are needed to estimate the natural background load and high or low land use intensity is set manually to represent anthropogenic activities.
(4) The construction term refers to the emissions related to the production of materials, transport and plant stages to build the dam and other associated infrastructure, which are calculated from the consumption of material and power, as well as corresponding emission factors [34].
2.2. Study Sites and Data
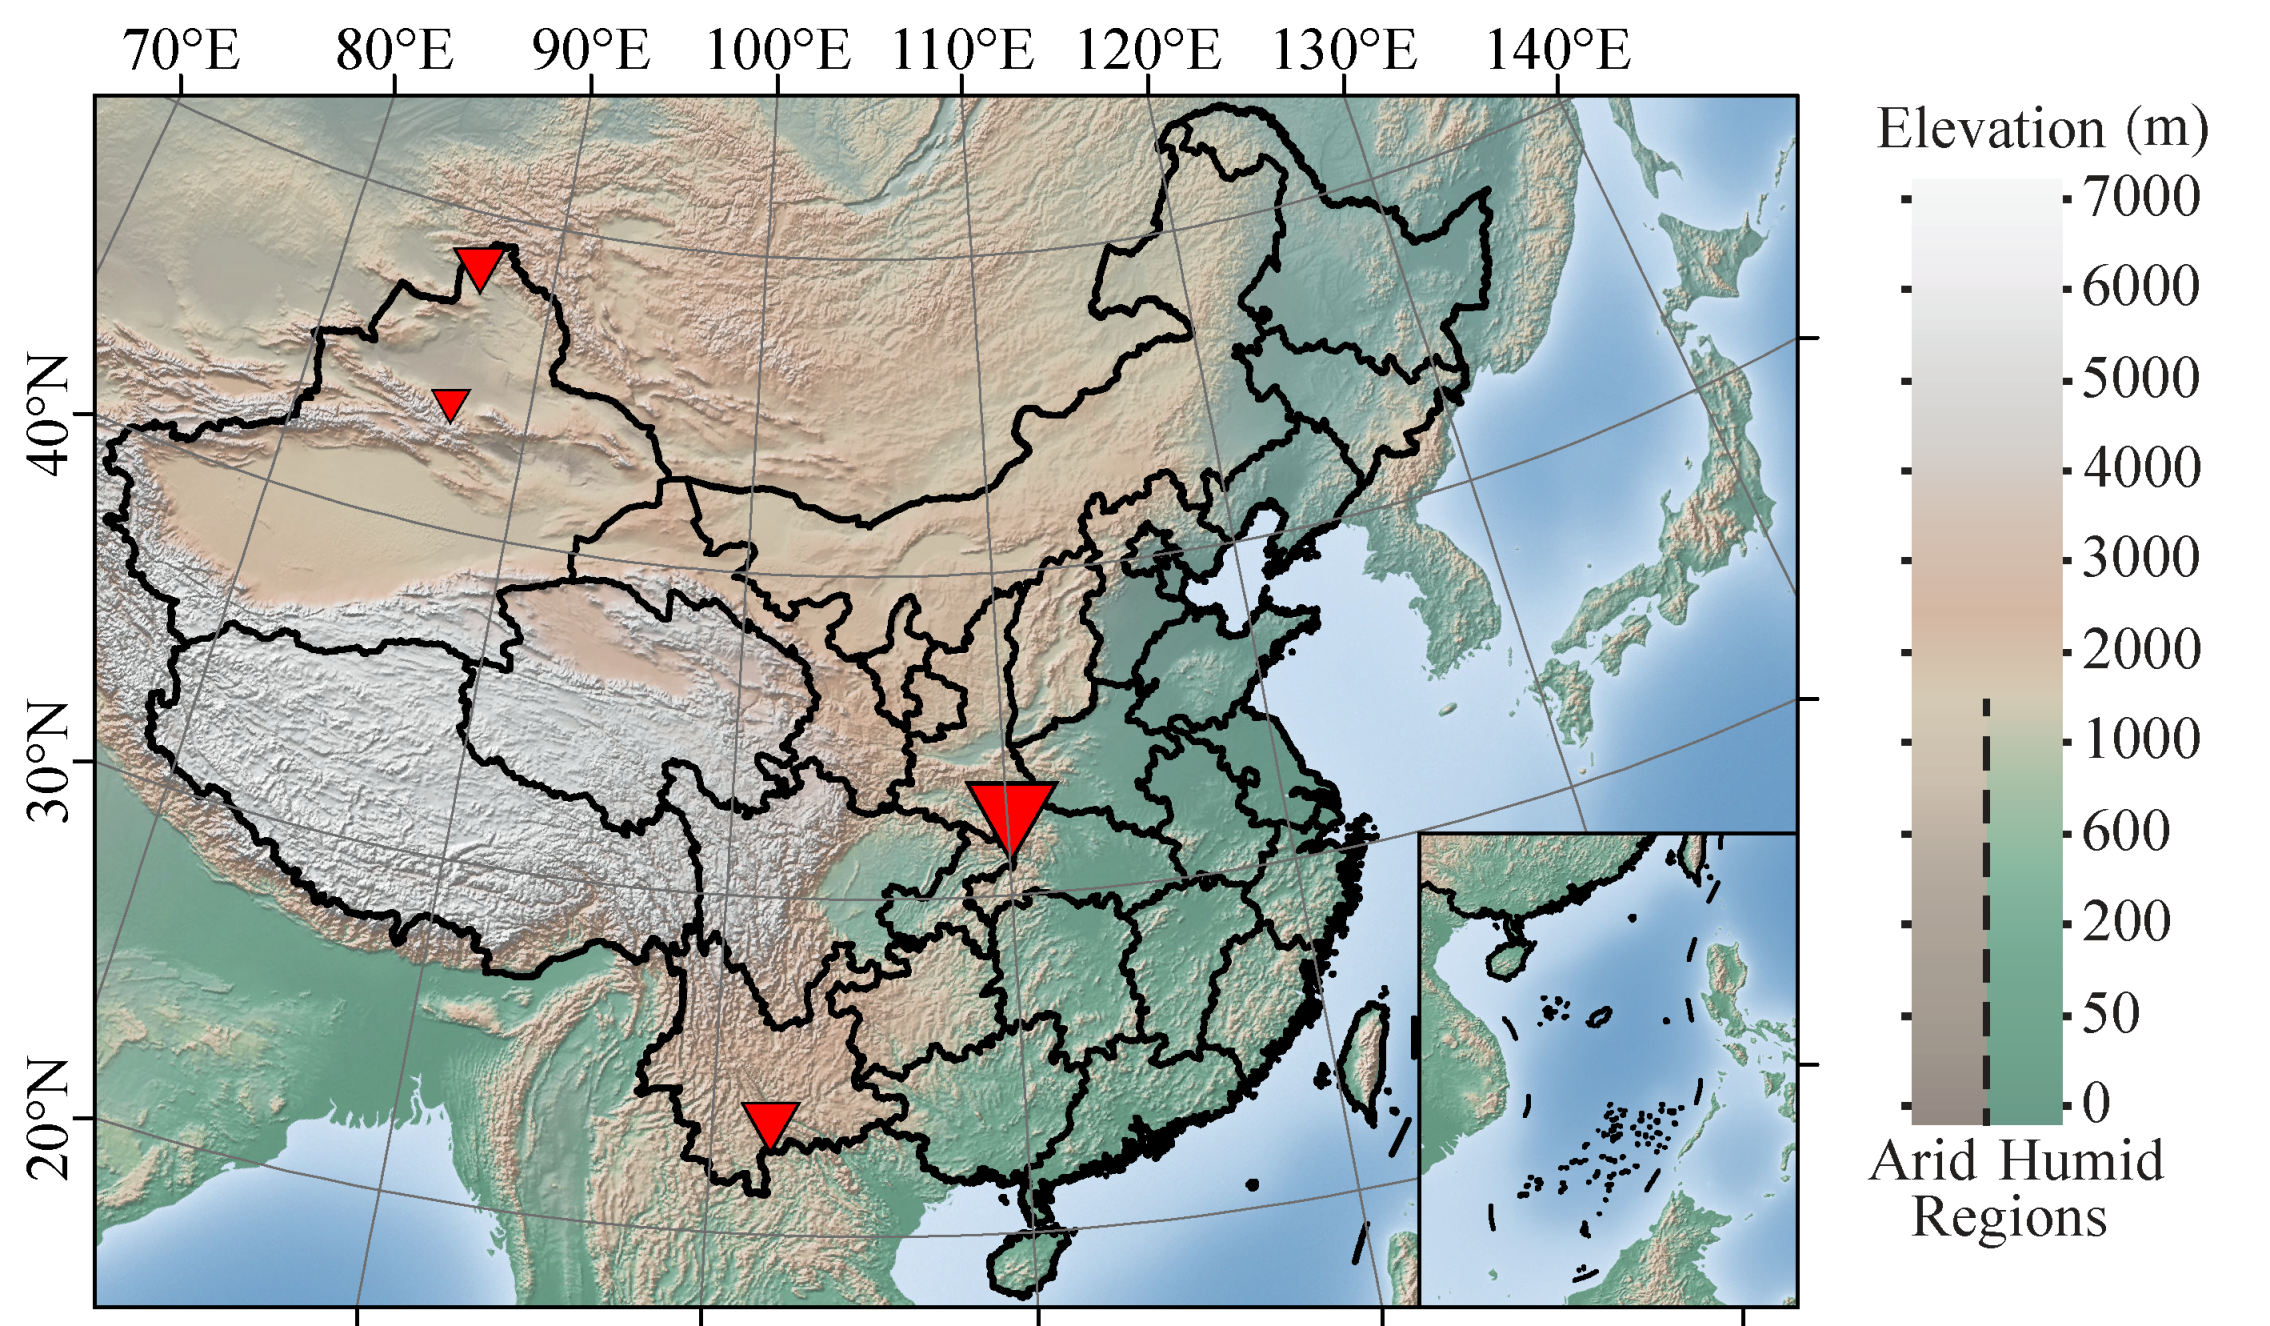
Figure 1 shows the locations and natural environment of the four hydropower stations used in this study. Shimen hydropower station in Xinjiang Province spans the mid reaches of Hutubi river, which are dominated by a mid-temperate arid climate. Jilebulake hydropower station also in Xinjiang Province spans the mid to lower reaches of Haba river, which is in the same climate zone as Shimen. Sinan River hydropower station in Yunnan Province spans the Sinan River, which is dominated by south subtropical humid climate. Pankou hydropower station in Hubei Province spans the upper to mid reaches of Du River, which is dominated by north subtropical humid climate [39]. Table 1 lists the meteorology and hydrology statistics of the four sites, which is also part of inputs for G-res tool.
The main information of the four hydropower stations in this study is from their construction planning documents [41,42,43,44,45,46,47,48], which contains parameters of the dams and the inventories for material, transportation and plant stages used for construction terms of the G-res tool (summarized in Table 2). The Shimen hydropower station is built with an asphalt concrete core rockfill dam while the other three are built with concrete faced rockfill dams. Transportation, metal structures and equipment for Shimen and Jilebulake are both from Urumqi City with road distances of 154 km and 710 km, respectively. Kunming City and Shiyan City are the main suppliers for Sinan River and Pankou with road distances of 376 km and 184 km, respectively. Earth and rockfill materials and concrete aggregates are collected near the dam (less than 10 km distance).
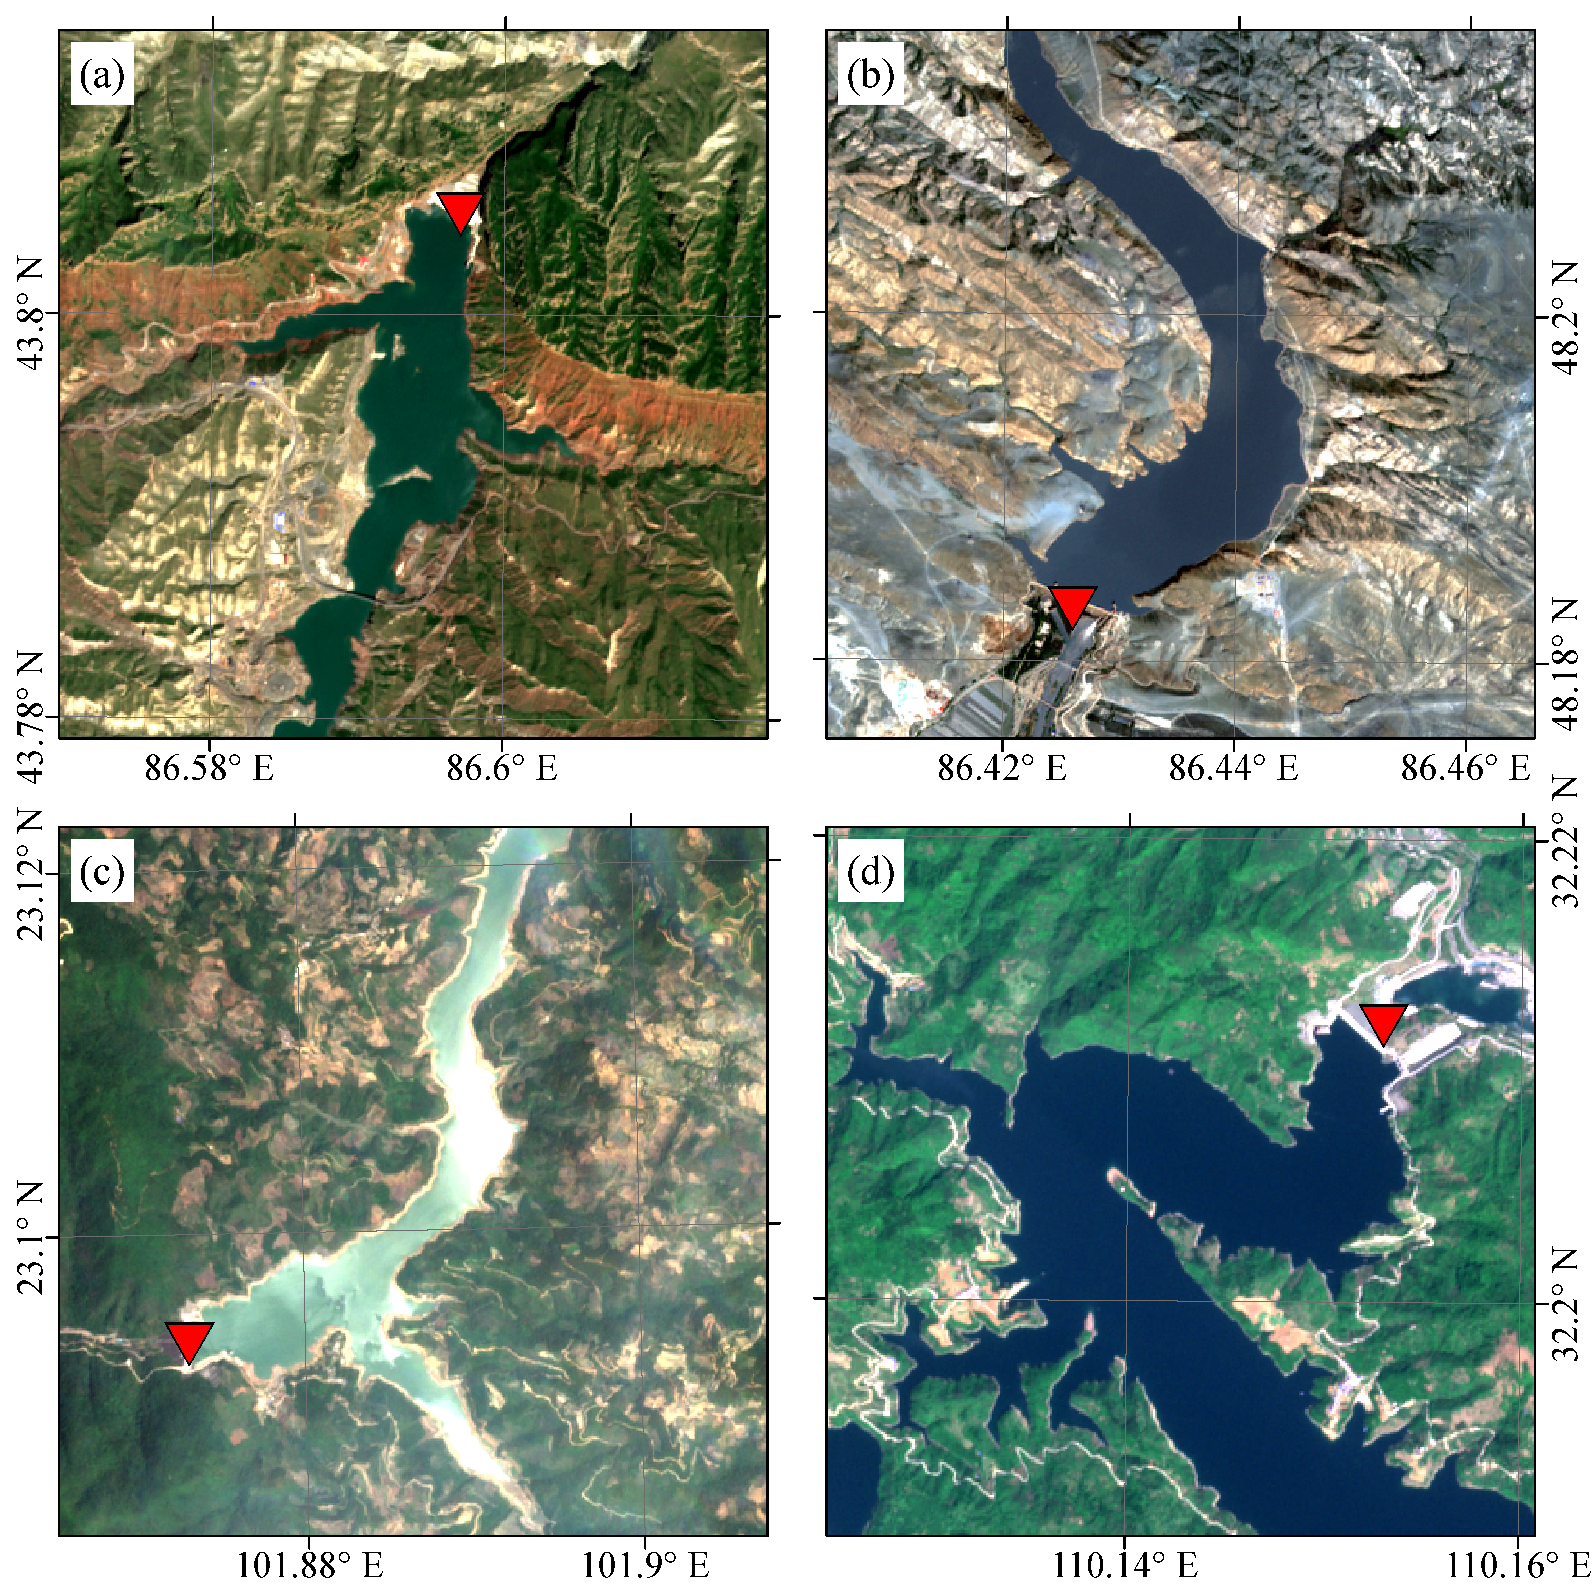
To obtain the exact coordinates of the dams for generating catchment area and reservoir, cloudless satellite images during April to May in 2018 from Sentinel-2A are used [49] (Figure 2 and Table 3), which also helps to cross validate the reservoir area generated by earth engine. Catchment area controlled by dam point is calculated by hydrology functions in spatial analyst tool from software Arcgis 10.2 also based on 30 m spatial resolution elevation data [50], and then used as input for the G-res tool. Statistics of the generated catchment area and reservoir are given in Table 3. Comparing with the corresponding items from construction planning documents in Table 2, the mean errors are only 0.89% and 2.34% for catchment area and reservoir with maximum errors less than 2.18% and 4.14%. Thus, it is reliable to conduct carbon footprint analyses based on these materials.
3. Results and Discussion
3.1. Pre-Impoundment GHG Balance of the Reservoir Area before Its Introduction
For the area merged by the reservoir after being inundated, Table 4 presents the land cover types and the related CO2 and CH4 emission rates. It is noted that the soil property that land cover or land use types reside on also has an impact on the emission factors. Based on the soil type map provided by earth engine [36], all four catchments in this study reside on non-waterlogged, mineral soils without organic soils. Different impoundment years of four hydropower stations are utilized (Table 2), with the land cover map for the 2005 epoch used for Sinan River case while the land cover map for the 2010 epoch is used for the other three cases [37]. Forest makes up a substantial share of the vegetation type near Sinan River (35.92%) and Pankou (19.26%), which are located in the south to north subtropical humid region, so that these two sites were CO2 sinks overall before introduction of reservoirs. In the mid-temperate arid Xinjiang region for Shimen and Jilebulake, the vegetation of grassland or shrubland are neither carbon source nor sink, while water bodies around Jilebulake are a CH4 source for the atmosphere.
3.2. Post-Impoundment GHG Balance of the Reservoir
Carbon transformation processes are altered following the impoundment of a reservoir because of the accumulation of biomass and the physical and chemical environment change. The carbon accumulated during these process balances with the atmosphere mainly through three pathways. Firstly, diffusive flux taking place on the water surface is the primary emission source. From the empirical model in G-res tool, CH4 diffusive flux is mainly depended on temperature and spatial parameters of the reservoir while CO2 diffusive flux is also controlled by surface soil carbon content. Secondly, CH4 bubbling is a function of the surface horizontal radiance and spatial parameters of the reservoir. Thirdly, during the processes of electricity generating and water level adjustment, water from deeper areas of the upstream direction are released downstream through water intake channel, which could also result in a release of GHG known as degassing. Table 5 lists the total flux rate of CO2 and CH4, as well as the fraction of CH4 in the post-impoundment stage, which shows a remarkable decrease as the latitude changes. It is noted that emissions occurring in reservoirs are not the net emissions caused by the construction of the hydropower station, since some carbon will go into the atmosphere from elsewhere in the river are now included in the reservoir. Besides, emissions in this part is estimated from empirical model so the main uncertainty for carbon footprints during total lifespan comes from here. The 67% confidence intervals are also presented in Table 5 based on mean square errors [38].
3.3. Emissions from the Reservoir Due to UAS
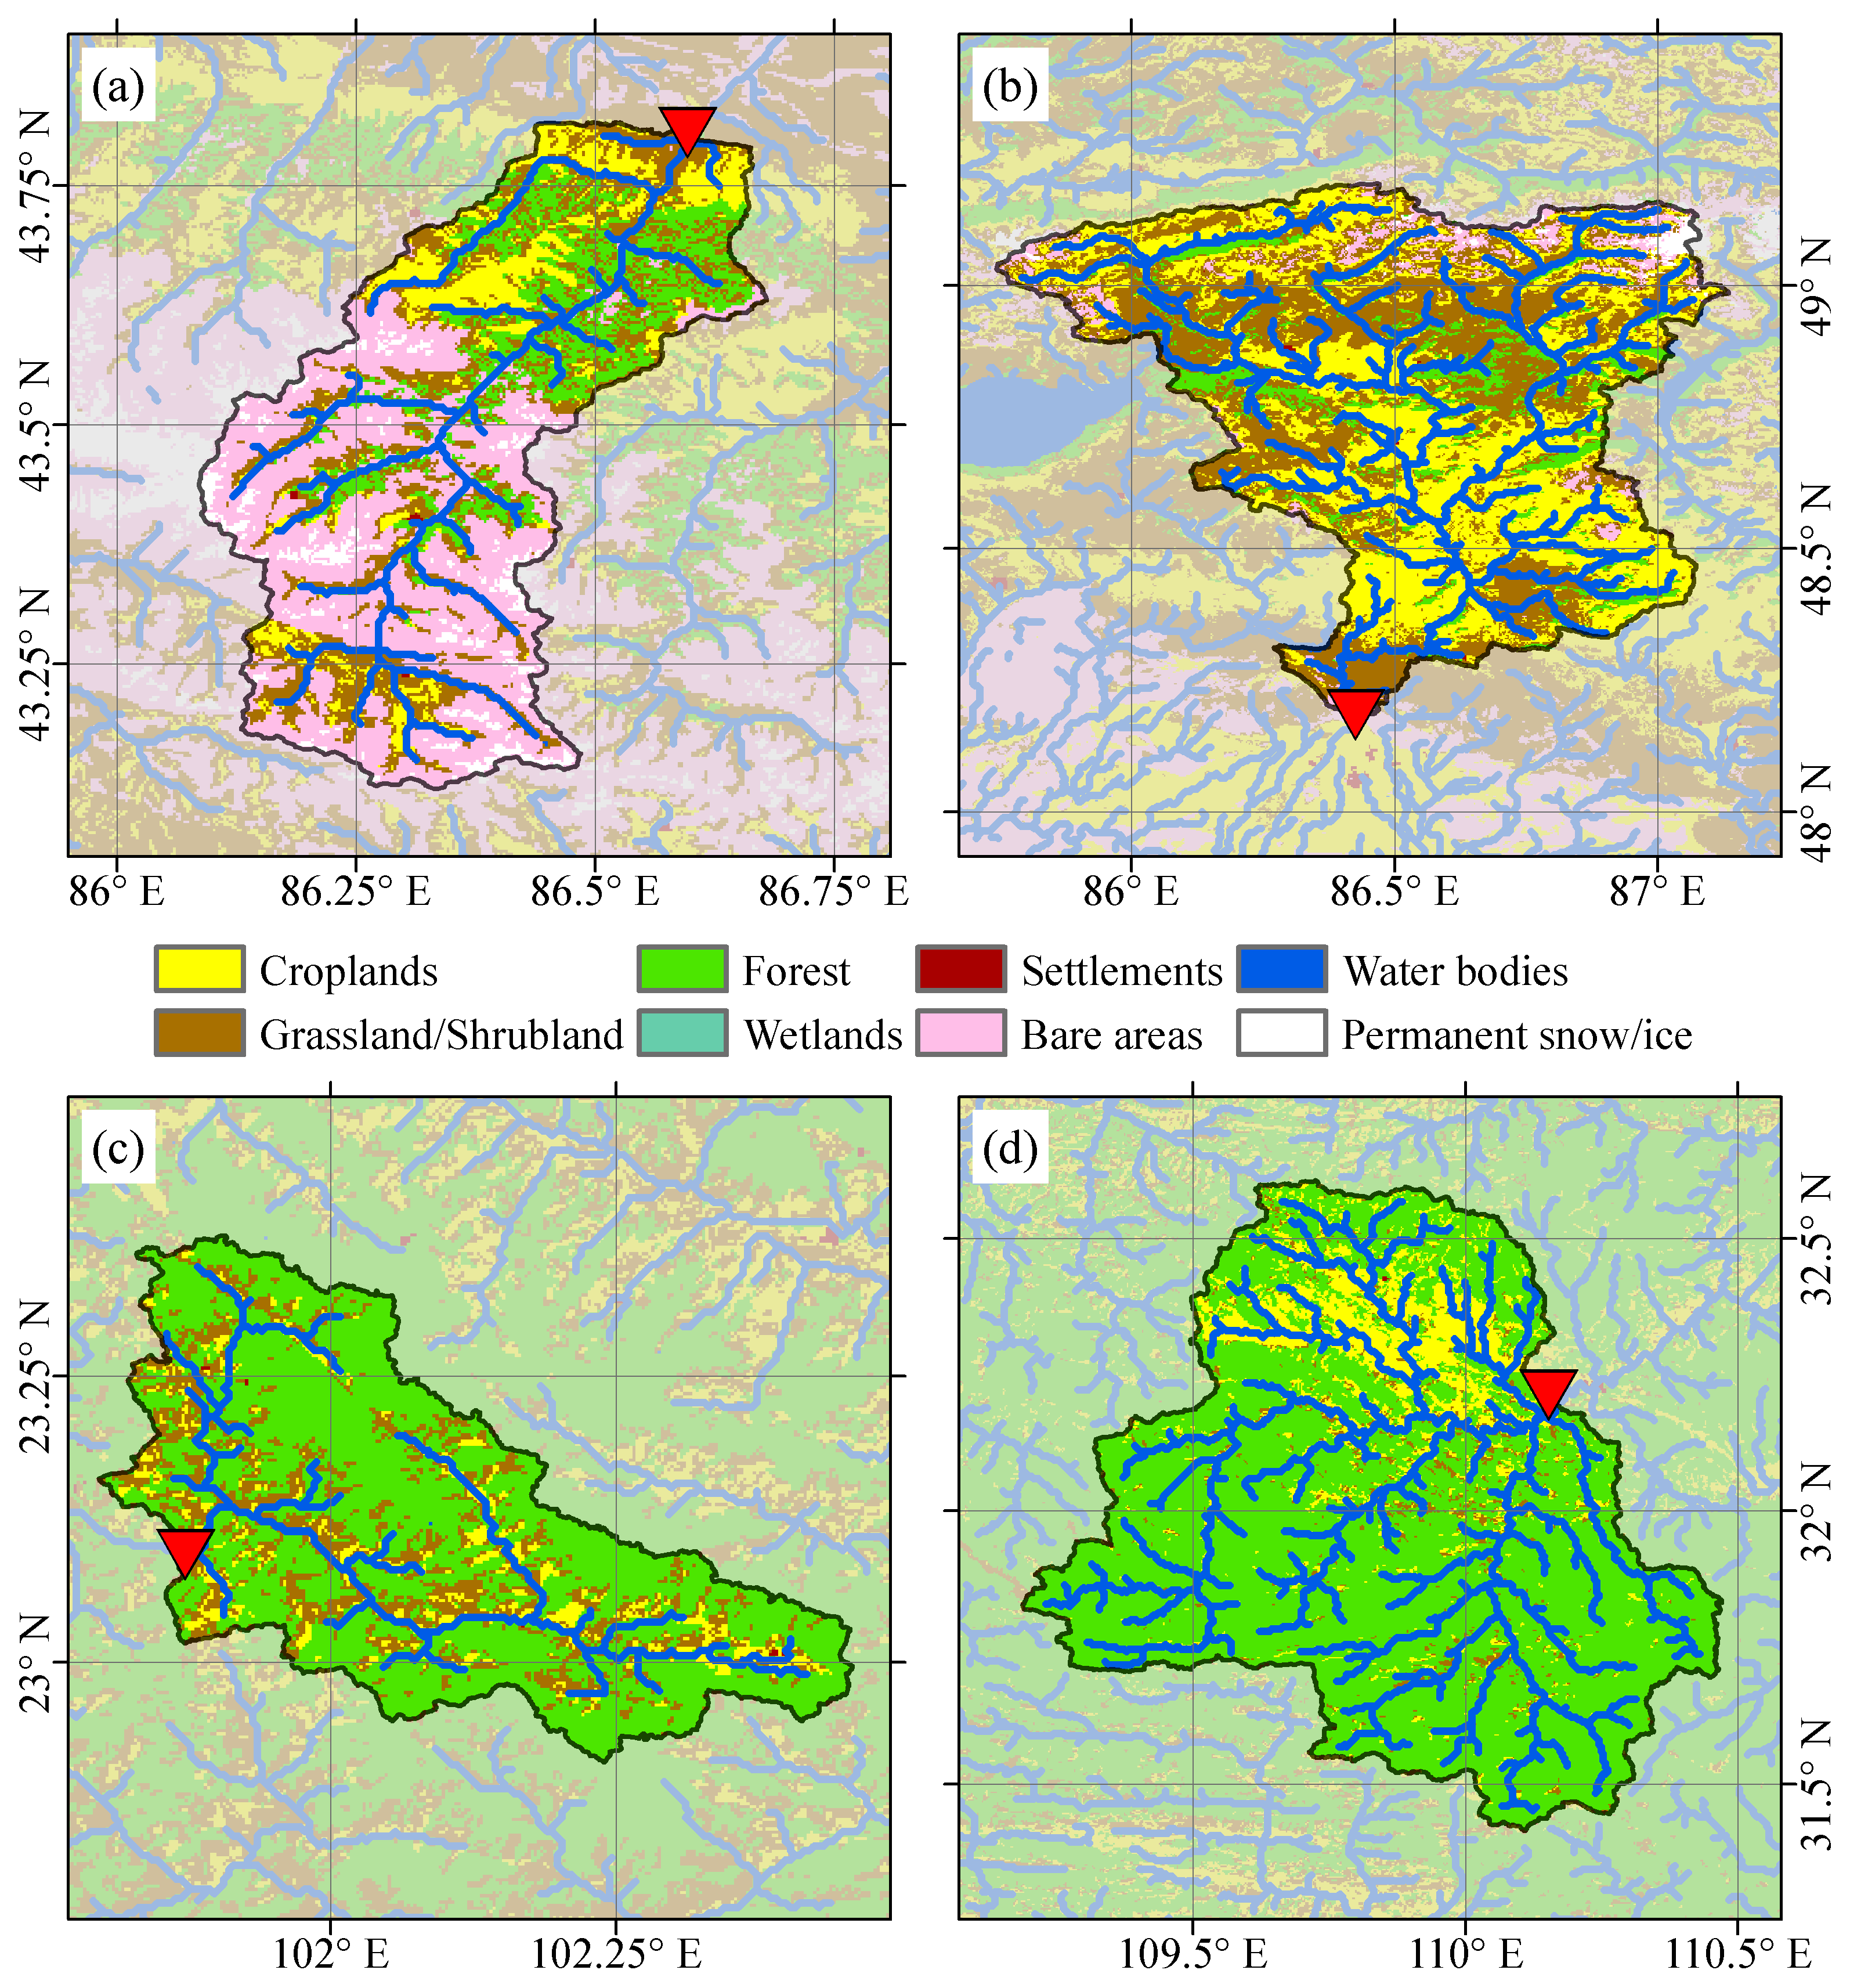
Figure 3 displays the land cover and land use types in catchment areas for four sites. The sewage from all anthropogenic activities will finally flow into the reservoirs through branches, which accounts for part of the total emission of post-impoundment. The catchment population density is less than 100 persons/km2 for all four sites (18 for Shimen, 5 for Jilebulake, 75 for Sinan River and 90 for Pankou) with only no more than 1% of the settlements area. Besides, croplands in all catchments are rainfed other than irrigated. As a result, the managed levels of all land type inputs for G-res tool are set to low. Table 6 manifests the CH4 release rate due to UAS, where the water residence time means the average amount of time that a molecule of water spends in the reservoir. The results are also clustered into two classifications depending on their climate background and population density. Water residence times for Shimen and Jilebulake are about 10 years so the CH4 release rate due to UAS is lower and shares no more than half a percent of the total CH4 release of post-impoundment. Water residence times for Sinan River and Pankou are less than 1 year so the CH4 release rate due to UAS is higher and shares an extremely higher percentage of the total CH4 release of post-impoundment.
3.4. GHG Due to Construction
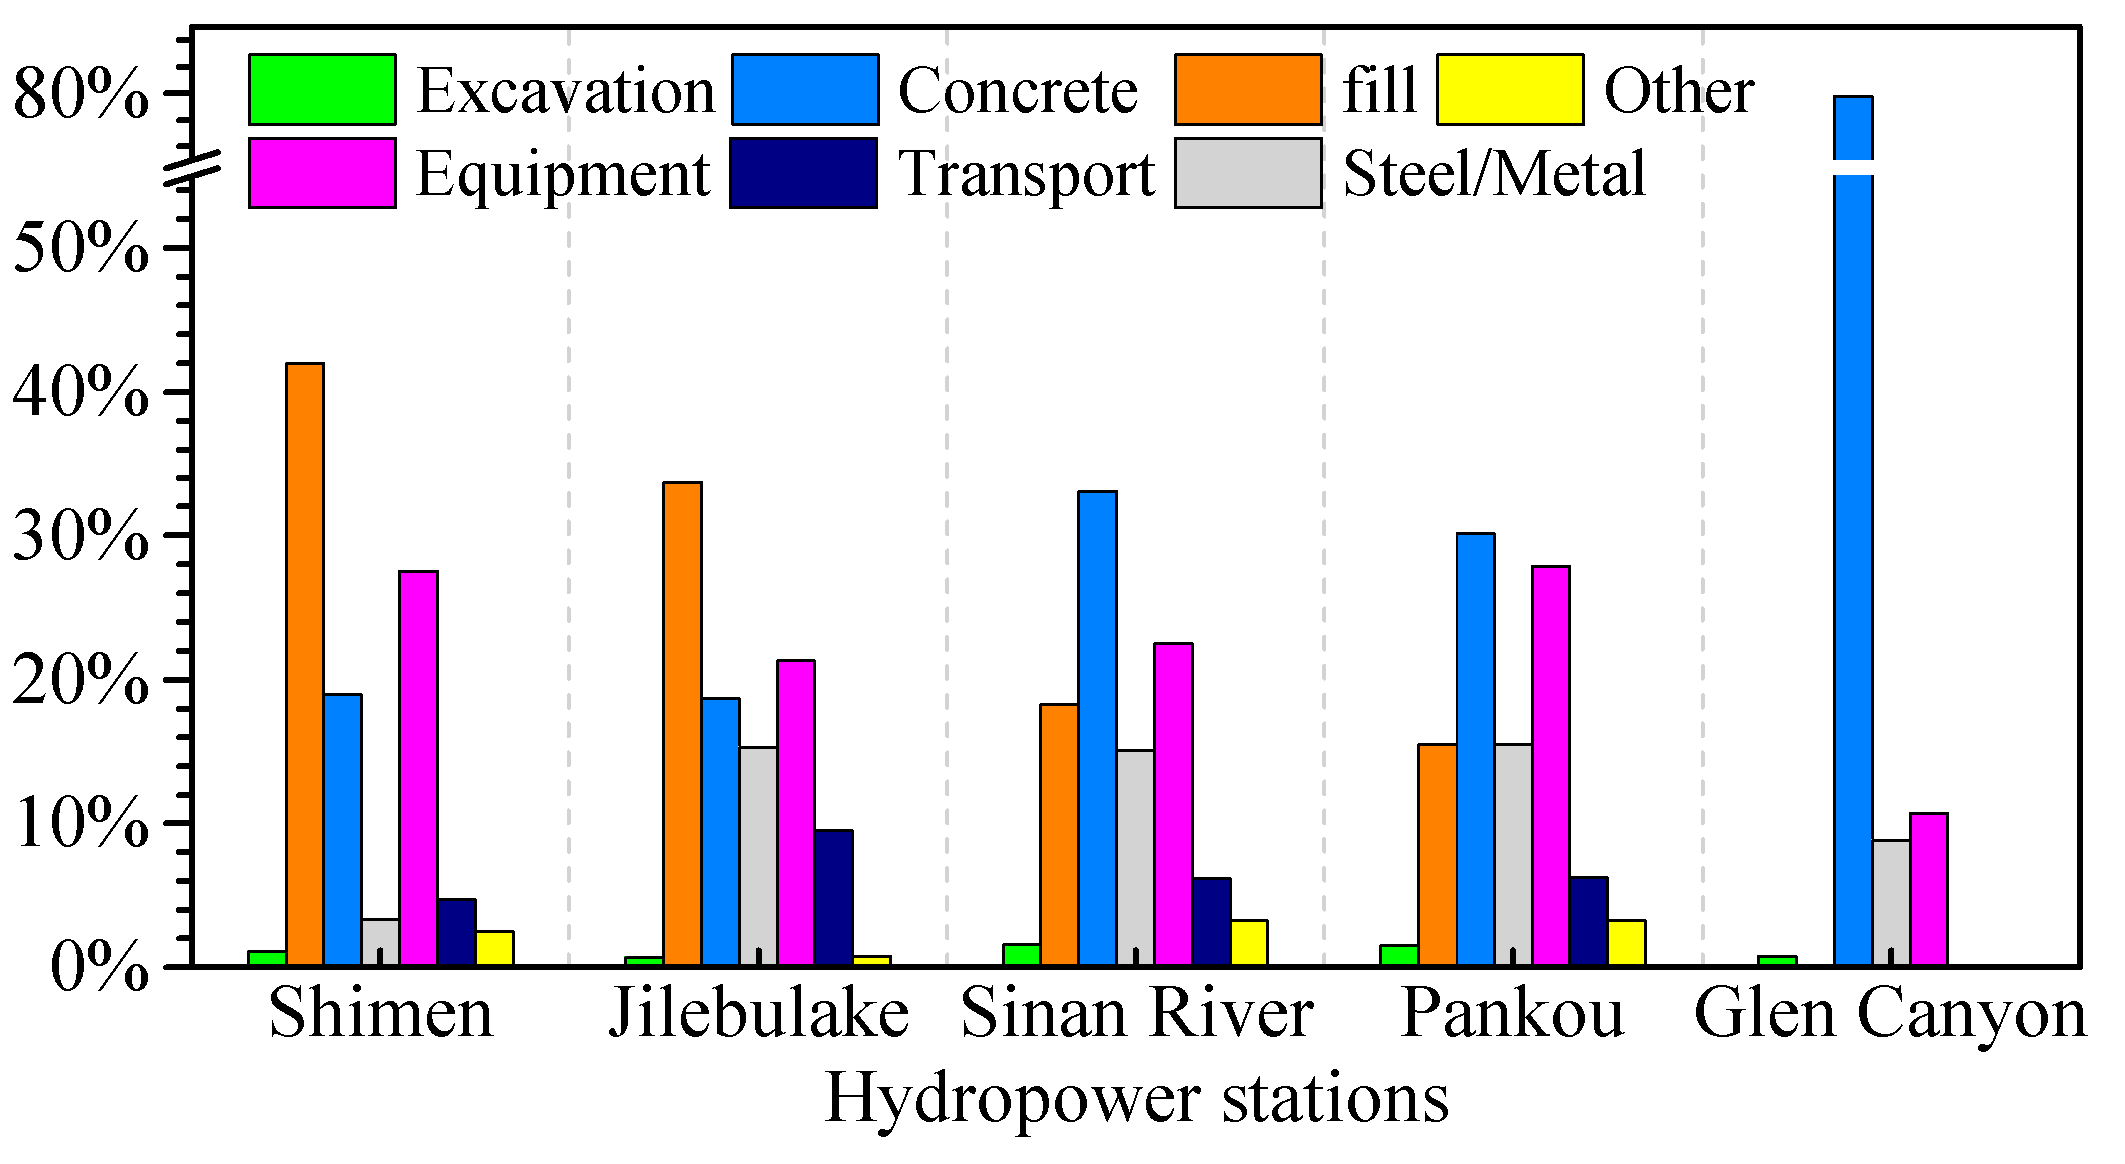
Figure 4 denotes the emission percentage in different construction stages. Excavation includes open earth and rock excavation, as well as underground rock excavation. Fill consists of granular and rock fill. Concrete includes facing, mass, reinforced concrete, along with shotcrete. Steel and metal includes reinforcement, pipelines and all other steelwork for structural purposes. Equipment refers to turbines, substations and all other mechanical and electrical equipment. Both material production and plant emissions of above items are summed together to show. Transportation is made up by two parts. One is the off-site highway transportation of metal and equipment materials, the other is on-site temporary road transportation of earth and rockfill, concrete and abandoned dreg, which has been described in Section 2.2. Besides, the clearance and removal of vegetation in the reservoir area before impoundment and temporary roads built also account for a fraction of total emissions, which are summed as the item ‘other’ in Figure 4. The Jilebulake, Sinan River and Pankou dams have the same structure with concrete faced and rockfill, so the proportion of construction emission for these three hydropower stations are similar. The difference for equipment emission of these three dams is related to the installed capacity. When installed capacity grows (Jilebulake < Sinan River < Pankou), more or larger turbines and associate structures are needed, so the emission percentage of equipment increases. The fill emission depends on local topography, Jilebulake has the tallest and longest dam (Table 2) so the fill emission is higher than Sinan River and Pankou. Moreover, transportation emission for Jilebulake is remarkably large because its off-site distance is the farthest. The result changes a lot when we focus on the Shimen site, which is built with an asphalt concrete core rockfill dam, so the steel and metal emissions are significantly lower compared with the other three. Another study focusing on carbon emissions during dam construction is the Glen Canyon hydropower station in northern Arizona, United States, which has an installed capacity of 1320 MW [51]. It is built with a concrete arch-gravity dam, where no earth and rockfill material is used and concrete accounts for nearly 80% of emissions (Figure 4). Based on these results, we can find that emissions during construction are totally different when the type of dam changes, so more case studies are needed to have a further understanding about this topic.
3.5. Net GHG Footprint
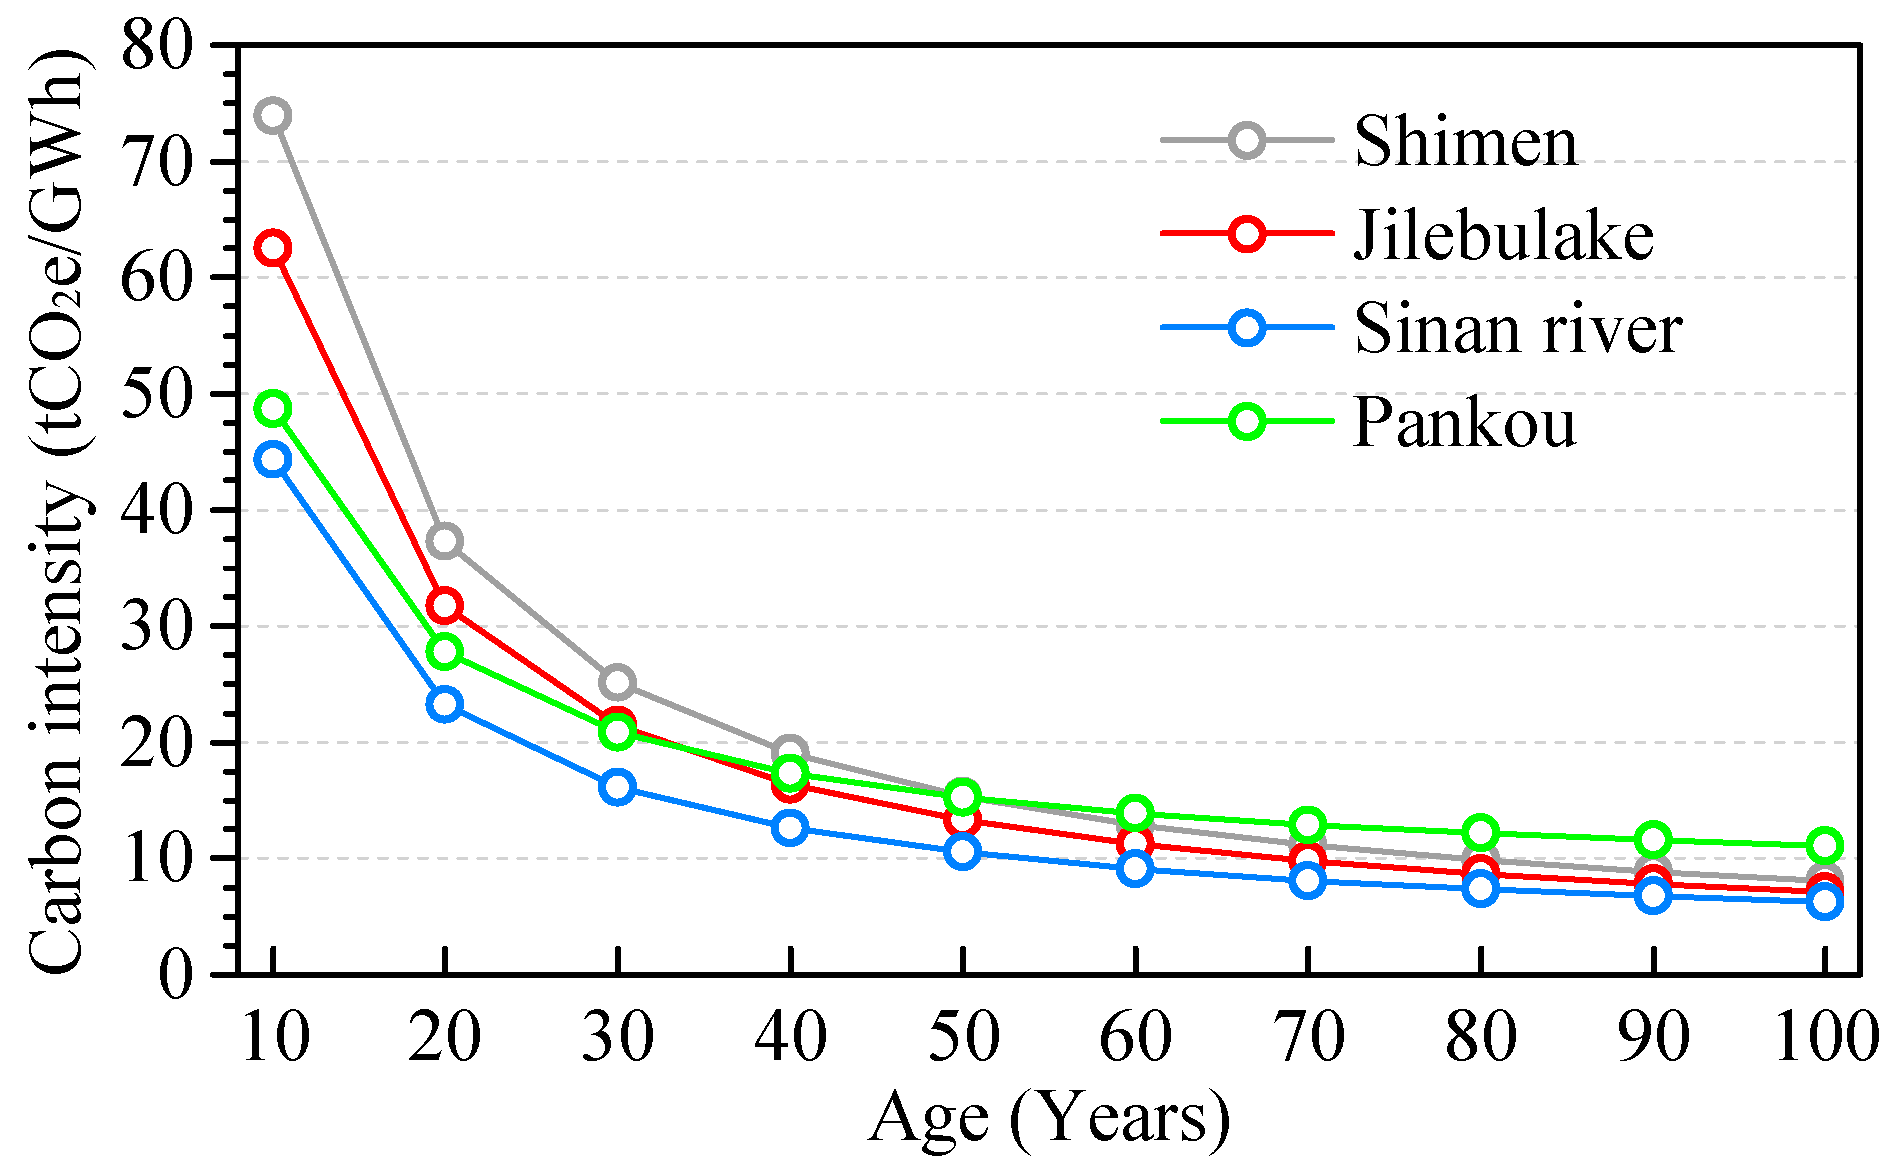
Net GHG footprint is the sum of the above four parts according to Equation (1). Table 7 presents the annual reservoir wide emission rate of GHG for pre/post-impoundment and UAS, as well as the overall construction emissions. Comparing with emissions from overall construction, the annual balance of the rest items is quite small. It is noted that overall construction emissions are a constant while the others are accumulated with time. Thus, the GHG intensity (GHG emission per unit electricity generated) is dependent on the total lifespan of the hydropower station. Based on the designed annual generation (Table 2), GHG intensity is calculated when lifespan varies from 10 to 100 years (Figure 5), which falls rapidly when lifespan increases from 10 to 40 years and then drops slightly when lifespan becomes longer. GHG intensity approaches 10 tCO2e/GWh when the lifespan is around 100 years. Among the four cases analyzed in this study, Sinan River has the lowest GHG intensity. Shimen and Jilebulake with relative smaller install capacities (95 MW and 160 MW) have remarkably higher GHG intensities than Pankou (500 MW); if they work less than 30 years while they will become more efficient and clean if they stay in good condition for 50 years or longer.
3.6. Comparison and Discussion
The average carbon intensity of the four normal size hydropower stations in this study is 13.60 tCO2e/GWh for lifetime of 50 years and 8.13 tCO2e/GWh for 100 years. Previous studies [26,27,28,29] for five large size hydropower stations in China show the results of 11.11 tCO2e/GWh for 44 years and an average of 7.25 tCO2e/GWh for 100 years (Table 8), which suggests that increasing installed capacity (from 50 MW to 16,000 MW) does not lead to a major increase of efficiency in terms of carbon emissions. But the emission pathways taken into account for previous cases are not as comprehensive as our work based on the G-res tool. For details, comparing with this study, Baihetan, Xiluodu and Xiangjiaba use a simple form of empirical model to calculate the post-impoundment balance which brings large uncertainty to the result, while Nuozhadu and Jinpingyiji mainly focus on the construction stage, which may underestimate the total carbon footprint. When comparing with cases from other countries, the average carbon intensity is 21.05 tCO2e/GWh for 24 reservoir-based small size hydropower stations (installed capacity lower than 20 MW) in India [18], which is about two times the normal size ones in this study. The carbon intensity for Itaipu station in Brazil with an installed capacity of 14,000 MW is 4.33 tCO2e/GWh [22], which is a little lower than large size ones in China. It is noted that Itaipu station is actually four dams joined together, which may make a contribution to further carbon intensity reductions, so future research should pay attention to interactions between dams within the same watershed.
According to China’s National Energy Administration, the emissions for electricity generated by coal is 822 tCO2/GWh [52], which is almost 100 times the emissions of hydroelectricity. Though hydropower stations associated with reservoir are a net carbon source, they are still beneficial in dealing with global warming issue as a substitution to fossil fuel power source. More cases with different climate backgrounds and installed capacities from 500 to 3000 MW are essential to get more precise life cycle assessments about hydropower stations in China.
4. Conclusions
Carbon emission from normal size hydropower stations with installed capacity 50–500 MW has sparsely been focused on in China. In this study carbon footprints during a dam’s lifespan are assessed for Shimen hydropower station (installed capacity 95 MW), Jilebulake (160 MW), Sinan River (201 MW) and Pankou (500 MW). Integrated G-res tool is used to conduct analysis, which takes four parts emission balance into consideration, including pre-impoundment, post-impoundment, UAS and construction. Accounting for the strict requirement for model inputs, a general procedure is proposed to prepare input variables based on multi source geographic datasets, consisting of land cover maps, digital elevation models and satellite images, as well as construction planning documents for each sites. Three main conclusions are summarized:
(1) In pre- and post-impoundment stages, the areal GHG emission balance in reservoir areas depends on the climate background, Sinan River and Pankou in humid subtropical regions are more active than Shimen and Jilebulake in arid temperate regions. In the construction stage, emissions from fill, concrete and equipment accounts for more than 70% of the total and dams with same structure share more similar emission proportions.
(2) GHG intensity falls rapidly when lifespan increases from 10 to 40 years and then drops slightly when lifespan becomes longer, which is 13.60 tCO2e/GWh for 50 years and 8.13 tCO2e/GWh for 100 years in average. Emission rates of hydropower stations with lower installed capacity are obviously large if they work less than 30 years and differ less with ones owning higher installed capacity when lifetime approaches 100 years. Besides, stations with an installed capacity of 3500 MW or more do not make a major increase of efficiency in terms of carbon emissions than that between 95 MW to 500 MW.
(3) Comparing with electricity generated by coal in China whose GHG intensity is 822 tCO2/GWh, hydroelectricity is almost 100 times more efficient and clean. Though hydropower stations associated with reservoirs are a net carbon source, they play an important role in dealing with global warming issue as a substitution for fossil fuel power sources. Hydropower development is now a national strategy in China and a number of new projects are being planned. The interaction between dams within the same watershed should be pre-evaluated to help optimize services among hydroelectricity, flood control, irrigation, water supply and emissions, which should be focused on in future research.
Author Contributions
Conceptualization, Y.L.; Methodology, Y.L. and T.J.; Software, T.J.; Validation, T.J.; Formal Analysis, Y.L. and T.J.; Investigation, T.J.; Resources, T.J.; Data Curation, T.J. and Y.H.; Writing-Original Draft Preparation, Y.L.; Writing-Review & Editing, T.J.; Visualization, T.J. and Y.H.; Supervision, Z.S.; Project Administration, Z.S.; Funding Acquisition, Z.S. and Y.L.
Funding
This research was funded by the financial support from the National Key Research and Development Program of China (2016YFA0602704), the Project of National Natural Science Foundation of China/Yalong River Joint Fund (Grant No. U1765205), the Innovation Research Project for Postgraduate in Jiangsu Province (KYZZ16_0284), a Project Funded by the Priority Academic Program Development of Jiangsu Higher Education Institutions (YS11001) and the State Scholarship Fund by China Scholarship Council (201704910528).
Acknowledgments
The authors thank Shanwen Liu from Southeast University for providing construction planning documents.
Conflicts of Interest
The authors declare no conflict of interest.
References
- IPCC. Climate Change 2013: The Physical Science Basis. Contribution of Working Group I to the Fifth Assessment Report of the Intergovernmental Panel on Climate Change; Cambridge University Press: Cambridge, UK; New York, NY, USA, 2014; pp. 659–740. ISBN 978-1-107-66182-0. [Google Scholar]
- Rogelj, J.; den Elzen, M.; Höhne, N.; Fransen, T.; Fekete, H.; Winkler, H.; Schaeffer, R.; Fu, S.; Riahi, K.; Meinshausen, M. Paris Agreement climate proposals need a boost to keep warming well below 2 °C. Nature 2016, 534, 631–639. [Google Scholar] [CrossRef] [PubMed] [Green Version]
- Rogelj, J.; Schaeffer, M.; Meinshausen, M.; Knutti, R.; Alcamo, J.; Riahi, K.; Hare, W. Zero emission targets as long-term global goals for climate protection. Environ. Res. Lett. 2015, 10, 105007. [Google Scholar] [CrossRef] [Green Version]
- Jackson, R.B.; Canadell, J.G.; Le Quéré, C.; Andrew, R.M.; Korsbakken, J.I.; Peters, G.P.; Nakicenovic, N. Reaching peak emissions. Nat. Clim. Chang. 2016, 6, 7–10. [Google Scholar] [CrossRef] [Green Version]
- Olivier, J.G.J.; Schure, K.M.; Peters, J.A.H.W. Trends in Global CO2 and Total Greenhouse Gas Emissions: 2017 Report; PBL Netherlands Environmental Assessment Agency: Hague, The Netherlands, 2017; pp. 8–12. [Google Scholar]
- IRENA. Renewable Energy Statistics 2017; The International Renewable Energy Agency: Abu Dhabi, UAE, 2017; pp. 8–34. ISBN 978-92-9260-0334. [Google Scholar]
- Statistical Review of World Energy, Energy Economics, BP. Available online: http://www.bp.com/en/global/corporate/energy-economics/statistical-review-of-world-energy.html (accessed on 17 February 2018).
- Pérez-Sánchez, M.; Sánchez-Romero, F.J.; Ramos, H.M.; López-Jiménez, P.A. Energy recovery in existing water networks: Towards greater sustainability. Water 2017, 9, 97. [Google Scholar] [CrossRef]
- Spänhoff, B. Current status and future prospects of hydropower in Saxony (Germany) compared to trends in Germany, the European Union and the World. Renew. Sust. Energy Rev. 2014, 30, 518–525. [Google Scholar] [CrossRef]
- Barros, N.; Cole, J.J.; Tranvik, L.J.; Prairie, Y.T.; Bastviken, D.; Huszar, V.L.M.; del Giorgio, P.; Roland, F. Carbon emission from hydroelectric reservoirs linked to reservoir age and latitude. Nat. Geosci. 2011, 4, 593–596. [Google Scholar] [CrossRef]
- Fearnside, P.M. Greenhouse gas emissions from hydroelectric dams: Controversies provide a springboard for rethinking a supposedly ‘clean’ energy source. An editorial comment. Clim. Chang. 2004, 66, 1–8. [Google Scholar] [CrossRef]
- Paish, O. Micro-hydropower: Status and prospects. Proc. Inst. Mech. Eng. Part A J. Power Energy 2002, 216, 31–40. [Google Scholar] [CrossRef]
- Wiedmann, T.; Minx, J. The Definition of a Carbon Footprint. In Ecological Economics Research Trends; Pertsova, C.C., Ed.; Nova Science Publishers: New York, NY, USA, 2008; pp. 1–11. ISBN 1-60021-941-1. [Google Scholar]
- Pandey, D.; Agrawal, M.; Pandey, J.S. Carbon footprint: Current methods of estimation. Environ. Monit. Assess. 2011, 178, 135–160. [Google Scholar] [CrossRef] [PubMed]
- Gallagher, J.; Styles, D.; McNabola, A.; Williams, A.P. Current and future environmental balance of small-scale run-of-river hydropower. Environ. Sci. Technol. 2015, 49, 6344–6351. [Google Scholar] [CrossRef] [PubMed]
- Gallagher, J.; Styles, D.; McNabola, A.; Williams, A.P. Life cycle environmental balance and greenhouse gas mitigation potential of micro-hydropower energy recovery in the water industry. J. Clean Prod. 2015, 99, 152–159. [Google Scholar] [CrossRef]
- Varun, I.K.; Prakash, B.R. LCA of renewable energy for electricity generation systems—A review. Renew. Sust. Energy Rev. 2009, 13, 1067–1073. [Google Scholar] [CrossRef]
- Prakash, R.; Bhat, I.K. Life cycle greenhouse gas emissions estimation for small hydropower schemes in India. Energy 2012, 44, 498–508. [Google Scholar] [CrossRef]
- Suwanit, W.; Gheewala, S.H. Life cycle assessment of mini-hydropower plants in Thailand. Int. J. LCA 2011, 16, 849–858. [Google Scholar] [CrossRef]
- García-Gusano, D.; Iribarren, D.; Martín-Gamboa, M.; Dufour, J.; Espegren, K.; Lind, A. Integration of life-cycle indicators into energy optimisation models: The case study of power generation in Norway. J. Clean Prod. 2016, 112, 2693–2696. [Google Scholar] [CrossRef]
- Valente, A.; Iribarren, D.; Dufour, J.; Spazzafumo, G. Life-cycle performance of hydrogen as an energy management solution in hydropower plants: A case study in Central Italy. Int. J. Hydrogen Energy 2015, 40, 16660–16672. [Google Scholar] [CrossRef]
- Ribeiro, F.d.M.; da Silva, G.A. Life-cycle inventory for hydroelectric generation: A Brazilian case study. J. Clean Prod. 2010, 18, 44–54. [Google Scholar] [CrossRef]
- Liu, Y.; Wang, F.; Zheng, J.Y. Estimation of greenhouse gas emissions from the EU, US, China, and India up to 2060 in comparison with their pledges under the Paris agreement. Sustainability 2017, 9, 1587. [Google Scholar] [CrossRef]
- Mi, Z.F.; Meng, J.; Guan, D.B.; Shan, Y.L.; Liu, Z.; Wang, Y.T.; Feng, K.; Wei, Y.-M. Pattern changes in determinants of Chinese emissions. Environ. Res. Lett. 2017, 12, 074003. [Google Scholar] [CrossRef] [Green Version]
- Mi, Z.F.; Meng, J.; Guan, D.B.; Shan, Y.L.; Song, M.L.; Wei, Y.M.; Liu, Z.; Hubacek, K. Chinese CO2 emission flows have reversed since the global financial crisis. Nat. Commun. 2017, 8, 1712. [Google Scholar] [CrossRef] [PubMed]
- Du, H.L.; Li, Z.; Guo, J.S. Carbon footprint of a large hydropower project in the upstream of the Yangtze: Following ISO14067. Resour. Environ. Yangtze Basin 2017, 26, 1102–1110. (In Chinese) [Google Scholar] [CrossRef]
- Li, Z.; Du, H.L.; Xiao, Y.; Guo, J.S. Carbon footprints of two large hydro-projects in China: Life-cycle assessment according to ISO/TS 14067. Renew. Energy 2017, 114, 534–546. [Google Scholar] [CrossRef]
- Zhang, Q.F.; Karney, B.; MacLean, H.L.; Feng, J.C. Life-cycle inventory of energy use and greenhouse gas emissions for two hydropower projects in China. J. Infrastruct. Syst. 2007, 13, 271–279. [Google Scholar] [CrossRef]
- Zhang, S.R.; Pang, B.H.; Zhang, Z.L. Carbon footprint analysis of two different types of hydropower schemes: Comparing earth-rockfill dams and concrete gravity dams using hybrid life cycle assessment. J Clean Prod. 2015, 103, 854–862. [Google Scholar] [CrossRef]
- Ministry of Water Resources China; National Bureau of Statistics China. Bulletin of First National Census for Water; China Water & Power Press: Beijing, China, 2011; pp. 3–7. ISBN 9787517007173.
- Prairie, Y.T.; Alm, J.; Harby, A.; Mercier-Blais, S.; Nahas, R. The GHG Reservoir Tool (G-res), UNESCO/IHA Research Project on the GHG Status of Freshwater Reservoirs. Version 1.1. Available online: http://www.hydropower.org/gres-tool (accessed on 17 March 2018).
- Prairie, Y.T.; Alm, J.; Beaulieu, J.; Barros, N.; Battin, T.; Cole, J.; del Giorgio, P.; DelSontro, T.; Guérin, F.; Harby, A.; et al. Greenhouse gas emissions from freshwater reservoirs: What does the atmosphere see? Ecosystems 2017, 1–14. [Google Scholar] [CrossRef]
- IPCC. IPCC Special Report on Renewable Energy Sources and Climate Change Mitigation. Prepared by Working Group III of the Intergovernmental Panel on Climate Change; Cambridge University Press: Cambridge, UK; New York, NY, USA, 2011; pp. 80–87. ISBN 978-92-9169-131-9. [Google Scholar]
- Prairie, Y.T.; Alm, J.; Harby, A.; Mercier-Blais, S.; Nahas, R. The GHG Reservoir Tool (G-res) User Guide, UNESCO/IHA Research Project on the GHG Status of Freshwater Reservoirs; Version 1.1; Joint publication of the UNESCO Chair in Global Environmental Change and the International Hydropower Association: London, UK, 2017; pp. 1–38. [Google Scholar]
- Farr, T.G.; Rosen, P.A.; Caro, E.; Crippen, R.; Duren, R.; Hensley, S.; Kobrick, M.; Paller, M.; Rodriquez, E.; Roth, L.; et al. The shuttle radar topography mission. Rev. Geophys. 2007, 45, RG2004. [Google Scholar] [CrossRef]
- Prairie, Y.T.; Alm, J.; Harby, A.; Mercier-Blais, S.; Nahas, R. User Guidelines for the Earth Engine Functionality, UNESCO/IHA Research Project on the GHG Status of Freshwater Reservoirs; Joint publication of the UNESCO Chair in Global Environmental Change and the International Hydropower Association: London, UK, 2017; pp. 1–24. [Google Scholar]
- Three Global LC Maps for the 2000, 2005 and 2010 Epochs. Available online: http://www.esa-landcover-cci.org/?q=node/158 (accessed on 17 February 2018).
- Prairie, Y.T.; Alm, J.; Harby, A.; Mercier-Blais, S.; Nahas, R. The GHG Reservoir Tool (G-res) Technical Documentation, UNESCO/IHA Research Project on the GHG Status of Freshwater Reservoirs; Version 1.1; Joint publication of the UNESCO Chair in Global Environmental Change and the International Hydropower Association: London, UK, 2017; pp. 1–76. [Google Scholar]
- Zheng, J.Y.; Yin, Y.H.; Li, B.Y. A new scheme for climate regionalization in China. Acta Geograph. Sin. 2010, 65, 3–13. (In Chinese) [Google Scholar]
- Patterson, T.; Jenny, B. The development and rationale of cross-blended hypsometric tints. Cartogr. Perspect. 2011, 69, 31–46. [Google Scholar] [CrossRef]
- Qu, M.Q. The Construction Organization Design of Shimen Hydropower Station Engineering. Master’s Thesis, Xi’an University of Technology, Xi’an, Shaanxi Province, China, 2011. (In Chinese). [Google Scholar]
- Wang, H.Q.; Li, X.L. Analysis of turbine type selection and design in Shimen hydropower station. Shaanxi Water Resour. 2017, 5, 141–143. (In Chinese) [Google Scholar] [CrossRef]
- Han, Z.F.; He, W.C.; Gao, W. Construction Technology for Concrete Faced Rockfill Dam of Jilebulake Hydropower Station in Xinjiang. In Technical Progress of Concrete Faced Rockfill Dam in High and Cold Region; China Society for Hydropower Engineering, Sinohydro Bureau 11 CO., LTD., Ed.; China Water and Power Press: Beijing, China, 2013; pp. 42–50. ISBN 978-7-5170-1225-2. (In Chinese) [Google Scholar]
- Liu, S.W.; (Southeast University, Nanjing, Jiangsu Province, China). Construction planning document for Jilebulake hydropower station. Personal communication, 2014. (In Chinese). [Google Scholar]
- Shen, Z.Z.; Nie, B.S.; Sun, Y.F.; (Hohai University, Nanjing, Jiangsu Province, China). Construction planning document for Sinan River hydropower station. Personal communication, 2014. (In Chinese). [Google Scholar]
- Hu, W.; Hu, J. Overview on engineering design of Pankou hydropower station. Yangtze River 2012, 43, 26–30. (In Chinese) [Google Scholar] [CrossRef]
- Hu, W.N.; Zhou, Q.D.; Zhang, H.N. Structural characteristics of turbines, Pankou hydropower station. Northwest. Hydropower 2012, S1, 51–54. (In Chinese) [Google Scholar] [CrossRef]
- Liu, S.W.; (Southeast University, Nanjing, Jiangsu Province, China). Construction planning document for Pankou hydropower station. Personal communication, 2014. (In Chinese). [Google Scholar]
- Sentinels Scientific Data Hub. Available online: https://scihub.copernicus.eu/dhus (accessed on 10 March 2018).
- Chang, K.T. Introduction to Geographic Information System, 7th ed.; McGraw-Hill Education: New York, NY, USA, 2014; pp. 293–315. ISBN 978-0-07-352290-6. [Google Scholar]
- Pacca, S.; Horvath, A. Greenhouse gas emissions from building and operating electric power plants in the Upper Colorado River Basin. Environ. Sci. Technol. 2002, 36, 3194–3200. [Google Scholar] [CrossRef] [PubMed]
- China’s National Energy Administration. Available online: http://www.nea.gov.cn/2017-09/25/c_136636915.htm (accessed on 17 February 2018).
Figure 1.
Map of locations of four hydropower stations in China with cross blended hypsometric tints [40] (size of red triangle indicates the installed capacity).
Figure 1.
Map of locations of four hydropower stations in China with cross blended hypsometric tints [40] (size of red triangle indicates the installed capacity).

Figure 2.
Sentinel-2A satellite images for four hydropower stations (red triangles indicates the location of dam). (a) Shimen hydropower station on 9 May 2018; (b) Jilebulake hydropower station on 2 May 2018; (c) Sinan River hydropower station on 15 April 2018; (d) Pankou hydropower station on 16 April 2018.

Figure 3.
Land cover and land use types in catchment areas for four hydropower stations in China (red triangles indicate the location of dams and blue river lines is illustrated in bold style to show). (a) Shimen; (b) Jilebulake; (c) Sinan River; (d) Pankou.
Figure 3.
Land cover and land use types in catchment areas for four hydropower stations in China (red triangles indicate the location of dams and blue river lines is illustrated in bold style to show). (a) Shimen; (b) Jilebulake; (c) Sinan River; (d) Pankou.

Figure 4.
The percentage of emissions in different construction stages for four hydropower stations in China and comparison with the Glen Canyon in United States.
Figure 4.
The percentage of emissions in different construction stages for four hydropower stations in China and comparison with the Glen Canyon in United States.

Figure 5.
Change of GHG intensity with lifetime from 10 to 100 years for four hydropower stations in China.
Figure 5.
Change of GHG intensity with lifetime from 10 to 100 years for four hydropower stations in China.

Table 1.
Annual mean meteorology and hydrology statistics of the four hydro station sites in China.
| Hydropower Stations | Shimen | Jilebulake | Sinan River | Pankou |
|---|---|---|---|---|
| Temperature (°C) | 6.25 | 4.11 | 21.04 | 15.80 |
| Precipitation (mm) | 409.1 | 175.1 | 1710 | 882.7 |
| Runoff (m3/s) | 14.4 | 68.8 | 43.4 | 164 |
| Wind speed at 10 m above surface (m/s) | 4.71 | 4.74 | 2.31 | 2.72 |
| Surface horizontal radiance (kWh/m2/day) | 4.09 | 3.92 | 4.61 | 3.61 |
| Soil carbon content (kgC/m2) | 0 | 2.16 | 5.97 | 2.42 |
Table 2.
Main parameters and construction inventories of four hydropower stations in China from construction planning documents [41,42,43,44,45,46,47,48].
| Hydropower Stations | Shimen | Jilebulake | Sinan River | Pankou |
|---|---|---|---|---|
| Impoundment year | 2013 | 2013 | 2007 | 2011 |
| Normal operating level (m a.s.l.) | 1240 | 752 | 900 | 355 |
| Water intake elevation (m a.s.l.) | 1175 | 698 | 850 | 309 |
| Maximum dam height (m) | 106 | 146.4 | 115 | 114 |
| Top length of the dam (m) | 312.51 | 464 | 344.46 | 292 |
| Catchment area (km2) | 1881 | 6056 | 1583 | 8950 |
| Total reservoir volume (km3) | 0.0775 | 0.232 | 0.247 | 2.353 |
| Regulated storage capacity (km3) | 0.0702 | 0.143 | 0.202 | 1.120 |
| Turbine type | HLA936-LJ-186 | HL166-LJ-190 HL166-LJ-242 | HLF-LJ-230 | HL-LJ-611.2 |
| Net head (m) | 211 | 110 | 320 | 83 |
| Flow rate (m3/s) | 25.08 | 30.95/51.47 | 23.6 | 337.85 |
| Efficiency (%) | 93.94 | 85 | - | 92.83 |
| Installed capacity (MW) | 95 | 160 | 201 | 500 |
| Availability factor (hours/year) | 2253 | 2700/3400 | 4575 | 2157 |
| Total annual generation (GWh/year) | 214 | 495 | 908 | 1079 |
| Investments (104 CNY) | 138,400 | 129,754.34 | 139,852.49 | 439,700 |
| Open excavation (m3) | 1,248,642 | 1,179,900 | 1,825,560 | 4,186,400 |
| Underground excavation (m3) | 819 | 87,100 | 607,100 | 179,300 |
| Earth and rockfill (m3) | 3,057,871 | 4,942,400 | 2,973,000 | 3,349,600 |
| Concrete (m3) | 88,379 | 170,200 | 379,000 | 405,000 |
| Steel and other metal structures (t) | 1904 | 18468 | 22400 | 27545 |
Table 3.
Coordinates and parameters of four hydropower stations in China from spatial analysis.
| Hydropower Stations | Shimen | Jilebulake | Sinan River | Pankou |
|---|---|---|---|---|
| Longitude (°E) | 86.597 | 86.426 | 101.873 | 110.153 |
| Latitude (°N) | 43.805 | 48.183 | 23.094 | 32.212 |
| Catchment area (km2) | 1922 | 6081 | 1594 | 8927 |
| Catchment area error (%) | 2.18 | 0.41 | 0.69 | 0.26 |
| Reservoir volume (km3) | 0.0690 | 0.237 | 0.257 | 2.389 |
| Reservoir volume error (%) | 1.59 | 2.08 | 4.14 | 1.55 |
Table 4.
Land cover types and related GHG balance for area merged by reservoir for four hydropower stations in China.
Table 4.
Land cover types and related GHG balance for area merged by reservoir for four hydropower stations in China.
| Hydropower Stations | Shimen | Jilebulake | Sinan River | Pankou |
|---|---|---|---|---|
| Bare areas (%) | 14.71 | 70.59 | 0 | 0 |
| Grassland/shrubland (%) | 85.29 | 1.47 | 60.19 * | 24.00 |
| Water bodies (%) | 0 | 27.94 | 0 | 0 |
| Croplands (%) | 0 | 0 | 3.88 | 55.71 |
| Forest (%) | 0 | 0 | 35.92 | 19.26 |
| Settlements (%) | 0 | 0 | 0 | 1.03 |
| Areal CO2 emission rate (gCO2e/m2/year) | 0 | 0 | −50 | −17 |
| Areal CH4 emission rate (gCO2e/m2/year) | 0 | 10 | 0 | 0 |
* Percentages may not total 100 due to rounding.
Table 5.
Emission rate and 67% confidence intervals of CO2 and CH4 in reservoir areas after impounding for four hydropower stations in China.
Table 5.
Emission rate and 67% confidence intervals of CO2 and CH4 in reservoir areas after impounding for four hydropower stations in China.
| Hydropower Stations | Shimen | Jilebulake | Sinan River | Pankou |
|---|---|---|---|---|
| CO2 release rate (gCO2e/m2/year) | 49 (22–113) | 43 (19–99) | 144 (63–331) | 98 (43–225) |
| CH4 release rate (gCO2e/m2/year) | 35.2 (9.9–125.0) | 39.4 (11.1–139.9) | 223.7 (63.0–794.1) | 72.0 (20.3–255.6) |
| - in which diffusive flux (%) | 79 | 78 | 40 | 62 |
| - in which degassing (%) | 16 | 17 | 36 | 29 |
| - in which bubbling (%) | 5 | 5 | 24 | 9 |
Table 6.
CH4 release rate in reservoir area due to UAS.
| Hydropower Stations | Shimen | Jilebulake | Sinan River | Pankou |
|---|---|---|---|---|
| Water residence time (year) | 11.1 | 9.4 | 0.3 | 0.8 |
| CH4 release rate due to UAS (gCO2e/m2/year) | 15.0 | 15.5 | 188.6 | 65.4 |
| - in which from land use (%) | 17 | 57 | 4 | 3 |
| - in which from sewage (%) | 83 | 43 | 96 | 97 |
| UAS/Post-impoundment CH4 release (%) | 43 | 39 | 84 | 91 |
Table 7.
Annual reservoir wide emission rate of GHG for pre/post-impoundment and UAS and overall construction emission.
Table 7.
Annual reservoir wide emission rate of GHG for pre/post-impoundment and UAS and overall construction emission.
| Hydropower Stations | Shimen | Jilebulake | Sinan River | Pankou |
|---|---|---|---|---|
| Pre-impoundment (tCO2e/year) | 0 | 84 | −411 | −1057 |
| Post-impoundment (tCO2e/year) | 185 | 674 | 2999 | 10397 |
| UAS (tCO2e/year) | 33 | 126 | 1540 | 3991 |
| Construction (tCO2e) | 156,563 | 304,880 | 384,074 | 450,436 |
Table 8.
Parameters and carbon footprint of five large size hydropower stations in China from previous studies [26,27,28,29].
| Hydropower Stations | Baihetan | Xiluodu | Xiangjiaba | Nuozhadu | Jinpingyiji |
|---|---|---|---|---|---|
| Longitude (°E) | 102.9 | 103.62 | 104.39 | 100.42 | 101.63 |
| Latitude (°N) | 27.2 | 28.24 | 28.64 | 22.65 | 28.18 |
| Installed capacity (MW) | 16,000 | 12,600 | 6400 | 5850 | 3600 |
| Total carbon footprint (tCO2e) | 54,169,000 | 40,817,202 | 24,213,563 | 11,692,500 | 9,539,000 |
| Total annual generation (GWh/year) | 62,520 | 60,590 | 30,880 | 23,912 | 16,620 |
| Designed lifetime (year) | 100 | 100 | 100 | 44 | 100 |
| Carbon intensity (tCO2e/GWh) | 8.66 | 6.74 | 7.84 | 11.11 | 5.74 |
© 2018 by the authors. Licensee MDPI, Basel, Switzerland. This article is an open access article distributed under the terms and conditions of the Creative Commons Attribution (CC BY) license (http://creativecommons.org/licenses/by/4.0/).
Share and Cite
MDPI and ACS Style
Jiang, T.; Shen, Z.; Liu, Y.; Hou, Y. Carbon Footprint Assessment of Four Normal Size Hydropower Stations in China. Sustainability 2018, 10, 2018. https://doi.org/10.3390/su10062018
AMA Style
Jiang T, Shen Z, Liu Y, Hou Y. Carbon Footprint Assessment of Four Normal Size Hydropower Stations in China. Sustainability. 2018; 10(6):2018. https://doi.org/10.3390/su10062018
Chicago/Turabian StyleJiang, Ting, Zhenzhong Shen, Yang Liu, and Yiyang Hou. 2018. "Carbon Footprint Assessment of Four Normal Size Hydropower Stations in China" Sustainability 10, no. 6: 2018. https://doi.org/10.3390/su10062018
Note that from the first issue of 2016, this journal uses article numbers instead of page numbers. See further details here.