Sustainable Timber Transport—Economic Aspects of Aerodynamic Reconfiguration


1
Division of Applied Thermodynamics and Fluid Mechanics, Department of Management and Engineering, Linköping University, Linköping 581 83, Sweden
2
Division of Logistics and Quality Development, Department of Management and Engineering, Linköping University, Linköping 581 83, Sweden
*
Author to whom correspondence should be addressed.
Sustainability 2018, 10(6), 1965; https://doi.org/10.3390/su10061965
Submission received: 27 April 2018
/
Revised: 31 May 2018
/
Accepted: 6 June 2018
/
Published: 12 June 2018
(This article belongs to the Special Issue Sustainable Freight Transport)
Abstract
:There is a need to reduce fuel consumption, and thereby reduce CO2-emissions in all parts of the transport sector. It is also well known that aerodynamic resistance affects the fuel consumption in a major way. By improving the aerodynamics of the vehicles, the fuel consumption will also decrease. A special type of transportation is that of timber, which is performed by specialized trucks with few alternative uses. This paper follows up on earlier papers concerning Swedish timber trucks where aerodynamic improvements for timber trucks were tested. By mapping the entire fleet of timber trucks in Sweden and investigating reduced fuel consumption of 2–10%, financial calculations were performed on how these improvements would affect the transport costs. Certain parameters are investigated, such as investment cost, extra changeover time and weight of installments. By combining these results with the mapping of the fleet, it can be seen under which circumstances these improvements would be sustainable. The results show that it is possible through aerodynamics to lower the transportation costs and make an investment plausible, with changeover time being the most important parameter. They also show that certain criteria for a reduced transportation cost already exist within the vehicle fleet today.
1. Introduction
According to the latest reports, greenhouse gas emissions continue to rise in the world [1]. In Sweden through the 1990s greenhouse gas emissions have increased by 20% [2] and demand for reduced emissions and increasing fuel prices are ongoing challenges for the whole transport sector. A large majority of Sweden’s cargo is transported on the road [3] and a special case of that is the timber transports.
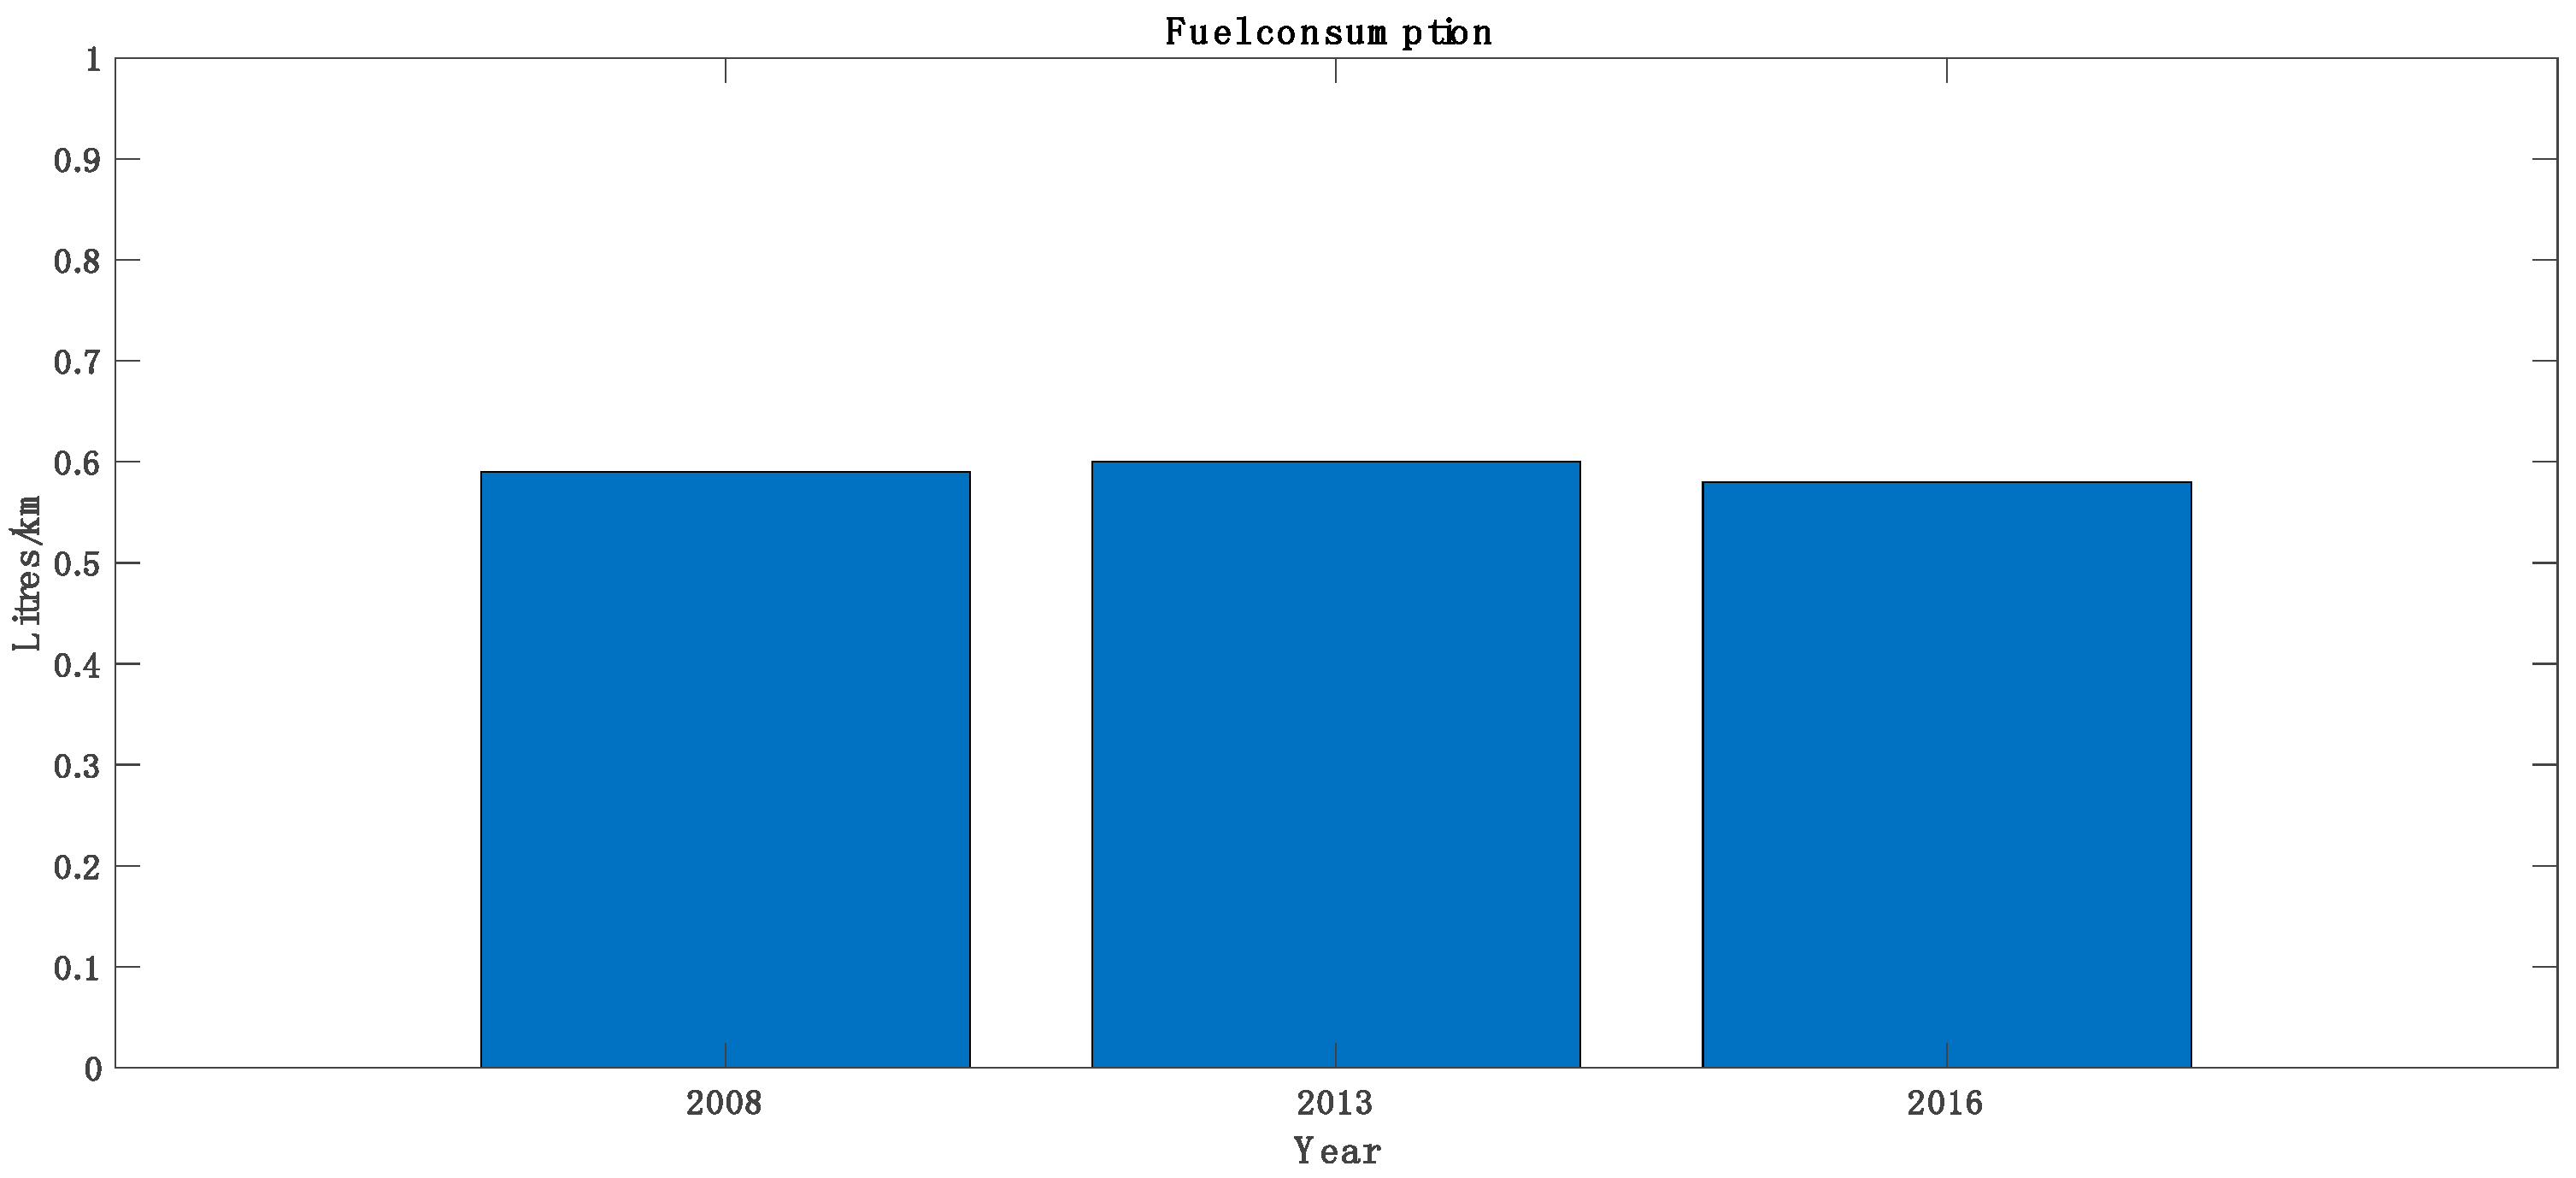
The total fleet of timber trucks consists of over 1600 registered timber trucks that transported 60 million tonnes of round wood last year. These trucks represent 2% of all heavy trucks in Sweden [4]. As these trucks are for a special purpose (timber transport only) the empty running is at least 50%, resulting in a fill rate under 50%. This is not only when measured by weight, which ordinary trucks also can achieve, but also measured by volume, which makes timber transports unique [5]. The half part of the transport distance that is performed by empty trucks makes the fleet unique and any changes in design must include not only all problems with an irregular cargo situation (piles of timber) but also the empty vehicles [5]. The average drag coefficient can sometimes also be higher with an empty truck than a loaded one which creates unique situations. Here it is also important to note that drag coefficient is not the same as energy efficiency [5]. A lot of effort has over many decades been made by truck manufacturers to reduce the emissions from the engine itself over many decades. However little progress has been made when it comes to other efforts of reducing the fuel consumption of the timber trucks, and reports show that fuel consumption has remained around 0.58 L/km for the last years, or 0.030 L/tonneskm, seen in Figure 1 [6]. Hence, alternative measures need to be taken. From a technology perspective, the fleet needs to become greener through means other than more efficient engines.
Through earlier research it has been shown that by improving the aerodynamics of the timber trucks the drag coefficient can be reduced, and with that the fuel consumption [5,7]. This reduces the CO2-emissions from the trucks, and lower fuel costs also benefit the haulers [5]. Fuel efficiency is also a first priority for carriers since it is a major part (30%) of the total operating cost. Earlier research has addressed aerodynamics improvements for trucks and implications from reduced drag on fuel consumption, however holistic analyses of the economic consequences is still missing. Reduced fuel consumption will also lead to reduced cost for the road carriers, but aerodynamics investments will affect the trucks more than just reduced fuel consumption. For example, aerodynamics installment will affect the cost of the trucks and the weight of the trucks as well. The implications this will have on the total transport cost and economic calculations beyond reduced fuel cost is yet to be investigated, but they will have a crucial part in the success of aerodynamic installments and improvements.
This study aims to further earlier research focused on technical, aspects and investigate and conceptualize the economic implications aerodynamic improvements will have on transport costs. The study addresses more parameters of aerodynamic improvements than just the fuel consumption and aims to understand how these parameters will affect transport costs. It addresses the opportunity to introduce aerodynamic improvements in the timber truck fleet as a means to reduce fuel consumption and thereby reduce emissions. Through mapping the entire fleet of vehicles, numerical simulations and economic calculations, the fleet is assessed and the possibility for feasible investment, here described in terms of aerodynamic improvements, is investigated. This paper discusses challenges and opportunities related to making the fleet more sustainable through reconfiguration.
Research Background
This study takes off from prior research in aerodynamic re-design of timber trucks based on a combination of flow simulations and wind tunnel experiments. In addition, this analysis takes inspiration from prior findings from green logistics research.
The flow simulations were done using Computational Fluid Dynamics (CFD). The simulations were performed in the commercially available software ANSYS Fluent 18.0 (ANSYS Inc., Canonsburg, PA, USA). The model has shown good agreement with experimental data for similar studies [8,9,10,11].
In CFD simulations the domain consisted of a rectangular tunnel making it a “virtual wind tunnel” where the model was placed 3.5 and 5 truck lengths from the inlet and outlet, respectively, to reduce possible effects from the boundary conditions. The frontal area of the truck covers less than 1% of the domain cross section area to minimize the blockage effect.
The free-stream was modeled with a velocity inlet with a prescribed uniform velocity profile, with turbulence intensity 0.1%, a zero pressure-outlet and free-slip condition for the top and side surfaces of the domain. The grid consisted of triangle surface mesh connected to a Cartesian grid. Refinement of the mesh was done in regions where large gradients were expected. Between 6 and 16 prisms layers were added on all the no-slip surfaces to accurately capture the near wall flow. The two-equation k-ε realizable turbulence model with Enhanced Wall Treatment (EWT) was used for the RANS (Reynolds Averaged Navier-Stokes) simulations.
The ground and the surfaces of the truck (model) were modeled with no-slip condition, and to replicate road conditions moving ground and rotating wheel conditions (rotational velocity boundary conditions) were used. The truck was simulated at a Reynolds number of 4.9 million, based on the truck height, which corresponds to the truck driving at 80 km/h and all simulations were performed at a yaw angle of 5°.
The tractive resistance of a ground vehicle can be divided into four separate parts [12], Equation (1).
where is the rolling-, the acceleration-, the hill climb- and the aerodynamic drag. For a vehicle driving at constant speed on a relatively flat road, the rolling resistance and aerodynamic drag are the dominating forces. While the rolling resistance varies linearly with the speed of the vehicle, the aerodynamic drag varies with the square of this speed, Equation (2), which increases the importance of it at higher speeds.
where is the drag coefficient, the density of air, the free-stream velocity and A the reference area. The results are presented in Table 1. Two representative cases are presented in Table 1. The Baseline truck (BLT) is modelled after a standard, contemporary, road-going configuration, whereas the Bulkhead Shield and the Side Skirts represents possible additions for the Baseline configuration. All CD reductions are computed using CFD applying the methodology described above; the estimated fuel consumption reduction is estimated as one-third of the CD reduction according to industry practice.
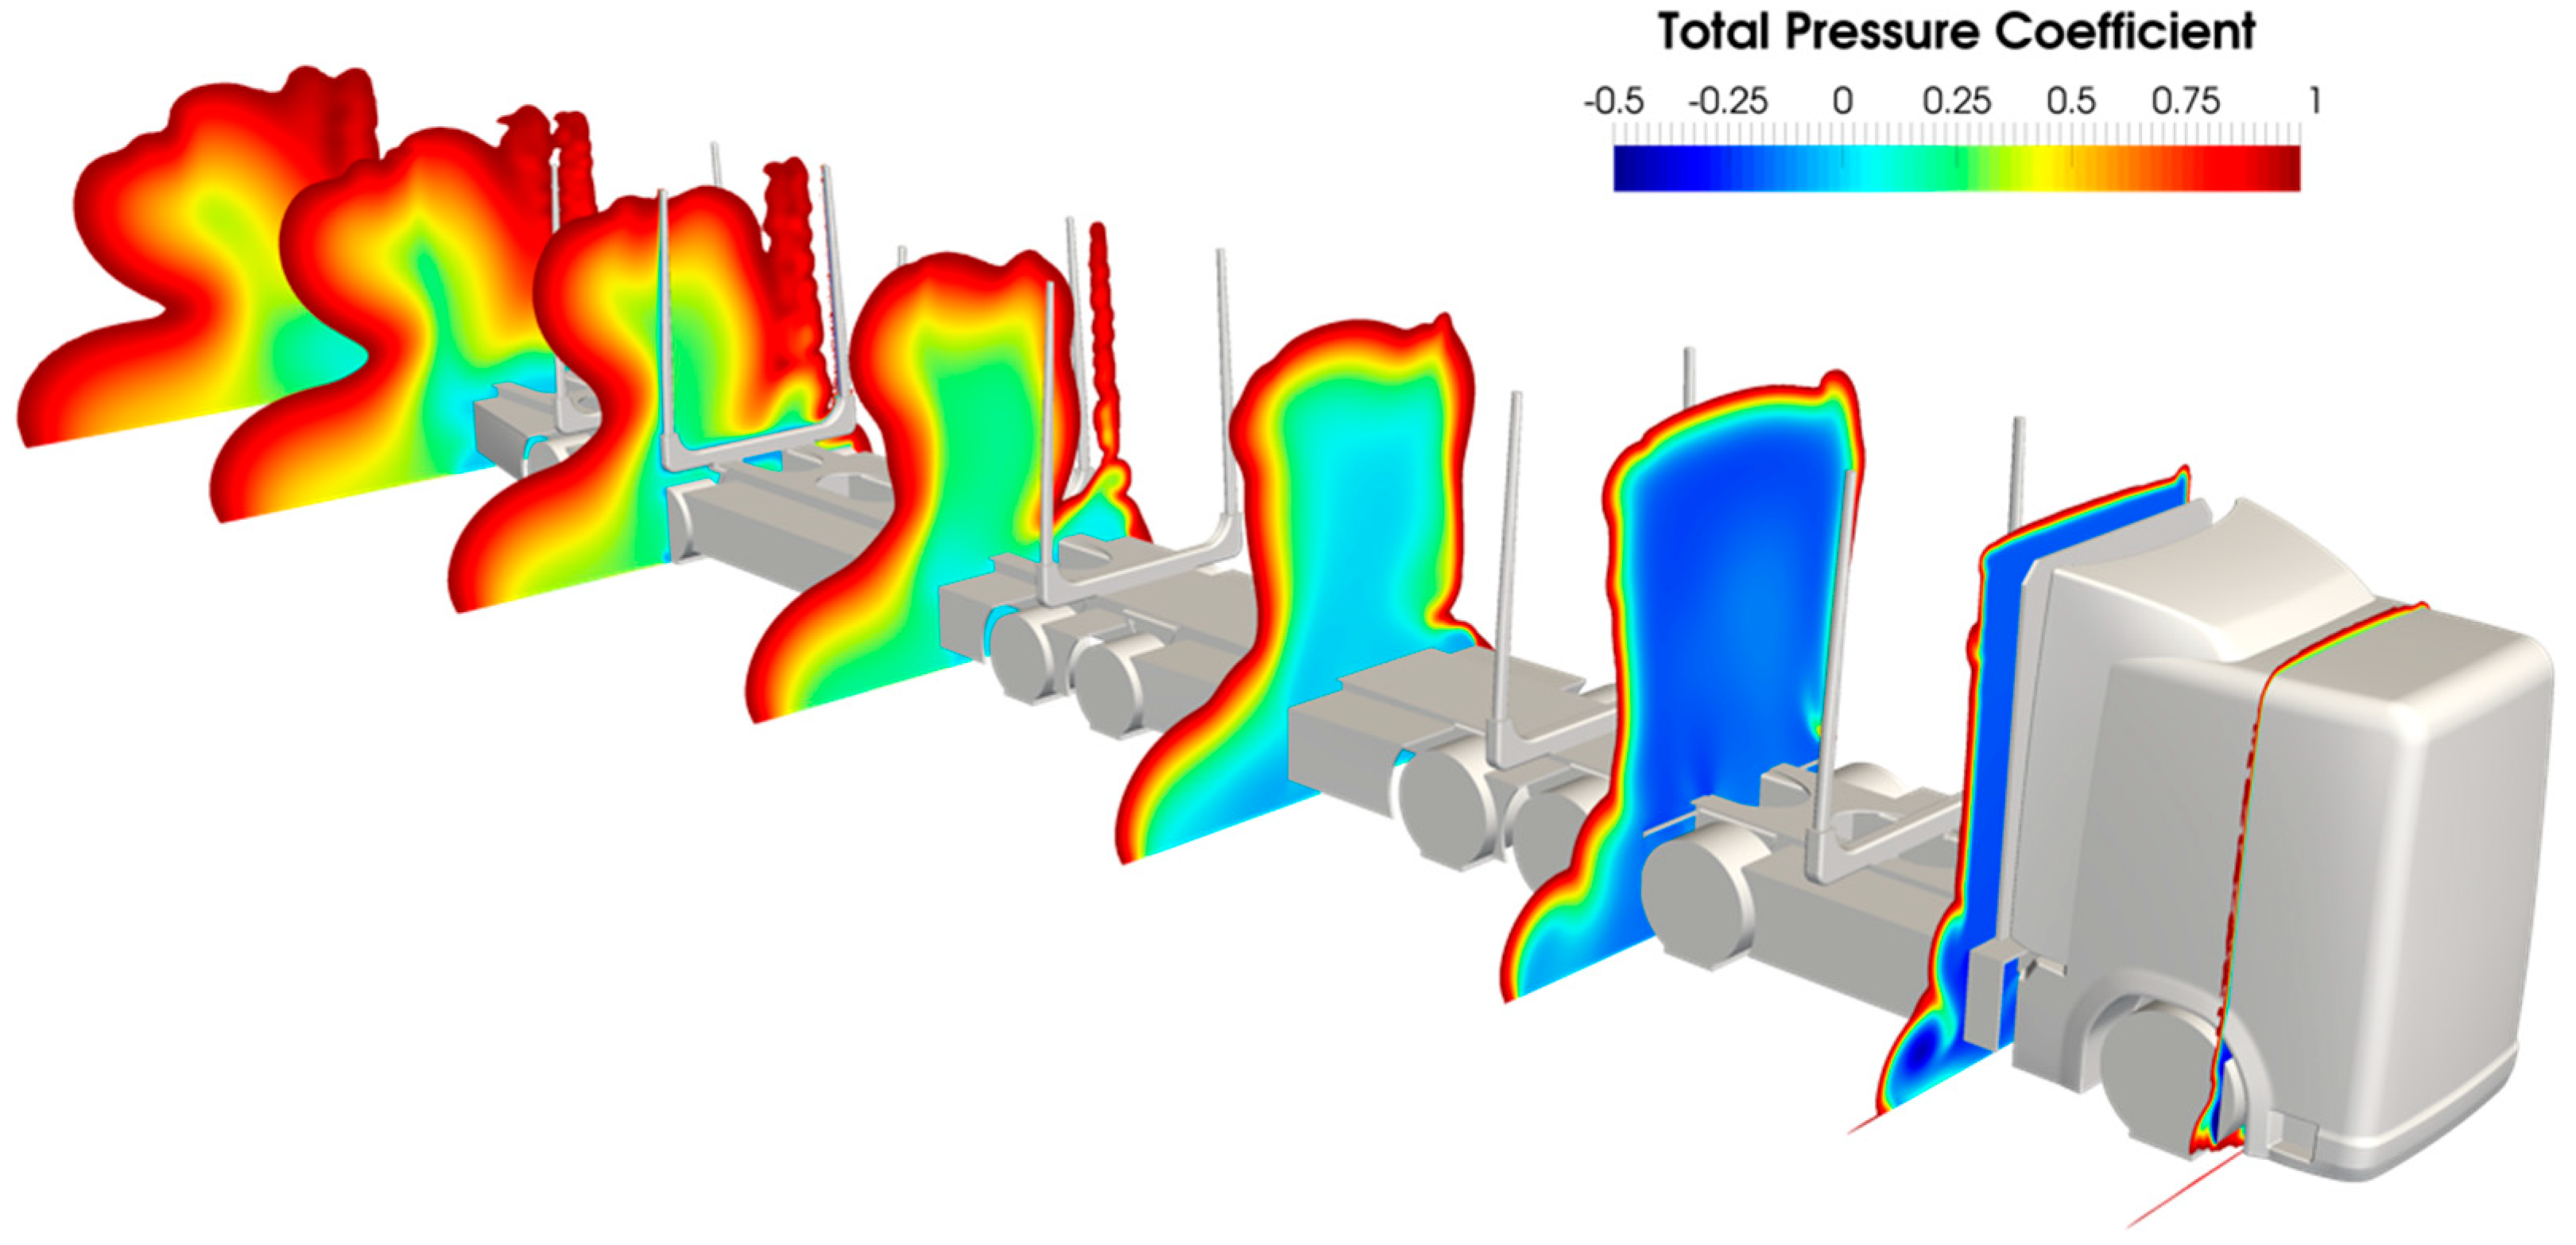
Total pressure equal to zero represents the large pressure drop, hence energy loss in the flow. The larger region, the larger energy loss for the flow and thereby more drag created. Figure 2, Figure 3 and Figure 4 presents examples of the aerodynamic simulations where reduction in purple area (=total pressure equal to zero) is clearly seen.
Green logistics research includes, among other areas, reducing freight transport externalities [13]. While this area comprises measures for reducing noise, as well as unwelcome environmental effects, this study relates mainly to the latter.
In general, road carriers, as well as other logistics service providers (LSPs), have been quite slow and reactive in adopting various green initiatives [14]. Important drivers for adopting green initiatives among LSPs include top management engagement [15], customer demands, legislation and the engagement among employees [14]. Barriers to adopting green initiatives include lack of customer demands, lack of knowledge and insecure investments [16].
Technology in itself is not often a driver or barrier for road carriers wanting to go greener. Overall technological development has in many ways already reduced CO2-emissions from freight transport, while demands on fast and agile logistics contribute to accelerate them [17]. It is evident that technology can reduce CO2-emissions from freight [18], however the insecure pay-off times – partly due to short-term contracts with customers—in many cases hinder the implementation of technological solutions for greener freight transport [18]. While green logistics research among other areas address corporate environmental strategies [13], the strategic investment in greening technology is sparsely addressed in prior research.
2. Materials and Methods
In order to collect the data needed for this project, a number of different methods and tools have been used. The initial phase of the project consisted of gathering and the categorizing of the data needed to map the current fleet of timber trucks, including vehicle data and travel distances.
This combined data was used as input for the financial calculations performed to analyze the effects of these aerodynamic improvements. Environmental effects in term of reduced CO2-emissions will be considered as proportional to reductions in fuel consumptions and will be discussed along with the numerical analyses. In order to understand the strategic and logistics consequences of investments in aerodynamics technology, a set of semi-structured interviews were conducted with different timber carriers to obtain ideas and concerns about these possible aerodynamic improvements.
2.1. Mapping of the Fleet
The study includes all registered timber trucks in Sweden, hence no representative selection was needed. The size of the fleet, 1662 trucks, makes is a suitable fleet to investigate and work with registration data for every single truck.
The initial phase of the project was to categorize the entire fleet of timber trucks, including such data as engine size and where they were registered. This was done to be able to use the results from the economic calculation and try to match them with the results from the mapping and see where in the country the changes of the fuel consumption would have the largest effect.
The mapping consisted of the gathering of data from different databases (publicly available) and also the compiling of these data into a special purpose database. The vehicle data was received from Transportstyrelsen, a state department in Sweden responsible for the all traffic. It is at Transportstyrelsen a Swedish citizen register his/her vehicle and therefore the department is a valuable resource with information about all the vehicles in Sweden. All the data had been collected by Transportstyrelsen.
The data received (per 19 June 2017) consisted of more than 30 different parameters for each and every one of the 1662 timber trucks registered. This data represents a relevant subset of all the data that is handled by Transportstyrelsen. The data was disconnected from the individual vehicles, hence there is no possibility to trace specific data sets back to a specific vehicle. The parameters covered a variety of types of information about the timber trucks, for example from the year it was manufactured to the number of axis and length between them. All the parameters and the information of the trucks used in this report can be found in Table 2.
In the subsequent part the fleet was categorized according to distance travelled. Data was received from Skogsbrukets Datacentral (SDC) and Skogforsk of the distances transported from every one of the 21 counties in Sweden [19]. SDC is an economic association that connects the forestry industry in Sweden, with over 500 forest industry groups connected. SDC regularly publish reports about the forestry industry, timber transports included. Skogforsk is the Swedish research institute for the forestry industry. With the help of that data the length and weight of the transports were analysed. SDC collects data about where transport has taken place but not who or what vehicle did that transport. Data about average distance and total weigh transported was received for three categories, wood used as primarily biofuels, timber and pulpwood for each county. The data from each category were then summarized for each county and average distance and total weight was concluded.
The emissions were calculated using data received from SDC and an emission factor [20]. By using the length of the average transport in the county and multiplying it with the total weight transported in that county the transport work (tonnes-km) was calculated. By then multiplying the transport work with the emission factors, the emissions are calculated. It is important to note that this method was chosen since no more specific data about every single transport in a county was received. The method is then an estimate of the real-life situation, but it is a rough number and works as an indication.
2.2. Financial Calculations and Simulations
To be able to assess the economic result of the improved aerodynamics a Skogforsk program, TransAm, was used. The program is developed by Skogforsk and is an Excel-application for investment calculation of timber trucks [21]. The trucks can be modelled with a trailer and an on-board crane and the cost for each can be set by the user. The costs that can be set for the different versions of trucks are investment cost, salvage value, costs for service and reparation of trucks and wheels but also driver wages and taxes and interest on capital.
The transport cost is of importance when using TransAm and its price function is an important part of the financial calculation [22]. TransAm calculates the transport cost (Swedish kronor per tonnes (SEK/tonnes)) for three user set distances and the cost is calculated as a linear regression of the sum of the fixed and variable costs for the transport distances. The transport cost is calculated from a couple of variables: maximum speed, changeover time, break time between transports, fuel consumption and transport distance. These parameters together with the cost for the vehicle can then be changed for the sensitivity analyses and a new transport cost in SEK/tonnes is calculated compared to a user set base-line scenario [23]. In this report the investment cost, fuel consumption, gross weight and changeover time were investigated besides the change in fuel consumption by the aerodynamic improvements.
The base-line truck (BLT) for this project was a 64 tonnes gross weight timber truck with the standard machinery and 44.8 tonnes net load weight. The truck was fully equipped, which means that it has an on-board crane. The fuel consumption of the BLT was set to 0.58 L/km with a fuel price of 10 SEK/L and the changeover time was set to five minutes and the time for loading of was 40 min with an average speed of 80 km/h for the whole distance. It was also assumed that the BLT-truck drives fully loaded one way and empty on the way back.
To be able to categorize which trucks the improvement of aerodynamics would be useful for, different parameters were analysed to scope out the different requirements that the nature of the trucks and carriers had to have. The different cases are presented in Table 3. The parameters used in this study includes the (extra) weight and (extra) changeover time and the investment cost. The numbers used here are representative values ranging from a very light-weight and simple aero-shield to a fully re-designed truck-trailer outfit, including any combination thereof. The tests in Table 3 represents a comprehensive parameter sweep in order to capture the general behavior of responses due to single parameter variations and are based on a multitude of possible aerodynamically sound concepts generated in a previous pilot study [5].
Combination of the parameters in Table 3 were also investigated in to additional cases presented in the result section and in Table 4. These combinations are set up in order to stress-test possible aerodynamic concepts with real-world financial aspects.
These different parameters and cases were then, as mentioned, used to map what requirements a timber truck was to have to be profitable with the investment.
2.3. Interviews
A set of 4 interviews with road carriers were performed. The interviews were semi-structured and based on a thematic interview protocol with the themes around the business model for how road carrier contracts are designed. The interviews were conducted by phone. The results from the interviews are used in the analysis and discussion to enrich the analysis of the calculations by adding a company perspective.
3. Results
In this section the results of the project are presented. The results are presented according to the different phases in the project. First, general results about the mapping of the vehicle fleet are presented followed by a more extensive presentation of the economical results from TransAm.
3.1. The Mapping
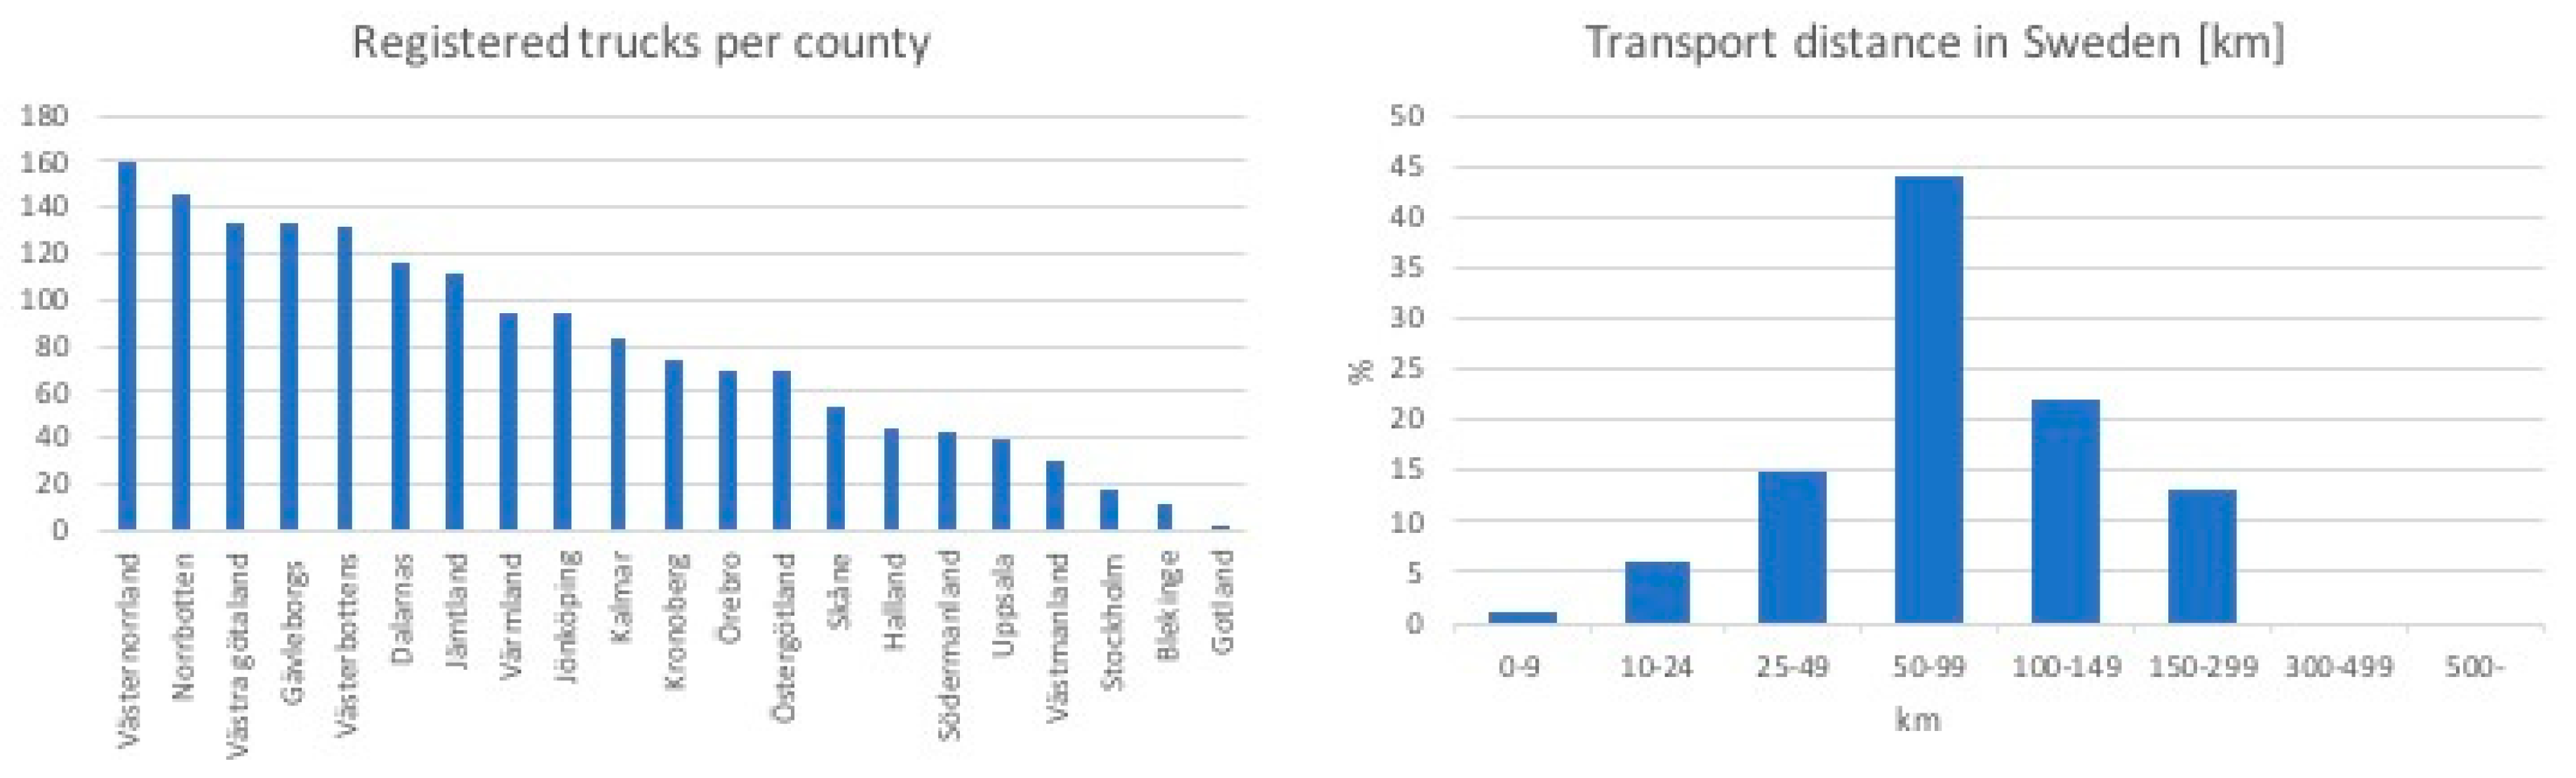
Today the fleet of timber trucks in Sweden consists of 1662 vehicles spread out across all the counties in the country. All the counties are represented and the most number of registered trucks can be found in Västernorrlands’ county, as seen in Figure 5.
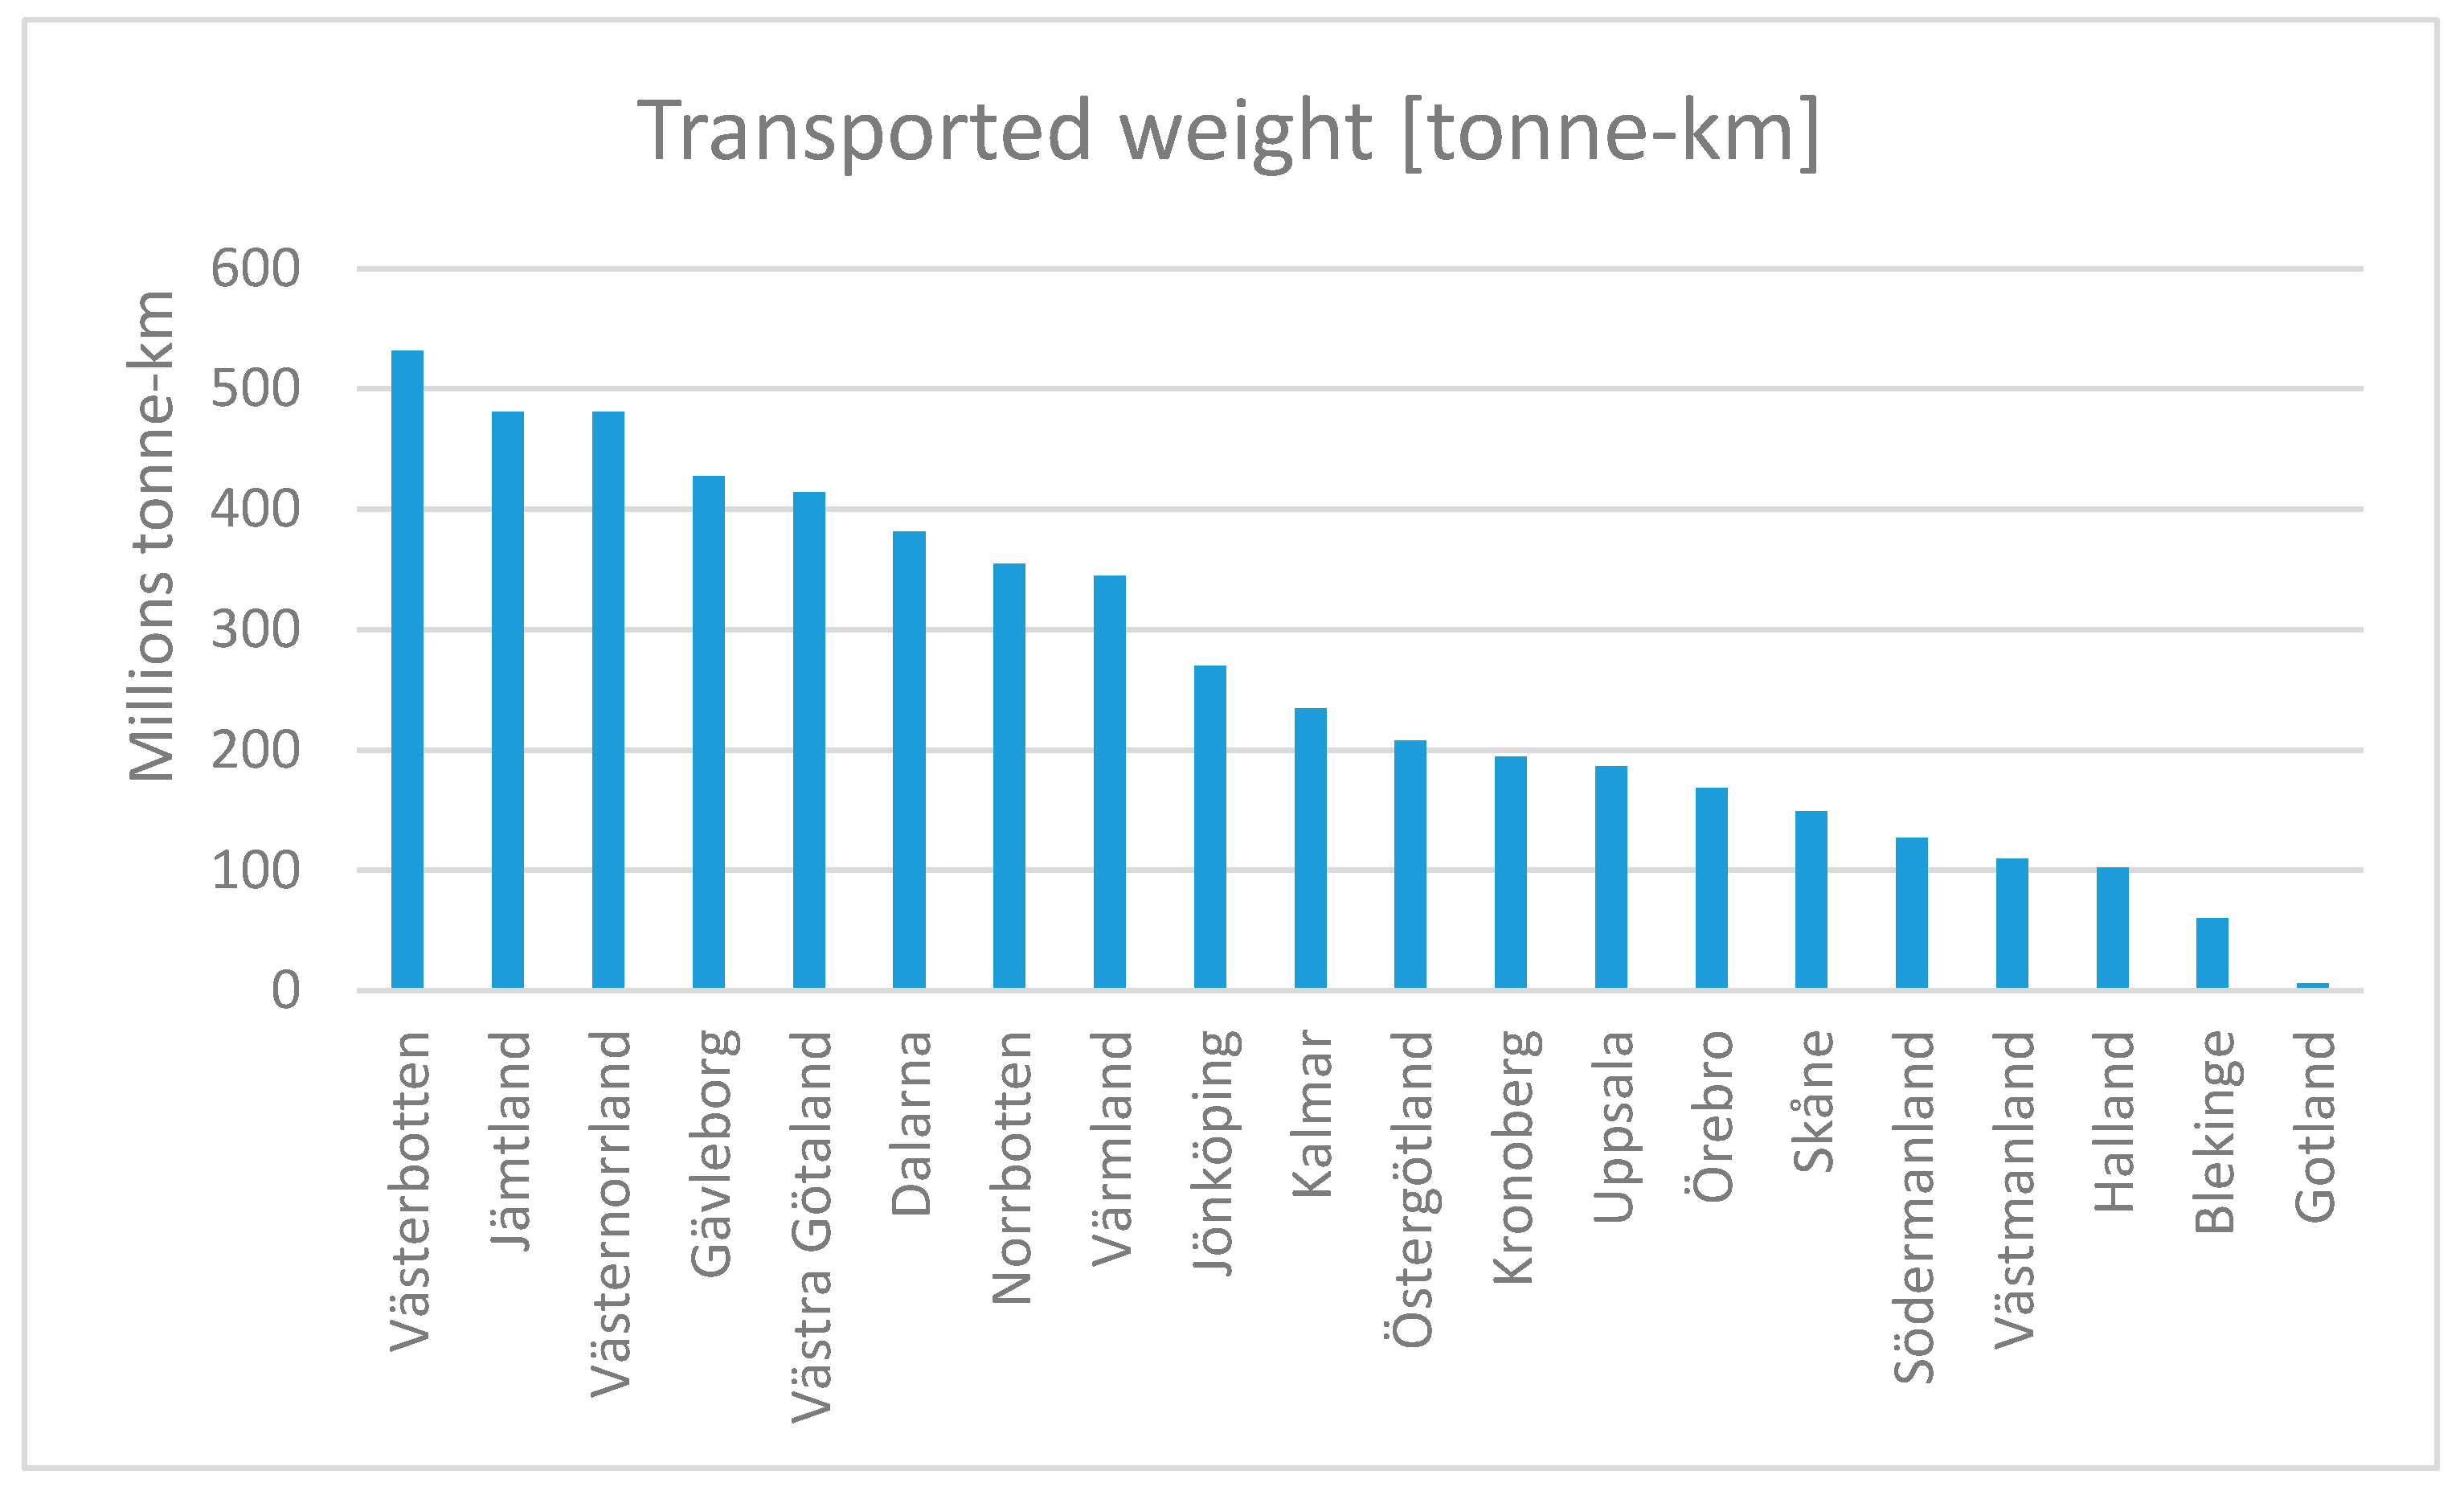
The distance of the timber transports is short, where the majority the transports are no longer than 100 km. A reason for this is that a big part of the timber is only transported within the county, due to the strategic placing of mills close to the resources [24]. The average distance for timber transport was 81.9 km [24] and almost 50% of all transports were between 40–99 km, but more than 75% are also longer then 50 km. Not so surprisingly there is a correlation between which county has transported the most weight and the counties with the most registered trucks, presented in Figure 5. There is no overcapacity, and the counties with the most trucks are also among the top counties with the most weight. The county with the most shipped weight according to transport work was Västernorrland. The smallest amount on shipped weight took place in Gotland, the county with also the smallest amount of registered trucks, presented in Figure 6.
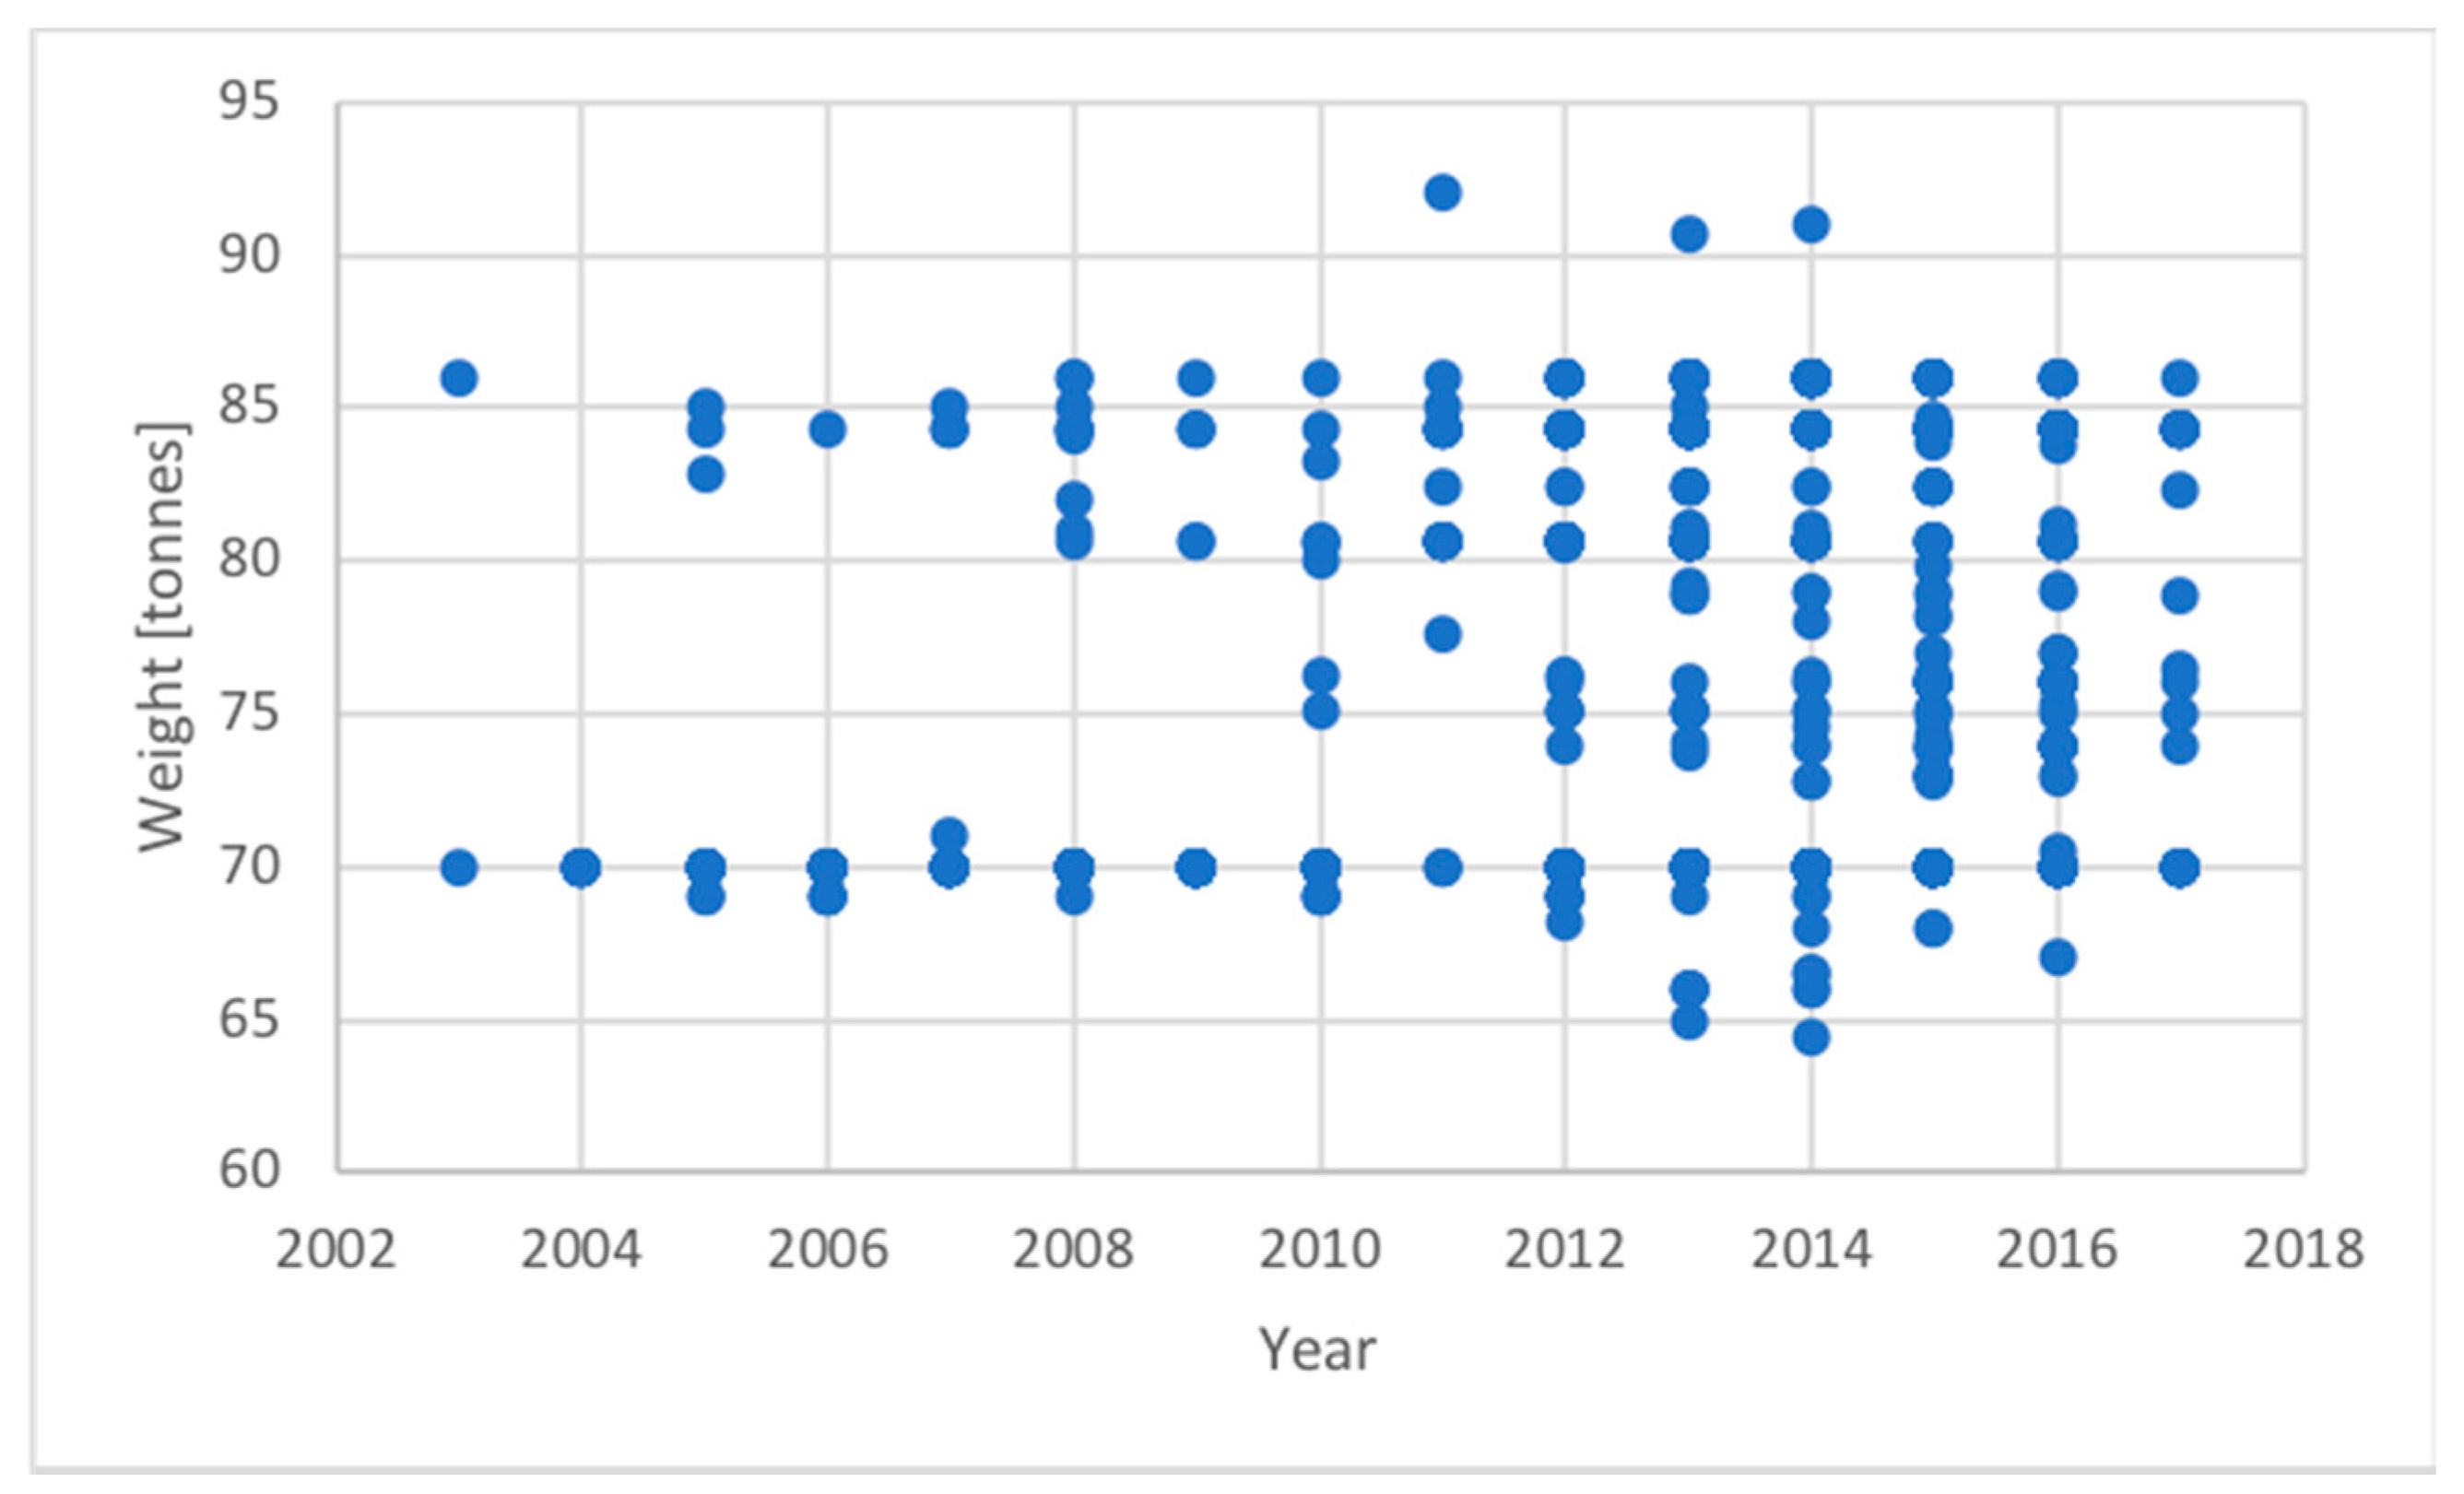
For the registered timber trucks, a number of trends can be seen. An unsurprising trend is that trucks and the freight trains are getting heavier the newer the truck is. This is presented in Figure 7. In the figure it can be seen that the biggest percentage of the freight trains weigh in average about 70–90 tonnes. It can also be seen that the development the latest years show that the freight trains are getting heavier. The trucks that have been left out of the figure were older models and lighter trucks, resulting in 1614 samples. The weight of the freight trains in this figure is the max weight combined with the trailer weight for each truck.
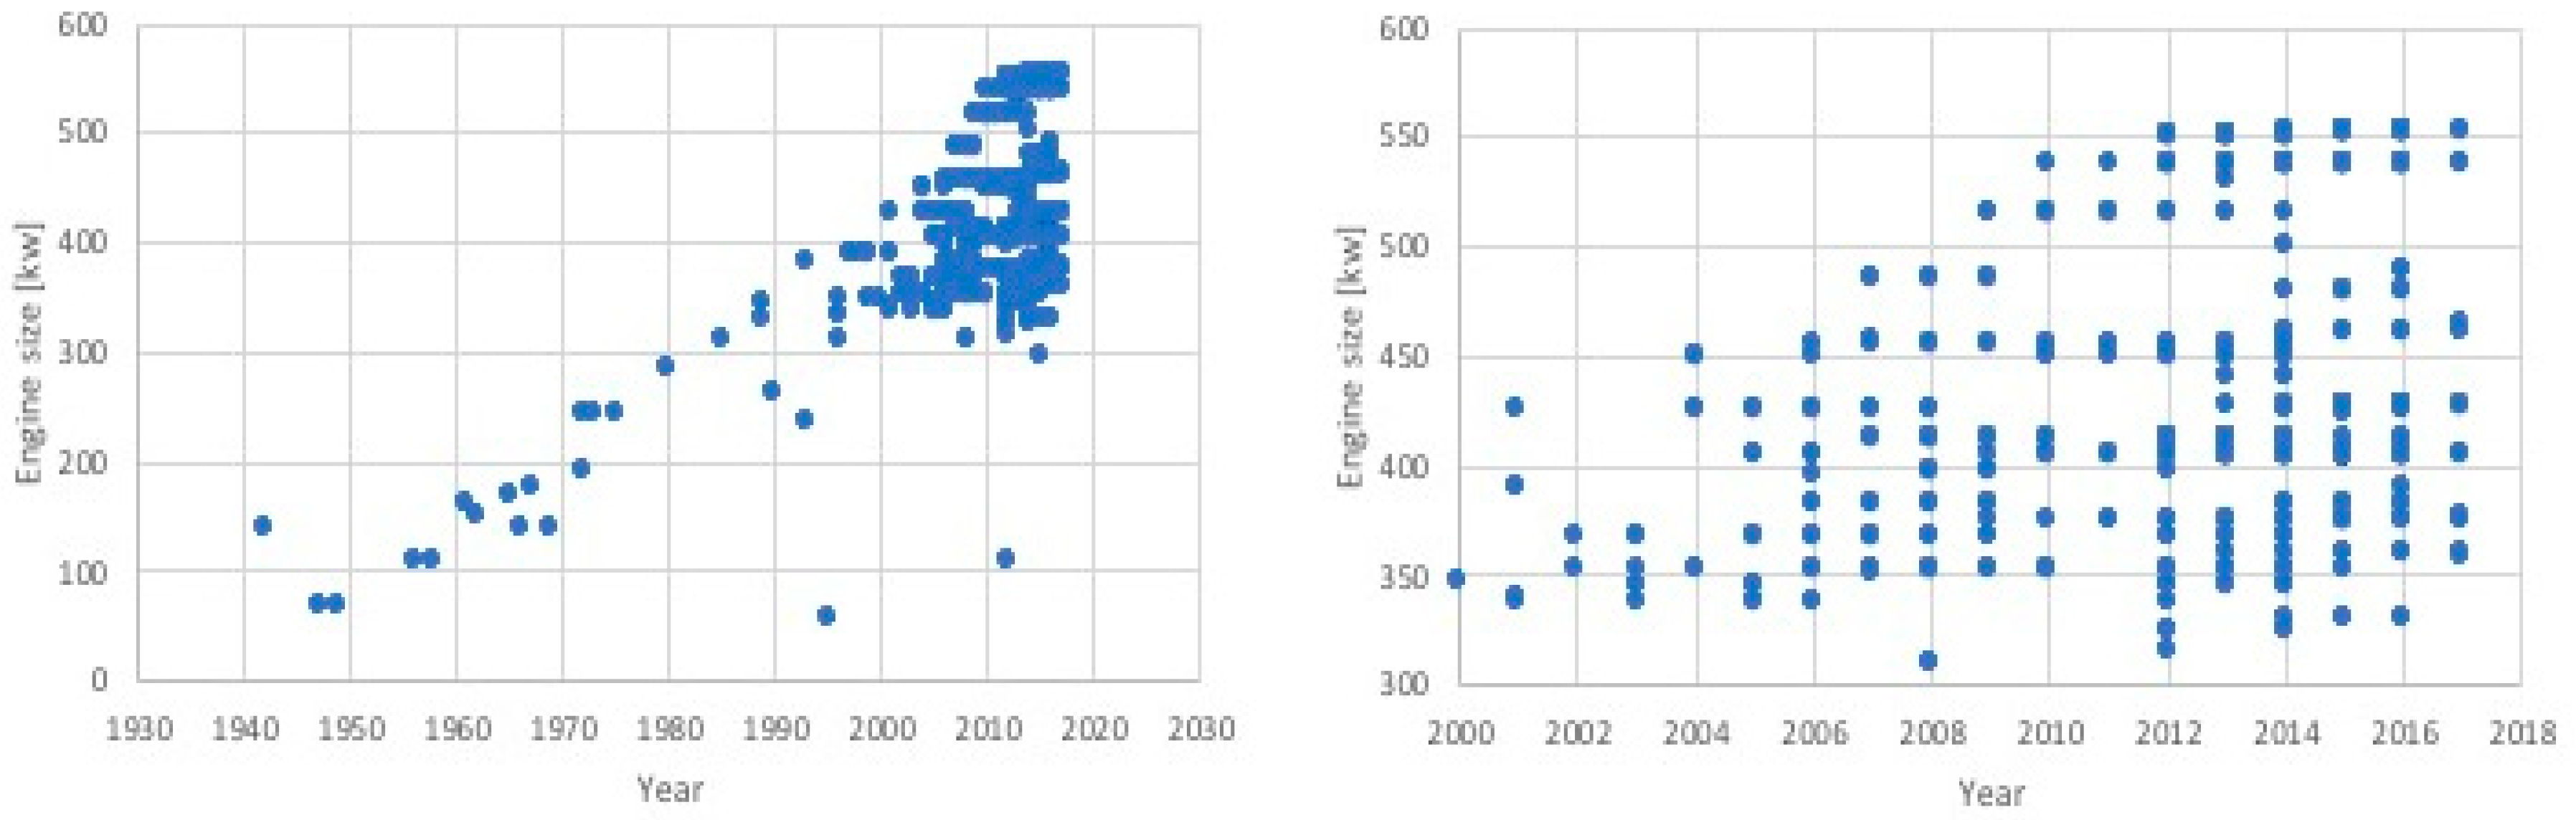
In correspondence to the bigger trucks the engines have also gotten larger during the years, which is presented in Figure 8.
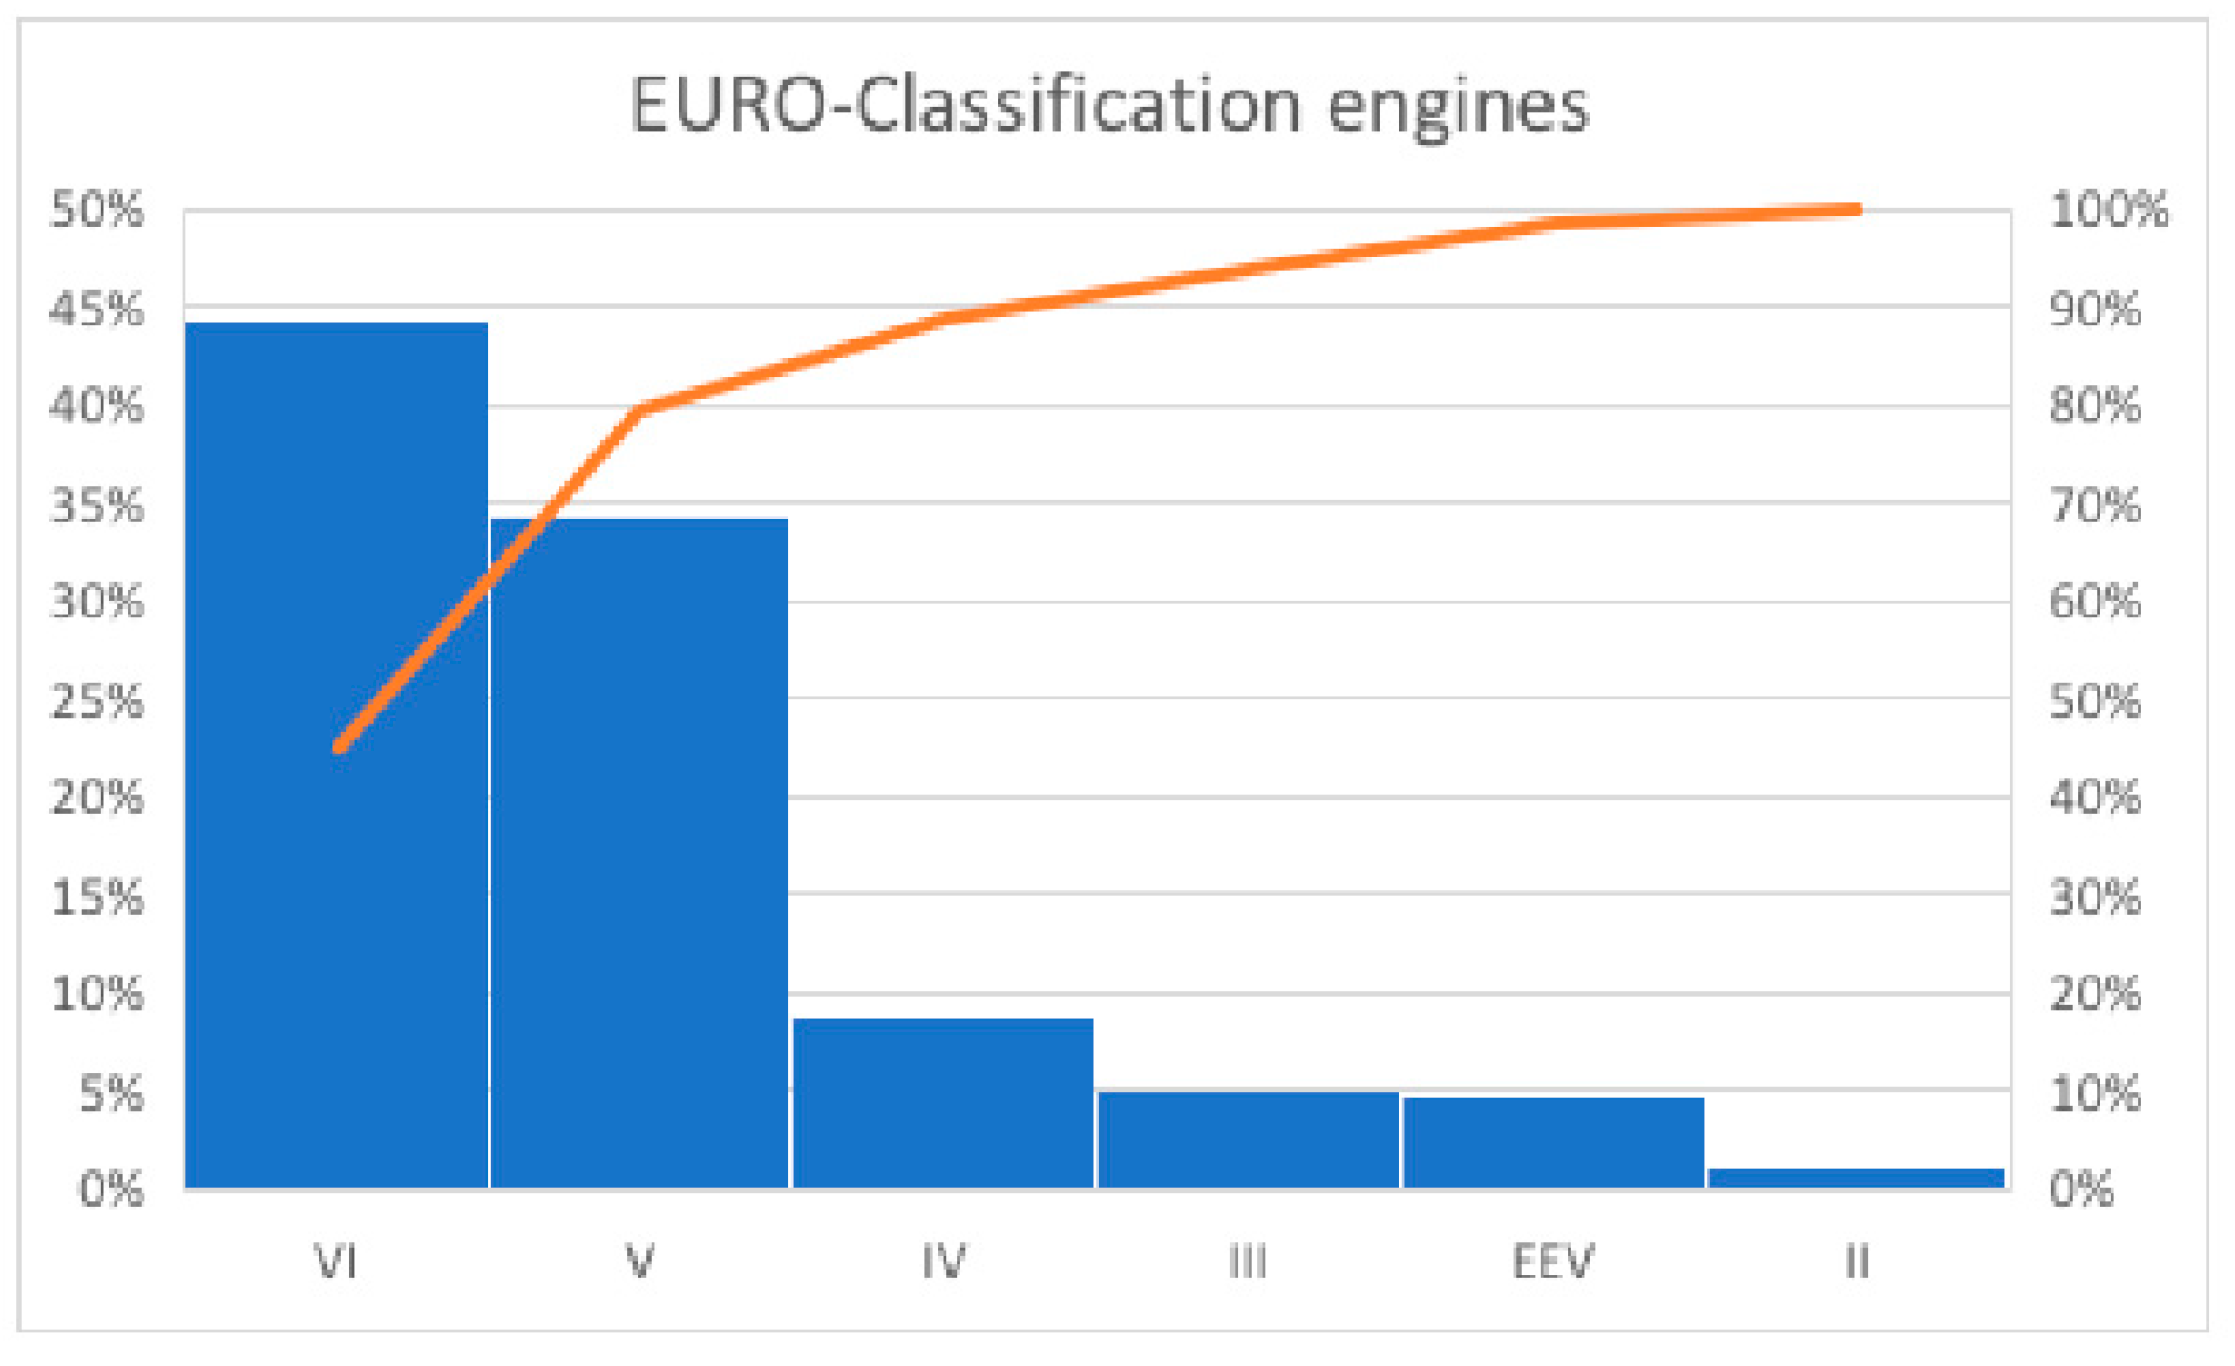
The engines of the fleets are also up to date which can be seen in Figure 9 where the EURO-classes are presented.
80% of the trucks have the latest models of engines, of which the majority (almost 45% of all trucks) are equipped with EURO-VI-engines. Even though the engines have developed, and the fleet now mostly consists of newer engines, the fuel consumption of the trucks has not been improved, as presented earlier.
3.2. Financial Calculations and Simulations
In this section the economic results according to TransAm are presented. The results of the aerodynamic changes are presented in how they would affect the total cost of the transport in Swedish kronor per tonnes (SEK/tonnes).
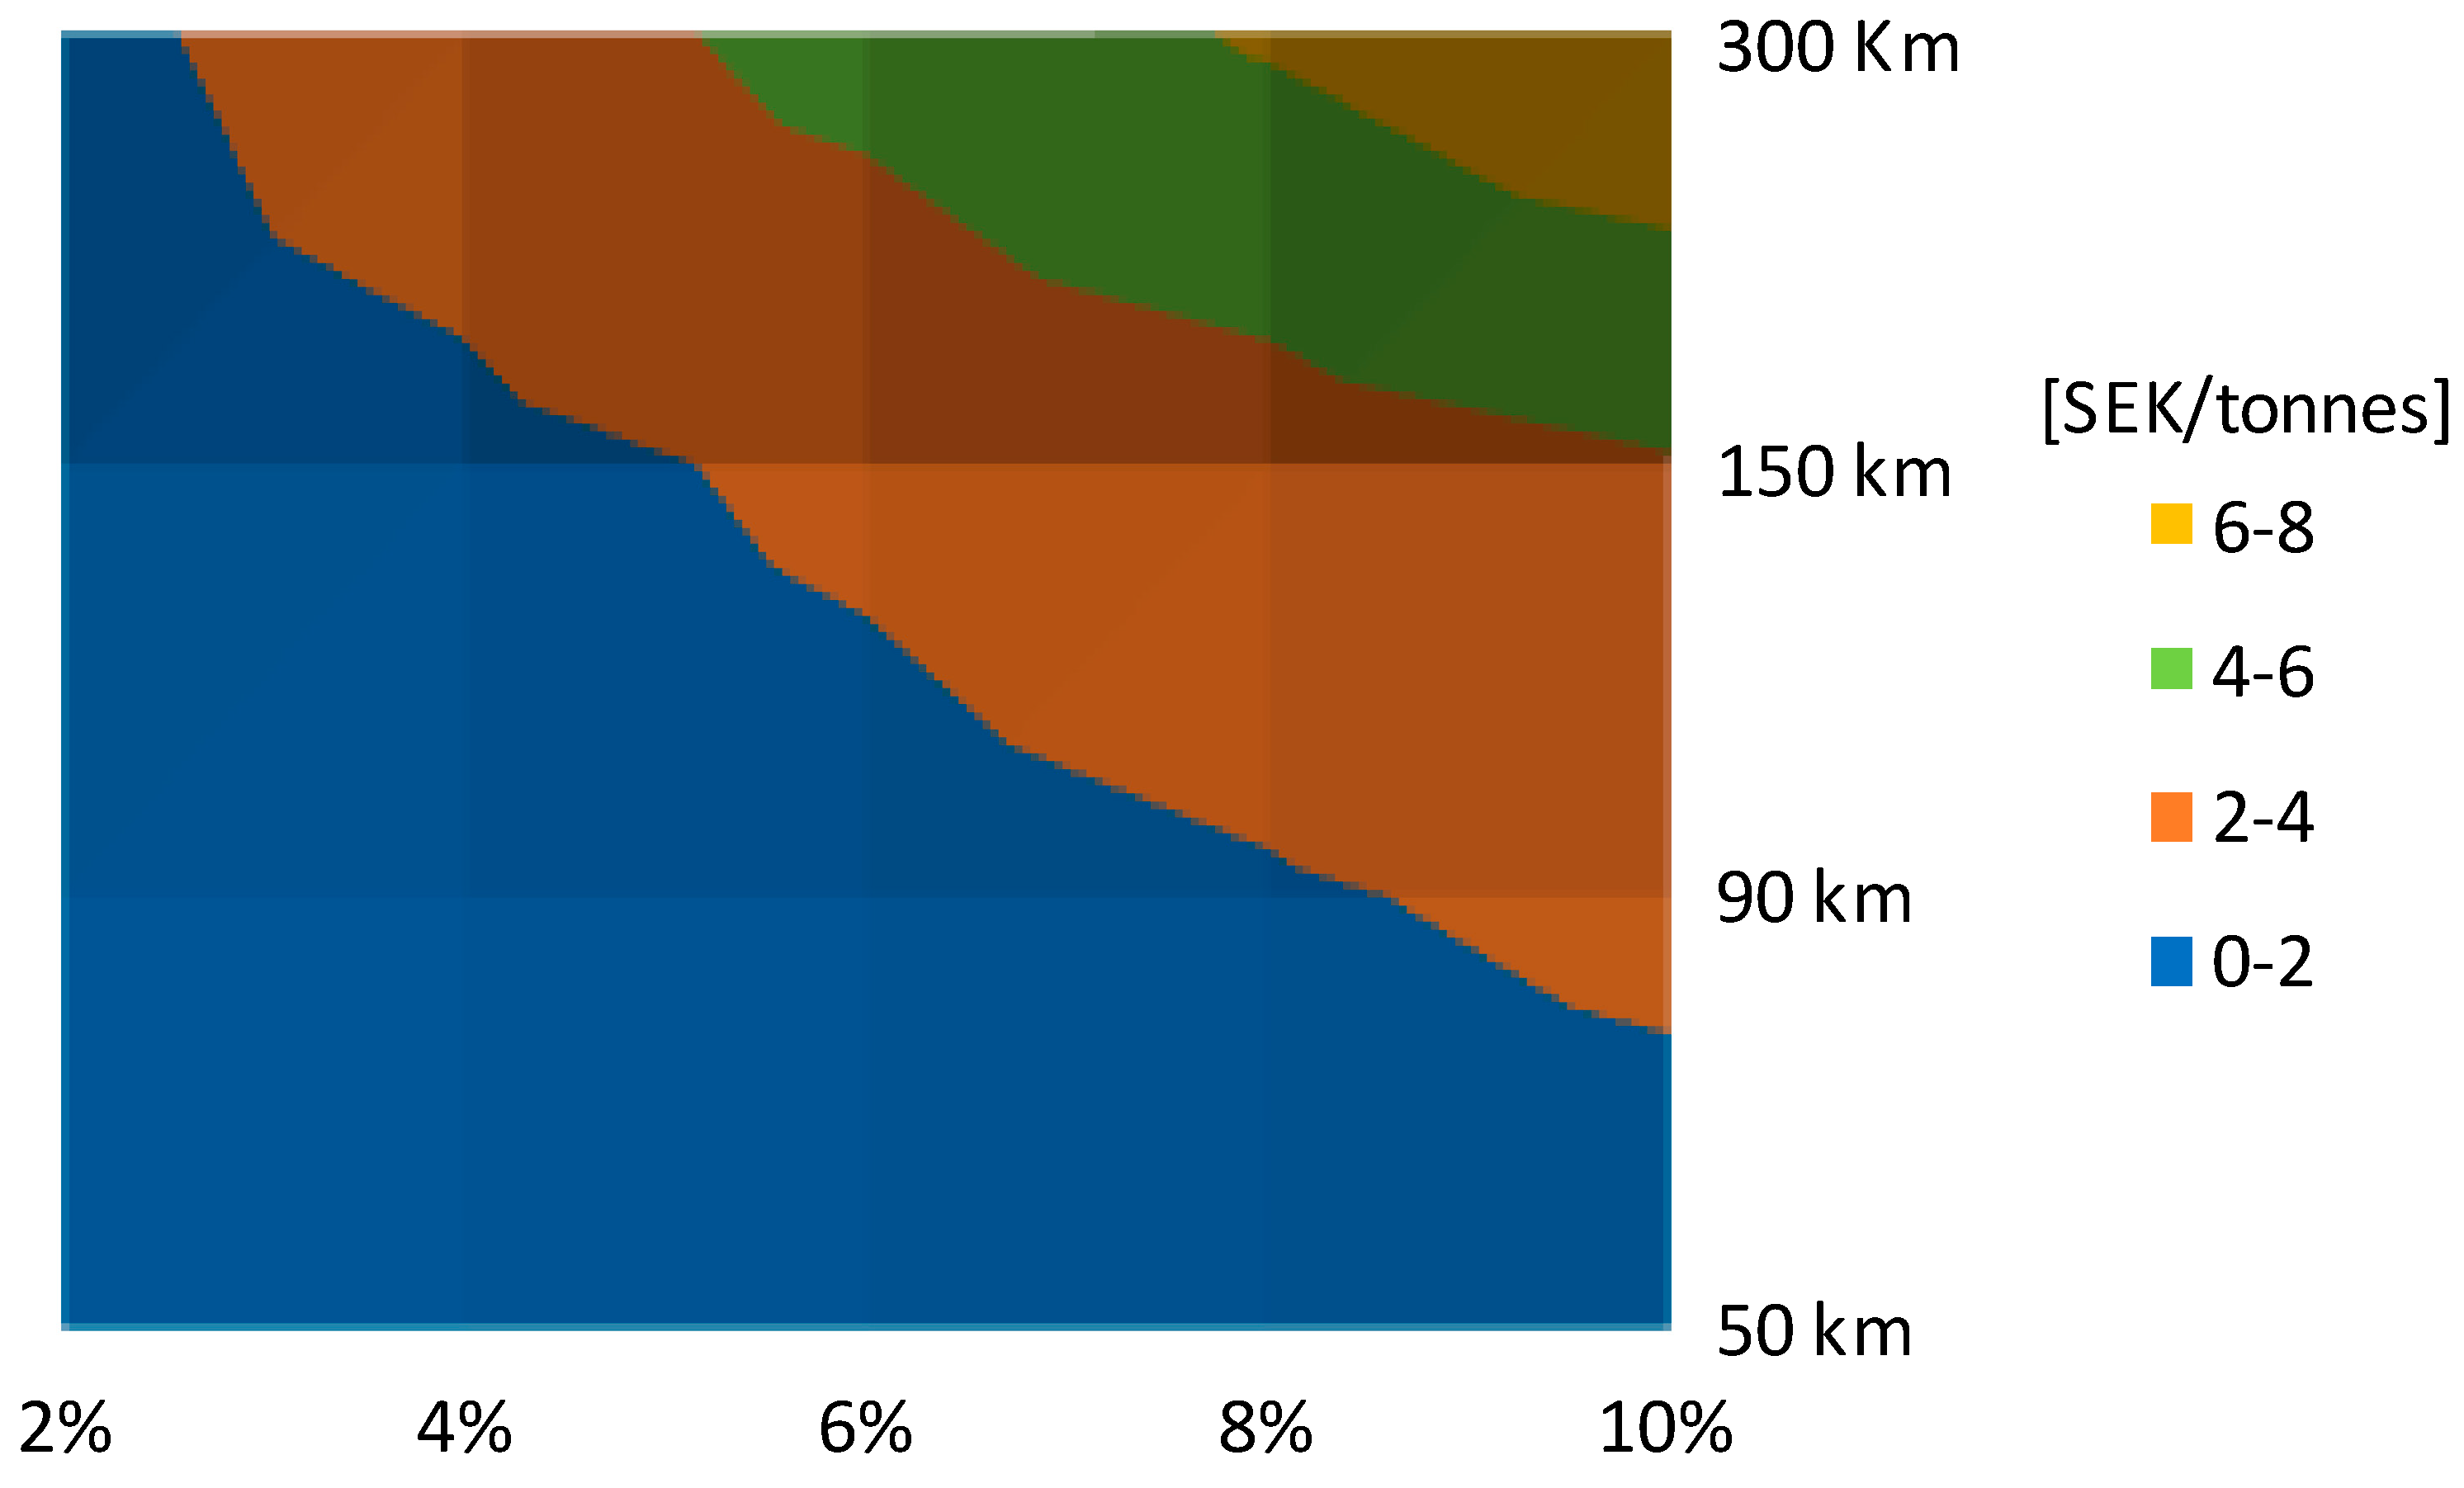
The reduction in fuel consumption that was investigated was from 2–10% with 2% intervals, and the results are presented in Figure 10.
The biggest reduction in cost happens when the fuel consumption is the most improved, 10%. It can also be seen that even an improvement of 2% generates a decrease in the total cost of the transport. The decrease of the total cost is a linear function and it increases with the distance of the transport, which can be seen by the biggest reductions taking place in transports with a distance 300 km.
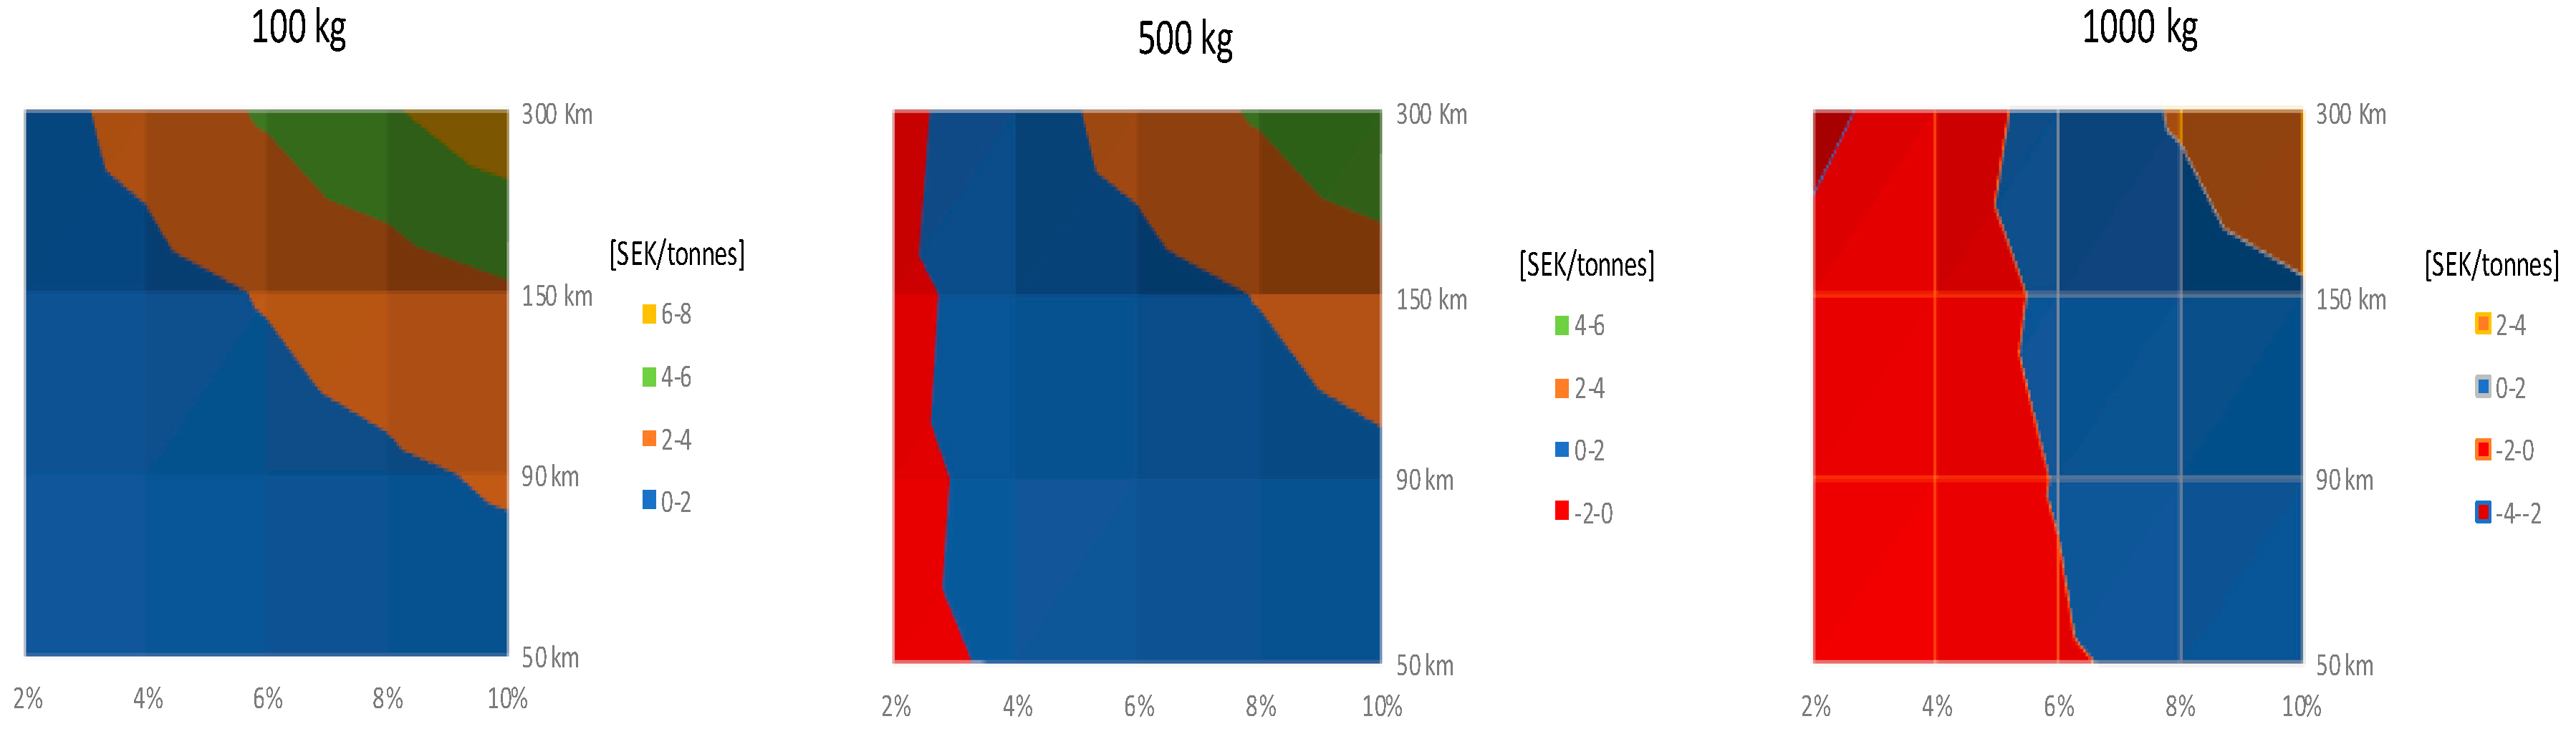
The result presented in Figure 10 is only depending on the reduction in fuel consumption for the timber trucks, but the aerodynamic kits will also affect other parameters of the trucks. In Figure 11 the results regarding the weight of the aerodynamic kit is presented. The weight will affect how much the timber trucks can haul and also therefore how profitable they will be able to be.
For weights less than or equal to 100 kg the investment will be profitable at all distances and with all tested reductions in fuel consumption, therefore the figure for that is not presented.
When the weight of the installment increases, to 1000 kg in Figure 11 (right), the results show that a fuel reduction of around 6% will lead to a decrease in transport cost for all distances. A lower reduction than 5% will lead to an increase in transport cost. Naturally, the results also show that the longer the distance, the larger the decrease in transport cost. The decrease in transport cost is also lower when the weight of the instalment is higher, which can be seen by comparing the two.
In Figure 11, an unprofitable economical result is presented. The transport cost will increase for the carriers, but the overall positive effect the fuel reduction has on the environment is not assessed in this analysis. The greenhouse gas emissions will decrease with the fuel reduction, leading to a decrease in external costs and even though the transport costs increase this decrease in external cost can justify the investment.
The unanimous response from the interviews was that the changeover time would be the most important factor according to profitability. Therefore, an increase in changeover time was analyzed through TransAm and the results are presented in Figure 12.
As can be seen, the changeover time has a big impact on the transport cost. An increase in changeover time can be explained by, for example, extra time to set up the aerodynamic kits. An increased changeover time of just 5 min will lead to increased transport cost, even with a fuel reduction of 8% for distances of 50 km. An even longer time means that the fuel reduction needs to be bigger or the transport distance longer for the investment to be profitable. The results show that an increase in changeover time of 15 min will lead to the investment being unprofitable for distances below 90 km, even with a fuel reduction of 10%. For distances of 300 km the fuel reduction needs to be at least 4% for the investment to be profitable.
The investment cost of the aerodynamics kits will also affect the transport cost. How much of the impact it has is presented in Figure 13 (left). Only the highest investment cost investigated, 100,000 SEK, did only result in increased transport cost at the minimal distance and minimal reduction in fuel consumption. Therefore, the lower investment costs are not presented since they in all cases lead to a decreased transport cost.
To be able to see how these parameters would impact the result in combination with each other additional cases were also investigated. The first case (Case 1 in Table 4) investigated was the highest investment cost, the highest weight, but no extra changeover time; the results are presented in Figure 13 (right).
The results show the investment cost does not impact the transport cost in a major way. Even the biggest investigated investment cost of 100,000 SEK will still lead to a cost reduction at a decreased fuel consumption of 2% and at the shortest distance, presented in Figure 13 (left). Though in Figure 13 (middle) the impact of weight of installment is shown. The weight impacts the result and it can be seen for the investment to be profitable for all distances a fuel reduction of around 9% is necessary.
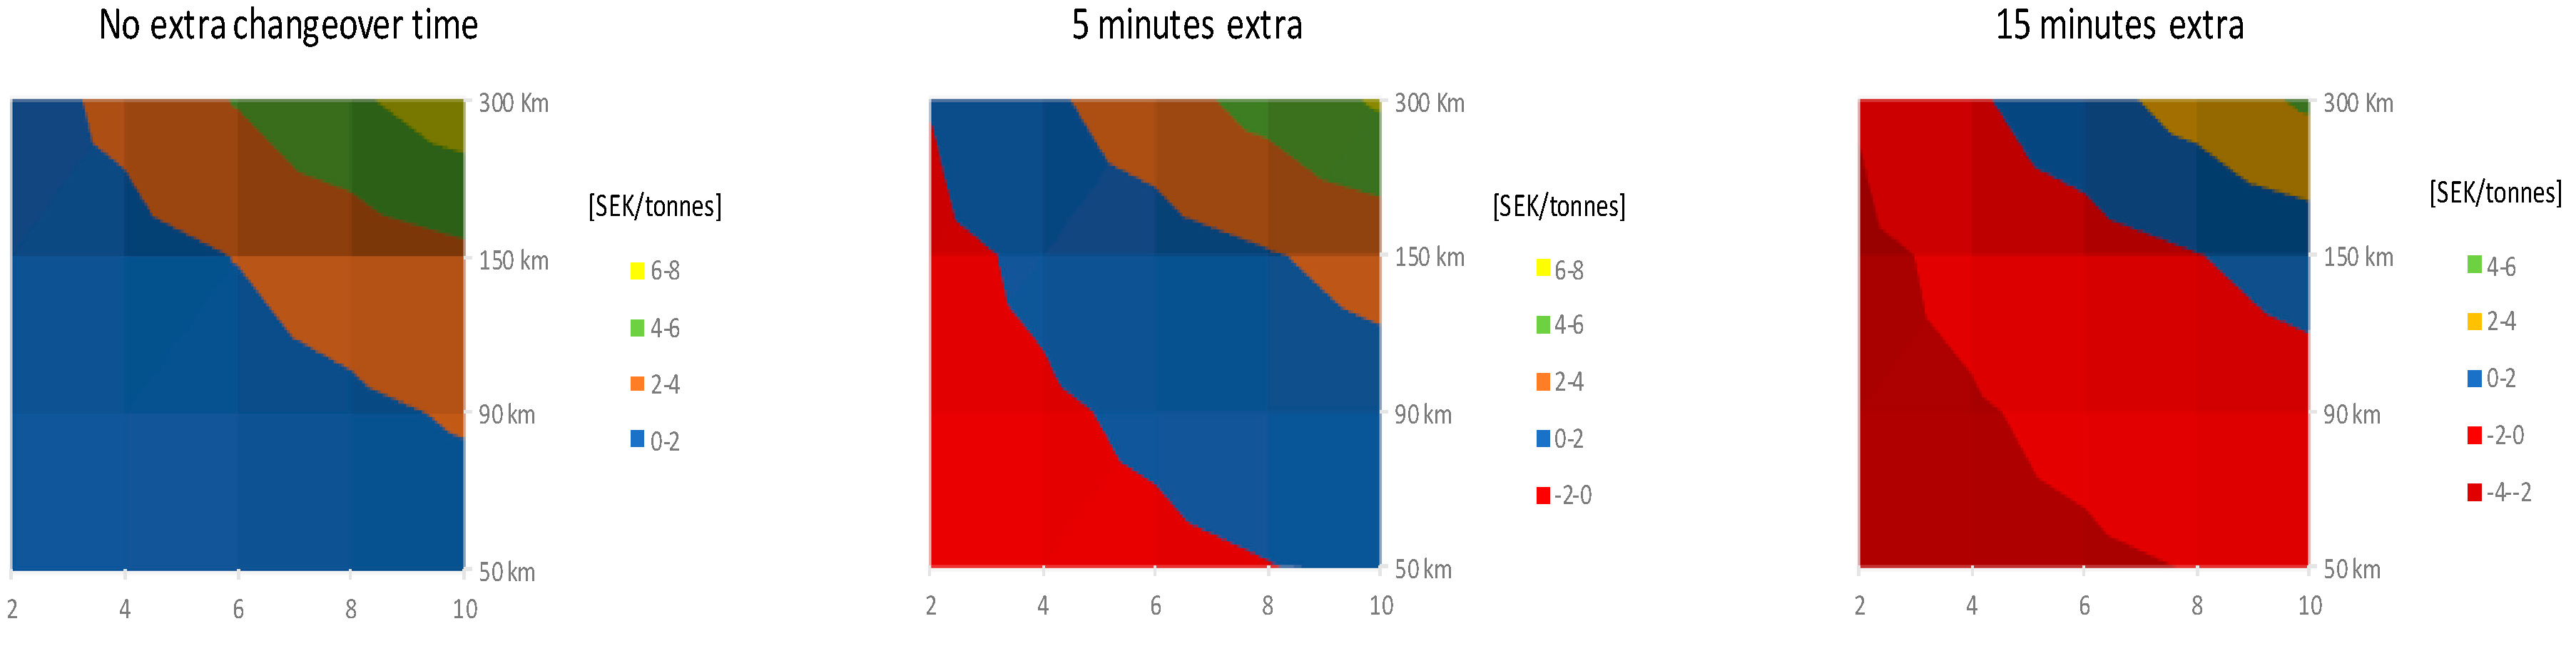
To be able to determine the importance of changeover time, a case was analyzed with or without extra changeover time to see how the results would be affected (Case 2 in Table 4). The extra changeover time was analyzed with the lowest investment cost and weight of the installment, the results can be seen in Figure 14.
The results show that the changeover time impacts the result. As can be seen in Figure 14 (middle), for the lowest distance the reduction in fuel consumption needs to be around 8% for the investment not to lead to an increase in cost. If it is lower than 8%, the aerodynamic improvements will not be sufficient enough to make up for the lost time that is needed while mounting the aerodynamic kits. For the longest distance, 300 km, the aerodynamics improvements will lead to a decrease in transport cost from the beginning, but it is approximately 2 SEK/tonnes lower than without the extra changeover time.
With the same settings, how a 15min longer changeover time would affect the cost reduction was also investigated. With an extra 15 min changeover time for assembly the investment will not be profitable for distances shorter than 90 km. For distances of 150 km the fuel reduction has to be greater than 7% and for distances of 300 km and longer the fuel reduction must to a minimum be 4%, otherwise will it lead to an increase in cost. The results highlight the importance of the changeover time.
The worst possible case was also investigated. The meaning of worst possible case is the highest investment cost, highest weight and the longest extra changeover time. The results show that even with a 10% fuel reduction the investment will lead to increased cost for all investigated distances. The investment will then not be strictly economical profitable.
To be able to understand what sort of effect this would have on the entire fleet and not to a single carrier, a hypothetical case was analyzed. The county with the most transported weigh was Västerbotten, as seen in Figure 5. If a fuel consumption of 0.030 L/tonneskm is assumed and all cases of tested fuel reductions is tested this will lead to a decrease in total fuel consumption presented in Table 5.
As can be seen, over a million litres of fuel can be saved only in the County of Västerbotten with aerodynamic improvements which will lead to decreased emissions as well.
4. Discussion & Analyses
As presented in the results section, it is possible, through investments in aerodynamics, for road carriers to lower their transportations costs by reducing their fuel consumption. The investment will in many cases lower their operating transportation cost and it then becomes a question whether the pay-off time of the investment becomes short enough for the road carrier’s willingness to invest in them. This is something this study has not taken in consideration, but that needs to be considered in a real-life investment situation.
The incentives for making a green investment depend on many factors, and the economic factor can be a barrier towards investing. There are ways to lower this barrier and share the risk of the investment. Today a timber truck usually consists of a truck purchased from one company, a trailer purchased from another company, and the trailer usually has stakes from a third company. Many actors are involved in a complete truck and this provides an opportunity for split the risk between the actors. In the extended supply chain—there are five primary parameters included in a contract between a road carrier and its customer where the risk can be shared by the seller and the buyer according to according to Eng-Larsson (2017), which are presented in Table 6 [25].
The contracts between the timber carriers and their customers are today are mostly based on how much timber is transported and how long the transport is. The pricing of the transport is based on the volume that is delivered and a tariff is used for prices according to distance. From a risk viewpoint this puts more risk on the road carriers for the parameters price structure, volume commitment and performance-based payment which makes it more unlikely they would make green investments. To reduce the risks for the road carriers, the pricing should avoid being based on achievement and instead set a number of transports and volume that is supposed to be transported.
The contracts are longer than the individual rides and usually last for a couple of years which is good from a risk viewpoint: this lowers the risk for the road carrier. Compared to the general transport market situation [18], the timber transport market hence stands out as stable, with longstanding contracts that support investments. For price indexing, lesser risk is also put on the road carrier. The price that usually varies is the fuel price, and for that an index is used which changes every month according to the fuel price, hence the road carrier is reimbursed at a reasonable level. The prices the road carriers use will in this way reflect the actual price that the road carriers pay for the fuel which reduces their risk.
The road carriers running a timber truck business are mostly very small companies, typically one to a few trucks and a few drivers. Such companies in general fear investments to a higher degree than larger firms who can better spread the risk of an investment. However, this study clarifies that the road carriers don’t hesitate to invest in the latest engine technology, which was surprising for the researchers. This investment can be interpreted as a positive attitude towards new technology, which would be an important driver for implementing aerodynamic technology, and a novel driver compared to previous studies [9,10,11]. However, as mentioned, the contracts between the road carrier and the forest owner needs to be more designed towards decreasing the risk for the road carrier in line with what has been mentioned above. This is in line with prior research results regarding general LSPs [13,18].
The results show that changeover time is the parameter that impacts the result the most. One reason for this is the already tight time schedule the carriers are working on. The investment cost and weight will affect the result, but not with such an amplitude as the changeover time. Even with the lowest investment cost and weight the smallest added changeover time lead to barely profitable results for distances lower then 90 km at a 10% fuel reduction. With 15 min extra changeover time, the investment would lead to an increase in transport cost for all transports shorter then 90 km and a small decrease in cost for distances close to 150 km. This shows the importance of the changeover time and that producing an aerodynamic kit that does not have to be manually put on is important for the profitability of the investment. The importance of the changeover time was also something that the road carriers mentioned in the interviews, where all interviewees stated the changeover time to be the most important and critical parameter. The timber trucks already today operate on a tight time schedule and even more changeover time would make the business less profitable.
By combining the results of the mapping and the economical result from TransAm it is also possible to decide where in Sweden the investment would be most profitable. Only some investments investigated are profitable at short distances and these types of investments would be the only one possible for, for example, Gotland, with the shortest average transport distance. By combining the results, investments can also be ruled out, for example, an investment that needs distances longer then 90 km can almost be ruled out for all counties since the longest average transport distance is 100 km. This creates an investment window where it is possible to see where and if an investment would be profitable for a certain county and transport distance.
As discussed earlier, some results that are economically unprofitable from a company perspective will still be profitable results from a societal perspective because of the improved environmental effects and the decrease in external cost the fuel reduction will lead to. The value of environmental parameters is far beyond comparing them with only company level economical results and they cannot be seen in the presented financial calculations. The timber fleet today, as presented, is already influenced by early adopters who take responsibility for a green fleet which can be seen by the majority of Euro VI-engines, far greater than the share of Euro VI-engines in the complete heavy truck fleet, which was only 27% (in relation to 45% for timber trucks in this study) [26]. The decreased external cost and positive impacts of the environment from the unprofitable economic results and investments will be of more importance for the progressive fleet and the environmental results will overshadow the unprofitable economic results. But, as presented, aerodynamic investments can also lead to decreased transport cost, meaning that the carriers will both make a profitable economic investment but also a profitable environmental investment.
Both on a company and a societal level, a sustainability assessment can be valid. While economic sustainability is important for the road carriers, they can also benefit from standing out as environmentally prominent [14,16]. In addition, by reducing the cost from lower fuel consumption, the economic sustainability for the companies will improve and therefore also the sustainability for the employees and drivers. By also taking in consideration that the installments can’t be too heavy and can’t be manually mounted every time leading to increased changeover time, which the results presented show, the work situation for the drivers will be less demanding and more sustainable. It is equally important to reflect on how the aerodynamic installments will affect the sustainable living of employees and companies, and not just the environment per se.
This article has shown that it is possible through reconfiguration and aerodynamic improvements to reduce the fuel consumption of timber trucks and make the fleet greener through technology. Fuel consumption can be reduced to such a level that is will be profitable for the road carriers to go through with the investments. It is possible to make aerodynamic kits within the parameters tested in this study, and as the mapping shows, it is also possible to find areas and transports in the countries which have the characteristics that are needed for a particular investment to reach profitability.
The author would like to stress that the same method can be used for larger data sets for even bigger vehicle fleets. The method of generating large data sets for vehicle fleets can be used for all kinds of operations.
5. Conclusions
This paper set out to investigate the opportunities when implementing aerodynamic equipment with timber trucks in Sweden.
The analysis has demonstrated a range of opportunities. In many cases there are possibilities to both lower the fuel consumption and reach reduced operating transport costs. The transport distances today are also of such a distance that are required for the improvements to be economically beneficial. In all, these examples show viable options for making timber truck operations more sustainable.
The analysis also revealed a range of challenges, mainly associated with the road carrier. The risk of the investment in aerodynamic equipment is an important barrier. However, this barrier can be lowered by the sharing of risks among the many actors involved in the operations, but also by prolonging the contract periods between the timber road carriers and their customers.
This study adds to prior research, as it takes a holistic perspective on the trade-offs between environmental and financial aspects regarding reconfiguration of trucks. While environmentally related benefits like reduced fuel consumption reduce the environmental impact and potentially lower the climate effects, reconfiguration also supports the business of road carriers. Where lower fuel consumption saves costs, it simultaneously also adds to strengthening the environmental profiles of the companies, thus securing long term profitability. Together with this, the studied reconfigurations also demonstrate the potential of improving the working conditions for the truck drivers in the short term, as well as in the longer time perspective.
The calculations made with TransAm provide a set of variables to consider in any road carrier’s business model in general, and in particular when environmental investments are considered. We believe that a similar investment calculation would be a viable way to improve long-term decision making among road carriers. For instance, similar calculations would be made based on long-term effects of investments in eco-driving by both educational efforts and a sustainable follow-up system [27].
With respect to the research design, in this study we were able to base our calculations on the total population of timber trucks in Sweden. That implies that the results reflect not a representation but the full population for the investigation. We believe that similar analyses can be performed on other types of vehicles as well. However, timber trucks are dedicated vehicles, whereas other types of trucks can serve multiple purposes and carry the combination of many different types of goods. Hence, a similar approach to a wider range of vehicles proposes many new challenges for analysis.
Timber trucks are very common in Sweden, where the forest industry is a major industry. Therefore, the results of this research, even those of incremental magnitude, have a considerable impact on the overall fuel consumption and related greenhouse gas emissions. Comparable countries, with the forest industry as a major industry, are, for example, Finland and Canada. It would be interesting to expand this research and to compare the different timber truck fleets’ performance and potential in different countries.
This paper focuses on technology measures and their consequences in terms of sustainability. Other avenues for future research includes, in general, to take a look into logistics and transport planning and its consequences. In the case of timber trucks, their alternative use is very restricted, so the opportunities to identify complementary cargo for the empty running is limited. Nevertheless, the results from this study applied to general trucks, and in combination with an analysis of logistics opportunities and consequences, would be a viable way to combine technology with logistics for greening freight transport.
Managerial implications from this research relate mainly to the road carriers with timber trucks, where the results offer advice for implementation of aerodynamic equipment and the financial consequences thereof. Some advice to the customers of the road carriers would be to offer contracts of longer time frames as this would lower the barriers for investments, which in turn would benefit both the road carriers and their customers, financially and environmentally, in the longer time perspective.
In terms of policy implications, this research demonstrates the potential effects of investments in aerodynamic equipment on timber trucks. Any policy measures that would ease the burden of an investment in such equipment would increase the speed of making timber trucks more sustainable.
One exciting implication of the present study is that if the timber truck manufacturer(s) would take these aerodynamic re-designs into account already when designing the next generation vehicles, the fuel reduction (and hence CO2 reduction) presented here would be essentially free of charge. Thus, a comprehensive combined understanding of the vehicle fleet, operating conditions, technological possibilities and financial barriers will lead the way to greener transport.
Author Contributions
E.J. collected the data on timber trucks, categorized the data, performed most of the analysis which entitled the selection of analysis set-up and led the writing process. P.E. provided the research background on aerodynamic design and computations and illustrations of related drag of timber trucks. M.H.-B. analysed the data results from a logistics perspective, contributed to the writing process and revised the manuscript. M.K. headed the research group, initiated the study, supported the analysis, and revised the manuscript.
Acknowledgments
The research presented in this paper is part of the ETTaero2-project, funded by Energimyndigheten (the Swedish Energy Agency). The computations were performed on resources provided by the Swedish National Infrastructure for Computing (SNIC) at NSC.
Conflicts of Interest
The authors declare no conflict of interest. None of the funding sponsors, industry or research organisations had any role in the research design, selection of data, computations or interpretations of the results.
References
- Intergovernmental Panel on Climate Change (IPCC). Climate Change 2014: Mitigation of Climate Change. Contribution of Working Group III to the Fifth Assessment Report of the Intergovernmental Panel on Climate Change; Edenhofer, O., Pichs-Madruga, R., Sokona, Y., Farahani, E., Kadner, S., Seyboth, K., Adler, A., Baum, I., Brunner, S., Eickemeier, P., et al., Eds.; Cambridge University Press: Cambridge, UK; New York, NY, USA, 2014. [Google Scholar]
- Izzo, M.; Myhr, A. Lastbilars Klimateffektivitet och Utsläpp—Rapport 2015:12; (Trucks Environmental Efficiency and Emissions—Report 2015); Trafikanalys: Stockholm, Sweden, 2015. (In Swedish) [Google Scholar]
- Trafikanalys. Varuflödesundersökning; (Commodity Flow); Trafikanalys: Stockholm, Sweden, 2016. (In Swedish) [Google Scholar]
- Trafikanalys. Lastbilars Klimateffektivitet och Utsläpp; (Trucks Climate Efficiency and Emissions); Trafikanalys: Stockholm, Sweden, 2015. [Google Scholar]
- Karlsson, M.; Gårdhagen, R.; Ekman, P.; Söderblom, D.; Löfroth, C. Aerodynamics of Timber Trucks—A Wind Tunnel Investigation; SAE Technical Paper; No. 2015-01-1562; SAE International: Warrendale, PA, USA, 2015. [Google Scholar] [CrossRef]
- Brunberg, T.; Johansson, F.; Löfroth, C. Dieselförbrukning hos Virkesfordon under 2016; (Diesel Consumption in Forest Trucks 2016); Skogforsk: Uppsala, Sweden, 2016. (In Swedish) [Google Scholar]
- Cordis. CONVENIENT—Report Summary; CENTRO RICERCHE FIAT SCPA: Torino, Italy, 2016. [Google Scholar]
- Ekman, P.; Gårdhagen, R.; Virdung, T.; Karlsson, M. Aerodynamic Drag Reduction—From Conceptual Design on a Simplified Generic Model to Full-Scale Road Tests; SAE Technical Paper; No. 2015-01-1543; SAE International: Warrendale, PA, USA, 2015. [Google Scholar] [CrossRef]
- Krastev, V.; Bella, G. On the Steady and Unsteady Turbulence Modeling in Ground Vehicle Aerodynamic Design and Optimization; SAE Technical Paper; No. 2011-24-0163; SAE International: Warrendale, PA, USA, 2011. [Google Scholar] [CrossRef]
- Anbarci, K.; Acikgoz, B.; Aslan, R.A.; Arslan, O.; Icke, R.O. Development of an Aerodynamic Analysis Methodology for Tractor-Trailer Class Heavy Commercial Vehicles. SAE Int. J. Commer. Veh. 2013, 6, 441–452. [Google Scholar] [CrossRef]
- Taherkhani, A.R.; de Boer, G.N.; Gaskell, P.H.; Gilkeson, C.A.; Hewson, R.W.; Keech, A.; Thompson, H.M.; Toropov, V.V. Aerodynamic Drag Reduction of Emergency Response Vehicles. Adv. Automob. Eng. 2015, 4. [Google Scholar] [CrossRef]
- Hucho, W.-H. Aerodynamics of Road Vehicles; Society of Automotive Engineers, Inc.: Warrendale, PA, USA, 1998; ISBN 978-0-7680-0029-0. [Google Scholar]
- McKinnon, A. Environmental Sustainability: A New Priority for Logistics Managers. In Green Logistics: Improving the Environmental Sustainability of Logistics, 3rd ed.; McKinnon, A., Browne, M., Piecyk, M., Whiteing, A., Eds.; Kogan Page: London, UK, 2015. [Google Scholar]
- Isaksson, K. Logistics Service Providers Going Green—A Framework for Developing Green Service Offerings. Linköping Studies in Science and Technology Dissertations No. 1600. Ph.D. Thesis, Linköping University, Linköping, Sweden, June 2014. [Google Scholar]
- Isaksson, K.; Evangelista, P.; Huge-Brodin, M.; Liimatainen, H.; Sweeney, E. The adoption of green initiatives in logistics service providers—A strategic perspective. Int. J. Bus. Syst. Res. 2017, 11, 349–364. [Google Scholar] [CrossRef]
- Evangelista, P.; Huge-Brodin, M.; Isaksson, K.; Sweeney, E. Purchasing Green Transport and Logistics Services: Implications from the Environmental Sustainability Attitude of 3PLs. In Outsourcing Management for Supply Chain Operations and Logistics Services; Folinas, D., Ed.; IGI Global: Hershesy, PA, USA, 2013. [Google Scholar]
- Aronsson, H.; Huge-Brodin, M. The environmental impact of changing logistics structures. Int. J. Logist. Manag. 2006, 17, 394–415. [Google Scholar] [CrossRef]
- Huge-Brodin, M. The role of Logistics Service Providers in the Development of Sustainability-Related Innovation. In Supply Chain Innovation for Competing in Highly Dynamic Markets: Challenges and Solutions; Evangelista, P., McKinnon, A., Sweeney, E., Esposito, E., Eds.; IGI Global: Hershesy, PA, USA, 2011; pp. 215–223. [Google Scholar]
- Asmoarp, V.; Skogforsk. Personal communication, 2017.
- Energimyndigheten. Drivmedel och Biodrivmedel 2015; (Fuels and Biofuels 2015); Energimyndigheten: Eskilstuna, Sweden, 2016. (In Swedish) [Google Scholar]
- Rådström, C. Virkesflöde och val av Hjulsystem på Virkesfordon Inom Region Iggesund, Holmen Skog. (Wood Flow and Choice of Wheel Systems on Timber Trucks at Regions Iggesund, Holmen Skog). Master’s Thesis, Sveriges Lantbruksuniversitet, Umeå, Sweden, 2014. (In Swedish). [Google Scholar]
- Johansson, F.; von Hofsten, H. HCT-Kalkyl—An Interactive Cost Calculation Model for Comparing Trucks of Different Sizes; Skogforsk: Uppsala, Sweden, 2017. [Google Scholar]
- Röhfors, G. Däckutrsustnings Påverkan På Miljö och Driftsekonomi vid Rundvirkestransport; (The Tire Equipment’s Effect on Environment and Operating Cost When Log Haulin); Sveriges Lantbrukuniversitet: Uppsala, Sweden, 2015. (In Swedish) [Google Scholar]
- Trafikanalys. Skogens Transporter—En Trafikslagsövergripande Kartläggning; (The Transports of the Forest—An Intermodal Survey); Trafikanalys: Stockholm, Sweden, 2015. (In Swedish) [Google Scholar]
- Eng-Larsson, F. Risk-sharing Green Transport Investments. In Greening Logistics; Björklund, M., Huge-Brodin, M., Eds.; Studentlitteratur: Lund, Sweden, 2017; pp. 37–49. [Google Scholar]
- Trafikanalys. Prognoser för Fordonsflottans Utveckling i Sverige; (Forecast for the Vehicle Fleet in Sweden); Trafikanalys: Stockholm, Sweden, 2017. (In Swedish) [Google Scholar]
- Huge-Brodin, M.; Martinsen Sallnäs, U.; Karlsson, M. Sustainable Logistics Service Providers—A strategic perspective on green logistics service provision. In Proceedings of the 20th Annual Logistics Research Network Annual Conference (LRN 2015), Derby, UK, 9–11 September 2015. [Google Scholar]
Figure 1.
Presents the fuel consumption of timber trucks over the last 10 years. As can be seen, no real development has taken place.
Figure 1.
Presents the fuel consumption of timber trucks over the last 10 years. As can be seen, no real development has taken place.

Figure 2.
Total pressure equal to zero for the Baseline unloaded timber truck at 5° yaw (Cd = 0.7). Note a quite significant wake behind the cab.
Figure 2.
Total pressure equal to zero for the Baseline unloaded timber truck at 5° yaw (Cd = 0.7). Note a quite significant wake behind the cab.
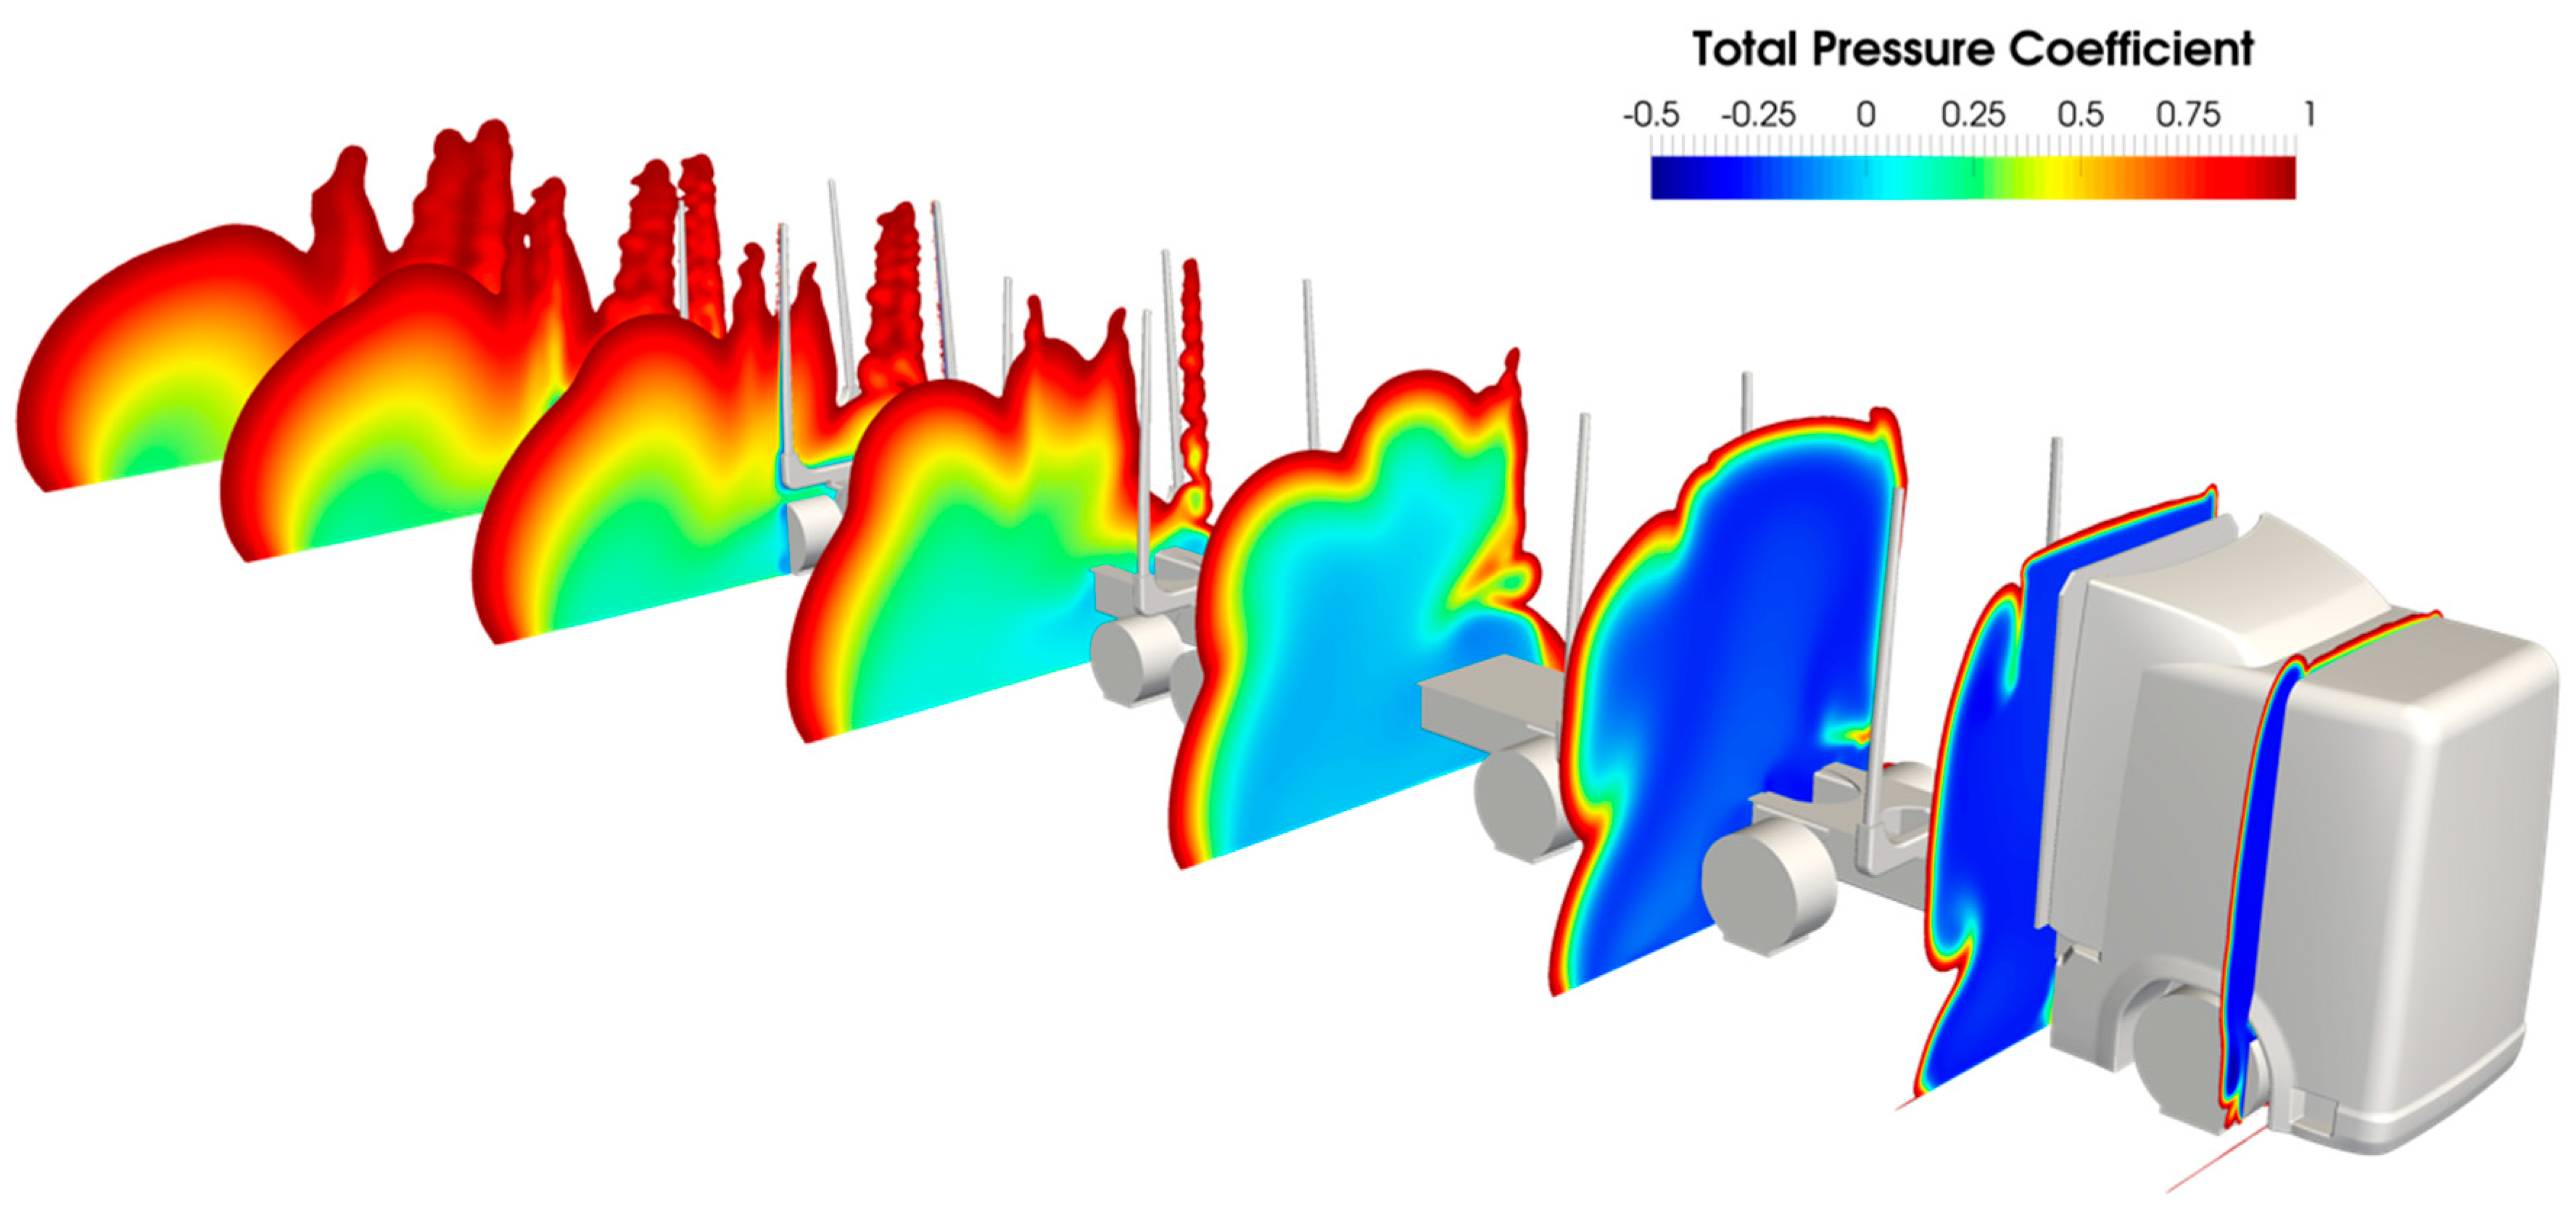
Figure 3.
Total pressure equal to zero for the unloaded timber truck fitted with a bulkhead shield at 5° yaw (Cd = 0.63). Note a reduced wake both in the immediate vicinity of the cab and along the trailer.
Figure 3.
Total pressure equal to zero for the unloaded timber truck fitted with a bulkhead shield at 5° yaw (Cd = 0.63). Note a reduced wake both in the immediate vicinity of the cab and along the trailer.
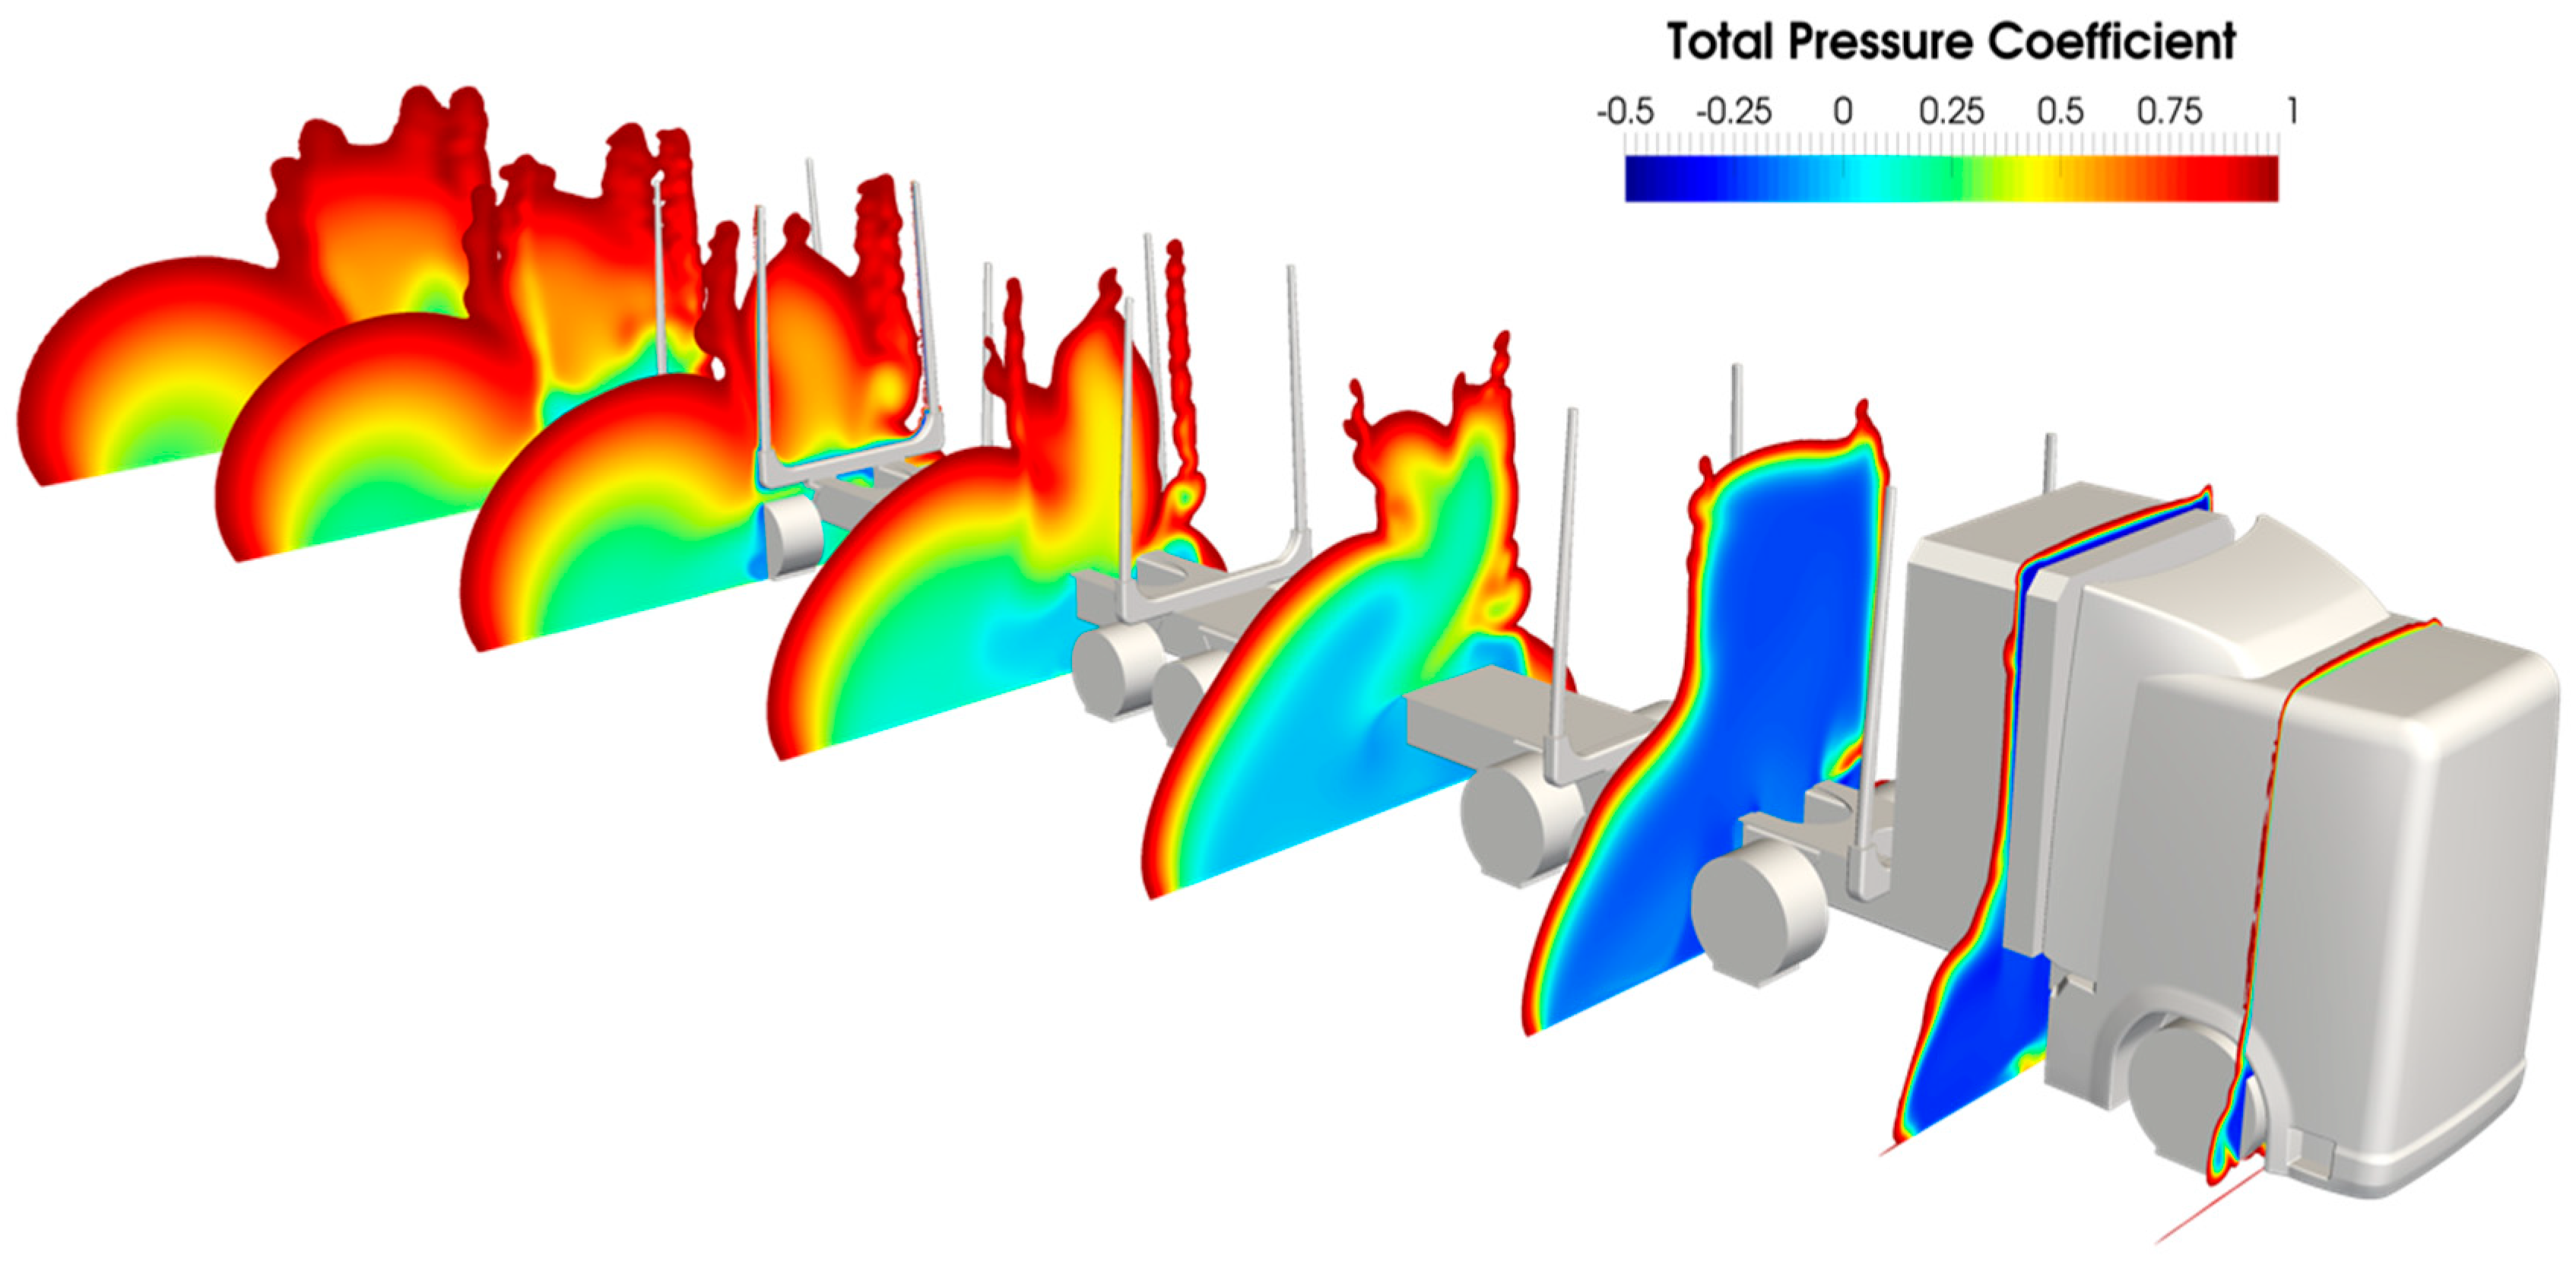
Figure 4.
Total pressure equal to zero for the unloaded timber truck fitted with side skirts at 5° yaw (Cd = 0.52). Note a smaller wake that is reduced along the whole of the vehicle.
Figure 4.
Total pressure equal to zero for the unloaded timber truck fitted with side skirts at 5° yaw (Cd = 0.52). Note a smaller wake that is reduced along the whole of the vehicle.

Figure 5.
(left) Presents the number of registered timber trucks per county; (right) Presents the transport distance in Sweden.
Figure 5.
(left) Presents the number of registered timber trucks per county; (right) Presents the transport distance in Sweden.

Figure 6.
The distribution of counties in order of which county transported the longest average distance and the total weight transported in that county.
Figure 6.
The distribution of counties in order of which county transported the longest average distance and the total weight transported in that county.

Figure 7.
The maximum weight of freight trains. The figure represents the development since 2000. The figure includes 1614 trucks.
Figure 7.
The maximum weight of freight trains. The figure represents the development since 2000. The figure includes 1614 trucks.

Figure 8.
Presents the development of engine size. (left) Presents the engine size of the whole fleet as of today and what year the trucks are from and (right) presents the development of the trucks from 2000–2020. At (left) 1662 trucks are included and at (right) 1614 are included.
Figure 8.
Presents the development of engine size. (left) Presents the engine size of the whole fleet as of today and what year the trucks are from and (right) presents the development of the trucks from 2000–2020. At (left) 1662 trucks are included and at (right) 1614 are included.

Figure 9.
The EURO-classifications of all timber trucks. The stacks present the share of the fleet and the orange line is the accumulated shares.
Figure 9.
The EURO-classifications of all timber trucks. The stacks present the share of the fleet and the orange line is the accumulated shares.

Figure 10.
Presents the cost reduction depending on reduction of fuel consumption. The values represent how big the decrease in transport cost is in Swedish kronor per tonnes (SEK/tonnes). The percent represents reduction in fuel consumption and the km the length of the transport. A negative value represents an increase in transport cost and a positive value a decrease. For example, it can be seen that the length has to be longer then 150 km with a fuel reduction of 10% to reach a reduced cost of 4 SEK/tonnes or more.

Figure 11.
Presents the cost reduction as a function of weight. (left) Presents the cost reduction if the weight of the installments is 100 kg; (middle) Presents the cost reduction if the weight of the installments is 500 kg; (right Presents the cost reduction if the weight of the installments is 1000 kg. Depending on the weight of the installment the truck will be able to load less. The values represent how big the decrease in transport cost is in SEK/tonnes. A negative value represents an increase in transport cost.

Figure 12.
Presents the cost reduction as a result of increased changeover time. (left) The cost reduction as a result of five minutes extra changeover time; (right) The cost reduction as a result of 15 min extra changeover time. The values represent how big the decrease in transport cost is in SEK/tonnes. A negative value represents an increase in transport cost and a positive value a decrease.
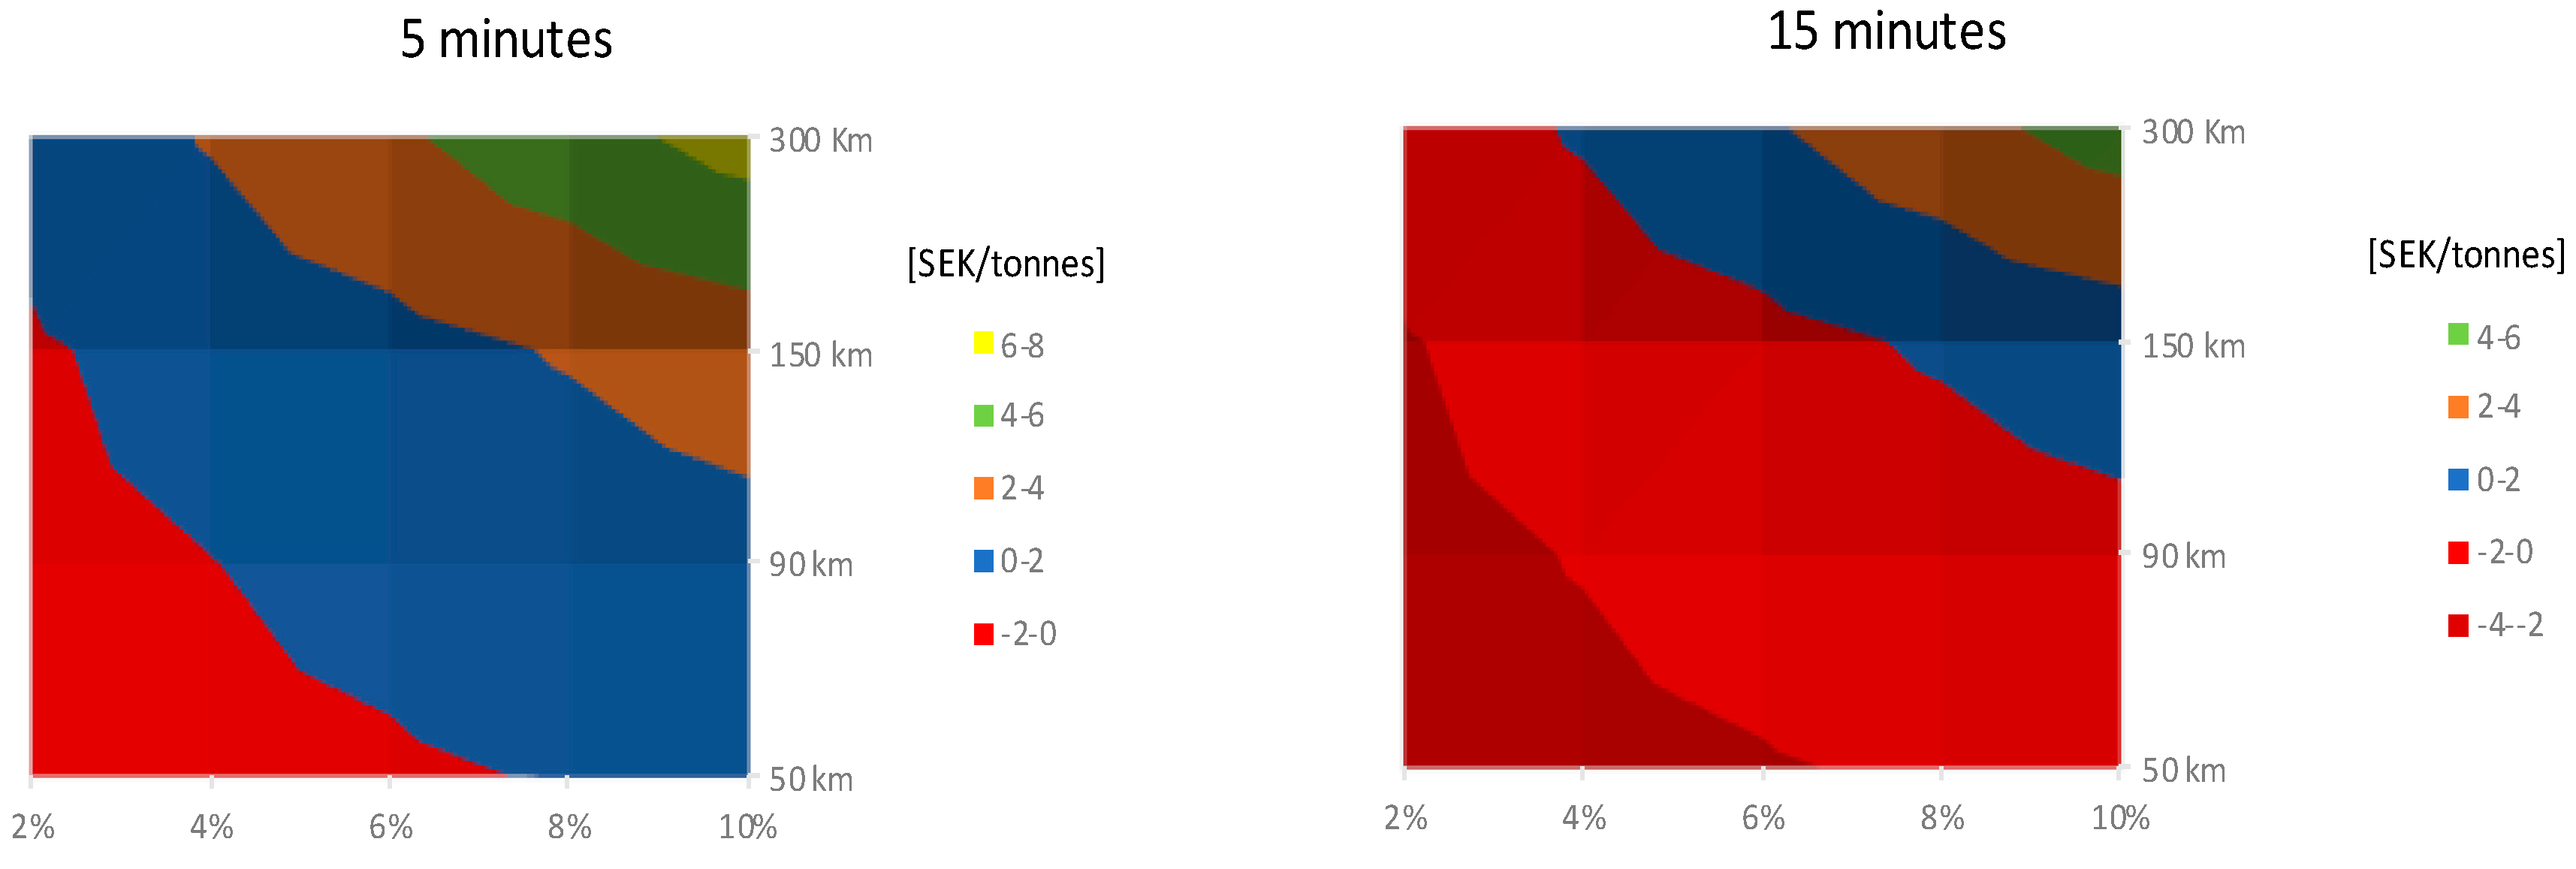
Figure 13.
Presents the cost reduction of two different cases. (left) Presents the cost reductions with the highest investment cost of 100,000 SEK; (right) Shows the cost reduction with the highest investment cost and weight. No extra changeover time is included. The values represent how big the decrease in transport cost is in SEK/tonnes. A negative value represents an increase in transport cost and a positive value a decrease in transport cost.
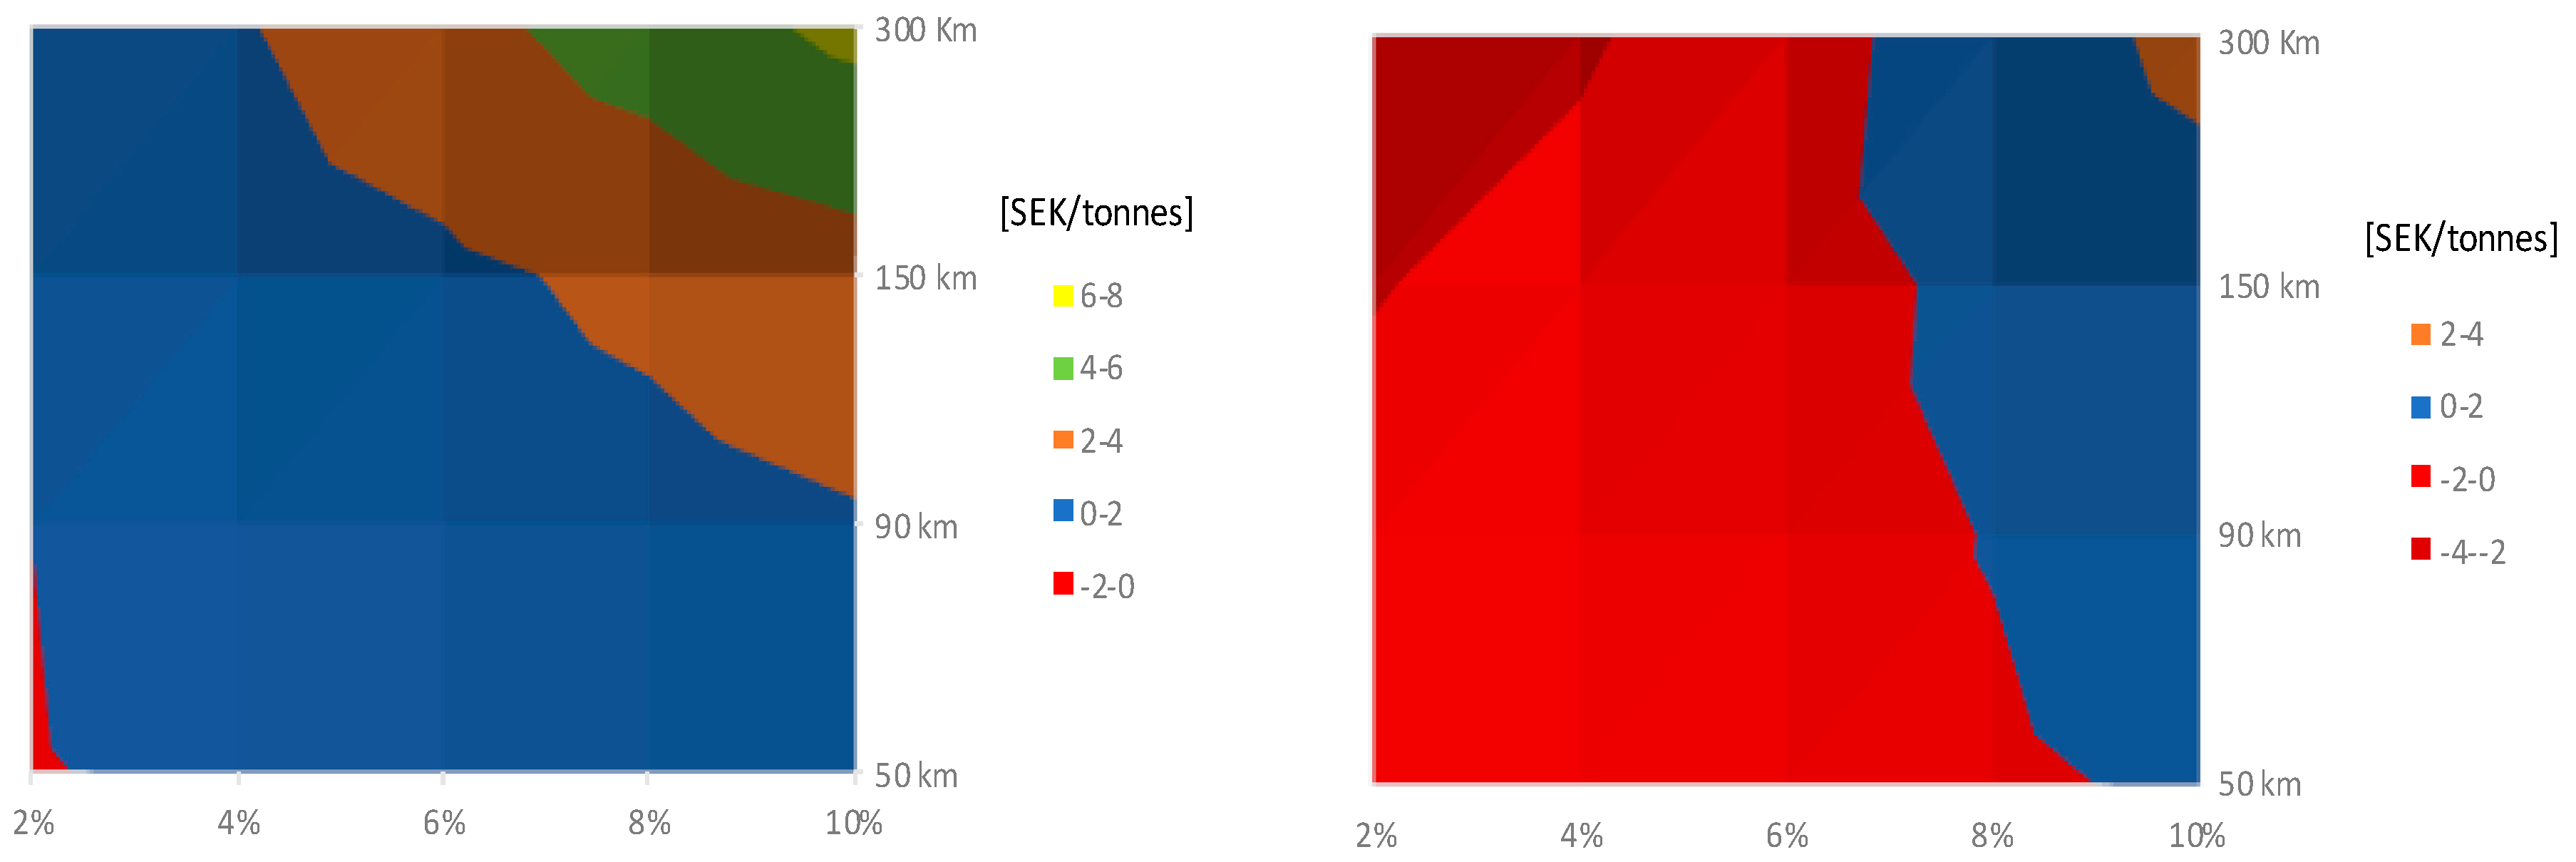
Figure 14.
Presents result from Case 2, how the changeover time affects the result. (left) Presents the result with no extra changeover time, lowest investment cost and weight of installment; (middle) Presents the result with 5 min extra changeover time, lowest investment cost and weight of installment; (right) Presents the result with 15 min extra changeover time, lowest investment cost and weight of installment. The values represent how big the decrease in transport cost is in SEK/tonnes. A negative value represents an increase in transport cost and a positive value a decrease.


Table 1.
Presents the results from different configurations.
| Configuration | CD | CD Reduction | Estimated Fuel Consumption Reduction |
|---|---|---|---|
| Baseline | 0.70 | - | - |
| Bulkhead Shield | 0.63 | −10.4% | 3.5% |
| Side Skirts | 0.52 | −24.8% | 8.3% |
Table 2.
Shows the data used from Transportstyrelsen in this project.
| Vehicle Data | Technical Data | ||
|---|---|---|---|
| Manufacturer | Engine effect (kw) | Height (mm) | ECO-car |
| Vehicle type | Fuel | Number of axis | CO2-emissions |
| Year | Cylinder volume (cc) | Distance between axis | Particle value for fule |
| Date of registration | Total weight (kg) | Rim dimensions | Emissions |
| Coach work code | Tax weight (kg) | Tire dimensions | Tank volume |
| Energy consumption | Trailer weight (kg) | Coupling device | EEG |
| Length (mm) | Taxrate | ||
| Year of production | Emission-classification | ||
| EURO-classification | Gearbox | ||
Table 3.
The different parameters investigated in each test.
| Test | Parameters | Values Tested |
|---|---|---|
| Test 1 | Fuel reduction | 2%, 4%, 6%, 8% and 10% |
| Test 2 | Weight of instalment | 100 kg, 500 kg and 1000 kg |
| Test 3 | Extra changeover time | 5 min, 10 min and 15 min extra |
| Test 4 | Investment cost | 10,000 SEK, 50,000 SEK and 100,000 SEK |
Table 4.
The different parameters investigated in each case.
| Case | Parameters |
|---|---|
| Case 1 | Highest investment cost, highest weight, no extra changeover time |
| Case 2 | Lowest investment cost, lowest weight, no extra changeover time, 5 min extra changeover time and 15 min extra changeover time |
| Case 3 | Highest investment cost, highest weight, 15 min extra changeover time and 10% fuel reduction |
Table 5.
Presents the total results for the County of Västerbotten with assumed fuel reduction. The fuel price was assumed 10 SEK/L and the emission factor 2.82 kg CO2-eq/L.
Table 5.
Presents the total results for the County of Västerbotten with assumed fuel reduction. The fuel price was assumed 10 SEK/L and the emission factor 2.82 kg CO2-eq/L.
| Fuel Reduction | 2% | 4% | 6% | 8% | 10% |
|---|---|---|---|---|---|
| Decreased fuel (thousand litres) | 319 | 638 | 957 | 1257 | 1557 |
| Decreased emissions (tonnes CO2-eq) | 900 | 1800 | 2700 | 3500 | 4400 |
Table 6.
How the risk is split between buyers and sellers in a contract [20].
Table 6.
How the risk is split between buyers and sellers in a contract [20].
| Contract Component | More Risk is Allocated to the Seller when Using | More Risk is Allocated to the Buyer when Using |
|---|---|---|
| Price structure | Price table | Price specified across all dimensions |
| Price indexing | No indices or surchagre | Indices that capture all costs that may vary over the contract horizon |
| Performance-based payment | Payment contingen on performance | No performance-based payment |
| Volume commitent | Frame agreements with loosely specifiec volumes | Fixed volume and frequency of shipment |
| Contract period | Short period | Long period |
© 2018 by the authors. Licensee MDPI, Basel, Switzerland. This article is an open access article distributed under the terms and conditions of the Creative Commons Attribution (CC BY) license (http://creativecommons.org/licenses/by/4.0/).
Share and Cite
MDPI and ACS Style
Johannes, E.; Ekman, P.; Huge-Brodin, M.; Karlsson, M. Sustainable Timber Transport—Economic Aspects of Aerodynamic Reconfiguration. Sustainability 2018, 10, 1965. https://doi.org/10.3390/su10061965
AMA Style
Johannes E, Ekman P, Huge-Brodin M, Karlsson M. Sustainable Timber Transport—Economic Aspects of Aerodynamic Reconfiguration. Sustainability. 2018; 10(6):1965. https://doi.org/10.3390/su10061965
Chicago/Turabian StyleJohannes, Erik, Petter Ekman, Maria Huge-Brodin, and Matts Karlsson. 2018. "Sustainable Timber Transport—Economic Aspects of Aerodynamic Reconfiguration" Sustainability 10, no. 6: 1965. https://doi.org/10.3390/su10061965
Note that from the first issue of 2016, this journal uses article numbers instead of page numbers. See further details here.