Colony Development and Reproductive Success of Bumblebees in an Urban Gradient

Abstract
1. Introduction
2. Materials and Methods
2.1. Study Organism
2.2. Site Selection
2.3. Experimental Setup
2.4. Nest Variables
2.5. Data Analysis
3. Results
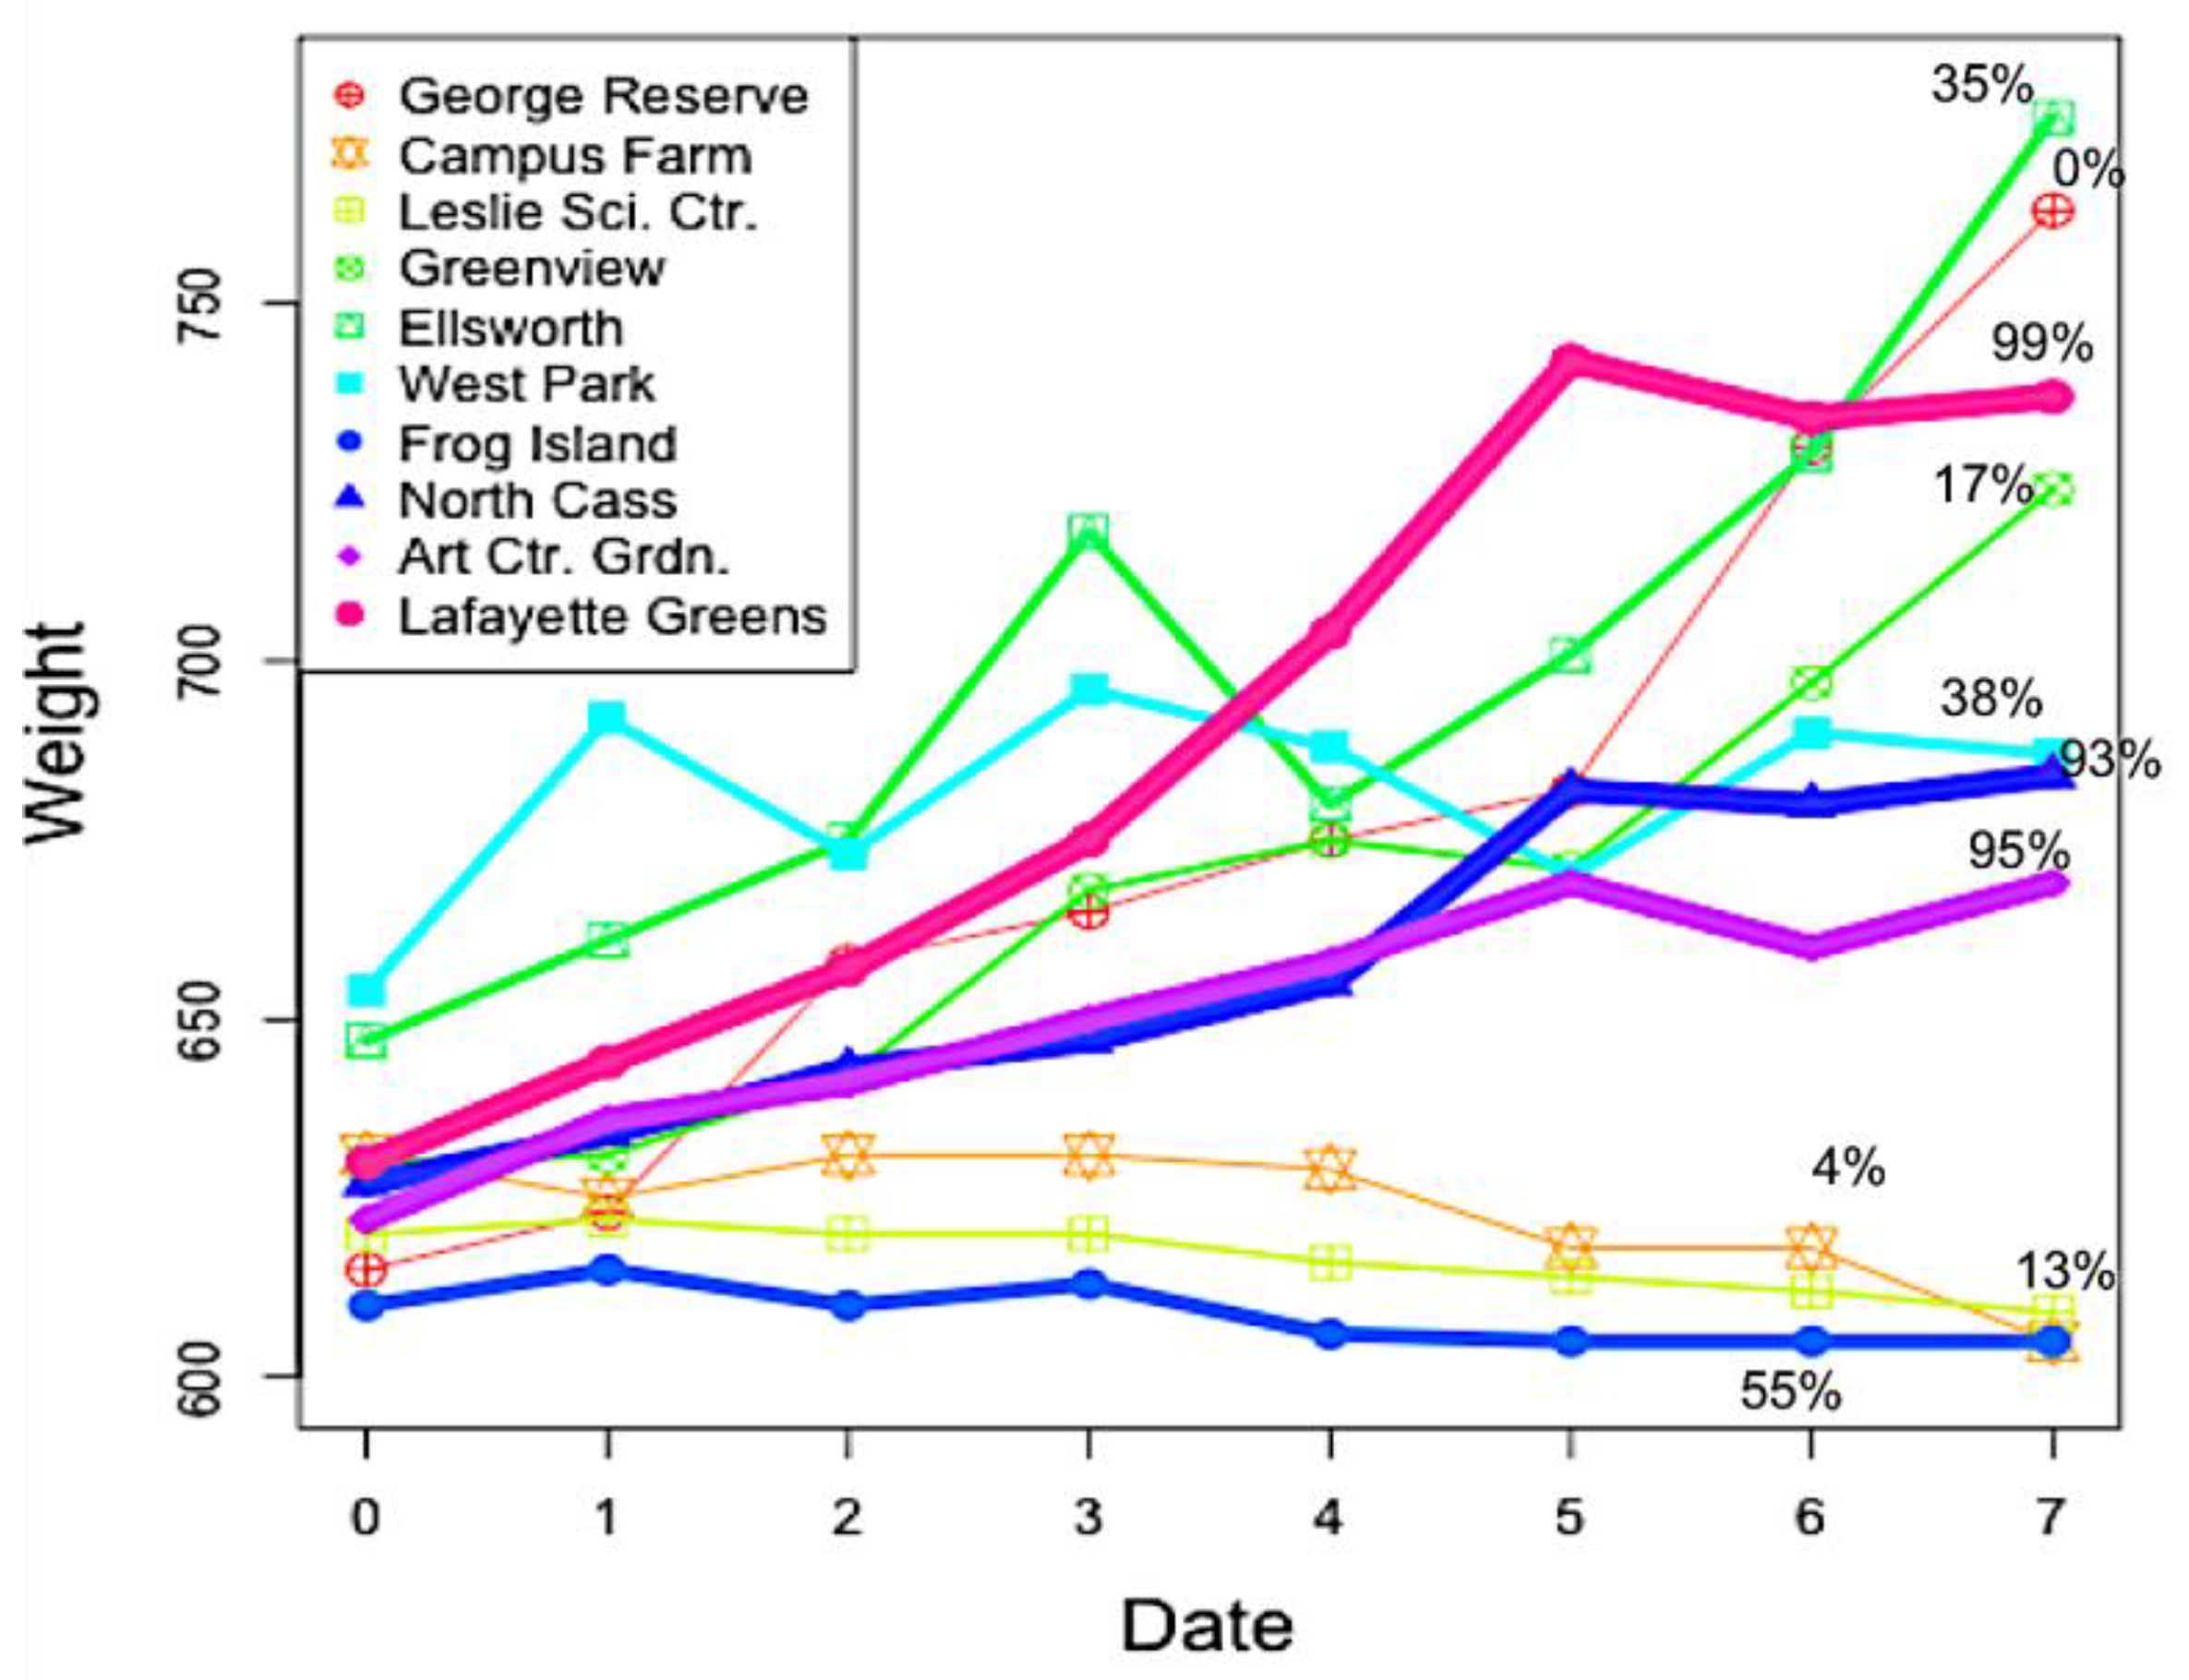
3.1. Nest Weights
3.2. Nest Variables
3.2.1. Reproductive Success
3.2.2. Brood
3.2.3. Natural Enemies
3.2.4. Forager Activity
3.2.5. Colony Development (Rate of Weight Change)
4. Discussion
5. Conclusions
Supplementary Materials
Author Contributions
Funding
Acknowledgments
Conflicts of Interest
References
- Klein, A.M.; Vaissiere, B.E.; Cane, J.H.; Steffan-Dewenter, I.; Cunningham, S.A.; Kremen, C.; Tscharntke, T. Importance of pollinators in changing landscapes for world crops. Proc. R. Soc. Lond. B 2007, 274, 303–313. [Google Scholar] [CrossRef] [PubMed]
- Garibaldi, L.A.; Steffan-Dewenter, I.; Winfree, R.; Aizen, M.A.; Bommarco, R.; Cunningham, S.A.; Kremen, C.; Carvalheiro, L.G.; Afik, O.; Bartomeus, I.; et al. Wild pollinators enhance fruit set of crops regardless of honey bee abundance. Science 2013, 339, 1608–1611. [Google Scholar] [CrossRef] [PubMed]
- Brittain, C.; Williams, N.; Kremen, C.; Klein, A.M. Synergistic effects of non-Apis bees and honey bees for pollination services. Proc. R. Soc. Lond. B Biol. Sci. 2013, 280, 20122767. [Google Scholar] [CrossRef] [PubMed]
- Ahrne, K.; Bengtsson, J.; Elmqvist, T. Bumble Bees (Bombus spp.) along a Gradient of Increasing Urbanization. PLoS ONE 2009, 4, E5574. [Google Scholar] [CrossRef] [PubMed]
- Goulson, D.; Nicholls, E.; Botías, C.; Rotheray, E.L. Bee declines driven by combined stress from parasites, pesticides, and lack of flowers. Science 2015, 347, 1255957. [Google Scholar] [CrossRef] [PubMed]
- Koh, I.; Lonsdorf, E.V.; Williams, N.M.; Brittain, C.; Isaacs, R.; Gibbs, J.; Ricketts, T.H. Modeling the status, trends, and impacts of wild bee abundance in the United States. Proc. Natl. Acad. Sci. USA 2016, 113, 140–145. [Google Scholar] [CrossRef] [PubMed]
- Grimm, N.B.; Faeth, S.H.; Golubiewski, N.E.; Redman, C.L.; Wu, J.G.; Bai, X.; Briggs, J.M. Global change and the ecology of cities. Science 2008, 319, 756–760. [Google Scholar] [CrossRef] [PubMed]
- Seto, K.C.; Güneralp, B.; Hutyra, L.R. Global forecasts of urban expansion to 2030 and direct impacts on biodiversity and carbon pools. Proc. Natl. Acad. Sci. USA 2012, 109, 16083–16088. [Google Scholar] [CrossRef] [PubMed]
- Geslin, B.; Gauzens, B.; Thebault, E.; Dajoz, I. Plant pollinator networks along a gradient of urbanisation. PLoS ONE 2013, 8, e63421. [Google Scholar] [CrossRef] [PubMed]
- Martins, A.C.; Gonçalves, R.B.; Melo, G.A.R. Changes in wild bee fauna of a grassland in Brazil reveal negative effects associated with growing urbanization during the last 40 years. Zoologia (Curitiba) 2013, 30, 157–176. [Google Scholar] [CrossRef]
- Williams, N.M.; Winfree, R. Local habitat charac-teristics but not landscape urbanization drive pollinator visitation and native plant pollination in forest remnants. Biol. Conserv. 2013, 160, 10–18. [Google Scholar] [CrossRef]
- McFrederick, Q.S.; Le Buhn, G. Are urban parks refuges for bumble bees Bombus spp. (Hymenoptera: Apidae)? Biol. Conserv. 2006, 129, 372–382. [Google Scholar] [CrossRef]
- Colding, J.; Lundberg, J.; Folke, C. Incorporating Green-area User Groups in Urban Ecosystem Management. AMBIO J. Hum. Environ. 2006, 35, 237–244. [Google Scholar] [CrossRef]
- Matteson, K.C.; Ascher, J.S.; Langellotto, G.A. Bee richness and abundance in New York city urban gardens. Ann. Entomol. Soc. Am. 2008, 101, 140–150. [Google Scholar] [CrossRef]
- Matteson, K.C.; Langelotto, G. Determinates of inner city butterfly and bee species richness. Urban Ecosyst. 2010, 13, 333–347. [Google Scholar] [CrossRef]
- Lin, B.B.; Philpott, S.M.; Jha, S. The future of urban agriculture and biodiversity-ecosystem services: Challenges and next steps. Basic Appl. Ecol. 2015, 16, 189–201. [Google Scholar] [CrossRef]
- Tonietto, R.; Fant, J.; Ascher, J.; Ellis, K.; Larkin, D. A comparison of bee communities of Chicago green roofs, parks and prairies. Lands. Urban Plan. 2011, 103, 102–108. [Google Scholar] [CrossRef]
- Kearns, C.A.; Oliveras, D.M. Environmental factors affecting bee diversity in urban and remote grassland plots in Boulder, Colorado. J. Insect Conserv. 2009, 13, 655–665. [Google Scholar] [CrossRef]
- Baldock, K.C.; Goddard, M.A.; Hicks, D.M.; Kunin, W.E.; Mitschunas, N.; Osgathorpe, L.M.; Potts, S.G.; Robertson, K.M.; Scott, A.V.; Stone, G.N.; et al. Where is the UK’s pollinator biodiversity? The importance of urban areas for flower-visiting insects. Proc. R. Soc. Lond. B 2015, 282. [Google Scholar] [CrossRef] [PubMed]
- Theodorou, P.; Albig, K.; Radzevičiūtė, R.; Settele, J.; Schweiger, O.; Murray, T.E.; Paxton, R.J. The structure of flower visitor networks in relation to pollination across an agricultural to urban gradient. Funct. Ecol. 2017, 31, 838–847. [Google Scholar] [CrossRef]
- Fetridge, E.D.; Ascher, J.S.; Langellotto, G.A. The Bee Fauna of Residential Gardens in a Suburb of New York City (Hymenoptera: Apoidea). Ann. Entomol. Soc. Am. 2008, 101, 1067–1077. [Google Scholar] [CrossRef]
- Frankie, G.W.; Thorp, R.W.; Schindler, M.; Hernandez, J.; Ertter, B.; Rizzardi, M. Ecological patterns of bees and their host ornamental flowers in two northern California cities. J. Kansas Entomol. Soc. 2005, 78, 227–246. [Google Scholar] [CrossRef]
- McIntyre, N.E.; Hostetler, M.E. Effects of urban land use on pollinator (Hymenoptera: Apoidea) communities in a desert metropolis. Basic Appl. Ecol. 2001, 2, 209–218. [Google Scholar]
- Cane, J.H.; Minckley, R.L.; Kervin, L.; Roulston, T.H.; Williams, N. Complex responses within a desert bee guild (Hymenoptera: Apiformes) to urban habitat fragmentation. Ecol. Appl. 2006, 16, 632–644. [Google Scholar] [CrossRef]
- Winfree, R.; Bartomeus, I.; Cariveau, D. Native pollinators in anthropogenic habitats. Ann. Rev. Ecol. Evol. Syst. 2011, 42, 1–22. [Google Scholar] [CrossRef]
- Theodorou, P.; Radzevičiūtė, R.; Settele, J.; Schweiger, O.; Murray, T.E.; Paxton, R.J. Pollination services enhanced with urbanization despite increasing pollinator parasitism. Proc. R. Soc. Lond. B 2016, 283, 20160561. [Google Scholar] [CrossRef] [PubMed]
- Banaszak-Cibicka, W.; Zmihorski, M. Wild bees along an urban gradient: Winners and losers. J. Insect Conserv. 2011, 16, 331–343. [Google Scholar]
- Van Horne, B. Density as a misleading indicator of habitat quality. J. Wildl. Manag. 1983, 47, 893–901. [Google Scholar] [CrossRef]
- Henry, M.; Cosson, J.F.; Pons, J.M. Abundance may be a misleading indicator of fragmentation-sensitivity: The case of fig-eating bats. Biol. Conserv. 2007, 139, 462–467. [Google Scholar] [CrossRef]
- Goulson, D.; Hughes, W.O.H.; Derwent, L.C.; Stout, J.C. Colony growth of the bumblebee, Bombus terrestris in improved and conventional agricultural and suburban habitats. Oecologia 2002, 130, 267–273. [Google Scholar] [CrossRef] [PubMed]
- Williams, N.M.; Regetz, J.; Kremen, C. Landscape-scale resources promote colony growth but not reproductive performance of bumble bees. Ecology 2012, 93, 1049–1058. [Google Scholar] [CrossRef] [PubMed]
- Goulson, D. Bumblebees: Behaviour, Ecology, and Conservation; Oxford University Press on Demand: New York, NY, USA, 2010. [Google Scholar]
- Schmid-Hempel, P. Evolutionary Parasitology the Integrated Study of Infections, Immunology, Ecology, and Genetics; No. 574.5249 S2. 2011; Oxford Scholarship Online: Oxford, UK, 2013. [Google Scholar]
- Roulston, T.A.H.; Goodell, K. The role of resources and risks in regulating wild bee populations. Ann. Rev. Entomol. 2011, 56, 293–312. [Google Scholar] [CrossRef] [PubMed]
- Imhoof, B.; Schmid-Hempel, P. Colony success of the bumble bee, Bombus terrestris, in relation to infections by two protozoan parasites, Crithidia bombi and Nosema bombi. Insectes Sociaux 1999, 46, 233–238. [Google Scholar] [CrossRef]
- Otterstatter, M.C.; Gegear, R.J.; Colla, S.R.; Thomson, J.D. Effects of parasitic mites and protozoa on the flower constancy and foraging rate of bumble bees. Behav. Ecol. Sociobiol. 2005, 58, 383–389. [Google Scholar] [CrossRef]
- Otti, O.; Schmid-Hempel, P. A field experiment on the effect of Nosema bombi in colonies of the bumblebee Bombus terrestris. Ecol. Entomol. 2008, 33, 577–582. [Google Scholar] [CrossRef]
- Pelletier, L.; McNeil, J.N. The effect of food supplementation on reproductive success in bumblebee field colonies. Oikos 2003, 103, 688–694. [Google Scholar] [CrossRef]
- R Core Team. R: A Language and Environment for Statistical Computing; R Foundation for Statistical Computing: Vienna, Austria, 2014. [Google Scholar]
- Pinheiro, J.; Bates, D.; DebRoy, S.; Sarkar, D.; R Core Team. nlme: Linear and Nonlinear Mixed Effects Models; R Package Version 3.1-117; R Core Team: Vienna, Austria, 2014. [Google Scholar]
- Schmid-Hempel, R.; Schmid-Hempel, P. Colony performance and immunocompetence of a social insect, Bombus terrestris, in poor and variable environments. Funct. Ecol. 1998, 12, 22–30. [Google Scholar] [CrossRef]
- Cresswell, J.E.; Osborne, J.L.; Goulson, D. An economic model of the limits to foraging range in central place foragers with numerical solutions for bumblebees. Ecol. Entomol. 2000, 25, 249–255. [Google Scholar] [CrossRef]
- Glaum, P.; Simao, M.C.; Vaidya, C.; Fitch, G.; Iulinao, B. Big city Bombus: Using natural history and land-use history to find significant environmental drivers in bumble-bee declines in urban development. R. Soc. Open Sci. 2017, 4, 170156. [Google Scholar] [CrossRef] [PubMed]
- Gardiner, M.M.; Burkman, C.E.; Prajzner, S.P. The value of urban vacant land to support arthropod biodiversity and ecosystem services. Environ. Entomol. 2013, 42, 1123–1136. [Google Scholar] [CrossRef] [PubMed]
- Alford, D.V. Bumblebees; Davis-Poynter: London, UK, 1975. [Google Scholar]
- Cohen, H.; Quistberg, R.D.; Philpott, S.M. Vegetation Management and Host Density Influence Bee–Parasite Interactions in Urban Gardens. Environ. Entomol. 2017, 46, 1313–1321. [Google Scholar]
- Otterstatter, M.C.; Whidden, T.L.; Owen, R.E. Contrasting frequencies of parasitism and host mortality among phorid and conopid parasitoids of bumble-bees. Ecol. Entomol. 2002, 27, 229–237. [Google Scholar] [CrossRef]
- Kim, J.Y. Influence of resource level on maternal investment in a leaf-cutter bee (Hymenoptera: Megachilidae). Behav. Ecol. 1999, 10, 552–556. [Google Scholar] [CrossRef]
- Peterson, J.H.; Roitberg, B.D. Variable flight distance to resources results in changing sex allocation decisions, Megachile rotundata. Behav. Ecol. Sociobiol. 2016, 70, 247–253. [Google Scholar] [CrossRef]
- Muller, C.B.; Schmid-Hempel, P. Variation in life-history pattern in relation to worker mortality in the bumble-bee, Bombus lucorum. Funct. Ecol. 1992, 6, 48–56. [Google Scholar] [CrossRef]
- Muller, C.B.; Schmid-Hempel, P. Correlates of reproductive success among field colonies of Bombus lucorum: The importance of growth and parasites. Ecol. Entomol. 1992, 17, 343–353. [Google Scholar] [CrossRef]
- Owen, R.E.; Rodd, F.H.; Plowright, R.C. Sex ratio in bumble bee colonies: Complications due to orphaning? Behav. Ecol. Sociobiol. 1980, 7, 287–291. [Google Scholar] [CrossRef]
- Goulson, D.; Whitehorn, P.; Fowley, M. Influence of urbanisation on the prevalence of protozoan parasites of bumblebees. Ecol. Entomol. 2012, 37, 83–89. [Google Scholar] [CrossRef]
- Bloch, G. Regulation of queen–worker conflict in bumble bee (Bombus terrestris) colonies. Proc. R. Soc. Lond. B Biol. Sci. 1999, 266, 2465–2469. [Google Scholar] [CrossRef]
- Vogt, D.F. Thermoregulation in bumblebee colonies. II. Behavioral and demographic variation throughout the colony cycle. Physiol. Zool. 1986, 59, 60–68. [Google Scholar] [CrossRef]
- Malfi, R.L.; Roulston, T.H. Patterns of parasite infection in bumble bees (Bombus spp.) of Northern Virginia. Ecol. Entomol. 2014, 39, 17–29. [Google Scholar] [CrossRef]
- Carvell, C.; Bourke, A.F.; Dreier, S.; Freeman, S.N.; Hulmes, S.; Jordan, W.C.; Redhead, J.W.; Sumner, S.; Wang, J.; Heard, M.S. Bumblebee family lineage survival is enhanced in high-quality landscapes. Nature 2017, 543, 547–549. [Google Scholar] [CrossRef] [PubMed]
- Hernandez, J.L.; Frankie, G.W.; Thorp, R.W. Ecology of urban bees: A review of current knowledge and directions for future study. Cities Environ. (CATE) 2009, 2, 3. [Google Scholar] [CrossRef]
- Lowenstein, D.M.; Matteson, K.C.; Xiao, I.; Silva, A.M.; Minor, E.S. Humans, bees, and pollination services in the city: The case of Chicago, IL (USA). Biodivers. Conserv. 2014, 23, 2857–2874. [Google Scholar] [CrossRef]
- Matteson, K.C.; Grace, J.; Minor, E.S. Direct and indirect effects of land use on floral resources and flower-visiting insects across an urban landscape. Oikos 2013, 122, 682–694. [Google Scholar] [CrossRef]


| Site Name | Site Code | Land Cover Type | % Impervious Surface | Coordinates | Location |
|---|---|---|---|---|---|
| E.S. George Reserve | ESGR | Natural | 0 | N 42.4590988 | Pinckney |
| W 84.0137024 | |||||
| Campus Farm | CF | Rural | 4 | N 42.2989998 | Ann Arbor |
| W 83.6648026 | |||||
| Leslie Science Center | LSC | Suburban | 13 | N 42.3009987 | Ann Arbor |
| W 83.7292023 | |||||
| Green View Garden | GV | Suburban | 17 | N 42.2582016 | Ann Arbor |
| W 83.7630005 | |||||
| Ellsworth Garden | E | Suburban | 35 | N 42.2282982 | Ann Arbor |
| W 83.7169037 | |||||
| West Park | WP | Suburban | 38 | N 42.283699 | Ann Arbor |
| W 83.754303 | |||||
| Frog Island | FI | Suburban | 55 | N 42.2484016 | Ypsilanti |
| W 83.6122971 | |||||
| North Cass Garden | NC | Urban | 93 | N 42.3493996 | Detroit |
| W 83.0660019 | |||||
| Art Center Garden | ACG | Urban | 95 | N 42.3627904 | Detroit |
| W 83.0650809 | |||||
| Lafayette Greens | LG | Urban | 99 | N 42.3314018 | Downtown Detroit |
| W 83.0493011 |
| Response | Predictor | Coeff | SE | T | p |
|---|---|---|---|---|---|
| Reproductive success | Cumulative weight gain | 0.019 | 0.005 | 3.48 | 0.01 * |
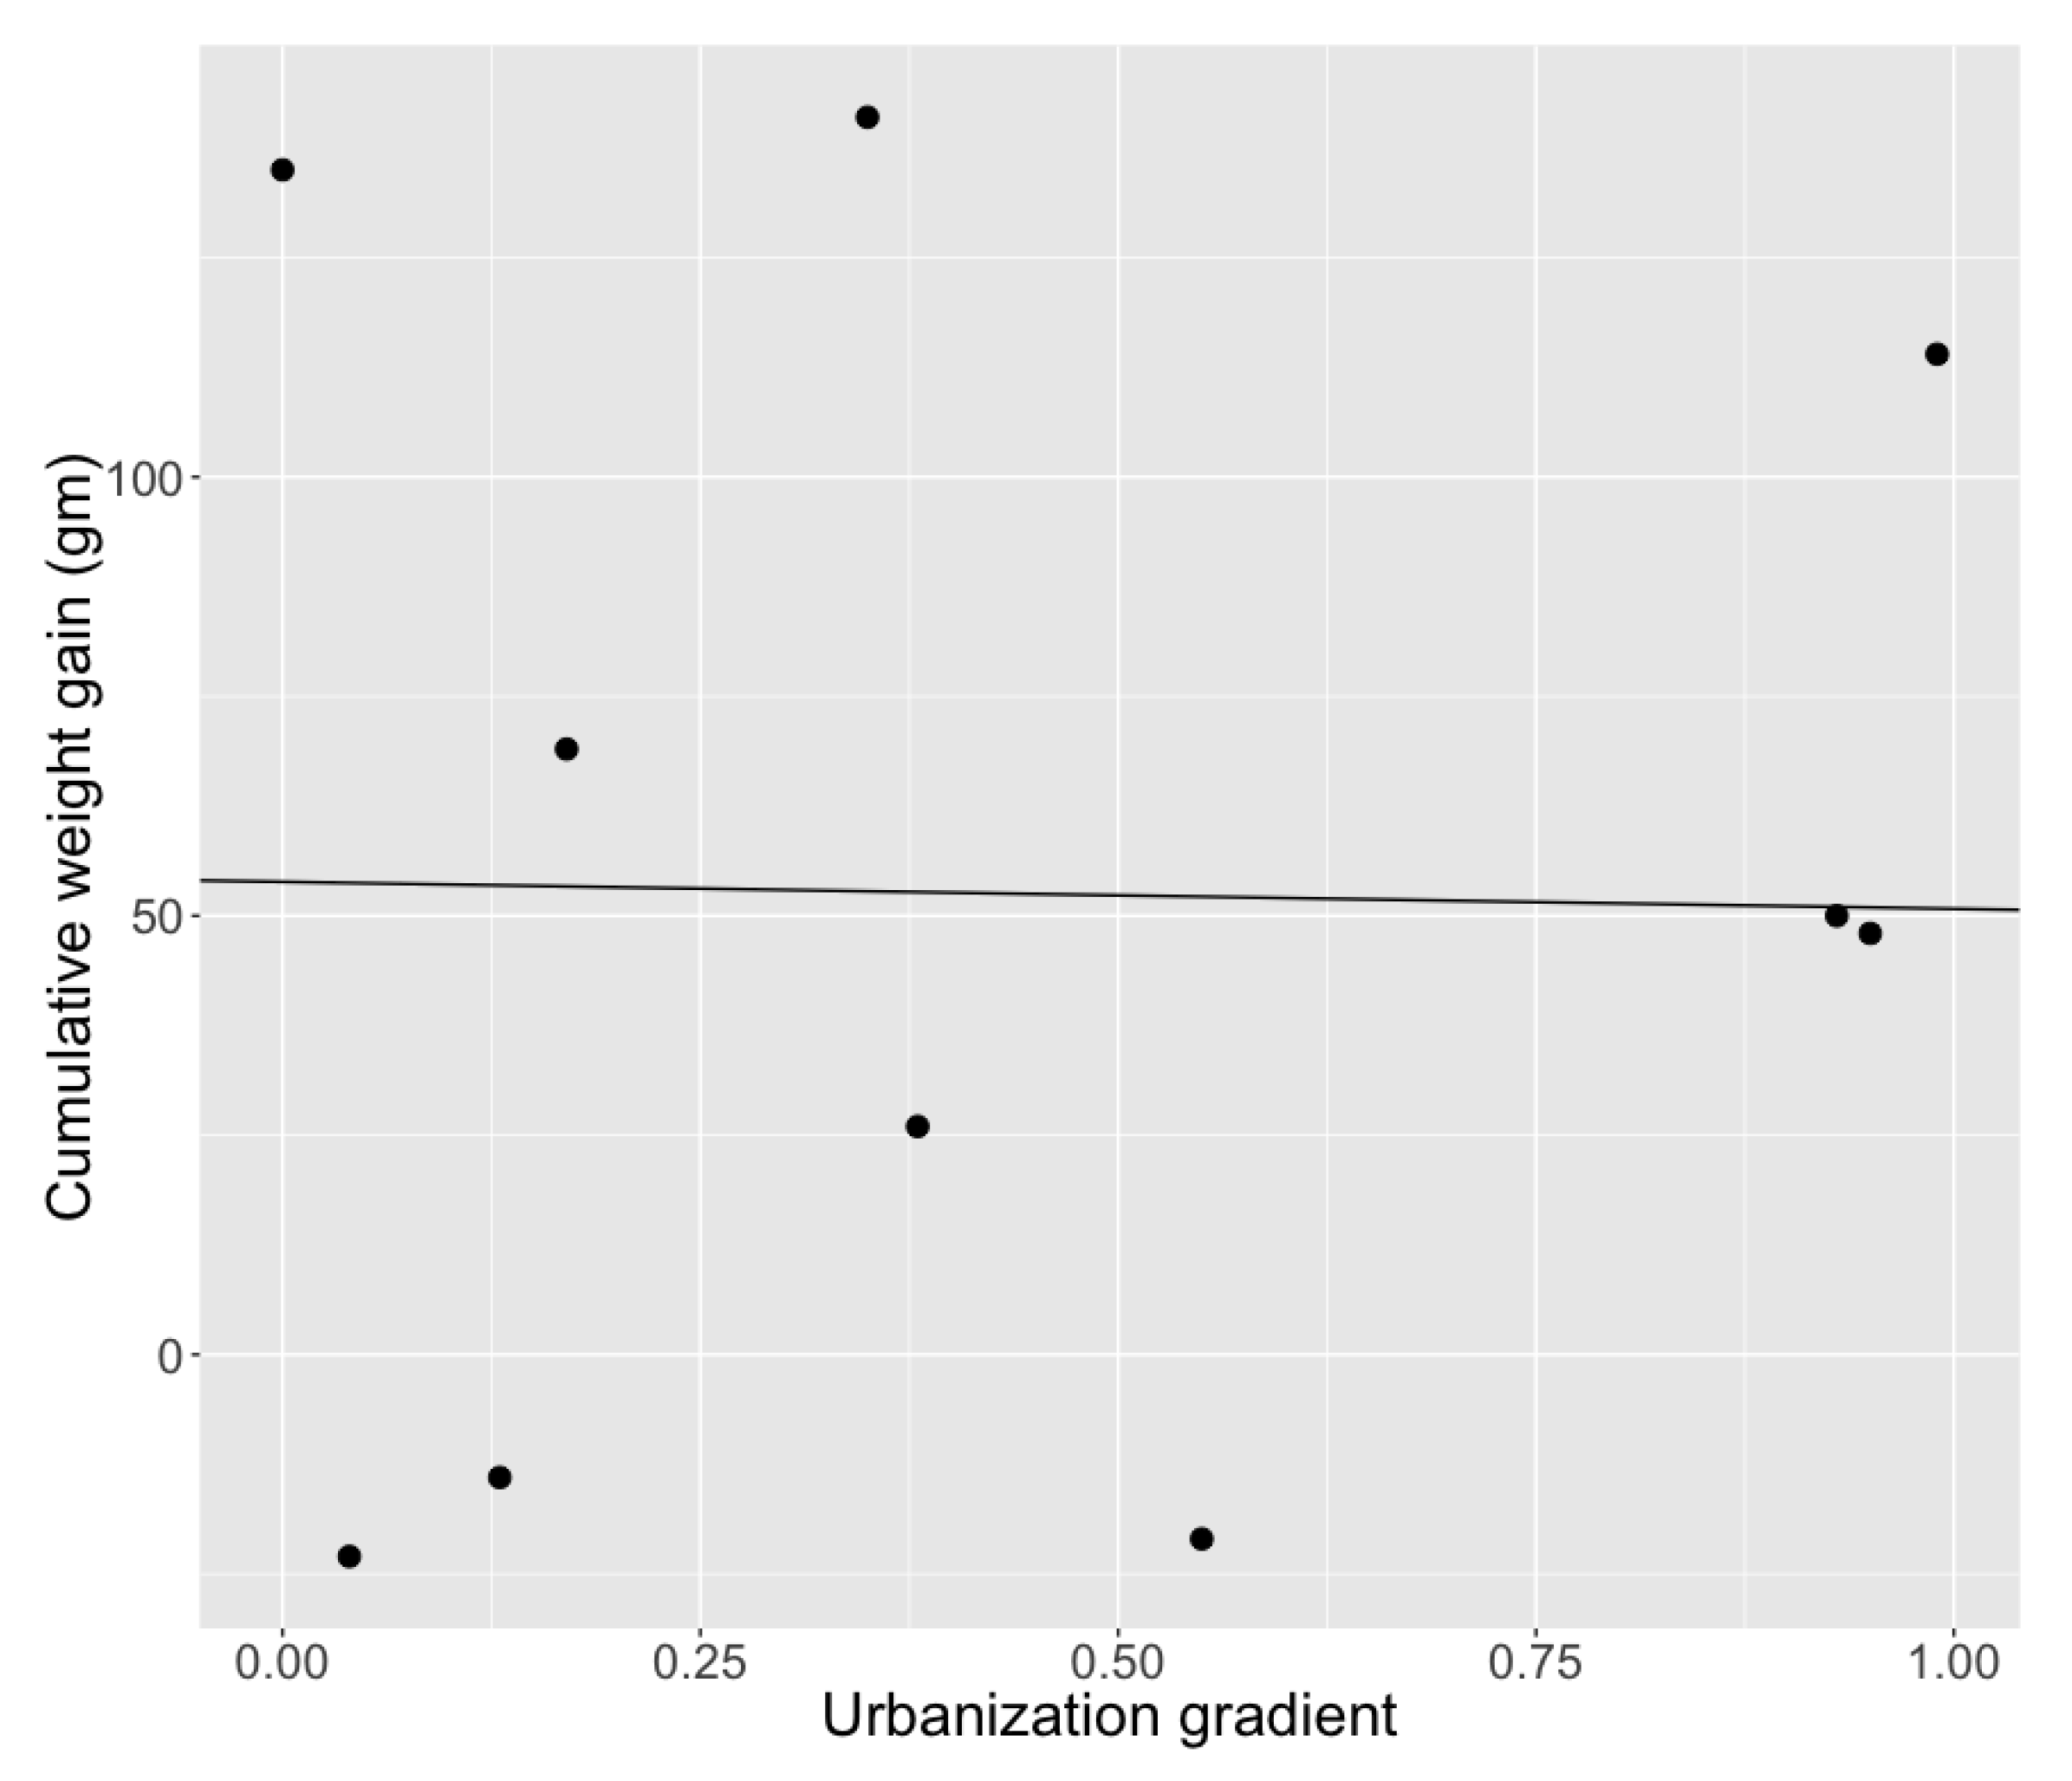
| Model 1 | Urbanization gradient | 1.05 | 0.59 | 1.79 | 0.112 |
| Model 2 | Cumulative weight gain | 0.022 | 0.006 | 3.73 | 0.007 ** |
| Parasite diversity | −1.1 | 0.55 | −1.98 | 0.09 | |
| Surviving workers | Cumulative weight gain | 0.01 | 0.003 | 2.44 | 0.0447 * |
| Model 1 | Urbanization gradient | 0.32 | 0.48 | 0.67 | 0.53 |
| Model 2 | Cumulative weight gain | 0.01 | 0.004 | 1.94 | 0.09 |
| Parasite diversity | −0.01 | 0.54 | −0.01 | 0.99 | |
| Larvae | Cumulative weight gain | 0.018 | 0.004 | 3.95 | 0.005 ** |
| Model 1 | Urbanization gradient | 0.84 | 0.52 | 1.63 | 0.15 |
| Model 2 | Cumulative weight gain | 0.02 | 0.005 | 3.8 | 0.0067 ** |
| Parasite diversity | −0.68 | 0.52 | −1.31 | 0.23 |
| Response | Predictor | Coeff | SE | T | p |
|---|---|---|---|---|---|
| Proportion of pollen foragers | Cumulative weight gain | 0.0076 | 0.0027 | 2.838 | 0.00453 ** |
| Urbanization gradient | −0.476 | 0.2.80 | −1.701 | 0.09 | |
| Abundance of wax moth larvae | 9.34X10⁻⁵ | 0.002 | 0.047 | 0.96 |
| Response | Predictor | Coeff | SE | T | p |
|---|---|---|---|---|---|
| Rate of weight change over time | Urbanization gradient | 3.133 | 1.87 | 1.68 | 0.098 |
| Intial number of workers | 0.89 | 1.43 | 0.63 | 0.533 | |
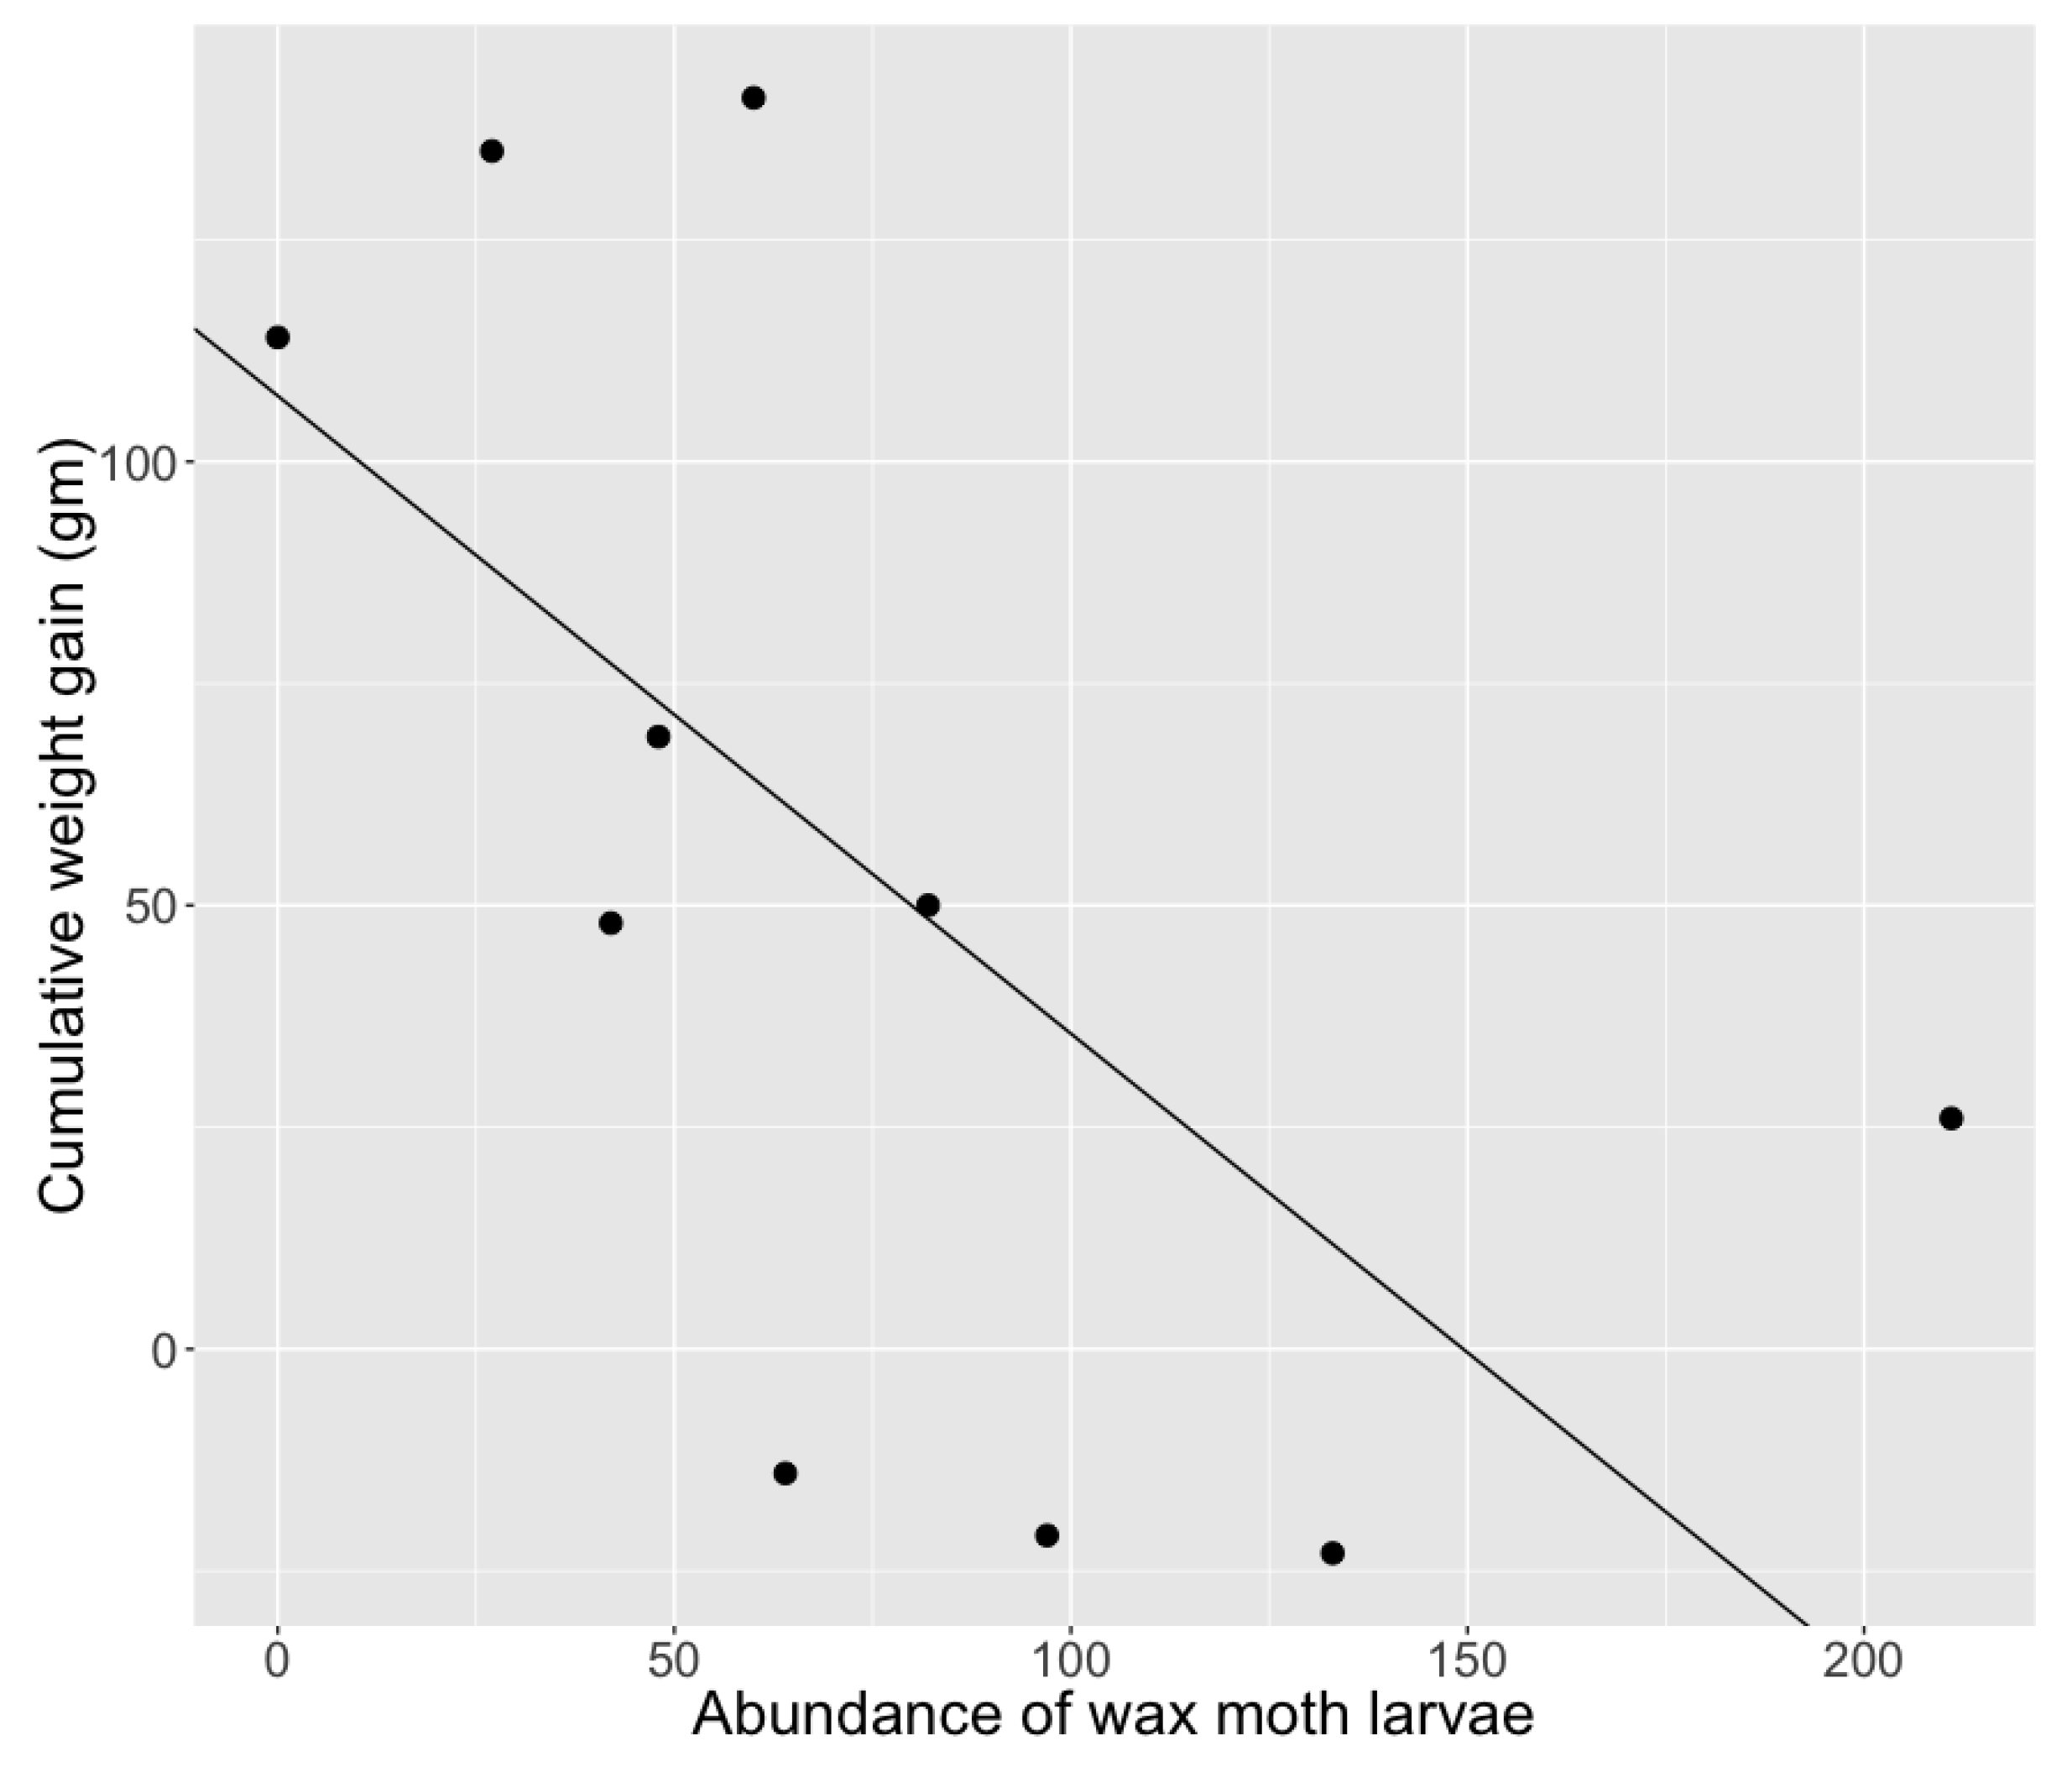
| Interaction term is date with all predictors | Abundance of wax moth larvae | −3.74 | 1.53 | −2.45 | * 0.0169 |
| Foragers entering nest per 10 min per week | 2.15 | 0.71 | 3.02 | ** 0.0036 | |
| Parasite Diversity | 4.75 | 1.87 | 2.55 | * 0.0134 |
© 2018 by the authors. Licensee MDPI, Basel, Switzerland. This article is an open access article distributed under the terms and conditions of the Creative Commons Attribution (CC BY) license (http://creativecommons.org/licenses/by/4.0/).
Share and Cite
Vaidya, C.; Fisher, K.; Vandermeer, J. Colony Development and Reproductive Success of Bumblebees in an Urban Gradient. Sustainability 2018, 10, 1936. https://doi.org/10.3390/su10061936
Vaidya C, Fisher K, Vandermeer J. Colony Development and Reproductive Success of Bumblebees in an Urban Gradient. Sustainability. 2018; 10(6):1936. https://doi.org/10.3390/su10061936
Chicago/Turabian StyleVaidya, Chatura, Kaleigh Fisher, and John Vandermeer. 2018. "Colony Development and Reproductive Success of Bumblebees in an Urban Gradient" Sustainability 10, no. 6: 1936. https://doi.org/10.3390/su10061936
APA StyleVaidya, C., Fisher, K., & Vandermeer, J. (2018). Colony Development and Reproductive Success of Bumblebees in an Urban Gradient. Sustainability, 10(6), 1936. https://doi.org/10.3390/su10061936