Article

Zonation and Directional Dynamics of Mangrove Forests Derived from Time-Series Satellite Imagery in Mai Po, Hong Kong

1
Institute of Space and Earth Information Science, The Chinese University of Hong Kong, New Territories, Hong Kong 999077, China
2
Shenzhen Research Institute, The Chinese University of Hong Kong, Shenzhen 518000, China
3
Ministry of Education Key Laboratory for Earth System Modeling, Department of Earth System Science, Tsinghua University, Beijing 100084, China
4
Key Laboratory of Poyang Lake Wetland and Watershed Research, Ministry of Education, Jiangxi Normal University, Nanchang 330022, China
5
Guangdong Key Lab of Ocean Remote Sensing, State Key Laboratory of Tropical Oceanography, South China Sea Institute of Oceanology, Chinese Academy of Sciences, Guangzhou 510301, China
*
Author to whom correspondence should be addressed.
Sustainability 2018, 10(6), 1913; https://doi.org/10.3390/su10061913
Submission received: 8 April 2018 / Revised: 12 May 2018 / Accepted: 14 May 2018 / Published: 7 June 2018

Abstract

:
Mangrove deforestation is occurring globally at a rapid rate, and is causing serious ecological and economic losses on all scales. Monitoring mangrove changes is the first important step for mangrove management and conservation. Zonation of mangrove species (ZMS) is the predictable and discrete ordering of mangrove species caused by a unique, intertidal environment. Mapping the ZMS is critical to understanding the mangrove community at a species level. In this paper, the Standard Deviational Ellipse (SDE) was proposed as a method to evaluate mangrove species from a new dimension of directional changes. Three dominant mangrove species, Kandelia obovata (KO), Avicennia marina (AM), and Acanthus ilicifolius (AI), in Mai Po, Hong Kong were analyzed using SDEs based on the time series Système Pour l’Observation de la Terre (SPOT) and Gaofen-1 (GF-1) satellite images. The SDE results demonstrated that in the past 25 years: (1) The overall spatial extent of the mangroves in Mai Po expanded significantly, approximately from 150 to 350 Ha, and show a zonation pattern with a clear sequence of species perpendicular to the shoreline; (2) KO was the dominant species in most years, showing the strongest directional characteristic; (3) All three species zones have moved toward the north and west, as observed by the SDE centers. The SDE was proved to be a useful tool for understanding the temporal and spatial changes of mangrove zonation.

1. Introduction

Mangrove ecosystems are among the most productive ecosystems in the world, and play important ecological roles in the whole coastal ecosystem and global carbon cycle [1,2,3]. As the only woody, salt tolerant plants living in the intertidal areas along the tropical and subtropical coastline [1], mangrove forests provide nursery habitats for other associate faunal and flora assemblages, for instance bacteria, fungi, fish, crabs, shrimp, birds, mammals, and other mangrove associate plants, which together constitute the mangrove forest community. These mangrove communities provide commercial products like food, timber, fuel, and medicines for local residents, and act as a buffer which protects coastal regions from natural disasters and coastal erosion [1,3,4,5]. However, due to human activities such as urban development, aquaculture, mining, overexploitation, and costal landfill, mangrove forests have been continuously destroyed over recent decades in nearly every country where they exist [6]. For instance, once covering over 20 million ha globally, mangrove forests declined sharply to 15.2 million ha in 2005, a reduction of approximately 30%; they are still disappearing at a rate of 1~2% per year worldwide [6]. Considering the ecological and economic significance of mangrove forests, understanding their temporal changes is important for conservation efforts.
Due to intertidal gradients along the coastline, strong zonation patterns of mangrove species often occur [1]. It is important to understand the zonation of mangrove species (ZMS), which often contributes to the responses of individual species to variations in the degree of abiotic and biotic factors [7,8,9,10]. With the increasing spatial and temporal resolution of satellite technologies, changes of mangrove stands can be monitored at species level, and at a large scale [11,12,13,14]. Conventionally, most studies on mangrove dynamics focused on: (1) mapping mangroves and non-mangrove areas, and (2) analyzing mangrove area changes and mangrove fringe expansion or retreat. There are only a few studies on further spatial analysis of mangrove changes at a large scale. Weighted centroids were calculated to analyze mangrove spatial dynamics [15], but mangrove forest dynamics still cannot be fully understood using existing methods of estimation. More information describing the process of mangrove zonation changes, in terms of the spatial changes aspect, is needed. The application of remote sensing for mapping mangrove species requires high spatial resolution satellite data, making it challenging to assess mangrove zonation changes at a species level over long periods of time. Four types of mangrove species zones were classified using eight high resolution images taken between 2001 and 2014 [16]. However, according to our best knowledge, existing methods for studying mangrove dynamics using remote sensing mostly measured the surface area of mangroves, and analyzed their extent changes based on the classification of results. Only a few spatial statistic methods were applied for further analysis of how they change in terms of spatial distribution patterns. For instance, the weighted centroids and landscape metrics methods were applied to analyze the changes of a whole mangrove area in terms of mangrove community dynamics and patch characteristics [15]. In this study, we aim to evaluate mangrove zonation changes in new ways by applying Standard Deviational Ellipses (SDE), which can get directional information for each mangrove species, in addition to its area. Furthermore, an SDE was applied to study the directional changes of mangroves in Mai Po reserve of Hong Kong from 1991 to 2015.

2. Study Area and Data Sets

The study area is located in Mai Po Reserve, Hong Kong (Figure 1). Hong Kong covers an area of 1076 km2, with a subtropical monsoon climate [17]. The annual mean temperature is 23 °C (ranges from 0.2 to 36 °C), and the annual mean rainfall is around 2214 mm [18,19]. It has been regarded as a ‘Site of Special Scientific Interests’ since 1976, and was mentioned on a ‘List of Wetlands of International Importance’ under the Ramsar Convention, since 1995 [19,20]. Among all the mangroves stands, Mai Po Reserve is the largest mangrove area located in northwest Hong Kong, bordering Shenzhen City, China. According to the study of Tam et al. (1997) [19], the mangrove area in Hong Kong had been destroyed due to human activity in the few decades before 1997. Historically, Mai Po Reserve was used for shrimp farming ponds and fish ponds, and in the late 1990s, only about 15% of the original mangrove stands remained at the intertidal areas of Mai Po [21].
In the Core Zone of Mai Po marshes, a total of seven species of mangroves have been recorded, namely: Acanthus ilicifolius, Aegiceras corniculatum, Avicennia marina, Bruguiera gymnorrhiza, Excoecari aagallocha, Kandelia obovata, and Sonneratia apetala, among which Sonneratia apetala is an exotic species [20]. However, some species distribute individually or with very small area. For instance, most Excoecaria agallocha and Aegiceras corniculatum distribute with individual tree stands, and with a crown diameters of below 5 m, which are invisible at the spatial resolution of 10 m that was used in this study. Actually, only three species, Kandelia obovata (KO), Avicennia marina (AM), and Acanthus ilicifolius (AI), spread widely over the Mai Po reserve, can be identified by medium resolution satellite imagery [22]. Therefore, we focused on three dominant species in this study, KO, AM and AI. Additionally, there are groups of mixed species within one cell of 10 m, which is a common phenomenon associated with mixed pixels in remote sensing applications. Therefore, in this case, we can only identify the dominant species in each cell according to their spectral reflectance, due to the limitation of the spatial resolution of the satellite images.
SPOT 1 HRV, SPOT 4 HRVIR, SPOT 5 HRG and GF-1 images were used in this study from 1991 to 2015 (see Table 1). All the images were selected from the dry season of Hong Kong (November to February), in order to eliminate cloud contamination. Basic radiometric correction and geometric correction was conducted for all the scenes, using image-to-image registration, based on the SPOT 5 image in 2011 with a Universal Transverse Mercator (UTM) projection and World Geodetic System-84 (WGS-84) datum. All the SPOT data (of 20 m resolution) and GF-1 data (of 16 m resolution) were resampled to 10 m resolution. The co-registration adopted a polynomial transformation method, and the resampling was an interpolation process using the nearest neighbor method. We assumed that this resampling does not have a significant impact on the final mangrove species discrimination and statistical analysis.

3. Methods

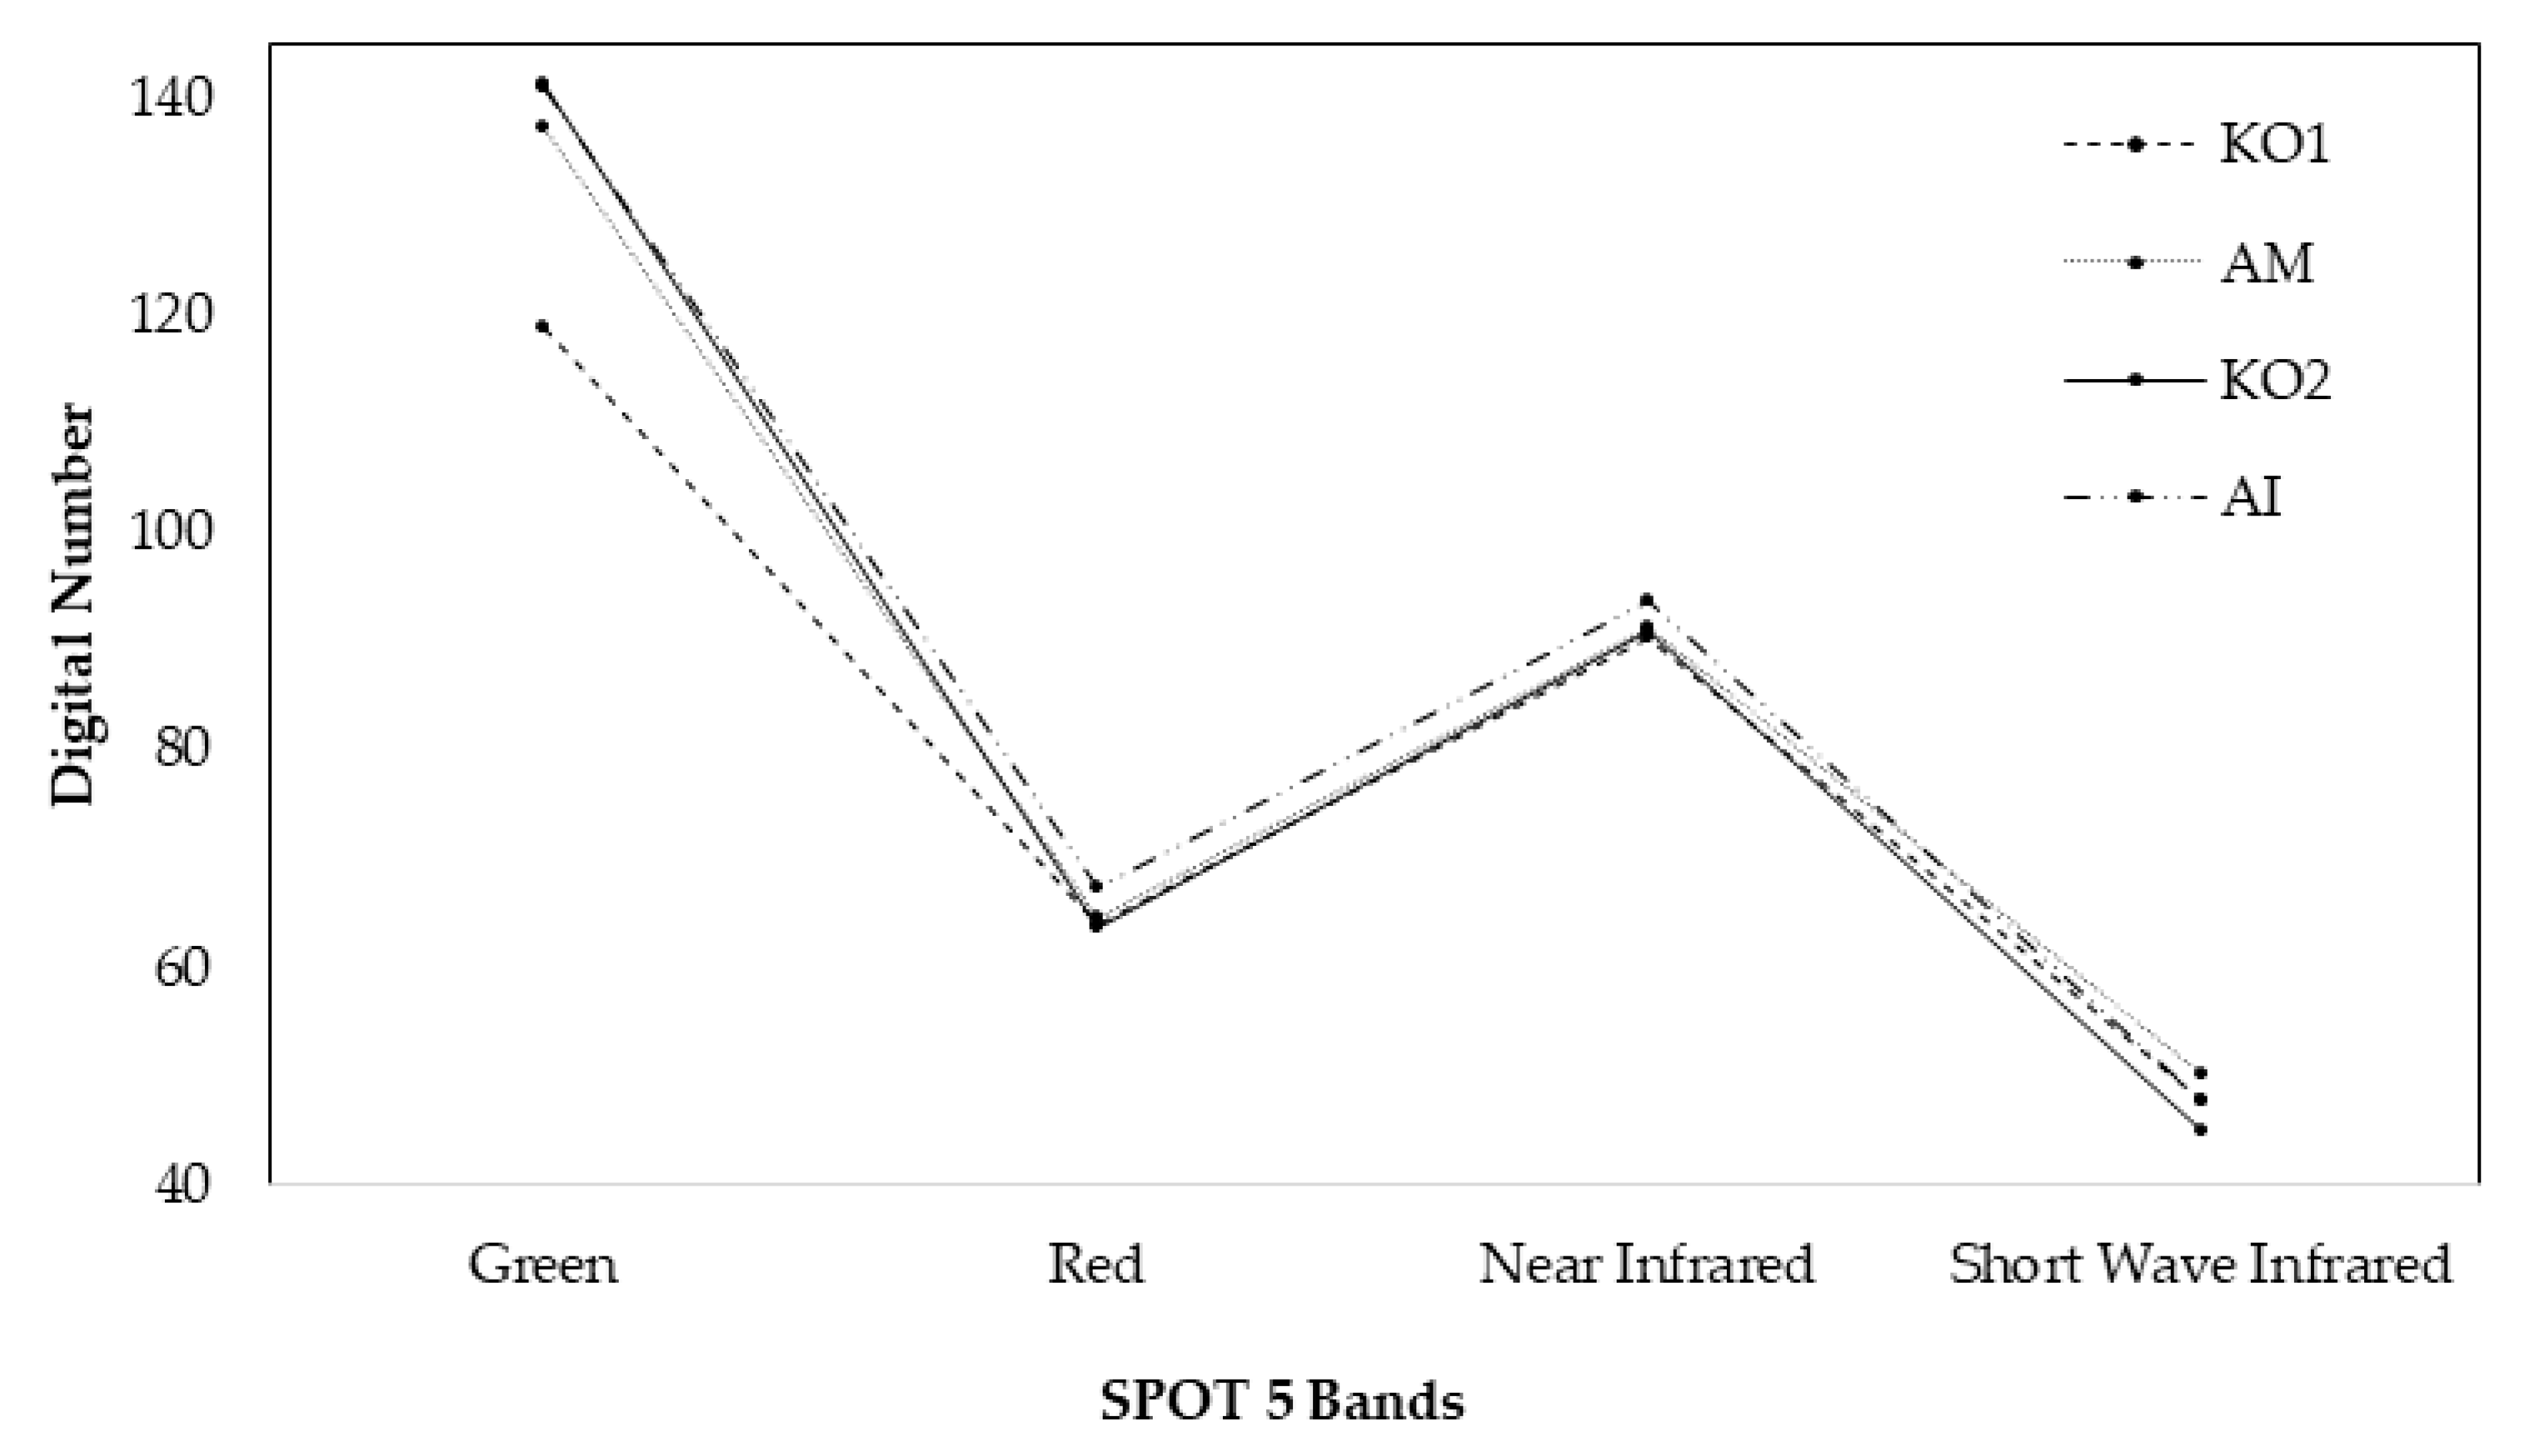
3.1. Mangrove Forest Classification on Species Level

In this study, we divided Kandelia obovata species into two classes: Kandelia obovata Group 1 (KO1) and Kandelia obovata Group 2 (KO2), since there are significant differences in their spectral reflectance. The trees of KO1 grow landward and appear taller and older, while those of KO2 grow seaward along the fringe margin, are markedly smaller and younger. Kandelia forests had produced such bimodal distribution since 1969, and were recorded as being bimodally distributed in recent times [23]. In order to illustrate the spectral differences of the various mangrove species, Figure 2 demonstrates the average spectral reflectance (digital number) of different mangrove species in the SPOT 5 image of 2011, based on the samples described in Section 3.3. The three species can be differentiated from the SPOT images with a spatial resolution of 10 m, although there are only four spectral bands. As shown in the figure below, although some species are almost totally indistinguishable in some specific bands, they differ in other band. Therefore, with a supervised machine learning technique, we can identify these slight differences from the samples, and then apply them to the remaining data sets.
The Support Vector Machine (SVM) and Artificial Neural Network (ANN), two popular supervised machine learning techniques, were selected to conduct the classification. In SVM, the Radio Basis Function (RBF) was selected as the kernel function. The parameter Gamma (G) in RBF and the parameter penalty (C) in SVM were selected empirically with a grid search procedure. Additionally, a one-against-rest approach was adopted to solve the multi-class task in this study [11]. In ANN, it was a multi-layer perceptron (MLP) feed-forward network. According to our previous experiment, the ANN was set to have one hidden layer. The number of nodes in the hidden layer was set according to Equation (1), where Nh denotes the number of nodes in the hidden layer, Ni is the number of nodes in the input layer, and No is the number of nodes in the output layer. Then, four mangrove classes (and aforementioned three species) KO1, AM, KO2, and AI were classified through SVM and ANN.
N h = I N T N i × N O

3.2. Directional Analysis Using Standard Deviational Ellipse

SDE is based on the average center of a set of discrete points, and the calculation of the standard distance of other points away from the average center separately in the x and y directions. For each output mangrove species classification result, spatial statistic method SDE was used for further analysis [24,25]. One standard-deviation was set for the ellipse size, which includes 66% of the species result. The mean centers of the set of n units of pixels of each species class were calculated as:
( x ¯ = 1 n i = 1 n x i , y ¯ = 1 n i = 1 n y i )
The standard deviation of the x coordinates (rotated by angle θ) was calculated by the Equation (3), where θ refers to the azimuth of the ellipse, which is the rotation; σ refers to the standard deviation, xi and yi refers to the distance of the point i away from the average center separately in the x and y directions.
σ x θ = σ y ( θ ± π / 2 ) = 1 n ( cos 2 θ i = 1 n x i 2 + sin 2 θ i = 1 n y i 2 + sin 2 θ i = 1 n x i y i )
The ellipse was expressed by Equation (4), where σmax and σmin refer to the maximum and minimum values of the standard deviation of the x coordinates. Moreover, temporal analysis was applied on the area of each mangrove species and directional parameters of the calculated ellipses of each mangrove species, including the rotation angle, flattening, standard deviation on x and y directions: σxθ, σyθ. Flattening of the ellipse is calculated via Equation (5).
x 2 σ max 2 + y 2 σ min 2 = 1 .
F l a t t e n i n g = σ min ÷ σ max

3.3. Validation and Accuracy Assessment

Reference data were collected via field surveys from Agriculture, Fisheries and Conservation Department (AFCD), Hong Kong government (from 2004 to 2007), and from our field validation data (in 2013, 2015 and 2016) and Google Earth high spatial resolution images (Table 2). Field data were collected with the support of Real Time Kinematic Global Positioning System (RTKGPS), which has an accuracy of <1 m. The field data offered by AFCD recorded dominant species in each survey point; these are internal government data which cannot be published. The field work data conducted by us recorded the up-canopy species in each survey point. In addition, Google Earth high-resolution images were taken as reference data to assist in judging the species types of the samples. The field data were still not satisfactory, but this is the most complete field validation data we could obtain in this area during the research period. We believe that this dataset is of great value for studying mangrove dynamics in this study area. However, since it is a multi-temporal study of the long-term mangrove changes with a post-classification analysis strategy [26], it is difficult to collect multi-temporal reference datasets. Therefore, we employed the multi-temporal, very high-resolution satellite images from Google Earth, to which we applied visual interpretation, aided by the government data and literature data. Table 2 lists the details of the reference data. Finally, testing samples were selected from the samples based on our field survey, Google Earth high-resolution imagery, and literature data [20,23,27], and separated from the training samples. The accuracy was then assessed by the producer’s accuracy, the user’s accuracy, and the overall accuracy with the Kappa coefficients based on the confusion matrix.

4. Results

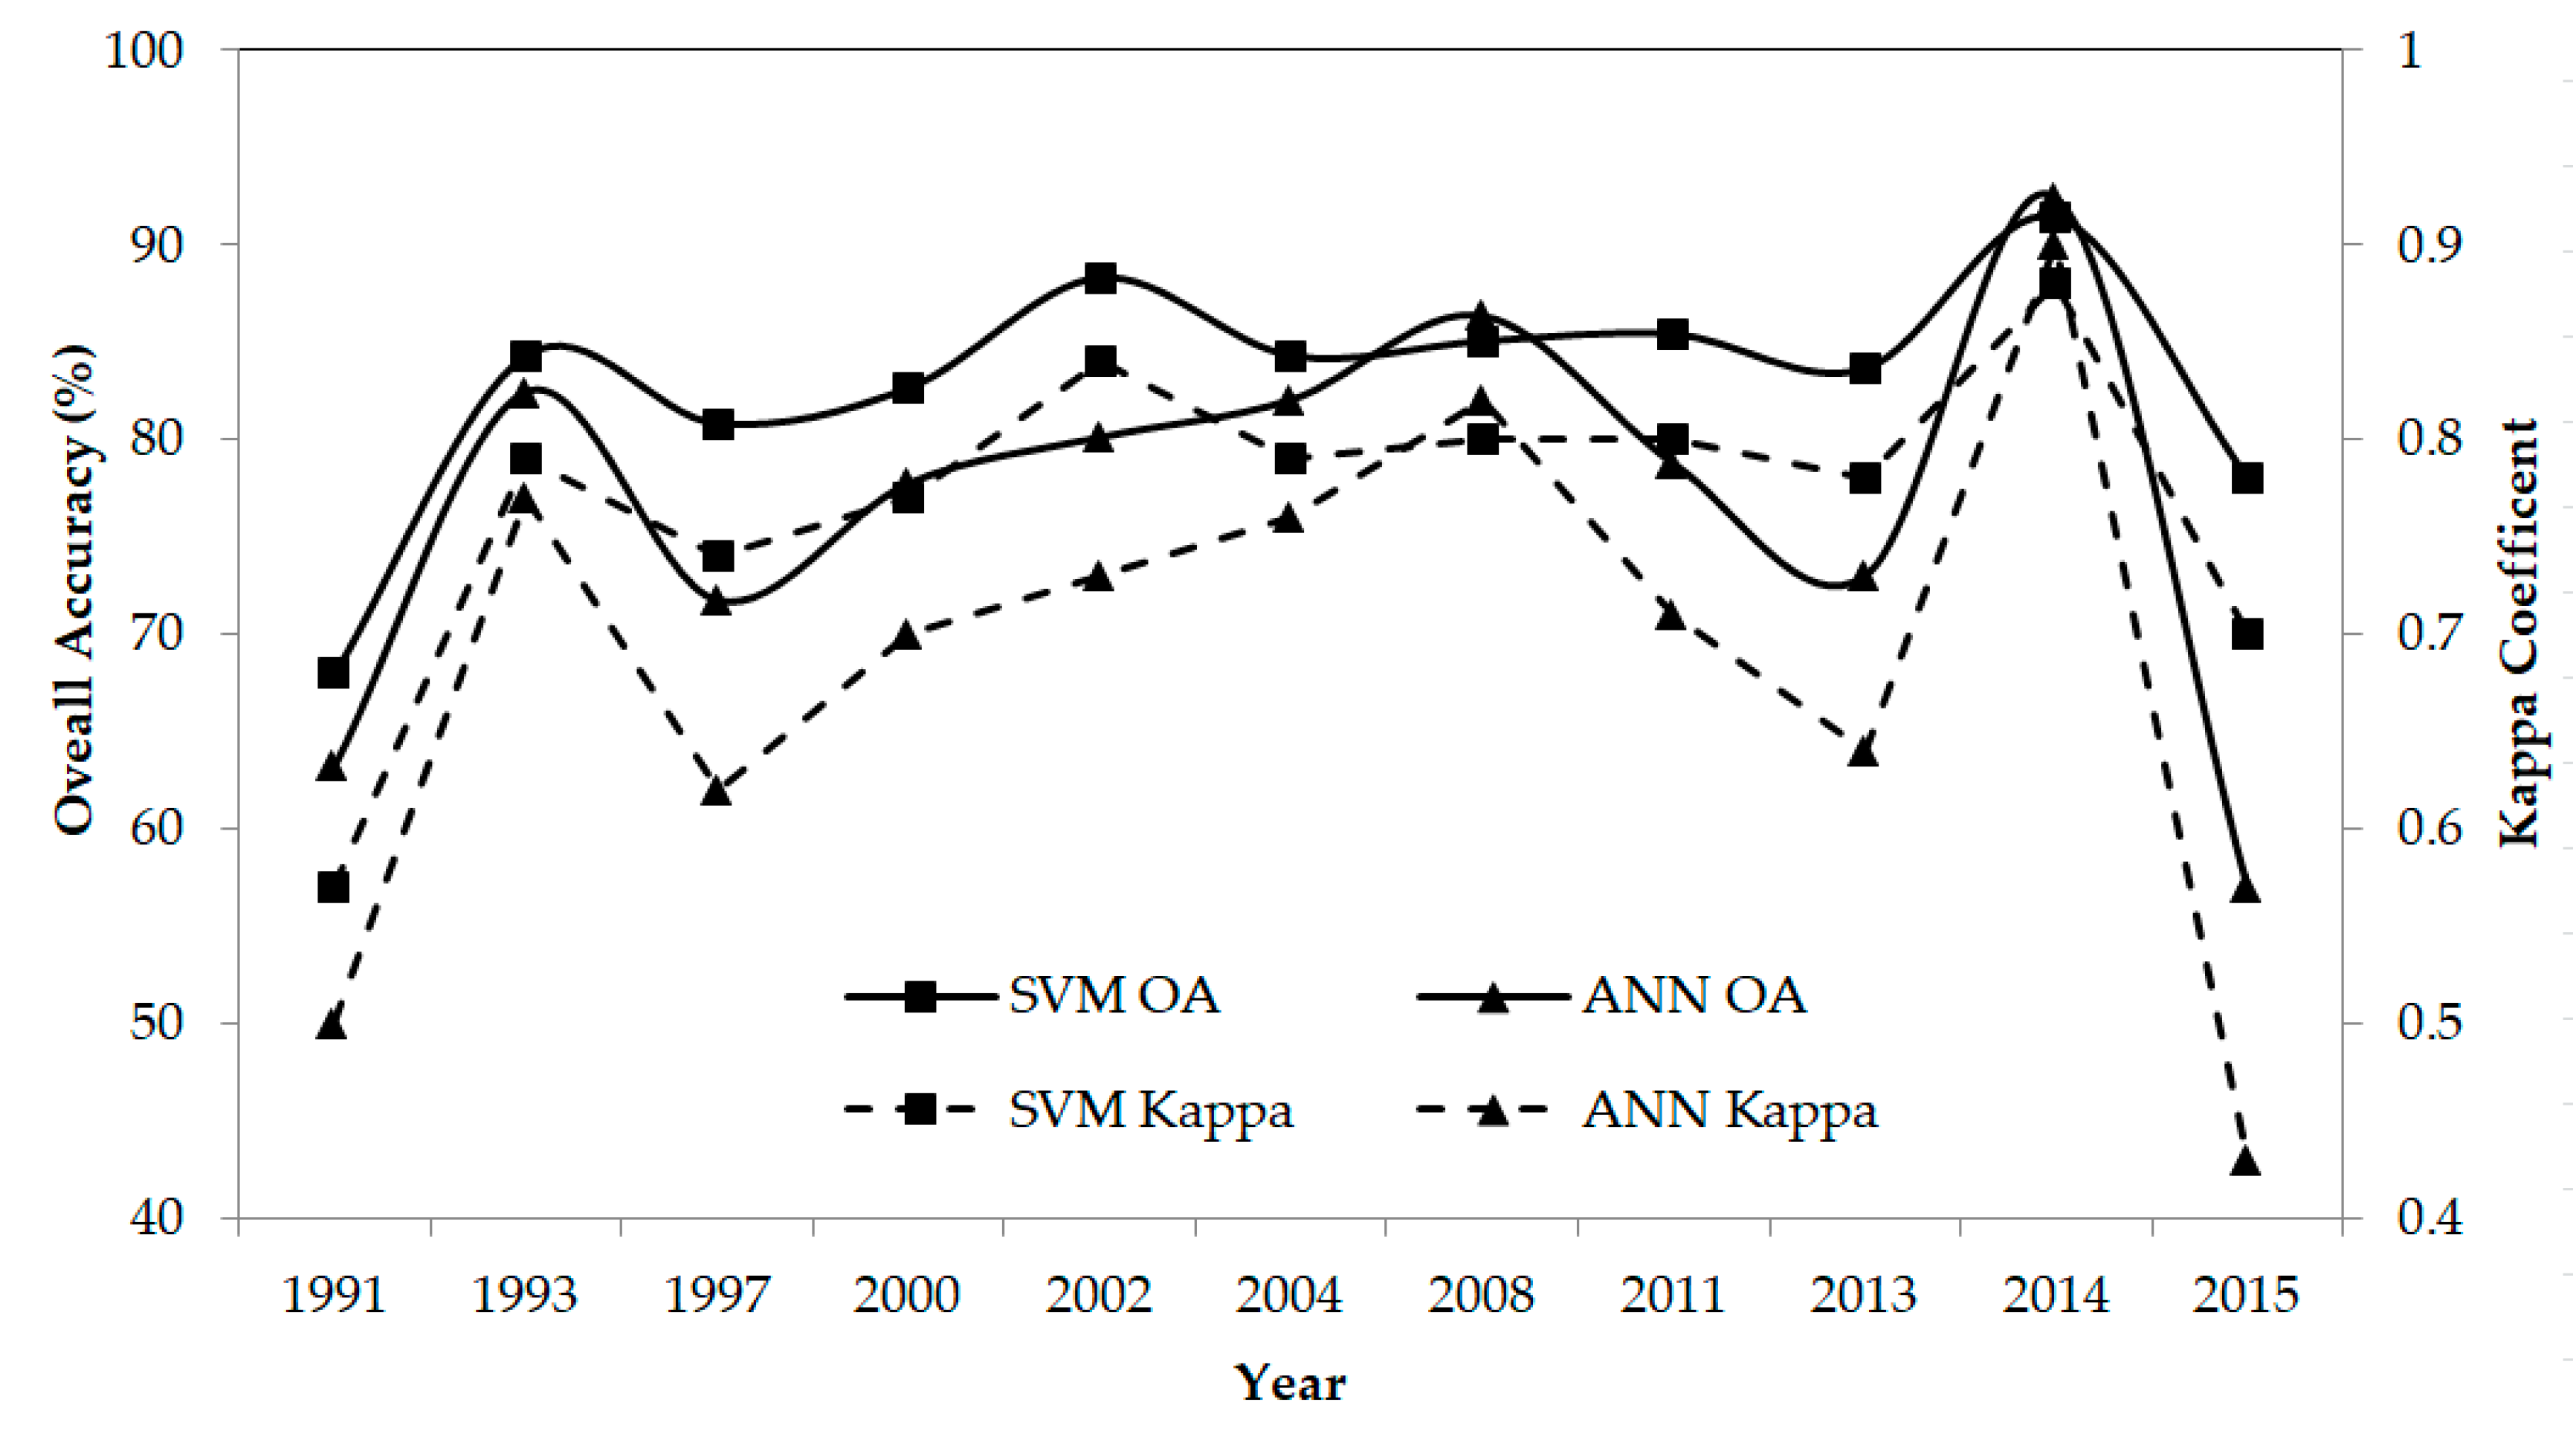
4.1. Accuracy Assessment of the Mangrove Species Classification

Accuracy assessment was conducted for the classification results of all 11 images from 1991 to 2015 (Figure 3). The classification accuracies are consistent through the years for both SVM and ANN. SVM generally obtained slightly higher accuracies than ANN. For SVM, the overall accuracy (OA) of these images ranged from 67 to 92%. Most of the OA ranged from 80 to 90%, except for the years 1991, 2014 and 2015, for which the OA was 67.98%, 91.42%, and 78.03%, respectively. The Kappa Coefficient (KC) of these images ranged from 0.57 to 0.88. Most of the OA ranged from 0.70 to 0.80, except for the years 1991 and 2015, for which the Kappa Coefficient is 0.58 and 0.88, respectively. For ANN, the OA ranged from 63 to 92%, mostly ranging from 70 to 90%, except for 1991 and 2015. The KC ranged from 0.64 to 0.90 for most of the years except 1991 and 2015.
In order to investigate the species confusions in details, the confusion matrix was presented for the SVM classification results, as shown in Table 3. Generally, KO1 and AM were classified more accurately across all years, while KO2 and AI were easier to confuse with other species in different years. The producer’s accuracy (PA) and user’s accuracy (UA) both indicated this phenomenon. First, KO2 was confused with AM and KO1 in 1991, 1993 and 1997. One of the main reasons for this was that KO1 and KO2 belongs to the same species, but different groups, due to their spectral reflectance. The experiment also indicated that KO1 and KO2 were significantly different regarding their spectral reflectance, since KO1 was confused much less often with other mangrove species. Secondly, AI is another species that was easily confused with species such as AM and KO2, which is consistent with our previous experiment using optical satellite images [11]. The reason may be that the tree height of AM, KO2 and AI is similar, while KO1 is much taller than other three classes. Furthermore, the results indicated that classification using SPOT 5 was better than SPOT 1, SPOT 4 and GF-1, with less species confusion and higher accuracy in PA, UA, OA and KC.

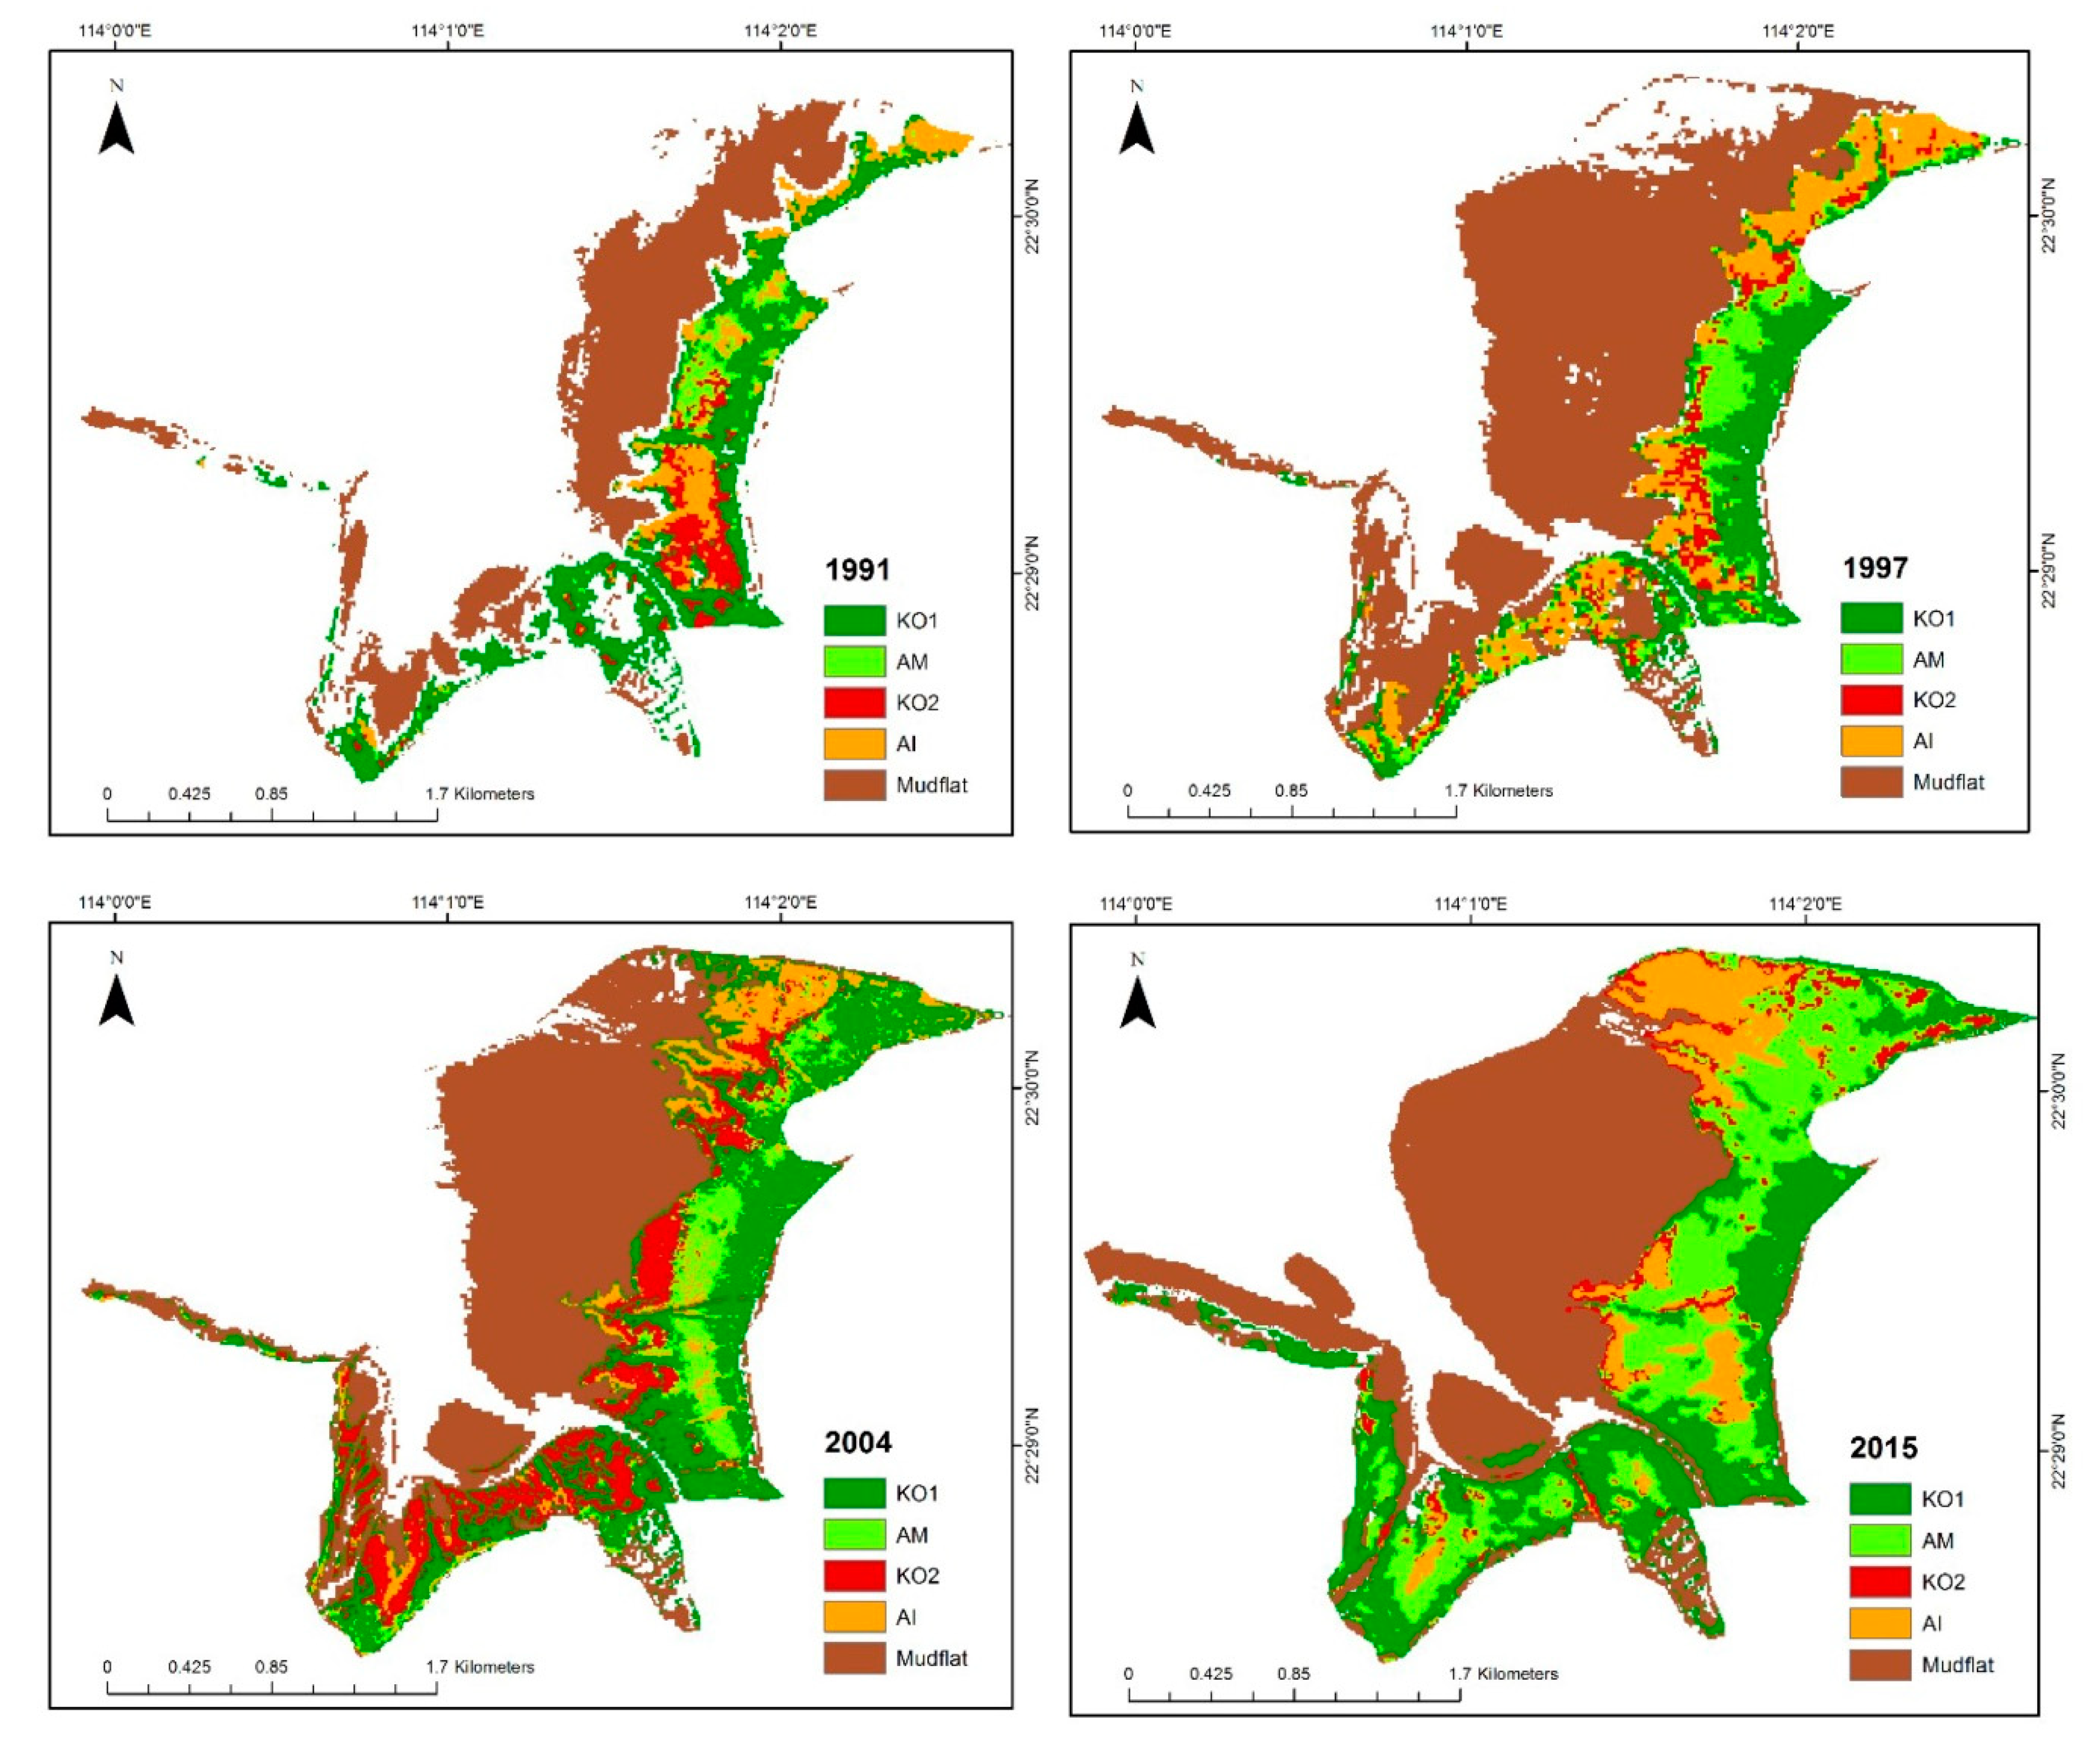
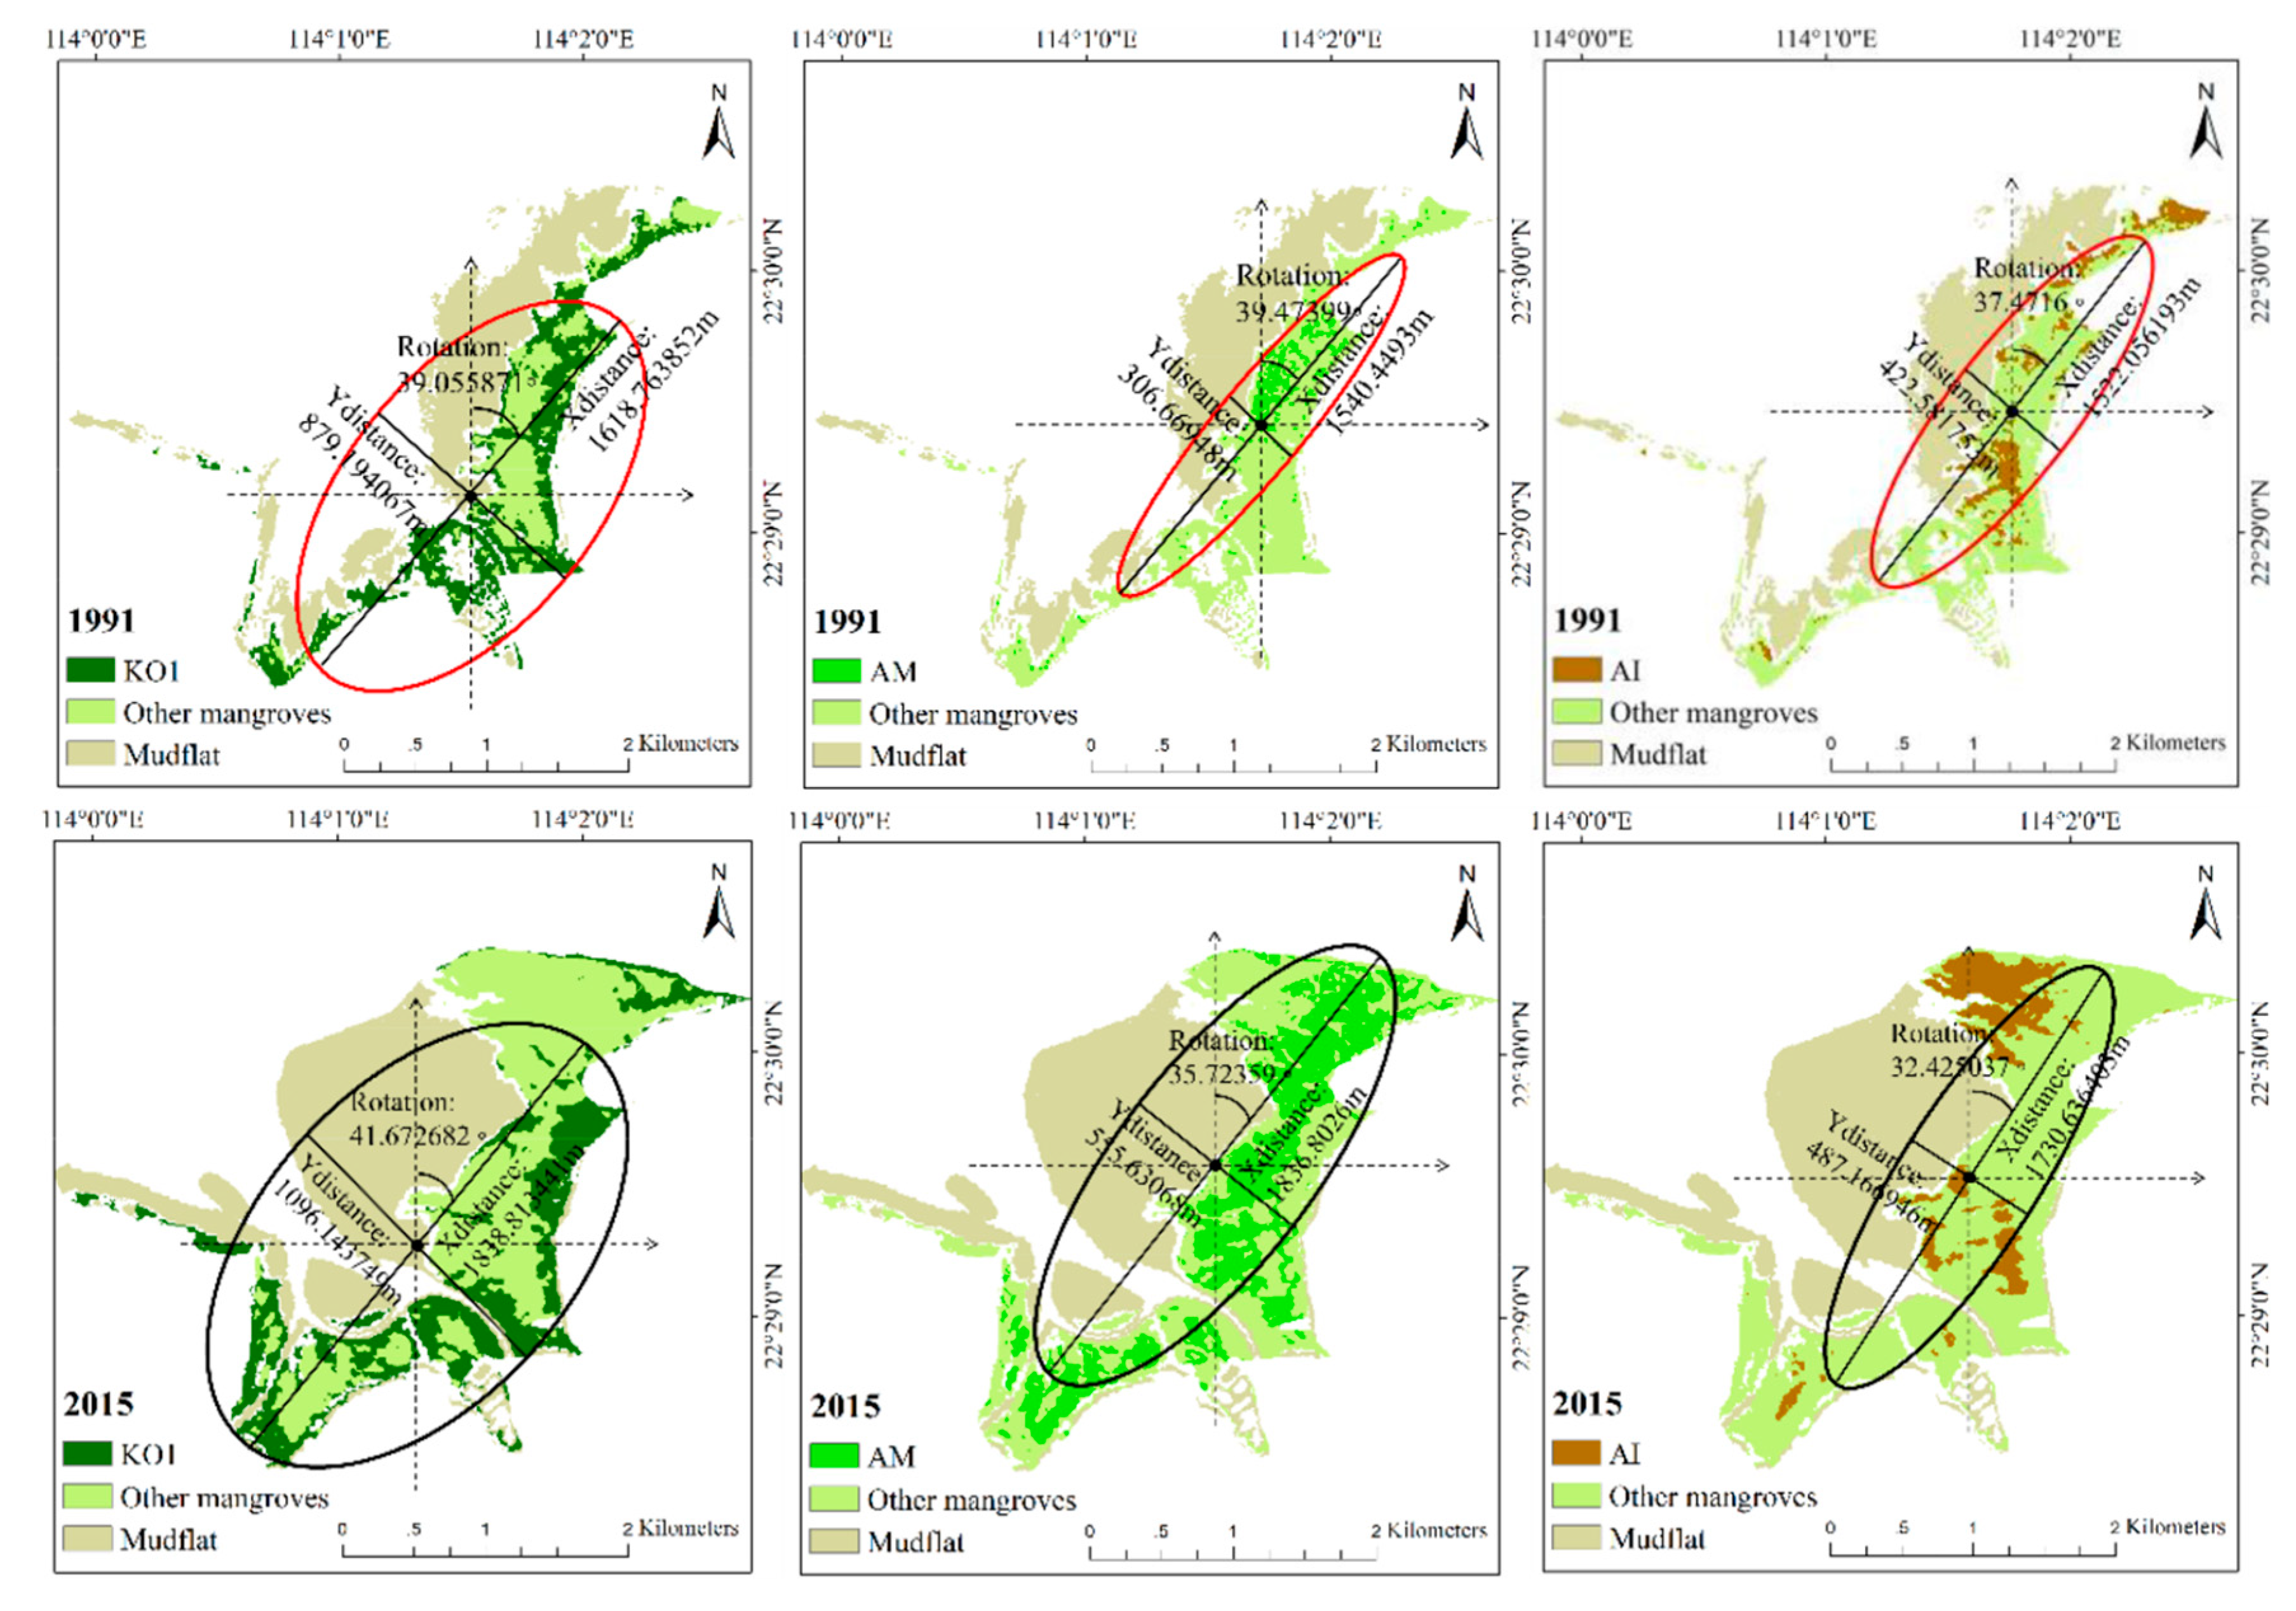
4.2. Mapping Mangrove Zonation in the Last 25 Years

Since SVM obtained higher classification accuracy, the zonation analysis was based on the SVM results. Zones of four classes of mangrove species have been mapped for all the 11 scenes of images. Four classification results are shown in Figure 4. Mangrove trees in Mai Po Nature Reserve have shown a clear sequence of species zonation pattern that is perpendicular to the shoreline in the past three decades. Generally, during most of the past 25 years, there has been a sequence of three banded zones perpendicular to the shoreline, dominated by KO1, AM, and KO2, respectively, from landward to seaward. The AI species zone tended to distribute more flexibly between the middle and seaward zones. The zonation pattern of mangrove species tended to be relatively stable on the landward side, whereas a general trend of zonation changes was observed around the seaward fringe. As the mangrove expanded toward the sea, initially, the AI species tended to be the pioneer species, occupying mudflats at the mangrove fringes. Subsequently, the AI species zone was taken over by KO2 as the expansion continued. Finally, most of the KO2 grew up and became KO1, while AM species remained stable. The total area of mangrove has increased by around 200 Ha in the past 25 years, and KO1 has witnessed the largest increase among the three species.
The mangrove forests in Mai Po Reserve have been gradually increasing in size since the 1990s, especially since 1995, when Mai Po was listed as a Wetlands of International Importance. As demonstrated by the results, the mangrove forests in Mai Po have increased by around 200 Ha in the past 25 years (Figure 5). To demonstrate the mangrove increasing contributions, Figure 5 illustrates the areal changes of different mangrove species in Mai Po, where ANN and SVM show consistent patterns of the mangrove changes. It can be seen that KO1 made the major contribution through the whole study period, while other species demonstrate a fluctuation pattern during the period, with a slight increase.

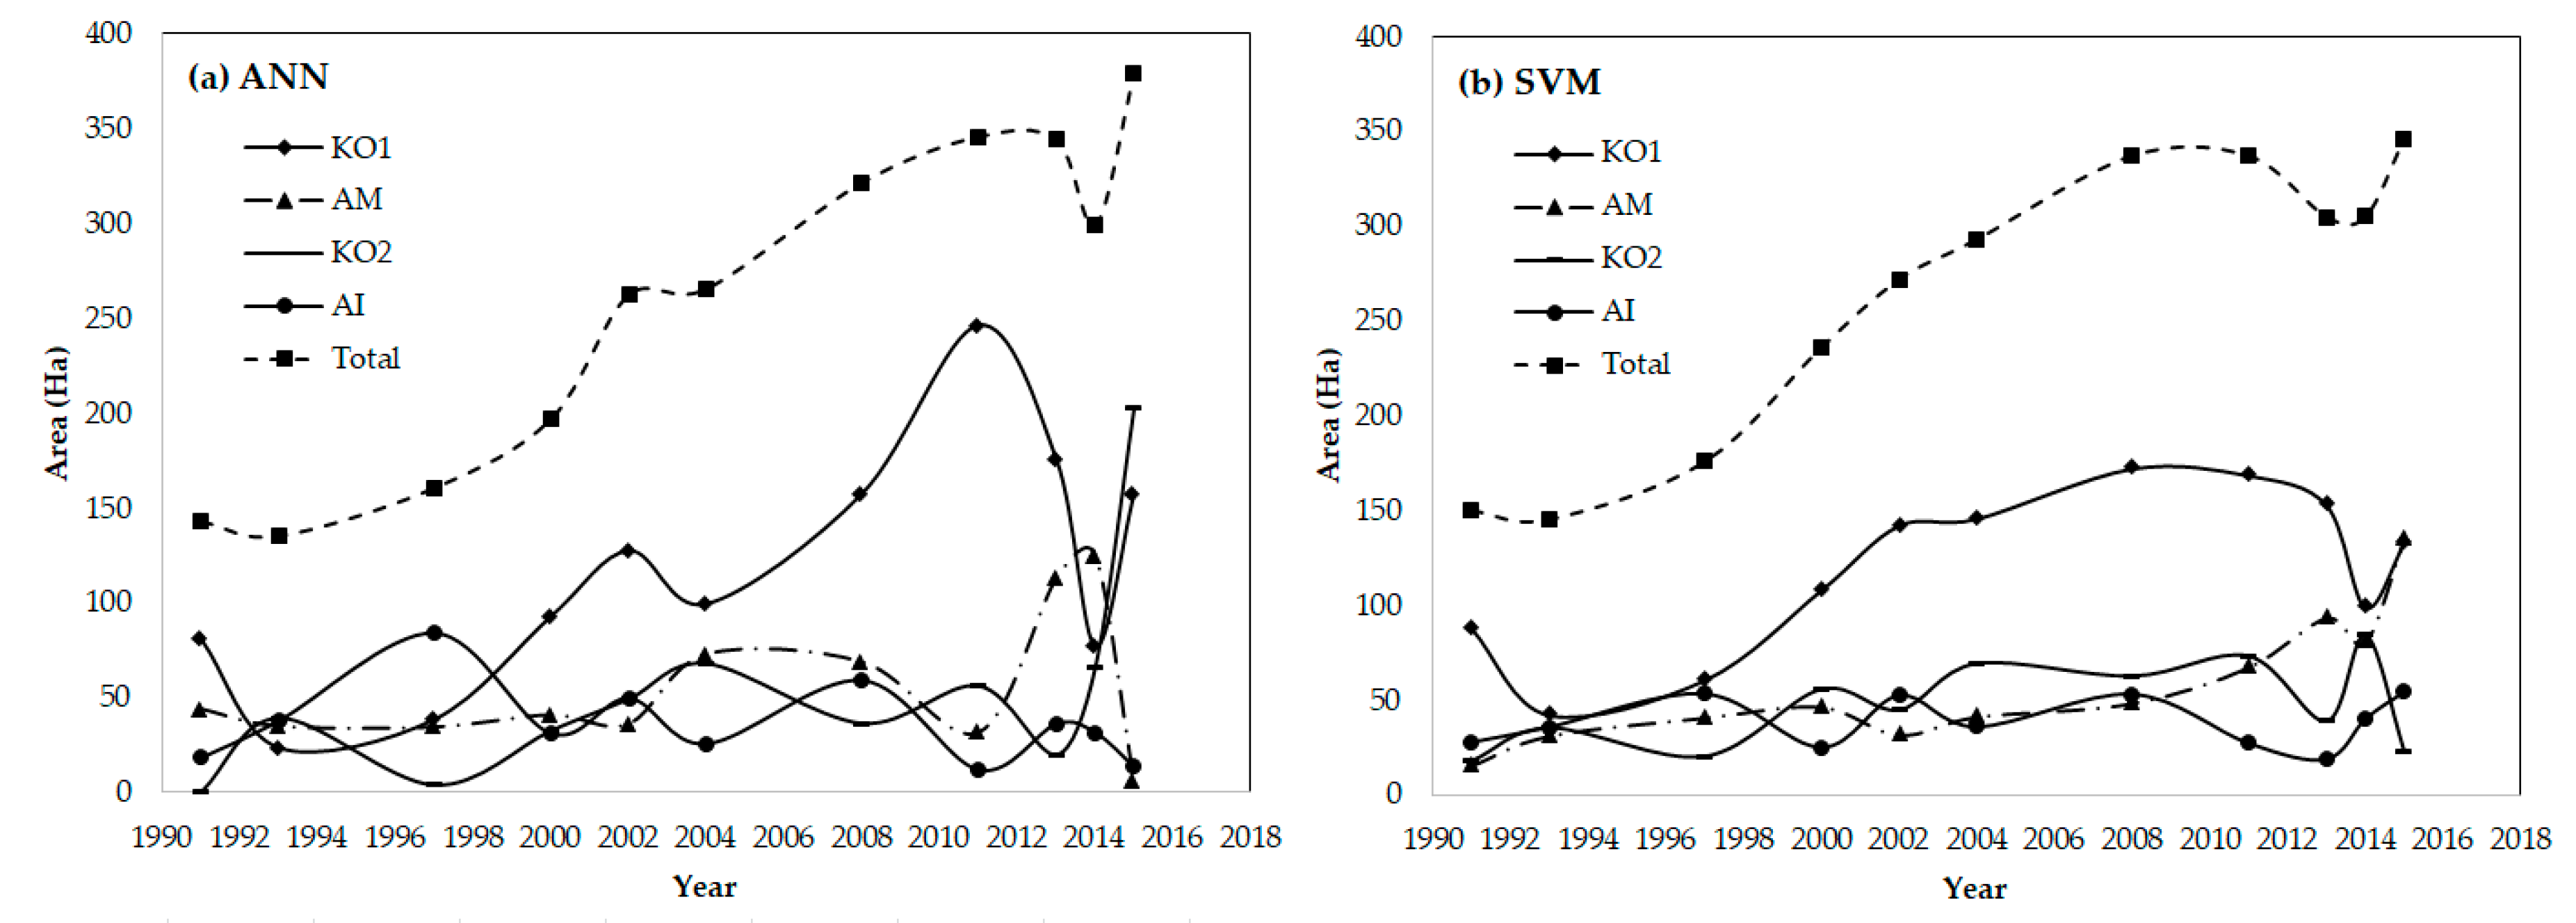
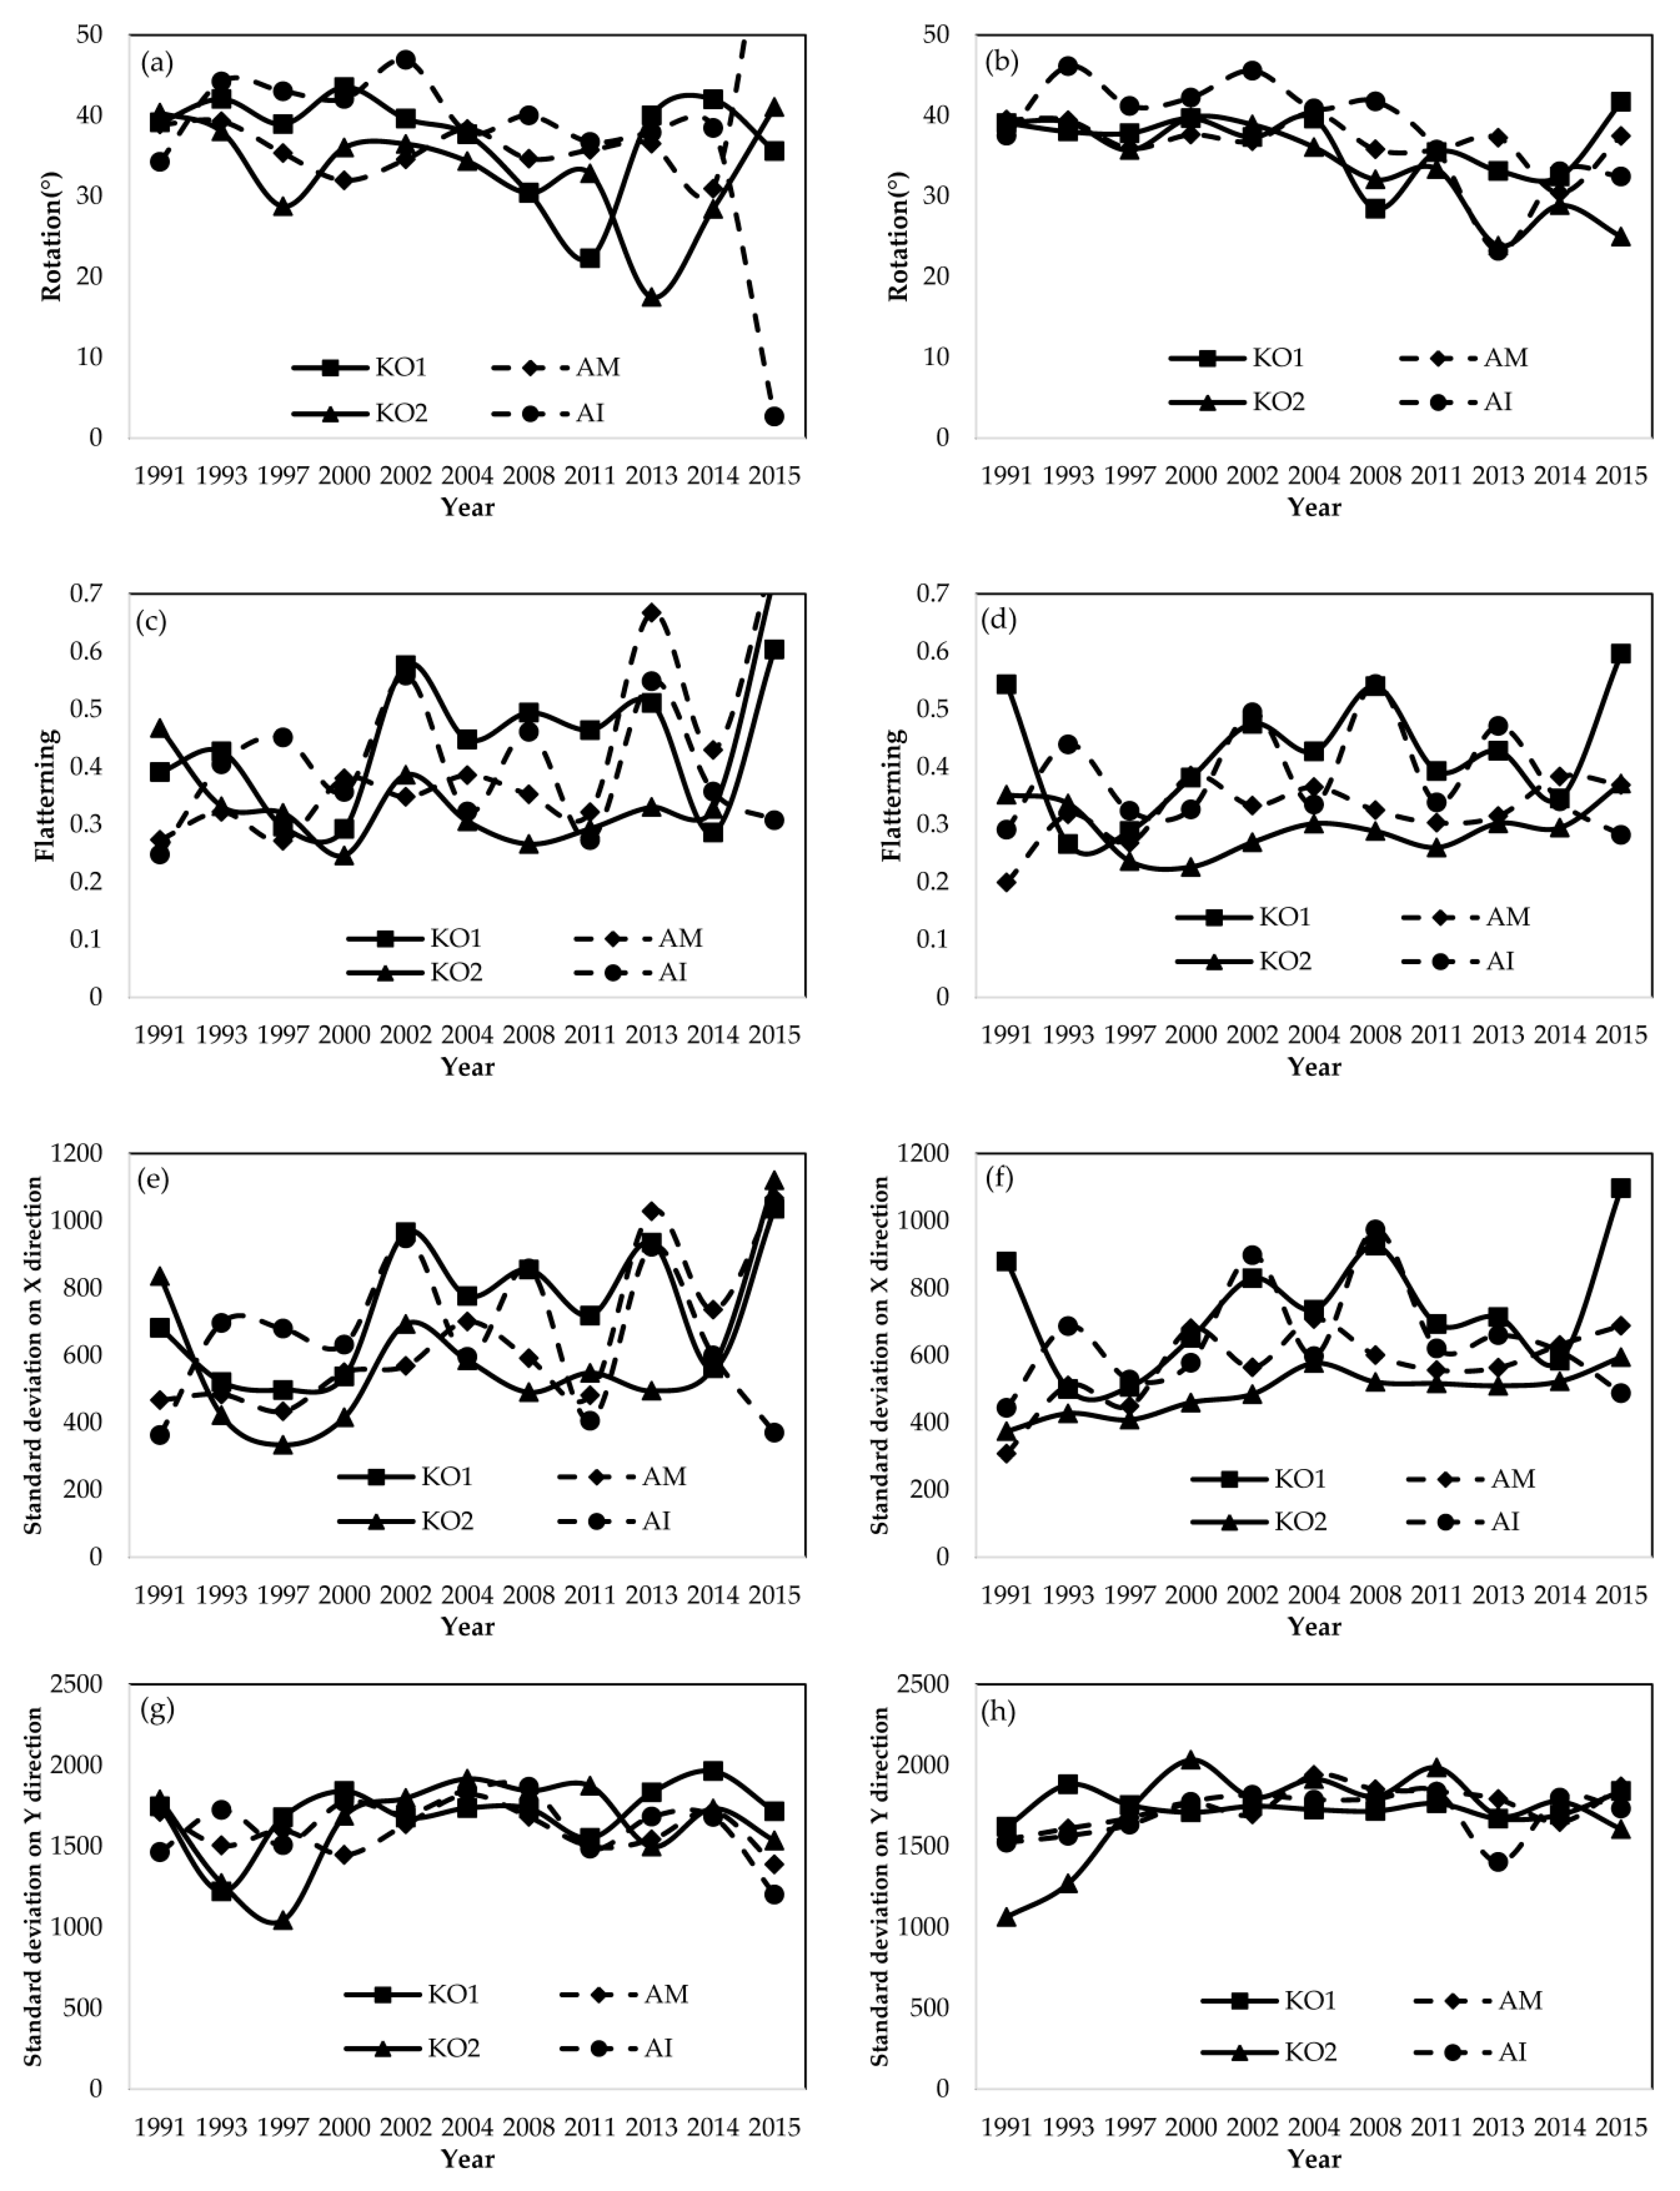
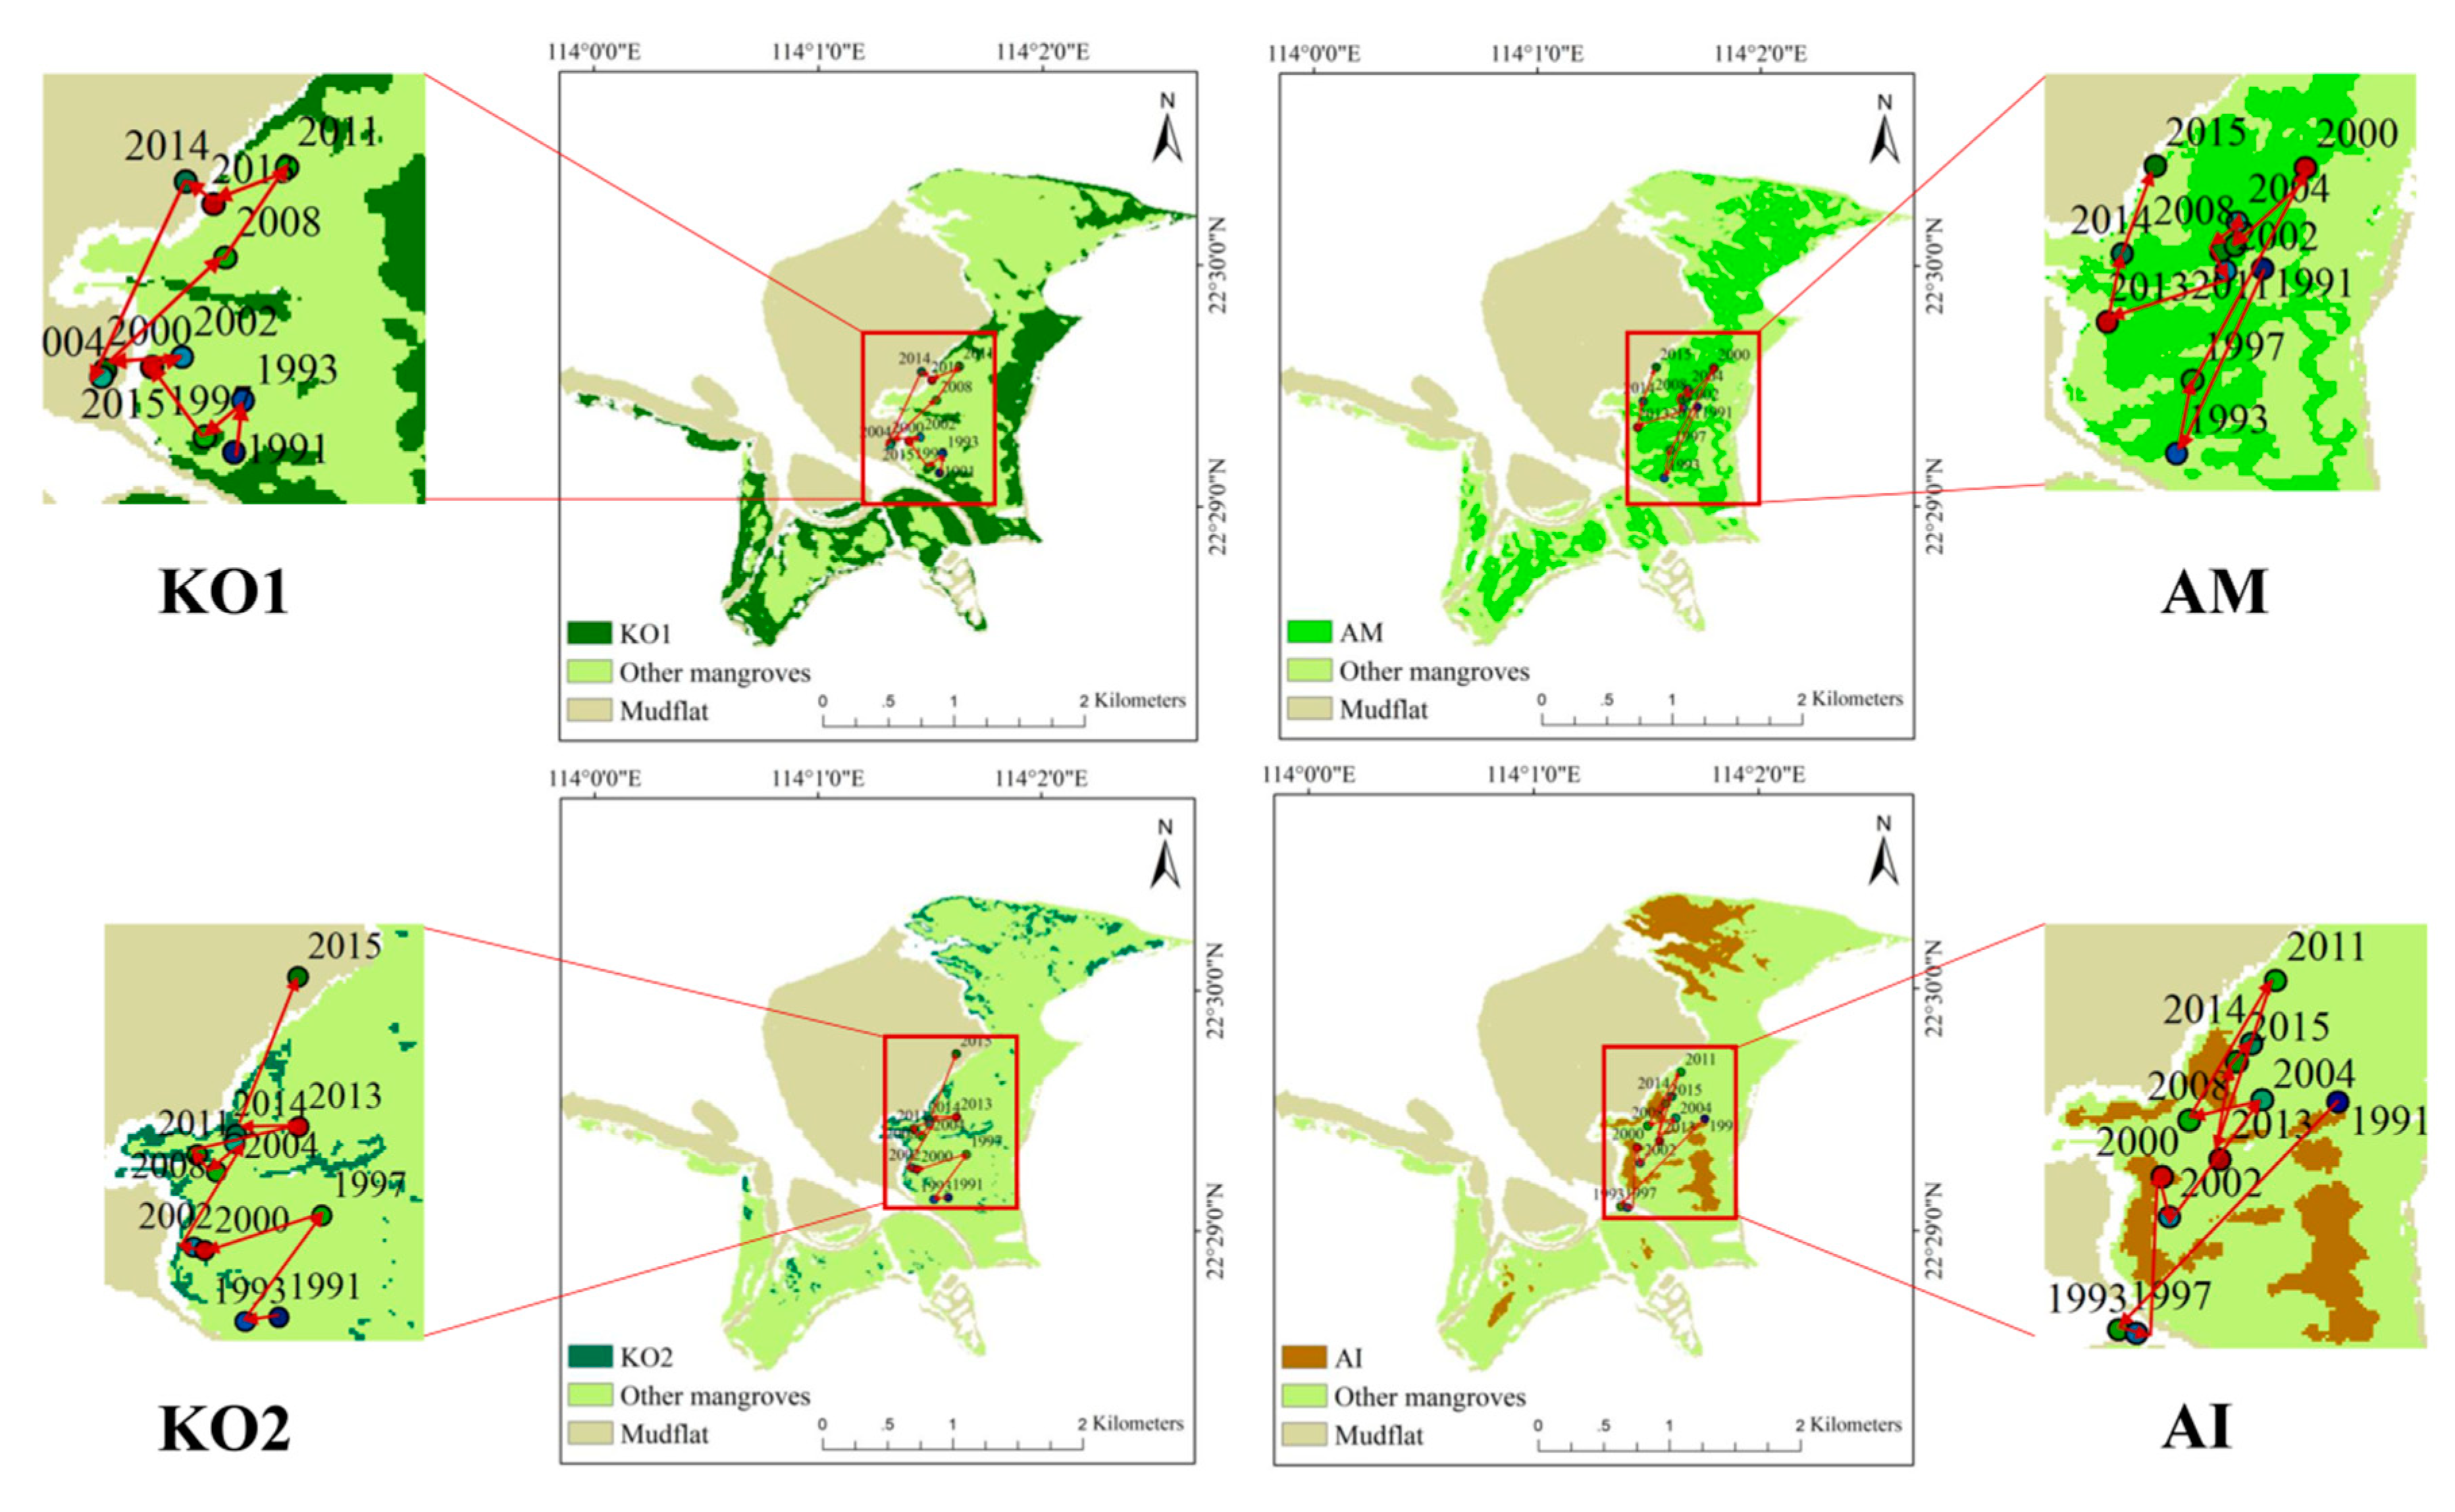
4.3. Temporal Dynamics on Directional Development at Species Level

The directional changes of the three mangrove species zones derived from ANN and SVM during the past 25 years are partly selected and shown in Figure 6 and Figure 7. ANN and SVM demonstrated a generally consistent pattern for all the directional parameters. Firstly, the rotations of the three species in the past 25 years remained in a fixed direction, ranging from 32° to 41°, which shows that the three species of mangrove in Mai Po were distributed in a northeast-southwest direction during the study period. Secondly, the KO1 and AI classes show an overall higher flattening than AM and KO2, indicating that KO1 and AI classes tend to distribute more directionally along the shoreline. The flattening values indicate the level of directionality in which a set of points or areas were distributed. Higher flattening of KO1 and AI indicated that they tend to distribute along a certain direction more significantly, which could have be due to other environmental factors, such as the topography of seashore and movements of tides. Correspondingly, lower flattening of AM and KO2 indicated that these two classes tend to distribute more irregularly in a scattered way, i.e., without strongly directional features. Thirdly, for the standard deviation in X direction, KO1 and AI classes tend to have similar changing patterns, whereas AM and KO2 tend to be more alike. The temporal change of deviation of AM and KO2 shows a smoother pattern. KO2 shows the lowest deviation value in all the studied years except 1991. Fourthly, for all three species, the standard deviation in the Y direction remained in the range from 1500 to 2000 m. The deviation of the KO2 tended to fluctuate most, with a low of 1062.25 m in 1991 and a high of 2031.80 m in 2000. These results show that KO1 and AI classes distributed in a relatively larger area in Mai Po, whereas AM and KO2 tend to be restricted to a smaller area. KO2 shows the smallest distributed area.
There is a similar northwestward or northeastward moving trend of the centers of the four types of species during the past 25 years (Figure 8). The overall moving trend of the center of KO1 species in the past 25 years is toward a northwest direction, from the riverbank in the south of the major region to the seaward fringe. The KO1 center moved in a northwestern direction from 2004 to 2011, and then went back toward the southwest until 2015. The overall moving trend of the center of AM species in the past three decades is also in a northwest direction, from the middle area of the major region to the seaward area. The overall moving trend of the center of the KO2 in the past 25 years is toward the north, from the riverbank in the south of the major region to the boundary of the major and top regions of the mangrove forests. During the moving process, the KO2 center oscillated in an east-west direction. The overall moving trend of the center of the AI species is toward the northwest, from the middle area of the major region to the seaward area, which was the most intricate one. The shift of the mean centers indicates the spatial changes of the overall growing direction. The overall moving trend of the mean centers of the three species were towards the sea, as well as to the north, which means that in the seaward and north direction, they tend to expand the most, and reduce the least. This shift may indicate potential relationships with the expanding direction of the mudflat and the hydrologic movement direction in the estuary. However, the friving factors for this shift are hard to analyze based only on remote sensing data. Multi sources of data, such as hydrologic and biological data, are needed for future studies.
The results of the changes of SDE parameters indicated the spatial changes feature of each species during the past 25 years, which show us the changing process of the mangrove zonation patterns during this period. Moreover, these results show potential relationships with the competition and succession process of the three mangrove species types, as well as the biotic and abiotic driven factors in this study area.

5. Discussion

5.1. Discussion on the Driving Factors of Mangrove Changes

Which factors have lead to the expansion of mangroves in the past 25 years? Regarding both the natural environmental and anthropogenic impacts, several should be considered.
Firstly, Mai Po reserve has been well protected since 1976, and has been listed as an internationally important wetland under the Ramsar Convention since 1995 [19,20]. Local government has issued a strict access policy for local citizens and scientists, in order to minimize disturbances to wildlife. Moreover, the core zone is located on the boundary between Mainland China and Hong Kong, for which access to the core zone requires permission from the Immigration Department of the Hong Kong government. Mangroves require a disturbance-free period to establish roots in order to protect themselves from waves and strong currents [10,28]. Since the whole Mai Po reserve was under good protection, mangroves in Mai Po grew without much influence from human activity during the study period, which is an important anthropogenic factor effecting the expansion of mangroves in the recent 25 years.
Secondly, the rapid expanding of mudflat in Mai Po offered the required habitat for mangrove seedling establishment. The Mai Po reserve is located in the mouth of Pearl River Estuary (PRE), where the delta has undergone the most rapid urbanization in the world over the past three decades. This urbanization process generated a large amount of sediments which were flushed into the river, and uplifted the sea bed in PRE region. A large quantity of fine sediment and organic material is brought down from the Pearl River and other rivers in the Deep Bay area, which slowly accumulated in the new mudflat in this area [29,30]. In 1990s, the average sedimentation rate in the Deep Bay area rapidly increased, probably due to soil runoff caused by deforestation and coastal reclamation projects [29,31]. Man-made drainage modifications and maintenance dredging of the Shenzhen River, which is the major river source of the Deep Bay area, may also be related to the observed sediment accumulation. With the newly formed mudflat, the seedlings of mangrove species were able to grow. KO is the dominant mangrove species in Mai Po, which spreads along the coastal line and grows seawards. Therefore, the newly built mud flat was better suited for KO stands. Moreover, as the new mud flat is located to in northwestern of Mai Po, KO1 has been spreading in a northwestern direction.
Thirdly, studies have shown that the hydroperiod is a key factor influencing the zonation change of mangrove communities. Hydroperiod changes can significantly alter the ecological space of the dominant species [32,33,34]. If the hydroperiod increases, available oxygen to roots will be reduced, and phytotoxins will build up during inundation period. Then, mangrove growth will be affected [32,35,36,37]. According to the sea level observation data of Tsim Bei Tsui station (22°29′ N, 114°01′ E) located in Mai Po reserve, from 2004 to 2011 [38], the monthly average sea level tends to fluctuate less than before, and have longer durations over 0 m, which may alter the hydroperiod in this area. Moreover, mudflat expansion may cause surface elevation increase, which may also influence the time of inundation. The zonation change in the Mai Po mangrove community may be related to this hydroperiod change.
In addition, a small portion of Sonneratia apetala (SA) may also contribute to the increasing trend. SA is an exotic species from Bangladesh, and has been found in Mai Po since 2000, while it was controlled by the local government, with removal operations from time to time [15]. These SA stands grow dispersedly in Mai Po, instead of growing in large groups as KO, AM and other native species do. The individual SA species are difficult to identify at 10 m resolution in this study, since they are relatively small. Therefore, SA species were not classified in this study. The spreading of exotic species such as SA can contribute to the total growth of mangrove community, while the contributions from SA should just take a very small proportion due to their relatively small population and frequent removal by the local government. Inter-species competition may also be a reason for zonation changes in the mangrove community [32]. As very fast-growing and competitive exotic species, SA poses a potential risk to displace native species and alter the zonation pattern in Mai Po reserve, which needs to be further studied.

5.2. Comments on the Sustainable Development of Mai Po Reserve

The Mai Po reserve in Deep Bay is a unique natural reserve located in the Hong Kong Special Administrative Region, where the social economy and urbanization is highly developed. In this region, the interactions between human beings and the natural environment have become more and more intense. Due to the limited coastal land area and rapid development of industry and population, mangrove stands were continuously threatened by urban development, and part of the mangrove stands in Hong Kong experienced a rapid decline [19,29]. The importance and vulnerability of mangroves communities in Hong Kong led to the awareness of the local government and public. Since Mai Po has been well protected by the Hong Kong government since 1976, and has received international attention from the Ramsar Convention since 1995, mangroves in Mai Po have been observed to be continuously expanding [15,29]. The conservation and management work by the Hong Kong government in Mai Po Reserve contributes to the sustainable development of both human society and the natural environment.
The continuous expansion of mangroves in the Mai Po reserve shows the progress that has been achieved by conservation and management, which has greatly improved the biological diversity of costal ecosystem in the Deep Bay area. However, at the same time, the expanding mangroves have also caused potential negative effects to human society by, for example, reducing the drainage capacity of rivers, and increasing flooding risks in nearby urban areas. To deal with this issue, Drainage Services Department (DSD) and AFCD of Hong Kong have carried out mangrove pruning projects in certain area in Mai Po reserve, in order to reduce the threat of expanding mangroves to urban areas. Effective conservation and management of the mangrove reserve is essential for sustainable development in the coastal area. Monitoring the temporal and spatial variation of mangrove communities and their inner structure is the first step to managing them and achieving sustainable development in this area. Only by fully understanding the dynamic process of both the composition and spatial distribution of mangrove species can the management of the protected area become more effective, so as to realize the sustainable development of both human society and the natural environment in this region.
Future studies are needed to quantify the interactions between Mai Po wetlands and human activities. Ecological modeling may provide the means to incorporate these anthropogenic factors (e.g., urbanization, water pollution, fisheries and tourism) into studies of the dynamics of mangrove ecosystem. More field investigation and remote sensing observations are also required to collect sufficient data sets to support the establishment of this ecological modeling.

6. Conclusions

This paper presents an evaluation of the mangrove zonation changes in Mai Po Reserve of Hong Kong from 1991 to 2015. SDE was applied with its unique parameters, including rotations, flattening, standard deviations, and mean centers, in order to obtain directional information for each mangrove species, in addition to its spatial extent. Experimental results demonstrated the following findings: (1) mangrove stands in Mai Po Reserve show clear zonation in the past three decades, presenting a sequence of the species in this tide-dominated shore. (2) The total area of mangrove increased from around 150 Ha to more than 350 Ha from 1991 to 2015. The KO1 class has been the dominant species during the study period, occupying the landward zone. AM and KO2 tend to occupy the middle and seaward zones, respectively, whereas the AI species distribute in a more undefined manner. (3) The rotations of SDE of the three species in the past 25 years show that the three species of mangroves in Mai Po continuously spread in a northwestern direction over the study period. (4) The X and Y deviation changes show that KO1 and AI classes distributed in a relatively larger area in Mai Po, whereas AM and KO2 tend to be restricted to a relatively smaller area. (5) Additionally, the moving trend results of the ellipse centers indicate a similar moving trend of the centers of the four types of species over the past 25 years, moving to the northwest, and indicating a consistent zonation moving trend. This study illustrates the potential significance of SDE in enhancing mangrove zonation understanding by adding unique directional change information to compensate for the spatial extent.

Author Contributions

M.L. and H.Z. conceived and designed the experiments; M.L. performed the experiments; M.L. and H.Z. analyzed the results; M.L. wrote the paper; G.L., H.L. and D.T. revised the paper.

Funding

This research was funded by [Guangdong Key Laboratory of Ocean Remote Sensing (South China Sea Institute of Oceanology Chinese Academy of Sciences)] grant number [2017B030301005-LORS1801], [the Major Special Project—the China High-Resolution Earth Observation System], [National Natural Science Foundation of China] grant number [41401370] and [Research Grants Council (RGC) General Research Fund] grant numbers [CUHK 14601515, CUHK 14635916 and CUHK 14605917].

Acknowledgments

This study was jointly supported by Guangdong Key Laboratory of Ocean Remote Sensing (South China Sea Institute of Oceanology Chinese Academy of Sciences) (2017B030301005-LORS1801), the Major Special Project—the China High-Resolution Earth Observation System, National Natural Science Foundation of China (41401370) and the Research Grants Council (RGC) General Research Fund (CUHK 14601515, CUHK 14635916 and CUHK 14605917). The authors would like to thank the anonymous reviewers for their critical comments and suggestions to improve the original manuscript.

Conflicts of Interest

The authors declare no conflict of interest.

References

  1. Alongi, D.M. Present state and future of the world’s mangrove forests. Environ. Conserv. 2002, 29, 331–349. [Google Scholar] [CrossRef]
  2. Duke, N.C. Phenologies and litter fall of two mangrove trees, Sonneratia alba Sm. and S. caseolaris (L.) Engl., and their putative hybrid, S.× gulngai NC Duke. Aust. J. Bot. 1988, 36, 473–482. [Google Scholar] [CrossRef]
  3. Kathiresan, K.; Bingham, B.L. Biology of mangroves and mangrove ecosystems. Adv. Mar. Biol. 2001, 40, 81–251. [Google Scholar]
  4. Furukawa, K.; Wolanski, E.; Mueller, H. Currents and sediment transport in mangrove forests. Estuar. Coast. Shelf Sci. 1997, 44, 301–310. [Google Scholar] [CrossRef]
  5. Nagelkerken, I.; Blaber, S.; Bouillon, S.; Green, P.; Haywood, M.; Kirton, L.; Meynecke, J.-O.; Pawlik, J.; Penrose, H.; Sasekumar, A. The habitat function of mangroves for terrestrial and marine fauna: A review. Aquat. Bot. 2008, 89, 155–185. [Google Scholar] [CrossRef]
  6. Duke, N.C.; Meynecke, J.O.; Dittmann, S.; Ellison, A.M.; Anger, K.; Berger, U.; Cannicci, S.; Diele, K.; Ewel, K.C.; Field, C.D.; et al. A world without mangroves? Science 2007, 317, 41–42. [Google Scholar] [CrossRef] [PubMed] [Green Version]
  7. Ellison, A.M.; Mukherjee, B.B.; Karim, A. Testing patterns of zonation in mangroves: Scale dependence and environmental correlates in the Sundarbans of Bangladesh. J. Ecol. 2000, 88, 813–824. [Google Scholar] [CrossRef]
  8. Youssef, T.; Saenger, P. Mangrove zonation in Mobbs Bay—Australia. Estuar. Coast. Shelf Sci. 1999, 49, 43–50. [Google Scholar] [CrossRef]
  9. Rogers, K.; Lymburner, L.; Salum, R.; Brooke, B.P.; Woodroffe, C.D. Mapping of mangrove extent and zonation using high and low tide composites of Landsat data. Hydrobiologia 2017, 803, 49–68. [Google Scholar] [CrossRef]
  10. Bullock, E.L.; Fagherazzi, S.; Nardin, W.; Vo-Luong, P.; Nguyen, P.; Woodcock, C.E. Temporal patterns in species zonation in a mangrove forest in the Mekong Delta, Vietnam, using a time series of Landsat imagery. Cont. Shelf Res. 2017, 147, 144–154. [Google Scholar] [CrossRef]
  11. Zhang, H.; Wang, T.; Liu, M.; Jia, M.; Lin, H.; Chu, L.; Devlin, A.T. Potential of Combining Optical and Dual Polarimetric SAR Data for Improving Mangrove Species Discrimination Using Rotation Forest. Remote Sens. (Basel) 2018, 10, 467. [Google Scholar] [CrossRef]
  12. Zhang, H.; Xu, R. Exploring the optimal integration levels between SAR and optical data for better urban land cover mapping in the Pearl River Delta. Int. J. Appl. Earth Obs. Geoinf. 2018, 64, 87–95. [Google Scholar] [CrossRef]
  13. Wan, L.; Zhang, H.; Wang, T.; Li, G.; Lin, H. Mangrove species discrimination from very high resolution imagery using gaussian markov random field model. Wetlands 2017. accepted. [Google Scholar]
  14. Wang, T.; Zhang, H.; Lin, H.; Fang, C. Textural–spectral feature-based species classification of mangroves in Mai Po Nature Reserve from Worldview-3 imagery. Remote Sens. (Basel) 2016, 8, 24. [Google Scholar] [CrossRef]
  15. Jia, M.M.; Liu, M.Y.; Wang, Z.M.; Mao, D.H.; Ren, C.Y.; Cui, H.S. Evaluating the Effectiveness of Conservation on Mangroves: A Remote Sensing-Based Comparison for Two Adjacent Protected Areas in Shenzhen and Hong Kong, China. Remote Sens. (Basel) 2016, 8, 627. [Google Scholar] [CrossRef]
  16. Viennois, G.; Proisy, C.; Feret, J.B.; Prosperi, J.; Sidik, F.; Suhardjono; Rahmania, R.; Longepe, N.; Germain, O.; Gaspar, P. Multitemporal Analysis of High-Spatial-Resolution Optical Satellite Imagery for Mangrove Species Mapping in Bali, Indonesia. IEEE J. Stars 2016, 9, 3680–3686. [Google Scholar] [CrossRef]
  17. Young, L.; Melville, D. Conservation of the Deep Bay environment. In The Marine Biology of the South China Sea, Proceedings of the First International Conference on the Marine Biology of Hong Kong and the South China Sea, Hong Kong, China, 28 October–3 November 1990, 1st ed.; Brain, M., Ed.; Hong Kong University Press: Hong Kong, China, 1993; Volume 1, pp. 211–232. [Google Scholar]
  18. Howlett, B.E. A Review of 1995 and a Pictorial Review of the Past Fifty Years; Government Printer: Hong Kong, China, 1996; ISBN 9620202201. [Google Scholar]
  19. Tam, N.F.; Wong, Y.S.; Lu, C.Y.; Berry, R. Mapping and characterization of mangrove plant communities in Hong Kong. In Asia-Pacific Conference on Science and Management of Coastal Environment; Springer: Dordrecht, The Netherlands, 1997; pp. 25–37. [Google Scholar]
  20. Agriculture, Fisheries and Conservation Department (AFCD). Mai Po Inner Deep Bay RAMSAR Site Management Plan Executive Summary; Agriculture, Fisheries and Conservation Department: Hong Kong, China, 2011.
  21. Yipp, M.W.; Hau, C.; Walthew, G. Conservation evaluation of nine Hong Kong mangals. In Proceedings of the Asia-Pacific Symposium on Mangrove Ecosystems, Hong Kong, China, 1–3 September 1993; Springer: Dordrecht, The Netherlands, 1995; pp. 323–333. [Google Scholar]
  22. Jia, M.; Zhang, Y.; Wang, Z.; Song, K.; Ren, C. Mapping the distribution of mangrove species in the Core Zone of Mai Po Marshes Nature Reserve, Hong Kong, using hyperspectral data and high-resolution data. Int. J. Appl. Earth Obs. Geoinf. 2014, 33, 226–231. [Google Scholar] [CrossRef]
  23. Wong, F.K.K.; Fung, T. Combining EO-1 Hyperion and Envisat ASAR data for mangrove species classification in Mai Po Ramsar Site, Hong Kong. Int. J. Remote Sens. 2014, 35, 7828–7856. [Google Scholar] [CrossRef]
  24. Cortes, C.; Vapnik, V. Support-vector networks. Mach. Learn. 1995, 20, 273–297. [Google Scholar] [CrossRef] [Green Version]
  25. Vapnik, V. The support vector method of function estimation. In Nonlinear Modeling; Springer: Boston, MA, USA, 1998; pp. 55–85. [Google Scholar]
  26. Song, C.; Woodcock, C.E.; Seto, K.C.; Lenney, M.P.; Macomber, S.A. Classification and change detection using Landsat TM data: When and how to correct atmospheric effects? Remote Sens. Environ. 2001, 75, 230–244. [Google Scholar] [CrossRef]
  27. Agriculture, Fisheries and Conservation Department (AFCD). Mapping of Distribution and Extent of Mangroves in Hong Kong Using Satellite Image Analysis; Agriculture, Fisheries and Conservation Department: Hong Kong, China, 2008.
  28. Balke, T.; Bouma, T.J.; Horstman, E.M.; Webb, E.L.; Erftemeijer, P.L.; Herman, P.M. Windows of opportunity: Thresholds to mangrove seedling establishment on tidal flats. Mar. Ecol. Prog. Ser. 2011, 440, 1–9. [Google Scholar] [CrossRef] [Green Version]
  29. Chan, P.; Ching, S.; Erftemeijer, P. Developing a mangrove management strategy in the estuaries of Deep Bay, Shan Pui River and Tin Shui Wai drainage channel. In Proceedings of the CIWEM Hong Kong Water Conference, Hong Kong, China, 11–12 May 2011. [Google Scholar]
  30. Wong, S.; Li, Y. Hydrographic surveys and sedimentation in Deep Bay, Hong Kong. Environ. Geol. Water Sci. 1990, 15, 111–118. [Google Scholar] [CrossRef]
  31. Lee, S.-Y. The Mangrove Ecosystem of Deep Bay and the Mai Po Marshes, Hong Kong: Proceedings of the International Workshop on the Mangrove Ecosystem of Deep Bay and the Mai Po Marshes, Hong Kong, China, 3–20 September 1993, 1st ed.; Lee, S.-Y., Ed.; Hong Kong University Press: Hong Kong, China, 1999. [Google Scholar]
  32. Crase, B.; Liedloff, A.; Vesk, P.A.; Burgman, M.A.; Wintle, B.A. Hydroperiod is the main driver of the spatial pattern of dominance in mangrove communities. Glob. Ecol. Biogeogr. 2013, 22, 806–817. [Google Scholar] [CrossRef]
  33. Van Loon, A.; Dijksma, R.; Van Mensvoort, M. Hydrological classification in mangrove areas: A case study in Can Gio, Vietnam. Aquat. Bot. 2007, 87, 80–82. [Google Scholar] [CrossRef]
  34. Leong, R.C.; Friess, D.A.; Crase, B.; Lee, W.K.; Webb, E.L. High-resolution pattern of mangrove species distribution is controlled by surface elevation. Estuar. Coast. Shelf Sci. 2017, 202, 185–192. [Google Scholar] [CrossRef]
  35. McKee, K.L. Soil physicochemical patterns and mangrove species distribution—Reciprocal effects? J. Ecol. 1993, 477–487. [Google Scholar] [CrossRef]
  36. McKee, K.L. Growth and physiological responses of neotropical mangrove seedlings to root zone hypoxia. Tree Physiol. 1996, 16, 883–889. [Google Scholar] [CrossRef] [PubMed]
  37. Youssef, T.; Saenger, P. Photosynthetic gas exchange and accumulation of phytotoxins in mangrove seedlings in response to soil physico-chemical characteristics associated with waterlogging. Tree Physiol. 1998, 18, 317–324. [Google Scholar] [CrossRef] [PubMed]
  38. Variation of 50-Year Mean Sea Level Trends at Tsim Bei Tsui, Hong Kong. Available online: https://tidesandcurrents.noaa.gov/sltrends/ (accessed on 7 May 2018).
Figure 1. The location of the study area.
Sustainability 10 01913 g001
Figure 2. Spectral reflectance (Digital Number) of different mangrove species in SPOT 5 images.
Sustainability 10 01913 g002
Figure 3. The overall accuracy assessment of mangrove classification using SVM and ANN.
Sustainability 10 01913 g003
Figure 4. Mangrove species distribution from 1991 to 2015.
Sustainability 10 01913 g004
Figure 5. Changes of different mangrove species in Mai Po during 1990 to 2015.
Sustainability 10 01913 g005
Figure 6. The Standard Deviational Ellipse of the multi-temporal mangrove forests.
Sustainability 10 01913 g006
Figure 7. Temporal changes of the parameters of the ellipse: (a,b) Rotation; (c,d) Flattening; (e,f) Standard deviation on X direction; (g,h) Standard deviation on Y direction. ANN: a, c, e, g; SVM: b, d, f, h.
Sustainability 10 01913 g007
Figure 8. Shift of species centers of mangroves in Mai Po during 1990 to 2015.
Sustainability 10 01913 g008
Table 1. Satellite data sets used in this study.
DatasetAcquisition DateResolution
Remote sensing dataSPOT1 HRV21 December 199120 m
26 December 1993
29 January 1997
22 November 2000
SPOT4 HRIVR8 November 200210 m
SPOT5 HRG11 December 200410 m
21 November 2008
10 January 2011
GF-115 November 201316 m
20 February 2014
16 December 2015
Table 2. The sources of reference data according to the satellite images.
Date of Satellite DataSources of Reference Data
21 December 1991Duke and Khan 1999; High Resolution satellite data in 1991 from Google Earth
26 December 1993Duke and Khan 1999; High Resolution satellite data in 1991 from Google Earth
29 January 1997Duke and Khan 1999; High Resolution satellite data in 2000 from Google Earth
22 November 2000High Resolution satellite data in 2000 from Google Earth
8 November 2002High Resolution Satellite data in 2002 and 2003 from Google Earth
11 December 2004AFCD data; Wong and Fung 2016; High Resolution satellite data in 2003 and 2004 from Google Earth
21 December 2008AFCD data; Wong and Fung 2016; High Resolution satellite data in 2008 from Google Earth
10 January 2011Wong and Fung 2016; High Resolution satellite data in 2011
15 November 2013Our field data; Google Earth High Resolution images in 2013
20 February 2014Our field data; Google Earth High Resolution images in 2014
16 December 2015Our field data; Google Earth High Resolution images in 2015
Table 3. Accuracy assessment of the mangrove species classification.
19911993
KO1AMKO2AIPAUA KO1AMKO2AIPAUA
KO11658182791.16%75.69%KO117484386.14%92.06%
AM149833364.90%66.22%AM613331286.92%77.33%
KO2016572541.91%58.16%KO27121291075%81.65%
AI2292811166.87%65.29%AI150813489.93%85.35%
OA67.98%KC0.57 OA84.32%KC0.79
19972000
KO1AMKO2AIPAUA KO1AMKO2AIPAUA
KO1185316093.91%90.69%KO1171022100%97.71%
AM1219490095.10%65.54%AM015834995.18%75.24
KO20755432.93%83.33%KO2021413187.04%81.03%
AI00614897.37%96.10%AI06165941.84%72.84%
OA80.83%KC0.74 OA82.66%KC0.77
20022004
KO1AMKO2AIPAUA KO1AMKO2AIPAUA
KO116228889.50%90%KO11691151389.42%83.35%
AM517441593.05%87.88%AM617144288.14%76.68%
KO291125587.41%89.29%KO292154092.22%93.33%
AI510612982..17%86%AI510410365.19%84.42%
OA88.32%KC0.84 OA84.32%KC0.79
20082011
KO1AMKO2AIPAUA KO1AMKO2AIPAUA
KO118932296.92%96.43%KO119042993.14%92.68%
AM416012886.96%82.90%AM1114732186.98%80.77%
KO2051432383.63%83.63%KO2141552394.51%84.70%
AI2162514072.54%76.50%AI21448260.74%80.39%
OA85.06%KC0.80 OA85.42%KC0.80
20132014
KO1AMKO2AIPAUA KO1AMKO2AIPAUA
KO111663189.92%92.06%KO1172120286%92.47%
AM1314725691.30%76.96%AM281794290.86%84.04%
KO2001212774.69%81.76%KO200131395.62%97.76%
AI081313880.23%86.79%AI06214795.45%94.84%
OA83.65%KC0.78 OA91.42%KC0.88
2015
KO1AMKO2AIPAUA
KO113450091.78%96.40%
AM101780096.21%67.42%
KO22274240.13%70%
AI00632382.14%85.19%
OA78.03%KC0.70

