Article

Comparing the International Knowledge Flow of China’s Wind and Solar Photovoltaic (PV) Industries: Patent Analysis and Implications for Sustainable Development

1
School of Public Policy and Management, Tsinghua University, Beijing 100084, China
2
School of Oriental and African Studies (SOAS), University of London, London WC1H 0PD, UK
*
Author to whom correspondence should be addressed.
Sustainability 2018, 10(6), 1883; https://doi.org/10.3390/su10061883
Submission received: 9 May 2018 / Revised: 28 May 2018 / Accepted: 29 May 2018 / Published: 5 June 2018
(This article belongs to the Special Issue Climate Change and Sustainable Development Policy)

Abstract

:
Climate-relevant technologies, like wind and solar energy, are crucial for mitigating climate change and for achieving sustainable development. Recent literature argues that Chinese solar firms play more active roles in international knowledge flows, which may better explain their success in international markets when compared to those of Chinese wind firms; however, empirical evidence remains sparse. This study aims to explore to what extent and how do the international knowledge flows differ between China’s wind and solar photovoltaic (PV) industries? From a network perspective, this paper develops a three-dimensional framework to compare the knowledge flows in both explicit and tacit dimensions: (i) inter-country explicit knowledge clusters (by topological clustering of patent citation network); (ii) inter-firm explicit knowledge flow (patent citation network of key firms); and, (iii) inter-firm tacit knowledge flow (by desktop research and interviews). The results show that China’s PV industry has stronger international knowledge linkages in terms of knowledge clustering and explicit knowledge flow, but the wind power industry has a stronger tacit knowledge flow. Further, this study argues that the differences of global knowledge links between China’s wind and solar PV industries may be caused by technology characteristics, market orientation, and policy implementation. This suggests that these industries both have strong connections to global knowledge networks, but they may involve disparate catch-up pathways that concern follower-modes and leader-modes. These findings are important to help us understand how China can follow sustainable development pathways in the light of climate change.

1. Introduction

Mitigating climate change requires access to low carbon energy technologies like wind and solar energy technology. China, as the world’s largest CO2 emitter, has committed to a low carbon energy future in both wind power (WP) and solar photovoltaic (PV) industries to contribute to climate change mitigation. Since 2009, China has become the world’s largest wind energy market with the highest annual newly installed capacity. In 2016, China had a cumulative installed wind energy capacity of 145 GW [1]. By 2013, China surpassed Germany and became the largest photovoltaic market, with a cumulative installed solar energy capacity of more than 43 GW in 2016 [1].
Chinese firms have gained large market shares in both WP and PV industries, but have yet to become significant contributors to the global industry in terms of knowledge [2,3,4]. Traditionally, Chinese lead firms have gained competitive advantages and international market leadership through manufacturing competences, such as scale, low prices, and absorbed technologies, rather than competing in innovation [5]. In turn, there are debates over the role of Chinese firms in the global WP and PV innovation community, and their linkages to the international technology network—some argue that these technology linkages to the global networks may demonstrate the innovation capacities of Chinese lead firms [6,7]. Some recent research, although still being limited, has explored Chinese firms’ linkages to the international technology community, as well as the impacts on their growth models in solar PV [8] and WP industries [9,10,11,12,13], but few have conducted a comparison and even fewer has learned the difference between these two sectors.
In addition, most of the above-mentioned studies are qualitative, but not quantitative, so that they are concerned with tacit-knowledge flows [4], which attends to interactive corporations or the development of collaborative networks [14]. In fact, international knowledge flows involve both tacit and explicit knowledge dimensions, though explicit knowledge flows have been much less investigated [15]—the explicit knowledge flow involve patent, publication, drawings, etc. Collins [16] that demands not many resource stocks but the embedded intellectual recognitions among innovative researchers that significantly coin the diffusion of original knowledge [17,18]. Adding to this, international knowledge flows can be examined by using the concept of global knowledge networks [17,19,20] and investigating it through the lens of social network analysis (SNA). The analysis of global knowledge networks and the role of key firms as being the generator/recipient of knowledge flows or the partners in cooperation can help to better understand the firm’s global knowledge competitiveness. Eyeing on these gaps, some recent research has attempted to use patent citation networks to explore the explicit knowledge diffusions, spillovers, and flows within specific industries and across national borders [20,21], but none have extended this to specifically compare the WP and PV of China in order to learn their idiosyncrasies in catch-up pathways.
This research, therefore, aims to integrate a set of patent-analysis methodologies to address the following question: To what extent and how do the international knowledge flows differ between China’s wind and solar PV industries when both connected to global knowledge networks? In order to explore this, we build a coherent theoretical framework targeting inter-country knowledge flow-based clusters, inter-firm explicit knowledge flows, and inter-firm tacit knowledge flow, which leads us to put forward our argument. Furthermore, this study discusses the technology transfer and cooperation behind the international knowledge networks, and also discusses the possible drivers for this development, such as industrial technology characteristics, market preferences, and policy implementation models. Answering these questions can help us to understand how China can follow sustainable development pathways in the light of climate change.

2. Literature Review

2.1. The Development Pathways of China’s PV and WP Industries

2.1.1. China’s Renewable Energy Policy Frameworks

In 2014, the Chinese government announced its goals to peak CO2 emissions by 2030 or earlier. These ambitions were confirmed on 30 June 2015, when China submitted its Intended Nationally Determined Contributions (INDC) to the UNFCCC. China also committed to reducing CO2 emissions per unit of GDP by 60% to 65% from the 2005 level, and to increasing the share of non-fossil fuels in primary energy consumption to around 20% [3].
Wind power and solar have greenhouse gas (GHG) emissions per kWh as low as 8–20 g (wind) and 47 g (solar PV), which are just 2.2% and 10~17% of the emissions that are generated by coal [22]. As a consequence, the GHGs reduction potential of wind and solar has enormous environmental benefits [23,24].
China is capable of developing wind energy and solar PV on a large-scale. Despite some disadvantages due to the nationalization of key components, China has the advantage of a sound policy support system that shapes R&D and manufacturing bases, as well as complete industrial chains. These factors make China the largest wind energy and solar PV market in the world now, and possibly also in the future [25].
Since the implementation of the renewable energy law in 2006, there has been rapid growth in the wind power and solar PV industry in China [26]. China has established nation-wide strategic goals for low carbon development in its INDC in June 2015 [27]. In addition, national achievements have been made in wind and solar resource projection and assessment, progress has also been achieved in wind energy and solar PV research through key technology breakthroughs and capacity building with the support of the Major State Basic Research Development Program (973 Program), National High-tech R&D Program of China (863 Program), National Key Technology R&D Program, and National Natural Science Foundation [26]. China’s active engagement in international technological and scientific exchange and cooperation projects has also supported the growth of these two industries.
The influence of government policy on the PV and wind industries plays a very significant role in the disparity in innovativeness between these two industries [28,29,30,31]. This seems evident in China’s PV and WP industries. Presently, the total installed capacity of WP in China far exceeds the installed PV capacity due to its government designated domestic orientation. However, the PV industry has a stronger innovation capacity that can be explained by its government-proscribed export direction [32].
Today, China’s PV and WP industries represent two of the most potent sustainable energy sources in China and around the world [33]. The green energy generation and capacity from both sources in China are the highest in the world due to years of strong growth supported by government policies, but neither have reached their maximum potential in terms of installed capacity within China yet.
Government policy on energy pricing through fixed feed-in tariffs (FITs) and other supportive policies have been key for both industries [5,34,35]. The industries benefited from the Renewable Energy Law of 2006, but wind was given a higher priority in government incentives for domestic installed capacity due to REL 2006′s focus on seeking feasible energy solutions due to wind’s lower initial costs [36,37].
The traditional industrial policy for wind has enabled this emerging industry to become a dominant source of green energy in China, while PV lags behind in terms of installed capacity due to its external orientation. REL 2006 greatly aided the WP industry’s domestic growth. The FIT policy was designed to support wind in China—starting in 2005—with a price system for WP (50 to 60 cents per kW for onshore sources) [5] and attracted substantial investment for wind farms. During this phase, the wind industry created wind farms that are based on technology licenses from Europe and America, while devoting minimal resources to innovation [12]. Technology transfer from the global North to China therefore played a large role in the past for the wind energy industry.
Due to the priority given to wind in the domestic market, PV has focused its resources toward innovation, in addition to scale of production [4], to enable itself to compete on the global market as an export-oriented industry [36]. Since 2012, the PV industry has been transitioning towards becoming the second largest domestic renewable industry due the trade barriers that were encountered in overseas markets. The domestic market’s absorption rate of PV technology has been slow over the last couple of decades [33], but the growth of installed capacity has been significant in recent years [33,36]. This shift is due to changing government policies in reaction to antidumping measures in 2014, which substantially reduced exports. To counteract this, the government pushed for domestic consumption of PV technology.

2.1.2. Differences between PV and WP Industries

There are some key differences between the two industries that points them toward different development pathways. One such difference is the dependent relationship between nascent renewable industries of developing nations and the demand-side policies implemented by local governments [4]. The empirical evidence for this relationship is inconclusive, with evidence for the degree of reliance on demand policies [9,38]. Quitzow et al. [4] point out that China has adopted new demand-side policies, while increasing technology transfers for wind and PV, with the local WP industry focusing mostly on installation and operation and maintenance, while a few large PV manufacturing firms dominate the supply side of their industry.
The knowledge position and technological capability of these industries are tied to the “home market advantage” noted by [7]. Having a large home market—for the likes of China’s WP industry—helps to establish sizeable demand, reduce market entry barriers, ease transport costs, and lower transaction costs [9,10,11]. The home market advantage is believed to be more important for WP than PV [4], because WP requires more robust logistical support, user-producer relations, and low market entry barriers, which provide indigenous firms the opportunity to experiment and to learn to gain the necessary capabilities. The PV industry requires this less than the wind industry because it relies on dominant designs to manufacture its products en masse and using China’s natural advantage in producing on scale [4,7].
The PV and WP industries both require tacit knowledge transfer from either a product-related or process-related oriented mechanisms [4,7]. The transfer of tacit knowledge is best achieved through intra-firm mechanisms, which center on strong human interaction between the sender and the receiver of the knowledge. There are some key differences between the two industries, which owe to the technological complexity of each industry [7]. PV is mainly reliant on tacit knowledge during the opening phases of development and can quickly move to a learning-by-doing mode. Conversely, WP requires more time to learn and requires a sustained stream of tacit knowledge to flow into the new industry. Industries focusing on complex products and systems—like China’s WP industry—tend to lack dominant designs, so mastering the technical aspects of such industries is hard. PV, on the other hand, is mass produced and has dominant designs. Equipment imports have been an important channel for knowledge transfer for the PV industry [39].

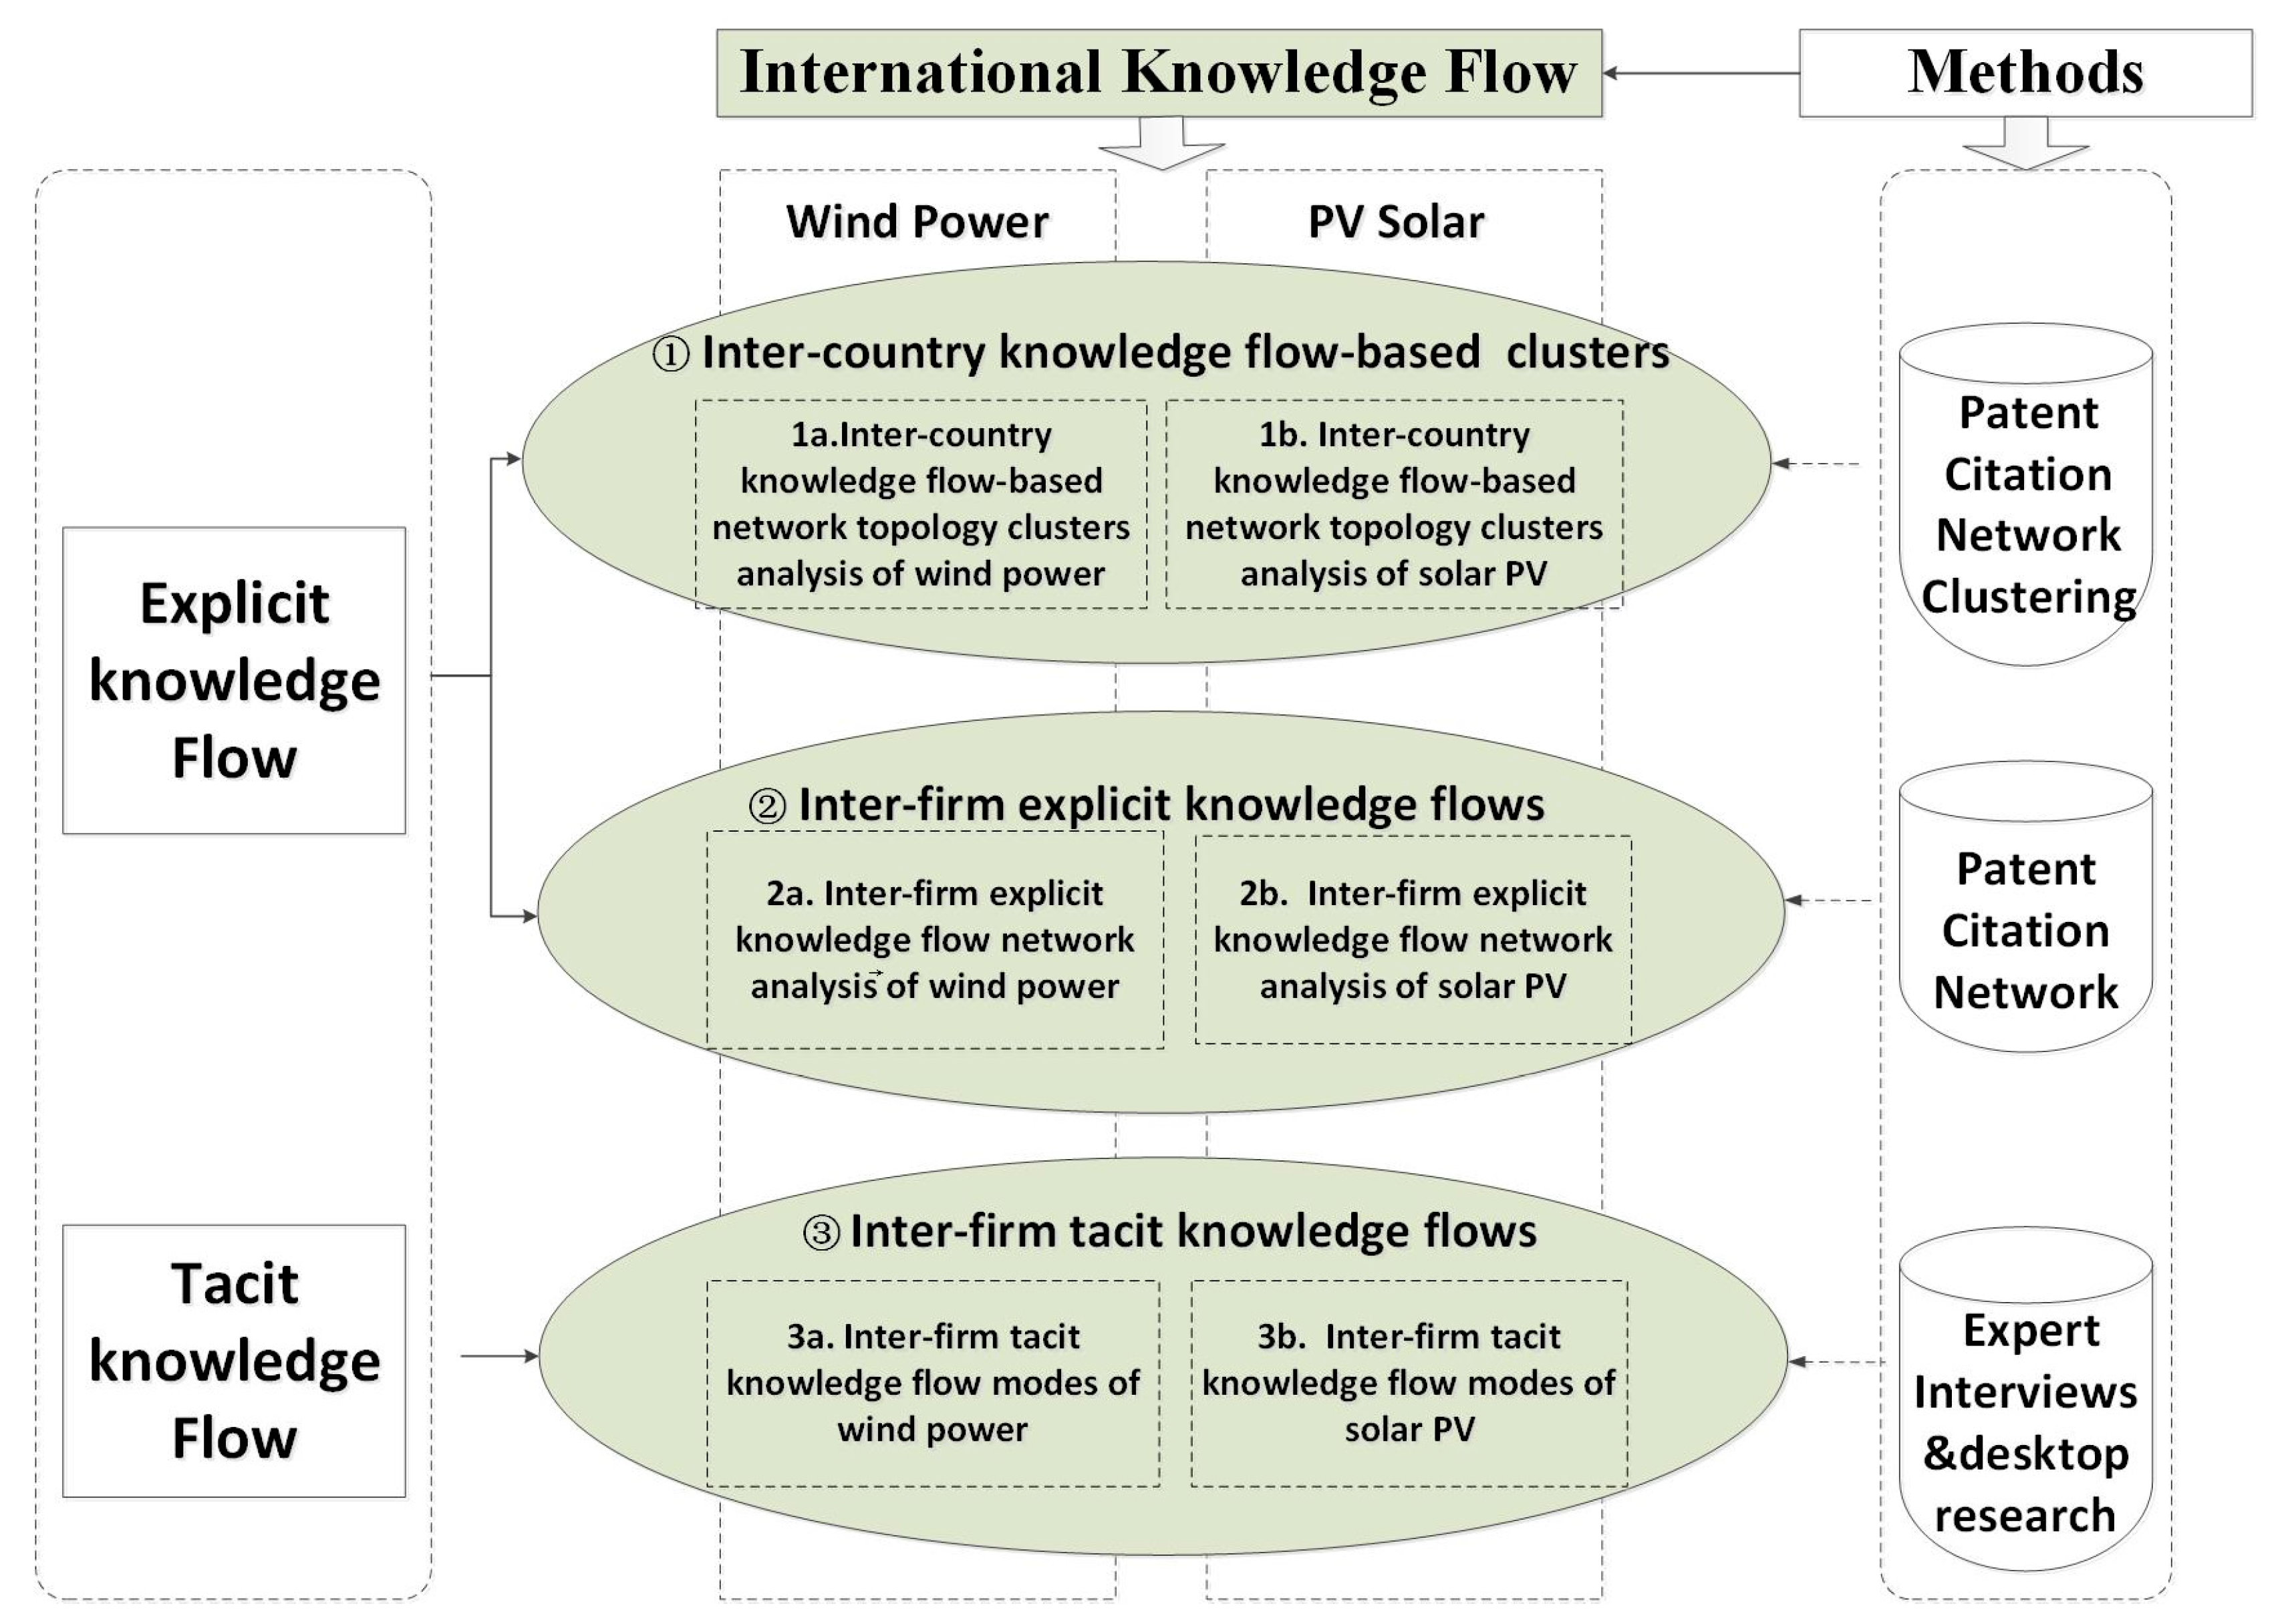
2.2. The Three Dimensions of International Knowledge Flows

With the arrival of the knowledge economy, especially in the emerging knowledge-intensive industries, international knowledge flow provides an updated analytical lens in both generalized international technology transfer and catch-up literature, especially when considering the significance of knowledge with complicated attributes, such as complexity, dynamics, and network-enabling in the knowledge-economy era. Sharing information between firms across global boundaries—through the transfer of explicit knowledge and face-to-face exchanges of technical information—are common facets of today’s global economy [4,40]. These flows lead to the creation of technology clusters within countries that determine each nation’s capacity to compete (Ibid).
In traditional catch-up literature, international knowledge flow has been long viewed as cross-border knowledge spillovers from innovation-leaders to technology-following countries [12,41]. In the sense, these latecomer economies attempt to catch up through acquiring the production equipment, and based on which they learn manufacturing know-hows (or tacit knowledge) by doing, using, and interactions [42,43]. However, in recent years, the appearance of emerging industries may causes changes [44]. Emerging industries are being pushed by revolutionary science and technologies, rather than manufacturing tacit know-hows [45]. Many developing economies view these emerging technologies as good “window opportunities” for traditional technology-followers to catch up or even stand a chance for leapfrogging [46]. Some scientometric-based literature, though, has tentatively discovered that China has ramped up its explicit-knowledge performance in terms of the numbers of patenting and publication [47], but these researches provide very limited contributions to inter- or intra-organizational knowledge flow theories, as most of the above provides only the mere descriptive statistics for country-level analysis yet firm-level studies [45]. Specifically, few of them can help to clarify whether certain Chinese organizations have become more active in engaging in explicit knowledge exchanges with their organizational counterparts in developed countries.
For this research, we intend to explore the international knowledge flow through three dimensions to create a full understanding, we firstly analyze the inter-country knowledge flow-based clusters for an overview, then concentrating on the firm-level to examine the explicit knowledge flow networks, and finally, evaluating the tacit knowledge flow modes. These three components constitute the dimensions of knowledge flow and play a critical part in the comparison of our research.

2.2.1. Inter-Country Knowledge Flow-Based Clusters

Patent data has been used for a wide variety of purposes, including industry trends and firm-level innovation [48], patent quality assessment [49], scanning for potential co-operators or acquisition targets [50], and technology lifecycle forecasting [51,52]. Patent statistics has grown exponentially in line with the quick increase of patents filed and the availability of patent databases. Researchers have produced a range of patent value metrics to measure the potential utility of patents, which can be grouped into cluster from an international perspective.
Patents citation clustering analysis allows for us to find the core technologies of the leading firms in a global industry and allows for the innovation trajectory of firms and nations to be extrapolated in comparison with other technologies [17,53,54]. It allows for us to discern a technology trajectory based on an analysis of the relevance of existing patents within a firm’s portfolio, which can indicate the future of technological innovations. This analysis gives us a basis for comparing the strengths of a firm’s relation to lead firms. The same could be said for nations in competition with one another [40].
The challenge with using patents to compare knowledge positions of industries lie with the tradeoff between geographical and institutional biases that come with using single-office data (United States Patent and Trademark Office, USPTO, European Patent Office, EPO, etc.) and international patents (International Patent Cooperation Treaty, PCT) versus a global coverage approach, respectively [17]. The impact of these biases can be reduced by using patent value conversion rates with priority patents [55] and using global indexes [17]. China’s IP office has also made substantial progress toward upgrading their standards to match their western counterparts (Ibid).

2.2.2. Inter-Firm Explicit Knowledge Flows

Citation-based indicators are the most common means of determining the transfer of explicit knowledge. Citations are adopted because the value of individual patents varies widely [20]. A key measure of any firm are the ‘essential patents’ (EPs) that are held by the firm and the collaborations of the firm [17]. Eps are defined as “patents that are considered to be indispensable in order to make any product that complies with the [industry] standard, because there is no alternative way to do so” [17]. An EP is an important unit of measure because firms with more of these determine whether their knowledge holds a core or peripheral position. This is because EPs are “indispensable to make any [standardized] product.” [20,56]. Analysing the EPs for the leading firms allows for a determination of the leading firms’ position within the global network. This approach has been validated in studies on fuel cells [54], medical knowledge, telecommunications switching [57], data communication standards, and connectivity analysis [53].
The relative value of patented technologies can be split between “core”, “semi-core”, and “periphery” given their importance and position within patent families and the global value chain [58,59,60]. These typologies are defined, as follows: “Core components are defined as strategic components, which directly determine the functioning and efficiency of the turbine...[and] are complex and not easily codified, often relying also on tacit knowledge…[S]emi-core components…display relatively low complexity and more possibilities for codification…[N]on-core components are easily codified and simple and can be traded with relatively few transaction costs” [58] (p. 288). These types can indicate the sophistication of the innovations used and invented in China’s PV and WP industries. So, tracking and comparing patents as explicit knowledge is a reliable way of measuring this dimension of knowledge flow.

2.2.3. Inter-Firm Tacit Knowledge Flows

Tacit knowledge is the knowhow that is gained from learning to do activities, which heavily depends on the complexity of the technology. The personal interaction between technical staff engaged in tacit knowledge flows is crucial for less experienced firms to learn and develop their tacit understanding of complex technologies, like WP, which have high levels of “technology tacitness” [4,61]. The need for tacit knowledge flow—through cooperation and mergers—varies based on complexity, which is different for PV and WP technologies [4]. Being a mass produced line, PV technology require less inter-firm cooperation, whereas WP needs more tacit knowledge given the high complexity of its technologies and the many components that a wind turbine is composed of.
The concept of international coupling can be defined as the business, academic, and intellectual connections between the members of a nation’s technological innovation system (TIS) with members of some international TISs [62]. The coupling pattern that emerges when the linkages between domestic and global TIS members are found and qualitatively assessed. To analyse the TIS as a framework, Bergek et al. [63] offers a functional analysis approach to identify the key policy issues for any TIS. Measuring these couplings can determine how much tacit knowledge is needed by a certain industry and signal progress of accumulating tacit knowledge and experience [62].

3. Methodology

3.1. Research Design and Case Selections

This research used three approaches with a focus on inter-country knowledge flow-based clusters, inter-firm explicit knowledge flows, and inter-firm tacit knowledge flows, which forms an integrated analytical framework (see Figure 1) for conducting an in-depth comparison of the two industries. In this framework, we intend to explore the international knowledge flow of these two sectors, for which emphasize the explicit and tacit knowledge flows, as well as inter-firm interactions in the networks, along with the identification of outcomes and roles, like knowledge spillovers or consumers, global leaders or technology followers, etc. Patents as explicit knowledge can be used to analyze knowledge clustering and knowledge networks. Due to the limitation of patents, expert interviews and desktop research as tacit knowledge were conducted to supplement the data and aid the analysis of firm-level tacit knowledge flows. The inherent logic between each section is that we firstly use a citation network topology cluster algorithm to demonstrate the technology topic cluster on the macro level for an overview, and then we focus on the micro firm-level to illustrate leading firms’ interaction in the global knowledge network to reveal the roles of firms. Lastly, we explore Chinese leading firms’ tacit knowledge flows with the global countries.
Instead of the industry-level analysis, we conducted a firm-level research, which has three advantages. Firstly, by conducting our analysis at the firm level, we are able to greatly improve upon the qualitative evidence provided by some researchers [4,64], which was based on industry-level data. Moreover, by extending the theory in several directions, we have generated a richer set of findings about firms’ global knowledge positions that we can bring to the data. Secondly, cross-country studies at the firm level are challenging, as there are few high-quality datasets that are available for comparing across global borders. When such data is available, it tends to produce a certain contribution value in this field. Thirdly, our data also allows for us to explore integration decisions made across different inputs at the firm level, through specifications in which the unit of observation is a lead firm.
Following the work of Yin [65], our case selection is divided into two steps: first, according to the global ranking in 2015 [66], we select the top 10 firms in the solar PV and wind sectors. Second, we also add some other important firms that are innovative in the two industries. Thus, the selection process was designed purposefully. Firstly, the selected firms are in leading positions in their home countries while operating on a global scale. Secondly, they have specific value-adding knowledge that can be analyzed using patents. These sample firms have sufficient heterogeneity to construct a contrast between cases to guarantee the internal validity. Firms from China, Germany, Denmark, and India are illustrated for their leading positions within each industry in terms of market share, intellectual property, and manufacture capability [66]. Therefore, we selected 20 leading firms for wind power and 21 leading firms for solar PV as representative cases (see Table 1), in consideration of each firm’s global market share in 2015 for our comparison. In addition to lead firms’ historic patent portfolio and their role in industrial networks, we also map the gradual evolution of the firm-level knowledge network. In addition, we take into account important patents from small firms and even individuals.

3.2. Patent Citation Network Clustering

In this section, in order to analyse technology clusters between countries, we adopt the Newman topology algorithm, which is based on the force-directed layout to visualize the cluster of patent citation network [67]. Its rationale is imaging the network graphics as a physical system, each node will receive pulling and repulsive force by other nodes, all of the nodes make a movement under the interaction force, and it will form a static optimal layout when the system is in a balance [68]. Force-directed layout has the following two obvious advantages when compared with the patent map layout: first, it can fully show the network’s overall structure and the characteristics of the substructure, which is suitable for the analysis of technology domain and subdomains that are described by the patent citation network. Second, the patent citation network tends to form a large network due to its high number of patents thereby providing visual insights about complex systems.
Followed the work of Shibata et al. [69], based on the force-directed citation network layout, we used the visualization software Citation-Network Data Analyzer (CDA) for the cluster of patent citation network. When using CDA to visualize the maximum connected graphs of direct-citation network for technology topics, the nodes and links of citation networks are distinguished by different colors, according to the categories of various technology topics [70]. For example, if two nodes that are connected by a link belong to the same technology topic, then the link shows the same color with the technology topics represented by nodes. While if these two nodes belong to different technology areas respectively, then this link is visualized with white.
Topological clustering can divide the network into clusters that are based on the clustering characteristics of the network substructure. Newman clustering algorithm is different from the K-means algorithm that needs to specify the number of clusters, for it can divide the citation network into the optimal number of clusters, according to the characteristics of network structure, which is not fuzzy. Newman’s algorithm discovers tightly knit clusters with a high density within cluster edges, which enables the creation of a non-weighted graph consisting of many nodes [69]. After clustering, we visualized the citation networks and named the major clusters of emerging topics.

3.3. Patent Citation Network

Knowledge network as an important indicator has been used to observe the role and position of key actors [20], analyse the internal mechanism of knowledge flow [2,71], make a strategic assessment [72,73], and identify technological trends [74]. Therefore, we will use patent citation network to assess the importance and positions of our sample firms.
Our research starts by mapping the patent knowledge networks with 7287 (wind) and 15,086 (solar) of raw data points from the wind and solar industry worldwide based on the search strategy from 1959–2015 and 1962–2015, with 3503 wind and 5639 solar PV patent records from China. The patent portfolios owned by the sample firms allow for us to create patent citation networks at the firm level. Followed the work of Bekkers et al. [20], nodes in the networks represent key firms, while links are the cumulative citations in-between, meaning the knowledge flows between firms in terms of citations (excluding self-citations). Besides, we use the number of self-citation patent to represent the node size (i.e., the larger the node, the larger number of self-citations), and the frequency of citations to illustrate the thickness of lines (links) (i.e., the thicker the link, the greater the frequency of patent citations). Simultaneously, we also examined several social network indicators, which help us to understand the network structure, cohesion, and centrality. Density means the actual existence of links divided by the maximum number of potential links in theory [17,75]. The average distance means the average shortest paths between key nodes. Distance-based cohesion indicates the proportion of nodes that reach to each other, the larger values indicate greater cohesiveness. Distance-weighted fragmentation measures the proportion of nodes that cannot reach each other. Degree centrality is further categorized into in-degree and out-degree based on the direction of links. Net citation count equals to out-degree centrality minus in-degree, which differentiates the net producers from the net consumers. Based on citation matrixes between patent assignees, the network diagrams can be generated to identify the position and role of firms in each network. In this section, we also applied the core-periphery structure theory [58,59,60]. It divides the row and the column into two types. On the main diagonal of the block is the core that has a high density. Conversely, peripheral technology, on the main diagonal, has low density. The fitness score varies between zero (i.e., the goodness of fit is low) and one (i.e., the goodness of fit means entirely fitting). Thus, we divided our firms into two types: one is at the obvious central position (knowledge leaders), referring to the black circle, while the other holds a peripheral position (technology learners), indicating the white square. A firm with shorter paths and higher citations will possess central position with the advantage of information and resources that are related to technical innovation. Moreover, betweenness centrality also used to analyse firms’ innovation capabilities. Thus, the firm-level international citation networks allow for us to identify the roles and positions of Chinese leading firms in both emerging industries.

3.4. Expert Interviews and Desktop Research

In this section, we build on the recent literature and expert interviews to understand the inter-firm tacit knowledge flows. The literature on international knowledge flows includes a range of studies on the determinants of technology transfer modes. More specifically, the relative importance of tacit knowledge to the technology in question has been identified as an important influencing factor [76,77,78]. Based on De et al. [46], we define tacit knowledge flow acting as linkages that Chinese firms establish relationships with abroad or benefit from the global firms on technology and manufacturing products—which reflects the connections between the global countries. In our study, we argue the tacit knowledge flow modes generally occur through the pathways, as follows:
  • Licensing: A firm’s codified technology and its exclusive right is sold to another through a commercial way, which is the most obvious pathway.
  • Joint venture/acquisition: The alteration of firm’s controlling stake, meaning that a firm obtains a certain degree of control over other firms through property rights transactions.
  • Movement of personnel: The flow of tacit knowledge, meaning that skilled workers from one multinational firm to another new firms or country with the knowledge of know-how, which is significant for the effective technology transfer.
  • Joint development/protocol: When a firm ratifies a protocol in consent with another or develops projects, together for their mutual benefit.
Following Minshall [79], in this case, licensing and joint venture/acquisition are considered as strong ties for their direct contact with foreign countries and related to the ownership alteration of a firm’s stock and technology. Meanwhile, the joint development/protocols and the movement of personnel are regarded as weak ties for their flexibility in knowledge flow and technology transfer.
Expert interviews help us to understand the international couplings in the two sectors. For this study, we conducted 58 semi-structured, in-depth interviews in China with experts from research centers and academia, representatives from solar and wind firms and business associations, and representatives from government and relevant Non-Governmental Organizations (NGOs). The experts were chosen based on their excellent knowledge of the solar and wind energy sectors in China. They are senior experts or managers. In addition, we conducted several site visits at leading solar and wind firms to see their production lines, trade exhibitions, and operational wind and PV farms. The fieldwork was conducted between 2011 and 2016 in Beijing, Dezhou, Tianjin, Baoding, Shanghai, and Gansu. The interviews included China’s leading solar firms, such as Yingli Solar, Trina Solar, JA Solar, Jinko Solar, Hanergy, as well as leading wind energy firms, like Goldwind, Mingyang, Sinovel, Vestas China, and Huaneng Corporation, and business associations, like the Global Wind Energy Association (GWEA), the Chinese Wind Energy Association (CWEA), the Chinese Renewable Energy Industries Association, China National Renewable Energy Centre and the Beijing Energy Association. Key government authorities interviewed included the National Development Reform Commission (NDRC), provincial Development Reform Commissions (DRC), Ministry of Environmental Protection (MEP), Ministry for Science and Technology (MOST), Ministry of Commerce (MOFCOM), Ministry of Finance (MOF), key experts and relevant academics from various departments at Tsinghua University in Beijing, Tianjin University of Technology, the NDRC’s Energy Research Institute (ERI), and the Chinese Academy of Sciences (CAS). NGO interviewees included Greenpeace, the Natural Resources Defense Council NRDC, Greenovation Hub, and others. (See Table 2).

4. Empirical Analysis: Knowledge Clustering, Knowledge Flow Networks and Collaborations

4.1. Inter-Country Knowledge Flow-Based Clusters

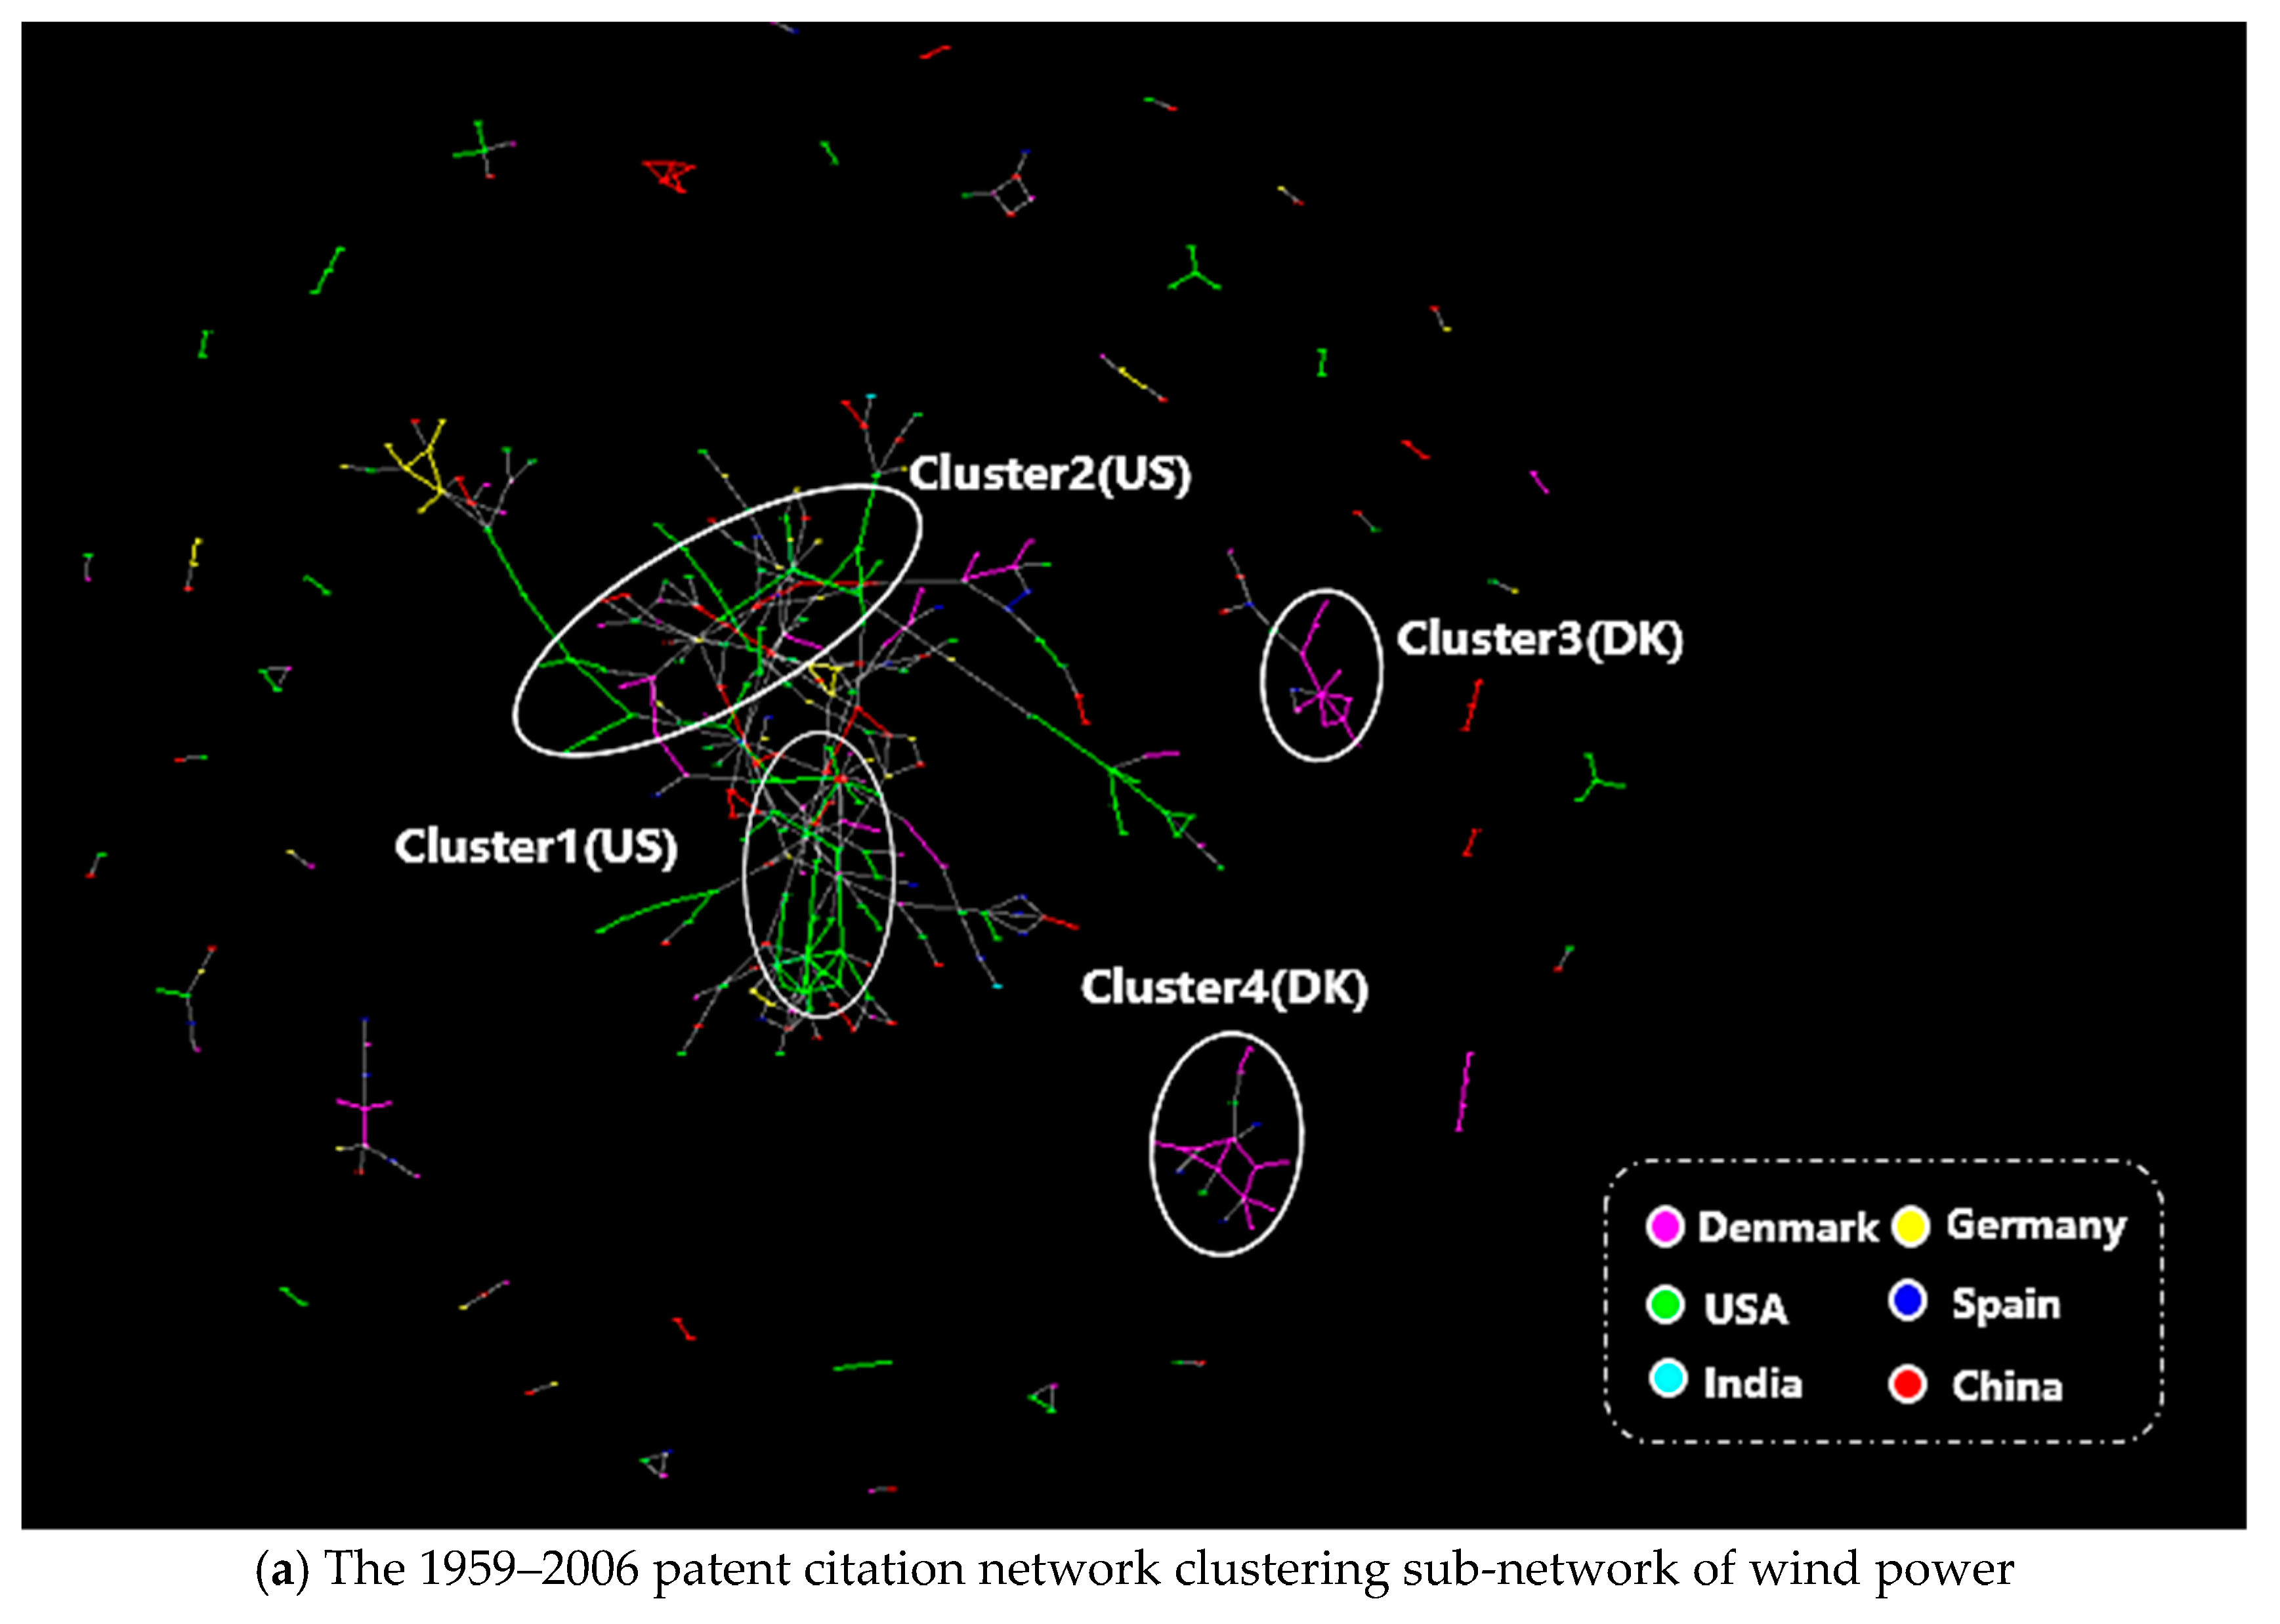
4.1.1. Wind Power Inter-Country Knowledge Flow-Based Clusters

To gain a general understanding on the technical topics for different countries, topology citation clustering was used. One ample group patent data comes from Denmark, Germany, the United States (US), China, India, and Spain, and it enables us to comprehend the technological portfolio of each country to make comparisons with China. Furthermore, we broke up the development process into three periods, making 2006 as the cut-off year to gain a fuller understanding of the evolution of technology topics. In addition, the cut off year of 2006 could also relate to the implementation of the renewable energy law in China and the implementation of Trade-Related International Property Rights (TRIPs).
In the 1959–2015 sub-network (Figure 2a), the clusters are sparse and few and far between each other. Clusters were mainly belonged to Denmark (cluster 3&4) and the USA (cluster 1&2), representing blade development, wind turbines composition, and functioning. German innovators also played a role. However, in the 2007–2015 sub-network (Figure 2b), China entered into the global topology citation clustering network, so the clusters, in this period, centered on China (cluster 1&4) and Denmark (cluster 2&3). Cluster 1&4 illustrates applied technologies and applications, such as tower cylinder, permanent magnet, lighting protection, data generation, blade development, grid converter, etc. While cluster 2&3 represents grid integration, rotor development, tower, converters, optical sensors, blade development, blades, etc. Moreover, there is some overlap between the cluster 1 and 2. The 1959–2015 full network (Figure 2c), shows the Chinese clustering network (cluster 2) as mainly being centered on applied technologies and applications, such as tower cylinder, permanent magnet, lighting protection, offshore pile, blade development, grid converter, etc. While Danish (cluster 1&5) focused more on core technologies and core applications of constructing wind turbines from scratch to modern-day turbines, such as grid integration, rotor development, tower, converters, optical sensors, wind speed controls, etc. The Germany (cluster 4) also focused on core technologies, including rotor blades and wind energy technology refining. Meanwhile, cluster 3 was a cross clustering that integrated Denmark, the United States of America (USA), and Germany, meaning the blade development, wind turbine composition, and functioning. The Indian and Spanish had few topology patent citation clusters. The white color in cluster 3 represents high cross citation and integration. The clusters show that Chinese wind firms hold patents in more defined technologies and applications, while Danish, Germany, and the American firms hold patents across a wide spectrum of technologies and applications across the WP value chain. Overall, the WP industry appears to have a strong convergence of technologies from countries across the world.

4.1.2. Solar PV Inter-Country Knowledge Flow-Based Clusters

Recently, the center of global PV industry that started from the Europe countries, like Germany, Italy, France, and Spain, has turned into the emerging markets, such as China, the USA, and Japan. Besides, most of our sample firms are also from these countries. Due to only Solarworld in our sample firms from Germany with fewer patents (239 patents), which makes it difficult to form large patent citation networks to compare with others. Besides, India also have few patents in the citation networks. Therefore, it makes sense that the technology topic topology citation clusters for the PV industry mainly focuses on Japan, the USA, and China. For solar PV, it appears a very different picture from wind power in terms of technologies convergence. In the 1962–2006 sub-network (Figure 3a), the topology citation clusters are concentrated on Japan (cluster 1) and the USA (cluster 2). Cluster 1 produced solar cells and modules, silicon ingots, glass manufacture, and thin-film PV production. While cluster 2 represents plasma chamber reactors, gas chamber flow, iron beam, cleaning fluid, and polishing. However, in the 2007–2015 sub-network (Figure 3b), China as an emerging competitor entering the global PV market. Cluster 1&2 show the USA prioritizing the development of specific applications in the upstream PV solar industry. Cluster 3 in Japan covers a wider range of technologies and applications, while cluster 4 in China mainly concentrates on the middle reaches of the industrial chain. Each cluster has its own focus, but also overlap with others, like cluster 2&3&4. In the 1962–2015 full-network (Figure 3c), for solar PV, our analysis reveals that Chinese firms hold patents to some core technologies that are inherent for the manufacturing of solar panels that are supplemented by application patents. When comparing these topology patent citation clusters, we discover that Japanese firms cover a wider range of technologies and applications, while the US and Chinese firms’ patents are more clustered in specific areas. Yet, Chinese solar firms do hold patents in core technologies such as producing silicon ingots, silicon cutting utilities, producing silicon solar cells, battery development, and arranging solar systems. Japanese firms have clusters in producing silicon ingots, developing coating material, producing solar cells and modules, photoelectric conversion technology, glass manufacture, and thin-film PV production. The US patents are strong in terms of specific applications that are part of the solar manufacturing process, including plasma chamber reactors, gas chamber flow, deposition chamber vapour, dielectric layer deposit, light optical solvent, coating material, cleaning fluid, and polishing. The topology citation clustering networks clearly show that the Chinese intellectual property development for solar PV is different from developed countries and have stronger technologies convergence when compared with WP.

4.2. Inter-Firm Explicit Knowledge Flow Analysis

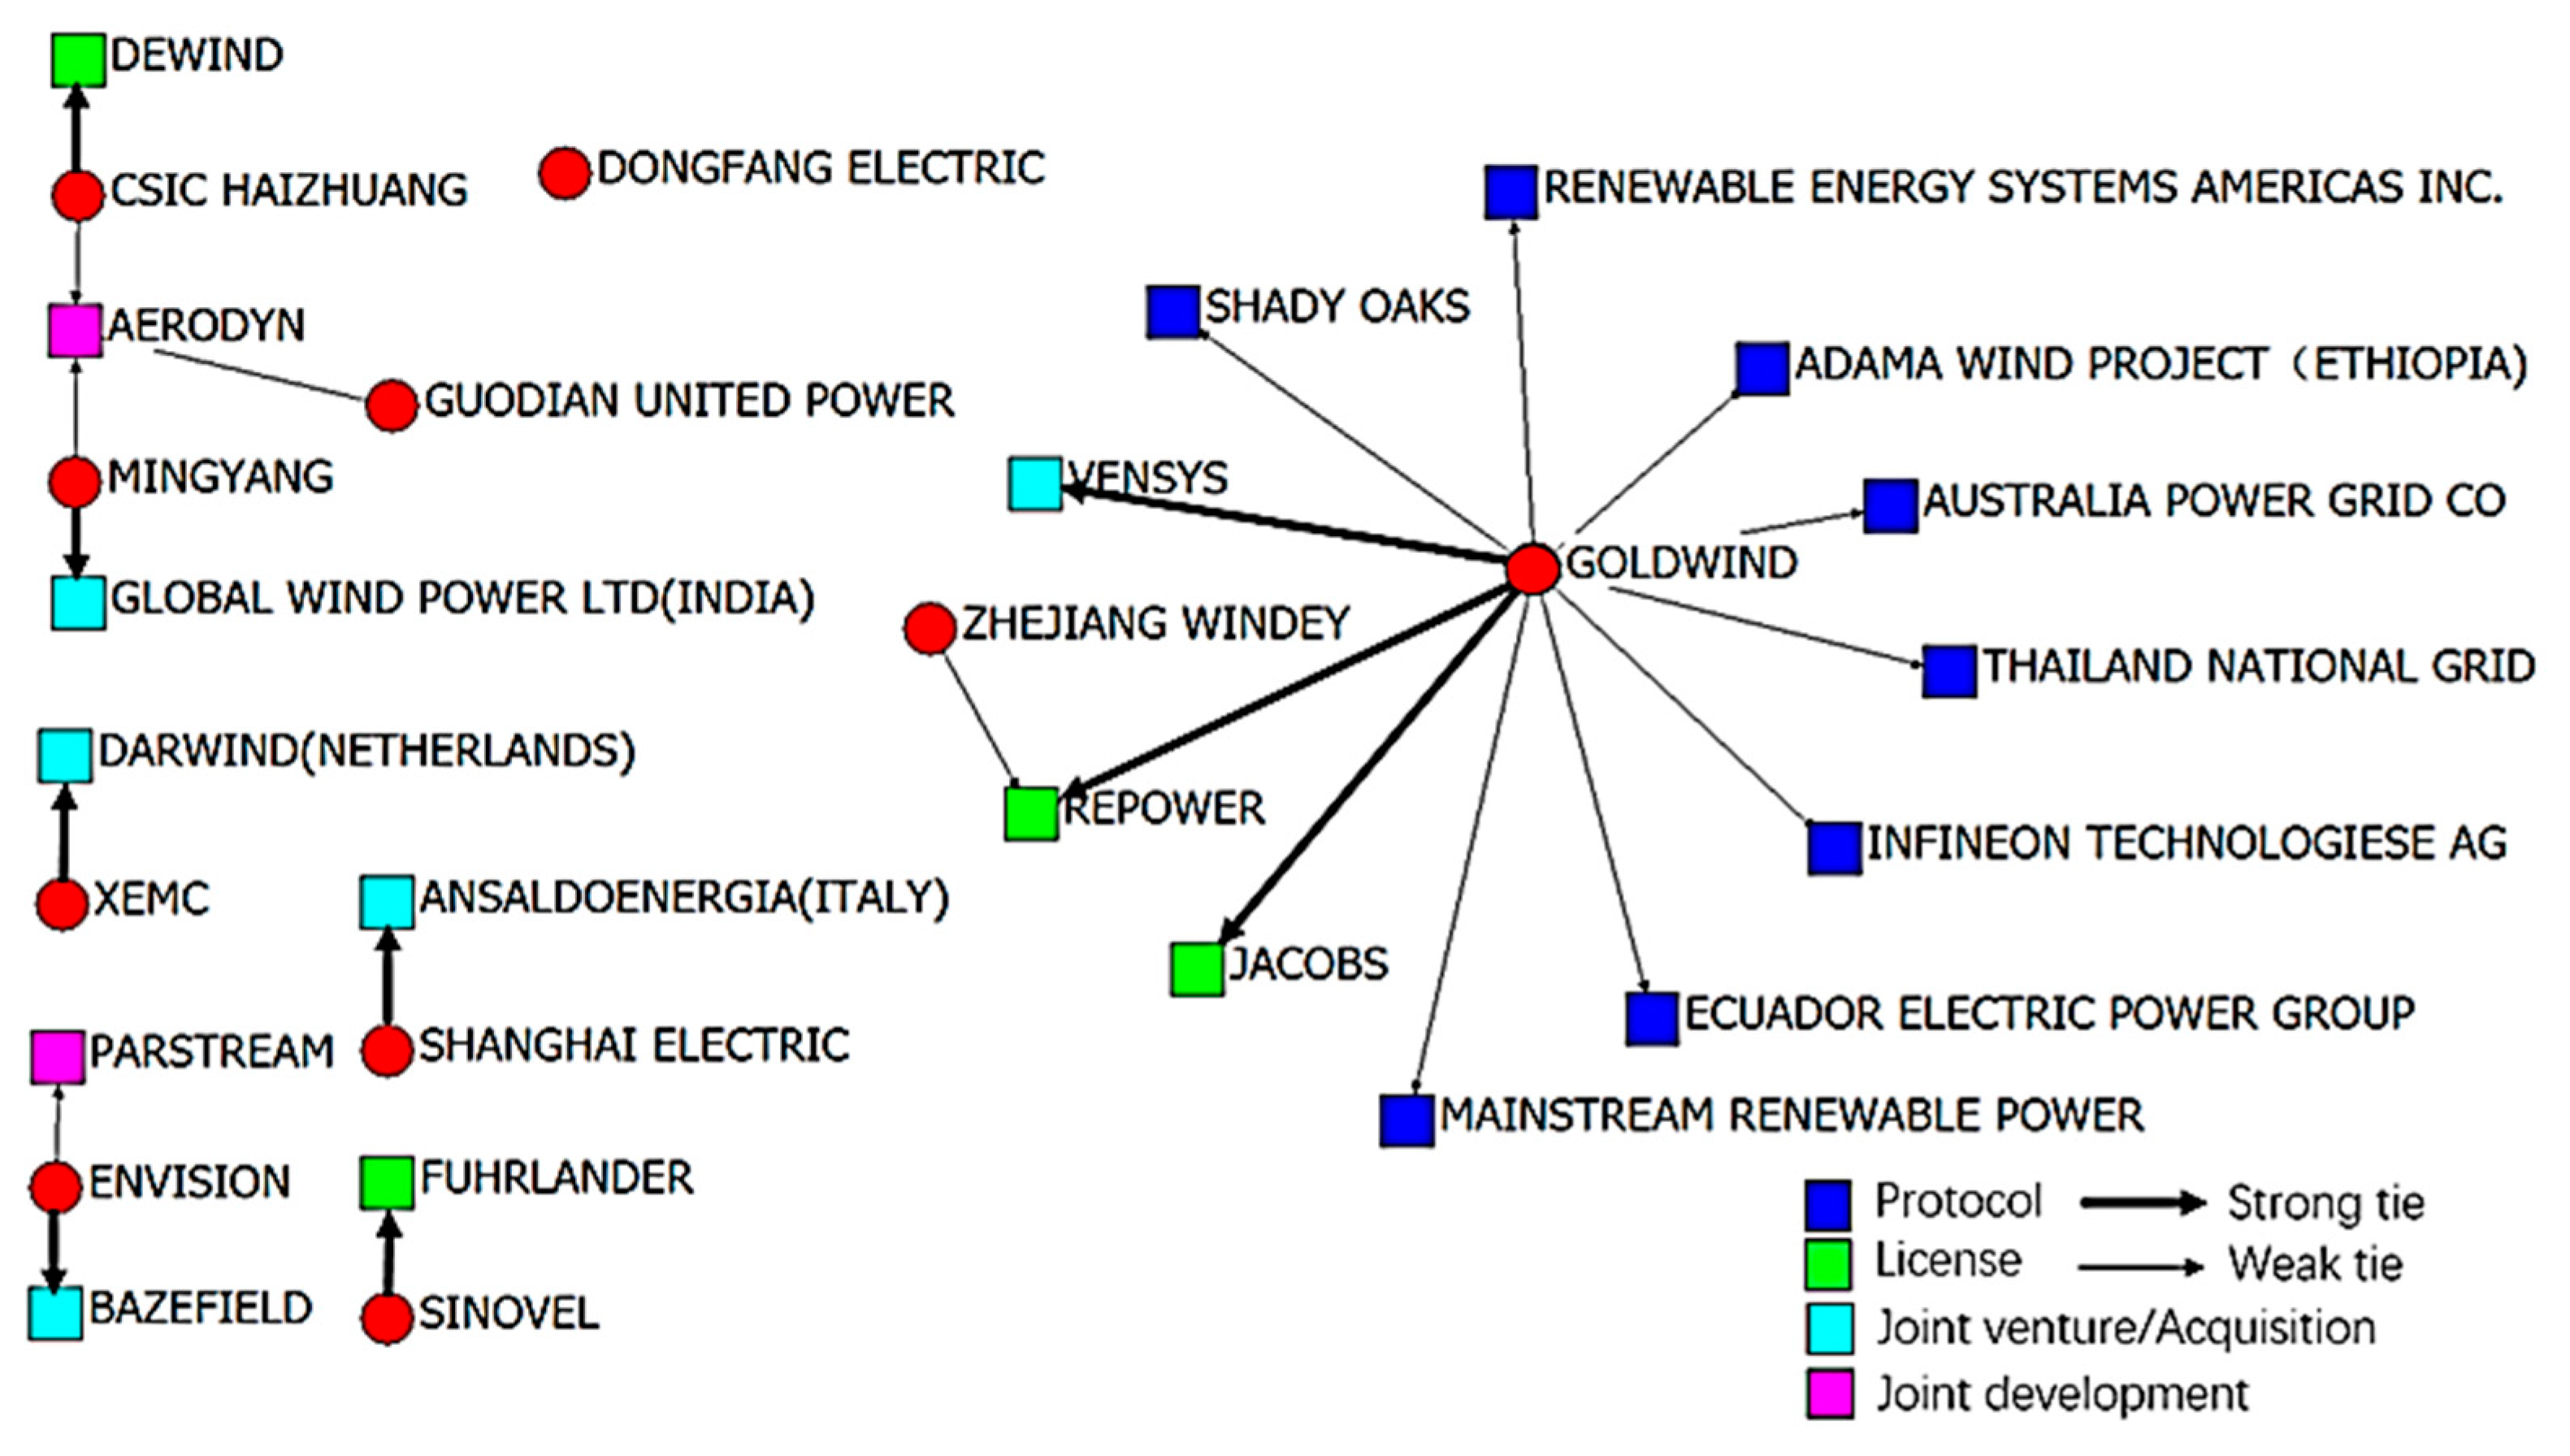
4.2.1. Wind Power Inter-Firm Explicit Knowledge Flow Analysis

Using the methods in Section 3.3, we constructed the wind patent knowledge networks for deep-mining the citation data and visualizing the results through UCINET 6.0 software, which can be used for central analysis, subgroup analysis, role analysis, and permutation based statistical analysis. To get a more comprehensive analysis of wind power industry, all of the sample patent data are derived from the top 18 international wind firms and two valuable design firms (German firm Vensys (which is owned by Chinese Goldwind) and Aerodyn) who have played important roles in the technology and knowledge transfer and cooperation between European and Asian firms. The whole period (1959–2015) was divided into two stages, using 2006 as the cut-off year, to create two sub-networks (1959–2006 and 2007–2015) and a full network (1959–2015), which help us to make a fully understanding of the evolution of leading firms over time. The detailed citation matrixes of both industries are listed in Appendix A.
Through the investigation of network indicators for different stages in Table 3, we discover some interesting features. Firstly, the increasing of network density indicates more and more firms (nodes) and citations (links) evolved in the network over time. Secondly, the rise of average distance values suggests that networks are more and complex, for the distance between firms is gradually increasing. The increasing values of distance-based cohesion and the decreasing of distance-weighted fragmentation both reflect the firm-level citation networks appearing to be more and more cohesive as there are fewer and fewer isolated islands within the knowledge network. Finally, in terms of degree centrality, we discover that out-degree centrality, in all networks, is higher than in-degree centrality, meaning that there are more knowledge producers than knowledge assimilators. However, the combination of increasing in-degree and decreasing out-degree centrality illustrates that fewer and fewer firms’ patent can be highly cited, for each firm begins to pay attention to indigenous innovation.
Figure 4 illustrates the resulting networks of wind power firms. Firstly, we realize that the central firms (black circles) that evolved in all three networks, including traditional European lead firms like Vestas, Enercon, Siemens, Senvion (formerly REpower), General Electric and Gamesa. In addition, Aerodyn as one of design firms also shortlisted into the first sub-network (1959–2006) and the full network (1959–2015), indicating it indeed plays important roles in international knowledge transfer. However, when compared to the European leading firms, Chinese firms are all at the periphery of the three networks, suggesting the play limited roles and disadvantaged innovation capabilities in the international knowledge flow. Secondly, the circles representing firms in the core positions are generally bigger, indicating that they depend on their own in-house knowledge to gain their current position. From Section 4.1, we know that the Danish and German firms tend to have bigger patent portfolios within the wide spectrum of core technologies and applications, which may explain why they frequently self-cite. Thirdly, we argue that due to knowledge spillover, the European firms are more similar to each other compared to Chinese firms, making the core firms closer to each other in position, while the Chinese firms are clearly knowledge learners.
Table 4 also displays the valuable indicators of the leading firms at different periods. The net citation counts clearly distinct knowledge contributors and knowledge assimilator. In the 1959–2006 network, Enercon has as knowledge spillover with the highest net citation counts, suggesting its positive role in contributing to the world, followed by Aerodyn for its rich knowledge base. However, in the 2007–2015 network, the firms General Electric, Gamesa, Senvion, and Nordex are newcomers that have also become knowledge producers. Meanwhile, General Electric plays the largest role in this period. In addition, what is worth mentioning is that, despite some core firms (e.g., Vestas, Siemens) acting as knowledge assimilators, they still possess a large number of forward (out-degree) and backward (in-degree) citations, suggesting that they are actively participating in the knowledge diffusion and are integrated into the knowledge networks. In contrast, Chinese leading firms, however, play very limited roles in the international innovation networks for their smaller number of both citing and cited patents (Guodian United Power had the highest out-degree with 58 citations). Thus, most of Chinese firms remain knowledge learners. Furthermore, the betweenness centrality, which represents firms’ capability in controlling the network information and resource, also echoes the above mentioned observations.

4.2.2. Solar PV Inter-Firm Explicit Knowledge Flow Analysis

As shown in Table 5, firstly, the decline of average distance indicates that PV firms are gradually closer to each other, which will benefit the connection and communication between firms, and also echoes the substantial shift during the 2007–2015 period. Secondly, the decline of both out-degree and in-degree centrality suggests that no obvious dominant leaders emerged. More and more firm register patent, which also illustrates the higher competitive situation in solar PV than the wind power. Finally, the gap between out-degree and in-degree centrality is also lower than the wind power, implying that leading firms in PV industry act as the technology spillovers or learners and they are in a more balanced situation, while the wind power remains more polarized.
Figure 5 displays the resulting networks of PV firms, which is different from Chinese wind firms. In the 1962–2006 network, firms like Sharp, Sanyo, and Kyocera, along with Sunpower and MEMC Electronic Materials, are clearly in the core positions. The Japanese firms have more self-citation patents and are situated at a closer distance between each other, indicating that they are much more similar regarding their technology application. As a contrast, Chinese lead firms hold little more than a peripheral position, which may be explained by the fact that China’s PV industry started out at this stage and played the role of technology learner. However, between 2007–2015, the PV network saw dramatic changes. In addition to three Japanese firms and China’s Sunpower still being in core positions, newcomers, like China’s Trina, Yingli, JA Solar, CSI solar, and the USA’s First Solar also entered into core positions. Meanwhile, Chinese firms held more central positions during that time when compared to other global firms, suggesting that the close contacts, communication, and knowledge flows between Chinese firms had promoted knowledge spillovers. Therefore, when compared to Chinese wind firms solar PV in this period has improved its position for a better and stronger situation. As for the 1962–2015 full network, Trina, Yingli, CSI solar, and JA solar still have competitive advantages and intensive interactions with global firms, showing that Chinese PV firms tend to build strong technological innovation capability and competition in the global PV market. As for the network indicators, in the 1962–2006 network, Sharp acts as a knowledge producer with the highest net citation counts, followed by Sanyo. Besides, Yingli becomes the largest knowledge consumer. However, in the 2007–2015 network Trina, Yingli, CSI, and JA Solar all actively participated in the international knowledge flow, and many Chinese firms transformed into knowledge producers, such as Trina, Suntech, Hareon Solar, JA Solar, Dongfang Risen, Renesola, and Saiwei LDK, despite their relatively lower patent citations.
In addition, the out-degree centrality (Table 6) shows Trina ranks fourth (95), JA Solar fifth (52), along with CSI and Yingli ranked seventh (39), and eighth (34). Meanwhile, the in-degree centrality also confirms this conclusion, since Yingli, CSI Solar, Trina, and JA Solar are, respectively, ranking second (155), fourth (90), seventh (62), and eighth (49). Therefore, PV firms in China have already engaged in knowledge transfer on a considerable scale and started to form an open innovation model. There is a sharp contrast between Chinese wind energy and solar PV lead firms in terms of their role and position, as Chinese PV firms display more competitiveness than the wind firms when compared to global firms.

4.3. Inter-Firm Tacit Knowledge Flow Analysis

4.3.1. Wind Power Inter-Firm Tacit Knowledge Flow Analysis

In the wind energy sector, knowledge flow mechanisms (Table 7 & Figure 6) are mainly focusing on product-related knowledge transfer (i.e., joint development/protocol and licensing). In the formative, pre-industrial phase of WP development in China, which lasted until approximately 2000, the knowledge flow mainly took place via government-orchestrated technology transfer agreements. Driven by the central government, WP in China appeared to follow a top-down paradigm that was domestically oriented. Technology imports were heavily used to augment competitiveness, and were viewed as a traditional development method. A notable example was licensing agreements involving Goldwind as the recipient firm with German Jacobs (later purchased by REpower), which was promoted by two government-funded ventures. In the following phase of early market formation (lasting until 2005), government-backed joint ventures were replaced by fully indigenous firms operating with private licensing agreements. Major Chinese wind turbine producers, like Sinovel, Dongfang, Yunda/Windey, and Goldwind, had licensing agreements with mainly Danish and German technology suppliers [12,61,80]. Chinese firms in the wind power industry have relied on transfer mechanisms with heavy involvement of supplier firms over prolonged periods of time. This has enabled the transfer of a high degree of product-specific tacit knowledge.
Chinese firms in the WP industry have relied on tacit knowledge flow with heavy involvement of supplier firms. Since protocol and joint developments were the dominant form of knowledge collaboration in the early stage of Chinese industry development, this has given way to the creation of direct subsidiaries by foreign producers and purchases of design licenses in the subsequent stage of industry formation. Product and design-specific knowledge, provided by other turbine producers and specialized design firms in the form of joint ventures and development projects, has been central for transfer processes and it remains so over time. Moreover, the use of outward mergers and acquisitions to purchase other manufacturers and design firms at later stages in the industrial development process indicates that Chinese firms still lack sufficient market shares in international markets and that they are trying to access product-specific knowledge developed through user-producer interactions in those markets. In addition, Table 7 shows that the wind industry is focused on cultivating interactions with countries like India, Thailand, and Ethiopia. Today, WP is underdeveloped and presents ample opportunities for joint market development by catch-up countries.

4.3.2. Solar PV Inter-Firm Tacit Knowledge Flow Analysis

Knowledge flows in China’s solar PV sector has taken a very different form than in the wind energy sector. It has revolved around two major channels of transfer that only played a minor role in the wind energy sector, namely acquisition in production equipment and the movement of personnel [32], as shown in Table 8 & Figure 7. Different from the wind power, the transfer of knowledge from other manufacturers in the form of design license agreements played only a very minor role. The limited licensing that did occur was focused on the licensing of production process steps [4]. In the PV industry, transfer mechanisms have mainly facilitated the transfer of process-related knowledge and the scope of tacit knowledge transfer has been comparatively lower.
A key channel for technology transfer in the PV sector has been the international trade in production equipment. This equipment has been produced and sold by independent equipment providers, especially from the US, Germany, Switzerland, and to a lesser degree, Japan, rather than manufacturers of PV modules or cells [39]. While an important number of these equipment suppliers are based in large markets like Germany, they are not directly involved in the production of PV modules or systems, which has provided great development opportunities for China’s solar PV industry.
Moreover, the negotiability of skilled personnel can be another significant factor that promotes solar development. Tacit knowledge has been transferred via human resource transfers and in cooperation with international research institutes and certifiers. A larger number of foreign-trained Chinese and non-Chinese professionals joined major PV firms, occupying important positions in the realm of technology development and marketing. Chinese PV firms have significantly benefited from the joining of highly skilled personnel, who brought capital, management experience, professional networks, and technology. For example, Yingli’s CEO has studied abroad. Trina Solar has established special “international staffing teams” [46], and half of the management team has studied or worked abroad. The entire senior management staff of CSI have international backgrounds. This kind of talent structure has promoted CSI as an international solar energy firm. Thus, the prevalence of executives with foreign training and the local mobility of Chinese employees have accelerated knowledge diffusion of the Chinese PV industry. Table 8 also reflects that most knowledge flow modes of Chinese PV firms are linked to developed countries, like the US, Japan, Spain, while wind firms concentrates on developing countries, such as Thailand and Ethiopia.
As the sector matured internationally, China’ s PV industry has worked on evolving into the global innovation system, engaging in the international knowledge networks and beginning to act as innovators and global leaders. In this sense, Chinese solar PV firms’ international couplings in China are stronger than wind firms, yet the competitive advantage that China has developed in PV manufacturing may still be more vulnerable than the competitive advantage that European and American firms still enjoy in the wind power industry.

4.4. Comprehensive Comparison Analysis of Wind Power and Solar PV Industry

4.4.1. Divergent Global Knowledge Positions between Wind Power and Solar PV

According to the analysis above, this section provides a brief synthesis of the main results of the paper, connecting inter-country knowledge flow-based clusters and inter-firm explicit and tacit knowledge flows to the different industrial development trajectories that were observed in China’s WP and PV sectors (see Table 9). These outcomes are examined in a detailed discussion in Section 5 for the possible explanations.

4.4.2. Validity of Analysis and Methodological Limitations

To corroborate the above results, we conducted in-depth interviews with WP and PV experts. The interviewees added qualitative information to supplement the quantitative findings. We also validated the research findings with leading energy experts in China who confirmed that the patent results seemed to be consistent with their professional understanding of the situation. However, some indicated that patent data bias must be handled judiciously. Thus, we collated the possible data bias that might impact our analysis. Based on research by De Rassenfosse et al. [55] and Frietsch and Schmoch [81], transnational patent analysis may have issues, such as: uneven patent values, geographic bias, and institutional bias. We argue that such data biases are unavoidable and did not cause substantial distortion of the results.
For the patent citation knowledge network analysis, we utilize transnational patent citation data. However, this produced institutional bias owing to the different regulatory requirements of various patent offices. For example, USPTO applicants are obligated to cite all associated preceding patents, whereas for EPO the citations are added by examiners. Furthermore, China’s patent office started requiring mandatory citations after 2005 and the examination of all global previous patents after 2009. Thus, in China, the backward citations may be less than expected before 2009 due to the lack of enforcement by that jurisdiction. Due to cultural and linguistic differences, the patents in developing countries are cited less frequently by those in developed economies. However, these institutional biases have been lessened in this study’s data after 2009, with the development of legal practices (e.g., China complying with international standards). Meanwhile, the use of a professional database can also help to reduce the above mentioned institutional bias. The Derwent Patent Citation Index DPCI has combined missing citation data that were not disclosed in the public State Intellectual Property Office of China SIPO database, which provides a platform that is reviewed by experts so that non-English patents can be properly assessed.
Moreover, on the advice of industrial experts, we utilized invention patent counts (which are higher value relative to other patents) to limit bias. In sum, the biases in this study are kept to a minimum.

5. Discussion: Industrial Characteristics, Market Preference, and Policy Models

Climate change is one of the world’s greatest challenges. Mitigating the emissions leading to climate change in order to achieve sustainable development requires the large-scale deployment of low carbon energy technology, such as wind and solar energy technology. Our research shows that there are differences between the Chinese WP and PV industries in terms of inter-country knowledge flow-based clusters, inter-firm explicit knowledge and tacit knowledge flows based on patent data, extensive expert interviews, and desktop research. The patent-analysis results echo the main findings of Huenteler et al. and Quitzow et al. [4,7] about the challenges of complex systems like WP—which need time to grow through learning by doing and a strong home market to nurture it—and the mass production technologies of PV that revolves around dominant designs. The patent data that were analyzed in this study confirms these findings and suggests that the Chinese WP industry is far from being a global innovator, despite its remarkable market success. However, the PV industry appears to be different for its global competitiveness in innovation, as lead firms are centrally embedded in the global knowledge network and have strong couplings with global firms. Adding to this, we discuss about the possible influencing factors behind these conditions. As noted by Soete [82], the determinant factors for these differences may include: industrial technology characteristics, market orientation, and policy implementation model. The expert interviews that were conducted for this research also provide some insights for the discussion.

5.1. Industrial Technology Characteristics and Technology Policy of Chinese WP and PV

Since the initial stages of development of the renewable industries, China’s WP industry was favoured domestically, with a strong focus on scale over quality or innovation [4,7,13]. The aim was to increase the installed capacity of WP farms across the nation to meet energy demand and to reduce the need for fossil-fueled power plants. PV technology was not considered practical due to the lack of space in cities, so the industry was designed for export [32]. While WP technologies are competitive, the specifications are still below those of European firms [83].
The policy of the Chinese Government has not sufficiently pressured WP firms to innovate, which was already burdened with a longer learning process and the need for explicit and tacit knowledge on top of experienced professionals to make this nascent industry competitive [4]. The Government made it clear that technology transfer through foreign direct investment (FDI) and the licensing of foreign technology was more preferable than investing in large-scale indigenous innovation. The aim was to install the greatest possible capacity of WP in as short time frame as possible without becoming a core innovator. Most of the industry’s core technologies flow in from the open market via licenses and joint projects, rather than in-house R&D. Meanwhile, European firms kept core technologies under tight control with some outsourcing of semi-core and non-core technologies [21,58,84].
While both wind turbines and PV cells are advanced technologies, there is a stark contrast in technical difficulty that is associated with its development and manufacturing. Interviewees argued that a wind turbine is a highly complex technology. The development and manufacturing involved requires very high quality skills in electro-engineering. This is why countries that have a long history of producing other complicated electronic devices are innovation leaders in this field, and China has far less experience needed to be a leader. These factors explain why today’s knowledge flow situation has led to China’s limited leadership with regards to patents and knowledge in the wind sector.
PV cells and panels are simpler in comparison due to the dominant designs that are available to manufacturers [4,7]. They require less expertise in other engineering fields, are easier to assemble, require less logistics, and catching up on technological processes is faster [44]. The complexity of PV technology makes reverse engineering easier than it is for WP technology. These factors enabled Chinese firms to become leaders in the PV industry quickly.

5.2. Market Orientation and Demand Policy of Chinese WP and PV

The Chinese government’s prioritization of WP for the domestic market explains why both industries have built up a strong market share in their respective target markets through the scaling and driving down cost of production. However, there are key differences in the competitiveness of each industry given the policies set by the Government. The transfer of technology through the marketplace has also helped both industries to grow, though PV research has begun to gain momentum to reduce dependence on foreign technologies—as shown through the more numerous patents filed by Chinese PV firms.
The domestic market was not profitable for the PV industry during the early years in China. At that time, consumers were held back by high prices, lack of government support, and challenges of installing PV modules—most potential users do not own or have access to roof space and connecting with the grid was difficult—meaning that solar PV modules would not be widely deployed. Some of these challenges relating to grid connections and space issues continue to be a major problem in China [13,32]. WP needed the home market to give it time to learn and grow through technology transfers and other learning by using methods [7]. Most are used in ground-mounted, large-scale parks, for which financial support is particularly vital.
As a result of innovation, cheap financing, and scaling, China has become the world’s leading supplier of solar PV as about 95% of China’s PV products were exported in 2012 [85]. This is a direct result of the recent trade disputes. This decline in traditional overseas markets for PV has made policymakers rethink solar energy within China. Being geared towards the export market, solar PV producers had to ensure that they delivered high quality and cutting-edge innovation that could compete with foreign firms.
On the other hand, WP has focused solely on expansion of domestic power generation capacity. The Chinese government took drastic measures to promote indigenous innovation in the WP industry by introducing a local content requirement, which was 50% from 2004 to early 2005, and was then augmented to 70% from mid-2005 until its abolishment in 2009 [86]. The local content requirement meant that 70% of the wind turbine and its components had to be sourced locally [31,86]. This also meant that foreign firms still had access to the Chinese market, but their production had to be in China.
The local content requirement was a partial success in helping indigenous firms to gain the ability to create new knowledge through joint research. Many domestic firms and joint ventures emerged between 2004 and 2008. Market access was consequently traded for part-Chinese ownership in joint ventures and research [4,7,86]. Within five years, the market share of domestic wind turbines rose to more than 60%, while the market share of foreign turbines plummeted to 40% in 2008 [86,87]. In 2010, the Chinese firms were among the top ten in wind turbine manufacturing [86]. This meant that the existing foreign technology was being used to manufacture in China on a larger scale, hence addressing manufacturing capabilities, whereas the ownership of the patent still largely remained with foreign wind firms.

5.3. Policy Implementation of Chinese WP and PV

The policy implementation models for China’s wind and PV industries have clear differences. In response to the energy shortage, developing WP was established as the key component of national energy strategy. The development of Chinese wind in terms of equipment manufacturing, power plant construction, and grid power supply, due to the Government’s strategic steering about large-scale development of wind through policy tools to foster a robust wind market. Through REL and relevant regulations that are set by the Government, China has effectively promoted firms in the wind market. Furthermore, the local government and relevant market institutions also support the development of wind. The wind industry operates a top-down policy implementation model that is characterized by the market incentives that are formulated by the central government and deployed by local actors. The government guidance and support of the wind market are the basic characteristics of the top-down model.
The key drivers for PV technology development to China was the implementation of a global market policy, mobilization of global talents, the elasticity of China’s manufacturing capacity, and China’s deferred policy incentives to develop a home market for PV [8]. The model for the PV industry operated on the basis of cost constraints, but domestic manufacturing enterprises have played an active and positive role in expanding the domestic market. A few enterprises seized the opportunity to develop polycrystalline silicon photovoltaics and local government cooperated with enterprises committing to promote the central government’s preferential policy and PV FIT. Hence, policy implementation of PV industry is a bottom-up model.
The in-depths interviews revealed that, due to the protection and preferential policy of the domestic market, wind development is mainly focused on the domestic market, making it inadequate for international market competition due to insufficient conditions to innovate. These factors suggest that Chinese solar firms were forced to focus on innovation capabilities more than wind firms. Access to international technology and market exposed lead firms to fierce competition and prodded efforts to be competitive. Methodological limitations do exist. Patent citation methods may have the data bias issue, so that multi-dimensional data (e.g., bibliometrics etc.) that deals with knowledge flows should be explored in order to complement the patent data in future research. To overcome these issues, this research triangulated the patent data analysis with information from in-depths interviews and policy analysis.

6. Conclusions and Policy Implications

Our research shows that there is a substantial difference in the international knowledge links of China’s WP and PV industries to the global knowledge networks, based on patent citation clustering and network analysis. China’s PV industry has stronger international knowledge linkages in terms of knowledge clustering and explicit knowledge flow, but the wind power industry has a stronger tacit knowledge flow. This suggests that these industries both have strong connections to the global knowledge networks, but they may involve disparate catch-up pathways that concern follower-modes and leader-modes. Further, this study argues that the discrepancies of global knowledge links between China’s wind and solar PV industries may be caused by different technology characteristics, market orientation, and policy implementation.
Our main findings are as follows: First, China’s wind & PV sectors appear to be quite different in terms of renewable energy technology clustering. For example, based on patent and citation counts China’s wind industry is still far less innovative than the European and American wind industries. By contrast, PV technologies’ global landscape is divergent. China and most other countries occupy a specific value component each across the full value chain—and PV appears to be more open to the global explicit knowledge community. Second, there are stark contrasts between the role that Chinese wind and PV firms play in global knowledge networks in terms of how much each industry relies on the inflow of explicit technological knowledge and the capacity to generate explicit knowledge that feedback to traditional knowledge creators. For the wind industry, the core positions in global knowledge networks are held by leading foreign firms. Contrarily, leading Chinese PV firms hold some core positions of the PV explicit knowledge networks. Lastly, by acquiring manufacturing equipment, transfer of explicit knowledge, and mobility of skilled workers across borders, Chinese PV firms have built strong links through inter-firm collaboration across the world, while Chinese wind firms have weak links focusing on joint development or protocol, relying on a high degree of product-specific tacit knowledge. This provides evidence that the solar industry is much more innovative than the wind industry due to its linkages to the world.
We also show that the following factors may be significant: (1) Domestic policy favoured wind energy within China, while the Chinese solar industry had to be more internationally-oriented and export-oriented. The wind power is successful as a means of increasing China’s RE capacity, but it is not competitive internationally in terms of the original knowledge that it creates and uses. The reliance on technology transfer has made it less lucrative for Chinese WP firms to innovate in-house. The result is that the China’s WP industry relies on its manufacturing capacity to keep its place in the global market; (2) there is a technical difficulty of learning about manufacturing wind turbines when compared with PV technology. Technology transfer and cooperation from the Global North played a key role where the Chinese WP industry was for many decades much more dependent on external support; and, (3) the patent data shows China’s PV industry was oriented towards international markets due to the indigenous firms’ capacity to scale up production, their ability to engage in inter-firm joint research, and domestic policy, which was a bottom-up policy implementation model, while wind followed a top-down model.
The above findings may offer important implications for systematic and nuanced policies. First, European players have successfully developed the dominant designs in renewable energy innovations, which leaves Chinese wind firms with limited opportunities to leapfrog with regard to the existing technology trajectories and surpass their European counterparts. Chinese WP risks being unable to keep up technologically with the lead foreign firms due to the lack of R&D resources for core technologies. A possible solution is to amend government incentives to address the higher technical difficulty that is associated with WP research, and to focus less on installation goals. Furthermore, higher standards for the quality of WP technologies deployed in China would also tweak the strategic thinking of leading Chinese WP firms on innovation. By contrast, Chinese solar PV firms do hold patents in core technologies that are associated to the manufacturing processes of solar panels, which provides a potential to become technology leaders. Second, Chinese wind firms are currently positioned at the periphery of global knowledge networks with limited roles to play, and they are still recognized as knowledge absorbers. Chinese solar PV firms have engaged in international knowledge networks with more central positions, therefore lead firms develop technology-driven innovation and are creating stronger competitive advantages. Third, Chinese wind firms rely on a high degree of product-specific tacit knowledge; while, in the PV industry, the flow of knowledge involve comparatively higher scope of explicit knowledge in term of patent citations. In this sense, Chinese WP industry is driven by knowledge collaboration while PV is more codified-knowledge flow oriented. Lastly, as WP is complex production system-based, solar PV is mass-produced goods that enlighten us a process-related technology-driven innovation can be prioritized—Chinese manufacturers have the expertise. This may partially explain why Chinese PV can better utilize the international market as they have unique knowledge edge; the other way round, the competition in the international market may also coerce Chinese PV to better integrate into the global innovation network. With regarding to the policy, the relative success of Chinese PV industry in global knowledge networks offers insight on how Chinese WP policies should be more bottom-up and market-oriented, which would better promote the development of China’s renewable industries.
These findings are useful for national and international sustainable development policy and climate policy. Our findings suggest that China is increasingly a source of solar energy innovation, less so of wind energy innovation. The policy implications are therefore that China could be more pro-active in deploying its solar energy innovation, both on the domestic market and world-wide. This has implications for technology transfer and cooperation for low carbon energy, both for the Global South and the Global North [13]. China could be an increasing source of cost-effective solar energy innovation, particularly as a technology supplier for other countries in the Global South. This strategy could support sustainable development in China and beyond.

Author Contributions

Y.Z. is an Associate Professor at Tsinghua University’s School of Public Policy and Management. His primary research interests are innovation management, green development, emerging technologies, and renewable energy. M.P. is a doctoral student at Tsinghua University’s School of Public Policy and Management. Her research focus is centered on the diffusion of innovations, green development, emerging technologies, and renewable energy. F.U. is Reader in Environment and Development at the Centre for Development, Environment and Policy (CeDEP) at SOAS, University of London. Her primary research interests are renewable energy, energy and climate policy, technology transfer and cooperation, low carbon development and green transformations. For this research, Y.Z. and F.U. developed the research idea, Y.Z. and F.U. conducted interviews (with the help of research assistants), M.P. conducted the data mining and analyzed the data; and all of the three authors wrote the paper. Y.Z. led the overall project.

Acknowledgments

The authors would like to thank the National Natural Science Foundation of China (91646102, L1724034, L16240452, L1524015, 71203117), and the MOE (Ministry of Education in China) Project of Humanities and Social Sciences (16JDGC011), the Chinese Academy of Engineering’s China Knowledge Centre for Engineering Sciences an Technology Project (CKCEST-2015-4-2, CKCEST-2017-1-10), the UK-China Industry Academia Partnership Programme (UK-CIAPP260), the Volvo-supported Green Economy and Sustainable Development Tsinghua University (20153000181), the Tsinghua Initiative Research Project (2016THZW), the National Natural Science Foundation, the Chinese Academy of Engineering and the UK Economics and Social Research Council (ES/K006002/1) for funding this research. We would like to thank all project participants, research assistants and collaborators as well as all interviewees.

Conflicts of Interest

The authors declare no conflict of interest.

Appendix A

Figure A1. Wind power full network of 1959–2015.
Sustainability 10 01883 g0a1
Figure A2. PV solar full network of 1962–2015.
Sustainability 10 01883 g0a2

Appendix B

Table A1. comparing the policy implementation models: top-down (wind power) and bottom-up (PV).
IndicatorsChinese Wind Power Industry (Top-Down)Chinese PV Industry (Bottom-Up)
Industry development modelPulled by the local marketPulled by the international market
Financing modelGovernment dominantPushed by manufactures
Role of central governmentActive dominantPassive dominant
Role of local governmentActive participantActive pusher
Role of banking and capital marketsPolicy signal receiverDriven by capital profit
Role of manufacturerActive participantPusher
Support of local marketYes No
Policy makingInfluenced by the clear development strategy of central government.Influenced by PV manufacturers and local government.
Policy implementationUnder the clear policy guidance, governments, manufactures and banks have formed a huge force, promoting the development of wind power.Under the impetus of the PV manufacturers and local government, the central government promotes the related national photovoltaic policy.

References

  1. World Energy Council (WEC). World Energy Resources: Waste to Energy; World Energy Council: London, UK, 2018. [Google Scholar]
  2. Braun, F.G.; Schmidt-Ehmcke, J.; Zloczysti, P. Innovative Activity in Wind and Solar Technology: Empirical Evidence on Knowledge Spillovers Using Patent Data; Discussion Paper 993; German Institute for Economic Research: Berlin, Germany, 2010. [Google Scholar]
  3. Liu, Q.; Lei, Q.; Xu, H.; Yuan, J. China’s energy revolution strategy into 2030. Resour. Conserv. Recycl. 2018, 128, 78–89. [Google Scholar] [CrossRef]
  4. Quitzow, R.; Huenteler, J.; Asmussen, H. Development trajectories in China’s wind and solar energy industries: How technology-related differences shape the dynamics of industry localization and catching up. J. Clean. Prod. 2017, 158, 122–133. [Google Scholar] [CrossRef]
  5. Van Eynde, S.; Chang, P.F. Explaining the development of China’s renewable energy policies: Comparing wind and solar power. In Governance of Climate Relations between Europe and Asia: Evidence from China and Vietnam as Key Emerging Economies; Edward Elgar: Cheltenham, UK, 2013; pp. 76–106. [Google Scholar]
  6. Sun, B.; Yu, Y.; Qin, C. Should China focus on the distributed development of wind and solar photovoltaic power generation? A comparative study. Appl. Energy 2017, 185, 421–439. [Google Scholar] [CrossRef]
  7. Huenteler, J.; Schmidt, T.S.; Ossenbrink, J.; Hoffmann, V.H. Technology life-cycles in the energy sector—Technological characteristics and the role of deployment for innovation. Technol. Forecast. Soc. Chang. 2016, 104, 102–121. [Google Scholar] [CrossRef]
  8. Zhang, F.; Sims Gallagher, K.S. Innovation and technology transfer through global value chains: Evidence from China’s PV industry. Energy Policy 2016, 94, 191–203. [Google Scholar] [CrossRef]
  9. Lewis, J.I.; Wiser, R.H. Fostering a renewable energy technology industry: An international comparison of wind industry policy support mechanisms. Energy Policy 2007, 35, 1844–1857. [Google Scholar] [CrossRef] [Green Version]
  10. Lewis, J.I. Building a national wind turbine industry: Experiences from China, India and South Korea. Int. J. Technol. Glob. 2011, 5, 281. [Google Scholar] [CrossRef]
  11. Lewis, J. Green Innovation in China: China’s Wind Power Industry and the Global Transition to a Low-Carbon Economy; Columbia University Press: New York, NY, USA, 2013. [Google Scholar]
  12. Urban, F.; Zhou, Y.; Nordensvard, J.; Narain, A. Firm-level technology transfer and technology cooperation for wind energy between Europe, China and India: From North–South to South–North cooperation? Energy Sustain. Dev. 2015, 28, 29–40. [Google Scholar] [CrossRef] [Green Version]
  13. Urban, F. China’s rise: Challenging the North-South technology transfer paradigm for climate change mitigation and low carbon energy. Energy Policy 2018, 113, 320–330. [Google Scholar] [CrossRef]
  14. Fitjar, R.D.; Rodríguez-Pose, A. Firm collaboration and modes of innovation in Norway. Res. Policy 2013, 42, 128–138. [Google Scholar] [CrossRef]
  15. Nepelski, D.; De Prato, G. International technology sourcing between a developing country and the rest of the world. A case study of China. Technovation 2015, 35, 12–21. [Google Scholar] [CrossRef]
  16. Collins, H.M. The TEA set: Tacit knowledge and scientific networks. Sci. Stud. 1974, 4, 165–185. [Google Scholar] [CrossRef]
  17. Zhou, Y.; Li, X.; Lema, R.; Urban, F. Comparing the knowledge bases of wind turbine firms in Asia and Europe: Patent trajectories, networks, and globalisation. Sci. Public Policy 2015, 43, 476–491. [Google Scholar] [CrossRef]
  18. Pan, M.; Zhou, Y.; Zhou, D.K. Comparing the innovation strategies of Chinese and European wind turbine firms through a patent lens. Environ. Innov. Soc. Transit. 2017. [Google Scholar] [CrossRef]
  19. Nesta, L.; Saviotti, P.P. Coherence of the knowledge base and the firm’s innovative performance: Evidence from the US pharmaceutical industry. J. Ind. Econ. 2005, 53, 123–142. [Google Scholar] [CrossRef]
  20. Bekkers, R.; Martinelli, A. Knowledge positions in high-tech markets: Trajectories, standards, strategies and true innovators. Technol. Forecast. Soc. Chang. 2012, 79, 1192–1216. [Google Scholar] [CrossRef]
  21. Zhou, Y.; Zhang, H.; Ding, M. How public demonstration projects affect the emergence of new industries: An empirical study of electric vehicles in china. Innov. Manag. Policy Pract. 2015, 17, 159–181. [Google Scholar] [CrossRef]
  22. Dones, R.; Heck, T.; Emmenegger, M.F.; Jungbluth, N. Life-cycle inventories for the nuclear and natural gas energy systems, and examples of uncertainty analysis. Int. J. Life Cycle Anal. 2005, 10, 10–23. [Google Scholar] [CrossRef]
  23. Vautard, R.; Thais, F.; Tobin, I.; Bréon, F.M.; De Lavergne, J.G.D.; Colette, A.; Yiou, P.; Ruti, P.M. Regional climate model simulations indicate limited climatic impacts by operational and planned European wind farms. Nat. Commun. 2014, 5, 1–9. [Google Scholar] [CrossRef] [PubMed]
  24. Xue, B.; Ma, Z.; Geng, Y.; Heck, P.; Ren, W.; Tobias, M.; Maas, A.; Jiang, P.; de Oliveira, J.A.P.; Fujita, T. A life cycle co-benefits assessment of wind power in China. Renew. Sustain. Energy Rev. 2015, 41, 338–346. [Google Scholar] [CrossRef]
  25. Duan, H. Emissions and temperature benefits: The role of wind power in China. Environ. Res. 2017, 152, 342–350. [Google Scholar] [CrossRef] [PubMed]
  26. He, D.X. Coping with climate change and China’s wind energy sustainable development. Adv. Clim. Chang. Res. 2016, 7, 3–9. [Google Scholar] [CrossRef]
  27. Xiang-Wan, D.U. China’s goal to increase non-fossil energy sources. Adv. Clim. Chang. Res. 2016, 1, 1–2. [Google Scholar]
  28. Altenburg, T.; Pegels, A. Sustainability-oriented innovation systems–managing the green transformation. Innov. Dev. 2012, 2, 5–22. [Google Scholar] [CrossRef]
  29. Buen, J. Danish and Norwegian wind industry: The relationship between policy instruments, innovation and diffusion. Energy Policy 2006, 34, 3887–3897. [Google Scholar] [CrossRef]
  30. Jonsson, D. Sustainable infrasystem synergies: A conceptual framework. J. Urban Technol. 2000, 7, 81–104. [Google Scholar] [CrossRef]
  31. Wang, Q. Effective policies for renewable energy—The example of China’s wind power—Lessons for China’s photovoltaic power. Renew. Sustain. Energy Rev. 2010, 14, 702–712. [Google Scholar] [CrossRef]
  32. Urban, F.; Geall, S.; Wang, Y. Solar PV and solar water heaters in China: Different pathways to low carbon energy. Renew. Sustain. Energy Rev. 2016, 64, 531–542. [Google Scholar] [CrossRef]
  33. REN21, R. Global Status Report; REN21 Secretariat: Paris, France, 2016. [Google Scholar]
  34. Sun, H.; Zhi, Q.; Wang, Y.; Yao, Q.; Su, J. China’s solar photovoltaic industry development: The status quo, problems and approaches. Appl. Energy 2014, 118, 221–230. [Google Scholar] [CrossRef]
  35. Zhao, X.; Li, S.; Zhang, S.; Yang, R.; Liu, S. The effectiveness of China’s wind power policy: An empirical analysis. Energy Policy 2016, 95, 269–279. [Google Scholar] [CrossRef]
  36. Zhang, S.; Andrews-Speed, P.; Ji, M. The erratic path of the low-carbon transition in China: Evolution of solar PV policy. Energy Policy 2014, 67, 903–912. [Google Scholar] [CrossRef]
  37. Zhou, Y.; Pan, M.; Zhou, D.; Xue, L. Stakeholder risk and trust perceptions in the diffusion of green manufacturing technologies: Evidence from china. J. Environ. Dev. 2017, 27, 46–73. [Google Scholar] [CrossRef]
  38. Goodrich, A.C.; Powell, D.M.; James, T.L.; Woodhouse, M.; Buonassisi, T. Assessing the drivers of regional trends in solar photovoltaic manufacturing. Energy Environ. Sci. 2013, 6, 2811–2821. [Google Scholar] [CrossRef]
  39. Hughes, L.; Quitzow, R. Low-carbon technologies, national innovation systems, and global production networks: The state of play. In Handbook of International Political Economy of Energy and Natural Resources; Goldthau, A., Keating, M., Kuzemko, C., Eds.; Edward Elgar: Cheltenham, UK, 2017. [Google Scholar]
  40. Sorenson, O.; Rivkin, J.W.; Fleming, L. Complexity, networks and knowledge flow. Res. Policy 2006, 35, 994–1017. [Google Scholar] [CrossRef] [Green Version]
  41. Zhou, Y.; Minshall, T. Building global products and competing in innovation: The role of Chinese university spin-outs and required innovation capabilities. Int. J. Technol. Manag. 2014, 64, 180–209. [Google Scholar] [CrossRef]
  42. Lundvall, B.A. National Innovation System: Towards a Theory of Innovation and Interactive Learning; Pinter: London, UK, 1992. [Google Scholar]
  43. Parrilli, M.D.; Heras, H.A. STI and DUI innovation modes: Scientific-technological and context-specific nuances. Res. Policy 2016, 45, 747–756. [Google Scholar] [CrossRef]
  44. Zhou, Y.; Xu, G.; Minshall, T.; Liu, P. How do public demonstration projects promote green-manufacturing technologies? A case study from china. Sustain. Dev. 2015, 23, 217–231. [Google Scholar] [CrossRef]
  45. Wang, D. Activating cross-border brokerage: Interorganizational knowledge transfer through skilled return migration. Adm. Sci. Q. 2015, 60, 133–176. [Google Scholar] [CrossRef]
  46. De la Tour, A.; Glachant, M.; Meniere, Y. Innovation and international technology transfer: The case of the Chinese photovoltaic industry. Energy Policy 2011, 39, 761–770. [Google Scholar] [CrossRef] [Green Version]
  47. Guan, J.; Chen, Z. Patent collaboration and international knowledge flow. Inf. Process. Manag. 2012, 48, 170–181. [Google Scholar] [CrossRef]
  48. Ernst, H. Patent information for strategic technology management. World Pat. Inf. 2003, 25, 233–242. [Google Scholar] [CrossRef]
  49. Griliches, Z. Patent Statistics as Economic Indicators: A Survey (No. w3301); National Bureau of Economic Research: Cambridge, MA, USA, 1990.
  50. Breitzman, A.; Thomas, P. Using patent citation analysis to target/value M&A candidates. Res. Technol. Manag. 2002, 45, 28–36. [Google Scholar]
  51. Andersen, T.F.; Madsen, M.; Jørgensen, J.; Mellemkjoer, L.; Olsen, J.H. The Danish National Hospital Register. A valuable source of data for modern health sciences. Dan. Med. Bull. 1999, 46, 263–268. [Google Scholar] [PubMed]
  52. Dubarić, E.; Giannoccaro, D.; Bengtsson, R.; Ackermann, T. Patent data as indicators of wind power technology development. World Pat. Inf. 2011, 33, 144–149. [Google Scholar] [CrossRef]
  53. Barberá-Tomás, D.; Jiménez-Sáez, F.; Castelló-Molina, I. Mapping the importance of the real world: The validity of connectivity analysis of patent citations networks. Res. Policy 2011, 40, 473–486. [Google Scholar] [CrossRef] [Green Version]
  54. Verspagen, B. Mapping technological trajectories as patent citation networks: A study on the history of fuel cell research. Adv. Complex Syst. 2007, 10, 93–115. [Google Scholar] [CrossRef]
  55. De Rassenfosse, G.; Dernis, H.; Guellec, D.; Picci, L.; de la Potterie, B.V.P. The worldwide count of priority patents: A new indicator of inventive activity. Res. Policy 2013, 42, 720–737. [Google Scholar] [CrossRef] [Green Version]
  56. Bekkers, R.; Bongard, R.; Nuvolari, A. Essential patents in industry standards: The case of UMTS. In Proceedings of the 6th International Conference on Standardization and Innovation in Information Technology (SIIT 2009), Frederiksborg, Denmark, 17–19 June 2009; pp. 8–10. [Google Scholar]
  57. Martinelli, A. An emerging paradigm or just another trajectory? Understanding the nature of technological changes using engineering heuristics in the telecommunications switching industry. Res. Policy 2012, 41, 414–429. [Google Scholar] [CrossRef] [Green Version]
  58. Haakonsson, S.J.; Kirkegaard, J.K. Configuration of technology networks in the wind turbine industry. A comparative study of technology management models in European and Chinese lead firms. Int. J. Technol. Manag. 2016, 70, 281–299. [Google Scholar] [CrossRef]
  59. Gereffi, G.; Humphrey, J.; Sturgeon, T. The governance of global value chains. Rev. Int. Political Econ. 2005, 12, 78–104. [Google Scholar] [CrossRef] [Green Version]
  60. Gereffi, G. The Organization of Buyer-Driven Global Commodity Chains: How US Retailers Shape Overseas Production Networks. In Commodity Chains and Global Capitalism; Gereffi, G., Korzeniewicz, M., Eds.; Greenwood Press: Westport, CT, USA, 1994. [Google Scholar]
  61. Lema, A.; Lema, R. Technology transfer in the clean development mechanism: Insights from wind power. Glob. Environ. Chang. 2013, 23, 301–313. [Google Scholar] [CrossRef] [Green Version]
  62. Binz, C.; Truffer, B.; Coenen, L. Why space matters in technological innovation systems—Mapping global knowledge dynamics of membrane bioreactor technology. Res. Policy 2014, 43, 138–155. [Google Scholar] [CrossRef]
  63. Bergek, A.; Jacobsson, S.; Carlsson, B.; Lindmark, S.; Rickne, A. Analyzing the functional dynamics of technological innovation systems: A scheme of analysis. Res. Policy 2008, 37, 407–429. [Google Scholar] [CrossRef] [Green Version]
  64. Hendry, C.; Harborne, P.; Brown, J. So what do innovating companies really get from publicly funded demonstration projects and trials? Innovation lessons from solar photovoltaics and wind. Energy Policy 2010, 38, 4507–4519. [Google Scholar] [CrossRef]
  65. Yin, R.K. Case Study Research: Design and Methods; Sage: Thousand Oaks, CA, USA, 2003; pp. 5–11. [Google Scholar]
  66. Global Wind Energy Council. Global Wind Statistics 2014; GWEC: Brussels, Belgium, 2015. [Google Scholar]
  67. Bourqui, R.; Auber, D.; Mary, P. How to draw clusteredweighted graphs using a multilevel force-directed graph drawing algorithm. In Proceedings of the 11th International Conference Information Visualization, Zurich, Switzerland, 4–6 July 2007; pp. 757–764. [Google Scholar]
  68. Eades, P.; McKay, B.D. An algorithm for generating subsets of fixed size with a strong minimal change property. Inf. Process. Lett. 1984, 19, 131–133. [Google Scholar] [CrossRef]
  69. Shibata, N.; Kajikawa, Y.; Sakata, I. Extracting the commercialization gap between science and technology—Case study of a solar cell. Technol. Forecast. Soc. Chang. 2010, 77, 1147–1155. [Google Scholar] [CrossRef]
  70. Kajikawa, Y.; Ohno, J.; Takeda, Y.; Matsushima, K.; Komiyama, H. Creating an academic landscape of sustainability science: An analysis of the citation network. Sustain. Sci. 2007, 2, 221. [Google Scholar] [CrossRef]
  71. Lee, K.; Lee, S. Patterns of technological innovation and evolution in the energy sector: A patent-based approach. Energy Policy 2013, 59, 415–432. [Google Scholar] [CrossRef]
  72. Hsieh, C.H. Patent value assessment and commercialization strategy. Technol. Forecast. Soc. Chang. 2013, 80, 307–319. [Google Scholar] [CrossRef]
  73. Park, H.; Kim, K.; Choi, S.; Yoon, J. A patent intelligence system for strategic technology planning. Expert Syst. Appl. 2013, 40, 2373–2390. [Google Scholar] [CrossRef]
  74. Karvonen, M.; Ka¨ssi, T. Patent citations as a tool for analysing the early stages of convergence. Technol. Forecast. Soc. Chang. 2013, 80, 1094–1107. [Google Scholar] [CrossRef]
  75. Freeman, L.C. Centered graphs and the structure of ego networks. Math. Soc. Sci. 1982, 3, 291–304. [Google Scholar] [CrossRef]
  76. Hakanson, L.; Nobel, R. Technology characteristics and reverse technology transfer. Manag. Int. Rev. 2000, 1, 29–48. [Google Scholar]
  77. Stock, G.N.; Tatikonda, M.V. A typology of project-level technology transfer processes. J. Oper. Manag. 2000, 18, 719–737. [Google Scholar] [CrossRef]
  78. Tsang, E.W. Choice of international technology transfer mode: A resource-based view. MIR Manag. Int. Rev. 1997, 37, 151–168. [Google Scholar]
  79. Minshall, T. A resource-based view of alliances: The case of the handheld computer industry. Int. J. Innov. Manag. 1999, 3, 159–183. [Google Scholar] [CrossRef]
  80. Chen, X.; Yuen, C.; Zhang, Z. Wireless energy and information transfer tradeoff for limited-feedback multiantenna systems with energy beamforming. IEEE Trans. Veh. Technol. 2014, 63, 407–412. [Google Scholar] [CrossRef]
  81. Frietsch, R.; Schmoch, U. Transnational patents and international markets. Scientometrics 2010, 82, 185–200. [Google Scholar] [CrossRef]
  82. Perrez, C.; Soete, L. Catching up in technology: Entry barriers and windows. In Technical Change and Economic Theory; Dosi, G., Nelson, R., Silverberg, G., Soete, L., Eds.; Pinter: London, UK, 1988; pp. 458–479. Available online: https://core.ac.uk/download/pdf/6786506.pdf (accessed on 28 May 2018).
  83. Lema, R.; Sagar, A.; Zhou, Y. Convergence or divergence? Wind power innovation paths in Europe and Asia. Sci. Public Policy 2015, 43, 400–413. [Google Scholar] [CrossRef]
  84. Lema, A.; Lema, R. Low-carbon innovation and technology transfer in latecomer countries: Insights from solar PV in the clean development mechanism. Technol. Forecast. Soc. Chang. 2016, 104, 223–236. [Google Scholar] [CrossRef]
  85. REN21. Global Status Report [Online]; Ren21: Paris, France, 2012. [Google Scholar]
  86. Urban, F.; Nordensvärd, J.; Zhou, Y. Key actors and their motives for wind energy innovation in China. Innov. Dev. 2012, 2, 111–130. [Google Scholar] [CrossRef]
  87. Zhao, Z.Y.; Hu, J.; Zuo, J. Performance of wind power industry development in China: A Diamond Model study. Renew. Energy 2009, 34, 2883–2891. [Google Scholar] [CrossRef]
Figure 1. Analytical framework for comparing the international knowledge flow of wind power and solar PV industry.
Sustainability 10 01883 g001
Figure 2. The wind power patent citation network clustering of different countries.
Sustainability 10 01883 g002aSustainability 10 01883 g002b
Figure 3. The solar PV patent citation network clustering of different countries.
Sustainability 10 01883 g003aSustainability 10 01883 g003b
Figure 4. Patent citation networks for wind power firms at different periods.
Sustainability 10 01883 g004aSustainability 10 01883 g004b
Figure 5. Patent citation networks for solar PV firms at different periods.
Sustainability 10 01883 g005aSustainability 10 01883 g005b
Figure 6. Inter-firm tacit knowledge flows of 10 Chinese wind power firms.
Sustainability 10 01883 g006
Figure 7. Inter-firm tacit knowledge flows of 13 Chinese solar PV firms.
Sustainability 10 01883 g007
Table 1. Sample of wind power and solar photovoltaic (PV) lead firms from China and other countries.
Wind Power Leading Firms Solar PV Leading Firms
Global Top 10 Leading Firms in 2015Important Firms with Strong Influence Relevant for InnovationGlobal Top 10 Leading Firms in 2015Important Firms with Strong Influence Relevant for Innovation
Firms from ChinaGoldwind, Guodian United Power, Envision, Mingyang,Shanghai Electric, Dongfang Electric, Sinovel, XEMC, CSIC Haizhuang, Zhejiang WindyTrina, Canadian Solar, Jinko, JA solar, Hanwha Qcells, GCL New Energy, Yingli, Suntech (SFCE), Renesola,Dongfang Risen, Changzhou Eging, Hareon, Saiwei LDK
Firms from other countriesVestas (DK), GE (US), Siemens (DE), Gamesa (ES), Enercon (DE), Senvion (DE)Nordex (DE), Vensys (DE), Aerodyn (DE), Suzlon (IN);First Solar (US)Sanyo (JP), Sharp (JP), Kyocera (JP), Sunpower (US), MEMC (US), Solarworld (DE) TATA (IN)
Table 2. Overview of the interviewees and their affiliations.
Sector and Number of InterviewsAffiliation of Interviewee
Wind power: 31 interviewsFirms including Goldwind (Beijing, China), Mingyang (Zhongshan, Guangdong, China), Sinovel (Beijing, China), Vestas China (Tianjin, China), Huaneng Corporation (Beijing, China), State Grid for North East China (Beijing, China) etc.
Business associations including the Global Wind Energy Association (GWEA), Chinese Renewable Energy Industries Association (CWEA), the Chinese Renewable Energy Industries Association, China National Renewable Energy Centre and the Beijing Energy Association etc.
Government agencies including National Development Reform Commission (NDRC), provincial Development Reform Commissions (DRC), Ministry of Environmental Protection (MEP), Ministry for Science and Technology (MOST), Ministry of Commerce (MOFCOM), Ministry of Finance (MOF), China Meteorological Administration etc.
Research institutes including Tsinghua University in Beijing, Tianjin University of Technology, Peking University, NDRC’s Energy Research Institute (ERI), Chinese Academy of Sciences (CAS), Chinese Academy of Social Sciences (CASS), Chinese Academy of Engineering, Wind Energy Technology Institute of Gansu State Grid etc.
NGOs including Greenpeace, the Natural Resources Defence Council NRDC, WWF, Asia Foundation, Greenovation Hub etc.
Solar PV: 27 interviewsFirms including Yingli Solar (Baoding, Hebei, China), Trina Solar (Changzhou, Jiangsu, China), JA Solar (Shanghai, China), Jinko Solar (Beijing, China), Hanergy (Beijing, China) etc.
Business associations including China National Renewable Energy Centre, Beijing Energy Association etc.
Government agencies including National Development Reform Commission (NDRC), provincial Development Reform Commissions (DRC), Ministry of Environmental Protection (MEP), Ministry for Science and Technology (MOST) etc.
Research institutes including Tsinghua University in Beijing, Tianjin University of Technology, Zhejiang University, Peking University, Hunan University, Shanghai University, Fudan University, NDRC’s Energy Research Institute (ERI), Chinese Academy of Sciences (CAS) etc.
NGOs including the Natural Resources Defence Council (NRDC), Greenovation Hub etc.
Table 3. Key indicators of wind power network at different periods.
Indicators1959–2006 Network2007–2015 NetworkFull Time Network
Density (including self-citation)0.31790.56250.5650
Density (excluding self-citation)0.30720.54210.5447
Average distance1.3161.5111.508
Distance-based cohesion0.3750.7620.764
Distance-weighted fragmentation0.6250.2380.236
Out-degree centrality30.020%20.239%19.665%
In-degree centrality14.915%16.037%15.835%
Table 4. Centrality indicators of the wind power lead firms at different periods.
FirmsIndicatorsBetweenness CentralityOut-DegreeIn-DegreeNet Citation
CentralityCentralityCounts
1959–2007–1959–2007–1959–2007–1959–2007–
20062015200620152006201520062015
GENERAL ELECTRIC4.04323.655292811296515−4296
VESTAS4.04320.266141572246619−105−47
SENVION1.5610.093118394243328−12566
ENERCON13.04324.468507372125242382130
SIEMENS14.7125.089214347258676−44−329
GAMESA0.14316.07236225133127−9798
NORDEX3.256.82684185112159−2826
AERODYN2.21018596381514781
GUODIAN UNITED POWER017.0210585105−5−47
MINGYANG04.873029674−6−45
GOLDWIND016.844027695−6−68
SINOVEL04.861027442−4−15
XEMC015.5240172832−28−15
SUZLON02.6170175556−55−39
CSIC HAIZHUANG04.478014519−5−5
SHANGHAI ELECTRIC-0.904-6-20-−14
ENVISION00.41161563−14−57
ZHEJIANG WINDEY-0-6-4-2
DONGFANG ELECTRIC0005120−1−15
VENSYS000124−2−3
Table 5. Key indicators of PV network at different periods.
Indicators1962–2006 Network2007–2015 NetworkFull Time Network
Density (including self-citation)0.16980.28570.3039
Density (excluding self-citation)0.16010.26900.2881
Average distance1.8071.6581.665
Distance-based cohesion0.3090.6330.667
Distance-weighted fragmentation0.6910.3670.333
Out-degree centrality12.421%10.792%10.691%
In-degree centrality7.830%6.998%6.875%
Table 6. Centrality indicators of the solar PV lead firms at different periods.
FirmsIndicatorsBetweenness CentralityOut-DegreeIn-DegreeNet Citation
CentralityCentralityCounts
1959–2007–1959–2007–1959–2007–1959–2007–
20062015200620152006201520062015
SHARP2915.383445259229128216131
SANYO9.3335.64331817230218616−14
KYOCERA1015.95223221324486−12127
SUNPOWER7.66720.879364770103−34−56
MEMC1514.1833162724−24−8
TRINA040.4741952362−2233
FIRST SOLAR387.1079172165−12−48
YINGLI060.0740349155−9−121
CSI SOLAR08.260391590−15−51
JA SOALR017.6790521149−113
SAIWEI LDK016.493-29-27-2
SUNTECH00.9170271417−1410
EGING03.617013117−1−4
HANWHA04.248084818−48−10
HAREON SOLAR-1.483-14-4-10
JINKO SOLAR01.1010628−6−18
GCL ENERGY-5.1-9-9-0
RENESOLA00.4-8-5-3
SOLARWORLD00.61714236−22−2
RISEN-0-4-0-4
TATA001930−29
Table 7. Knowledge flow modes of 10 Chinese wind power firms.
Chinese WP FirmsKnowledge Flow ModeKnowledge Flow StrengthForeign Firms
CSIC HaizhuangLicencestrongDeWind (Irvine, USA and Hamburg, Germany)
Joint developmentweakAerodyn Energiesysteme (Rendsburg, Germany)
GoldwindLicencestrongJacobs/REpower (now a part of Senvion, headquarters in Hamburg, Germany)
Joint venture/acquisitionstrongVensys (Neunkirchen/Wellesweiler, Germany)
Protocol weakRenewable Energy Systems Americas Inc. Rattlesnake wind project (Brady, TX, USA)
protocolweakShady Oaks (Compton, CA, USA)
protocolweakInfineon Technologies AG (Neubiberg, Germany)
protocolweakMainstream Renewable Power (Dublin, Ireland)
protocolweakAustralia local power grid firm
protocolweakEmpresa Eléctrica del Ecuador (Guayaquil, Ecuador)
protocolweakAdama wind project (Ethiopia)
protocolweakEGCO—Subsidiary of Thailand’s national grid (Bangkok, Thailand)
Guodian United powerLicencestrongAerodyn Energiesysteme (Rendsburg, Germany)
MingyangJoint developmentweakAerodyn Energiesysteme (Rendsburg, Germany)
Acquisitionstrong Global Wind Power Ltd. (Mumbai, Maharashtra, India)
SinovelLicencestrongFuhrländer (formerly Liebenscheid, Germany, now bancrupt)
Zhejiang WindeyLicencestrongREpower (now a part of Senvion, headquarters in Hamburg, Germany)
Shanghai ElectricJoint venture/acquisitionstrongAnsaldoEnergia (Genoa, Italy)
Envision Energy Joint developmentweakParStream (now part of Cisco, San Jose, CA, USA)
AcquisitionstrongBazeField (Porsgrunn, Norway)
XEMCAcquisitionstrongDarwind (Hilversum, The Netherlands)
Table 8. Knowledge flow modes of 13 Chinese solar PV firms.
Chinese PV FirmsKnowledge Flow ModeKnowledge Flow Strength Foreign Firms
TrinaAcquisitionstrongSolland Solar (Heerlen, The Netherlands)
YingliProtocolweakDupont (Wilmington, DE, USA)
ProtocolweakBorrego Solar (San Diego, CA, USA)
Joint developmentweakInnovalight (Sunnyvale, CA, USA)
CSI SolarAcquisitionstrongRecurren Energy (San Francisco, CA, USA)
Jinko SolarProtocolweakYgrene (Petaluma, CA, USA)
ProtocolweakVivint Solar (Lehi, UT, USA)
ProtocolweakLumos Solar (Boulder, CO, USA)
ProtocolweakAcciona (Alcobendas, Spain)
JA Solar AcquisitionstrongSilver Age Holdings (British Virgin Islands)
RenesolaProtocolweakSolairedirect SA (Paris, France)
HanwhaAcquisitionstrongQ-Cells (Thalheim, Germany)
Dongfang RisenProtocolweakMytrah Energy India (Hyderabad, India)
ProtocolweakChemtech Solar (Cologno al Serio, Italy)
GCL New Energy AcquisitionstrongSunEdison (Maryland Heights, MO, USA)
AcquisitionstrongOne Stop Warehouse (Berrinba, Australia)
AcquisitionstrongSterling and Wilson (Mumbai, India)
AcquisitionstrongJakson (Noida, India)
ProtocolweakNorth Carolina Eastern Municipal Power Agency (Raleigh, NC, USA)
Suntech (SFCE Energy)AcquisitionstrongPowin Energy (Tualatin, OR, USA)
AcquisitionstrongMSK (Tokyo, Japan)
Hareon SolarAcquisitionstrongBrilliant Harvest 003 Limited (Shepton Mallet, UK)
AcquisitionstrongGreenvision Ambiente Photo Solar S.r.l. (GAPS) (Roncocesi, Italy)
AcquisitionstrongForshine (Hong Kong, China)
Saiwei LDKAcquisitionstrongSunways (Shenzhen, China)
AcquisitionstrongSolarPower (Roseville, CA, USA)
Table 9. Comprehensive comparison between wind power and solar PV sectors.
DimensionsIndicatorsWind Power (1959–2015)Solar PV (1962–2015)
Industrial Contexts1. technology complexitycomplex production systemsmass produce goods
2. technological lifecyclesfast-development stagefast-development stage
3. China’s market sharegobal No. 1gobal No. 1
4. technology trajectorygearbased DFIT/SFIT; gearless DDsingle/polycrystalline silicon modules; thin-film modules
Inter-country knowledge flow-based clusters1. The technical distribution of industrystrong convergencegreat divergence
2. Technical focus of Chinaapplied technologies and applicationshold some core technologies inherent for the manufacturing
3. Technical focus of other countriesCountries like DK, DE and US cover a wider spectrum of technologies and applications JP cover a wider range of technologies and applications, the US is more clustered in specific areas.
Inter-firm explicit knowledge flow1. Network position peripherycore
2. Network roleknowledge consumersa certain knowledge spillovers
3. Future competition rolesknowledge learnerstechnology innovators and global leaders
Inter-firm tacit knowledge flow1. Scope of tacit knowledge flowa high degree of product-specific tacit knowledgeprocess-related knowledge and comparatively lower scope of tacit knowledge
2. Types of global countries that interactionsdeveloping countriesdeveloped countries
3. Knowledge collaboration mechanismsmainly in joint development/protocol and licensesmainly in acquisition and movement of personnel

